

Low-income and minority neighbourhoods often have access to fewer supermarkets( Reference Sallis and Glanz 1 – Reference Zenk, Schulz and Israel 4 ), which is associated with lower intake of fruits and vegetables among African Americans( Reference Sallis and Glanz 1 , Reference Morland, Wing and Diez Roux 3 ) and individuals reliant on food assistance programmes( Reference Rose and Richards 5 ). Additionally, research suggests that residents of African-American neighbourhoods with fewer grocery stores consume greater amounts of dietary fat( Reference Morland, Wing and Diez Roux 3 ).
Conversely, individuals surrounded by a greater concentration of supermarkets perceive better access to fruits and vegetables( Reference Liese, Bell and Barnes 6 ), which has been associated with increased consumption of these foods( Reference Blitstein, Snider and Evans 7 ). These findings align with the socio-ecological model of eating habits, which posits that access to and availability of food stores in a neighbourhood influences a person’s eating behaviour, including where individuals shop for food( Reference Story, Kaphingst and Robinson-O’Brien 8 , Reference Blanck and Kim 9 ). Additionally, Lytle( Reference Lytle 2 ) suggests that eating behaviours of individuals in neighbourhoods with limited availability of supermarkets are more influenced by the built environment compared with individual factors, such as nutrition knowledge. Thus, it is important to understand the availability of healthy food items in low-income and minority communities.
Food availability can be distinguished as consumer and community nutrition environments. The consumer nutrition environment describes the availability, price and quality of food inside a food store( Reference Glanz, Sallis and Saelens 10 ). The Nutrition Environment Measures Survey in Stores (NEMS-S) is frequently used for this assessment, as it is the only food store audit tool that demonstrates validity in addition to reliability( Reference McKinnon, Reedy and Morrissette 11 ). It captures a wide range of food items sold in stores and uses a ranked score based on survey data to assess the health value of a store. In contrast, the community nutrition environment describes the number and type of stores (i.e. grocery stores or convenience stores) available in a certain area( Reference Glanz, Sallis and Saelens 10 ) and is often measured with a geographic information system (GIS).
Some studies have combined these methodologies to study both the consumer and community nutrition environments( Reference Zenk, Schulz and Israel 4 , Reference Frank, Glanz and McCarron 12 ). Frank et al. ( Reference Frank, Glanz and McCarron 12 ), for example, measured the relationship between the health quality of stores using the NEMS-S tool, the proximity to schools using GIS and neighbourhood income. These researchers used a 1 mile (1·6 km) Euclidean buffer to measure proximity and found that food quality varied by income. Charriere et al. ( Reference Charreire, Casey and Salze 13 ), however, suggested that a kernel density estimation may be a better analysis method because it estimates the density of referenced points, rather than the proximity. Although some studies have used kernel density analysis (KDA) to examine healthy food access, most of these focus on the availability of fruits and vegetables, and do not consider other healthy items( Reference Caspi, Sorensen and Subramanian 14 ). Further, other studies have used KDA to estimate the density of individual incidents, such as grocery stores or homicides per square mile (2·59 km2)( Reference Bader, Purciel and Yousefzadeh 15 – Reference Robinson, Carnes and Oreskovic 17 ), but have not used the weighting function to determine densities based on specific characteristics of locational variables, such as a NEMS-S score. Given that activity spaces are experienced in ways far more complex than the idea of the ‘nearest’ grocery store or healthy food source (discussed in Matthews and Yang as spatial polygamy)( Reference Matthews and Yang 18 ), it is necessary to add depth to inquiries of food access. Thus, as recommended in Kestens et al.( Reference Kestens, Lebel and Chaix 19 ), we incorporate KDA of food store scores derived from NEMS-S to better understand the distribution of healthy foods, and not just healthy food sources. Such information is important for local authorities interested in using fine-grained spatial data to target healthy eating interventions.
The primary goal of the present study was to use a methodology that accurately and reliably describes the availability, price and quality of healthy foods using the NEMS-S to propose a spatial methodology for integrating these store and community data into measures for defining objective food access. Building on work concerning the community nutrition environment, we have also developed spatial analysis metrics to measure neighbourhood-level food availability scores. Such metrics included a KDA of food store scores as well as the number of supermarkets and average store scores within variable network distance thresholds (0·5, 1 and 2 miles (0·8, 1·6 and 3·2 km)), all to account for NEMS-S scores in geographic space. To our knowledge, no study has examined the community nutrition environment using KDA in combination with the NEMS-S, and few have meaningfully incorporated objective measures of the consumer nutrition environment using spatial analysis. The secondary goal was to connect the consumer nutrition environment via the NEMS-S food store score to the sociodemographic characteristics of neighbourhoods (i.e. income and racial composition). Ours is also the first study to combine NEMS-S scores with GIS to ascertain neighbourhood-level variations in healthy food access.
Methods
Study design
We conducted a comprehensive survey of all food stores in Flint, Michigan, USA and the surrounding area (<2 miles (<3·2 km) of the city limits) during September 2016. Grocery stores, convenience stores, gas stations, dollar stores, drug stores, liquor stores, farmers’ markets and other specialty stores in Flint and its surrounding area were identified using the 2016 food store database from Michigan Department of Agriculture and Rural Development( 20 ). The definitions of these categories were based on those from the US Census Bureau( 21 ) (see the online supplementary material, Supplemental File 1); the specific category of each store was confirmed during in-person visits to conduct the survey. Store addresses were validated by examining Google Street View imagery. If Street View dates were older than 2015, the stores were called to verify their existence and correct address. In total, 326 food stores were identified. Of these, 265 were surveyed by five trained individuals. The reasons stores were not surveyed include: owners/managers refused (n 29), multiple stores were listed at the same site (e.g. farmers’ market, n 23), the store was closed (n 5) and the store was not a food store (n 4). No significant differences existed between refused and surveyed stores with respect to neighbourhood (e.g. race, socio-economic status) or store (e.g. type) characteristics.
Measurement
The Flint Food Store Survey (FFSS; available to readers upon request, to be shared via a public website following publication) was used to assess the availability, quality and price of healthy foods in each food store. The FFSS was adapted from the NEMS-S, a previously validated survey developed by Glanz et al. ( Reference Glanz, Sallis and Saelens 10 ) and employed elsewhere( Reference Hill and Naar-King 22 – Reference Krukowski, Smith and Harvey-Berino 24 ). The NEMS-S has been validated to assess food availability in grocery stores, supermarkets, convenience stores, gas stations( Reference Glanz, Sallis and Saelens 10 ), drug stores and dollar stores( Reference Partington, Menzies and Colburn 25 ). To fully assess food availability in Flint, we also included liquor stores; in Michigan, liquor stores are generally just convenience stores that also sell alcohol. For each store, a food store score was created based on the availability, quality and price of fruits, vegetables, dairy, whole grains and lean meats; these scores were then used to rank the health value of the store (healthy or unhealthy).
Additional food items from the original NEMS-S were included for several reasons. First, we assessed the availability of other healthy items not in the original NEMS-S but included in an unpublished food store survey conducted in Flint in 2012, including peanut butter, eggs, and frozen fruits and vegetables. Furthermore, given Flint’s recent challenges with Pb exposure through the water system, Pb-mitigating items such as those high in Ca, vitamin C and Fe( Reference Schnur and John 26 ) were also included in the current survey. For Ca, we added cheese, yoghurt, spinach, kale, soya milk, canned salmon and sardines. For Fe, we added beans and lentils. For vitamin C, we added kiwi, pineapple and potatoes( 27 ).
Added sections
Sections from other NEMS-S surveys were added to include these Pb-mitigating items as well as other healthy food items not found in the original NEMS-S, such as grains and chicken. Sections on cheese, frozen vegetables, chicken, meat alternatives and grains were added from a survey developed by the Rudd Center( Reference Andreyeva, Blumenthal and Schwartz 28 ), and a frozen fruit section was also added from a New Mexico survey( 29 ). Additionally, bottled water was added to the beverage section as it was in the Rudd Center’s survey( Reference Andreyeva, Blumenthal and Schwartz 28 ).
A yoghurt section was developed specifically for the current survey. Healthy yoghurts were defined as yoghurts with low sugar, defined as ≤15 g of sugar per serving for Greek yoghurts and ≤22 g of sugar per serving for non-Greek yoghurts. These cut-offs were established by selecting the lowest amount of sugar found naturally in plain fat-free and low-fat Greek yoghurt (5 g of sugar per container) and non-Greek yoghurt (12 g of sugar per container) according to the US Department of Agriculture’s Food Composition Database, and adding 10 g of sugar to this amount, which is one-fifth the 2015 nutritional guidelines for added sugar( 30 ).
Scoring
The food scoring is broken up into four major diet categories: (i) dairy; (ii) fruits and vegetables; (iii) lean proteins; and (iv) grains. The proportion of points allotted to the score parallels the group’s proportion in the human diet (breakdown shown in the online supplementary material, Supplemental File 2). The scoring was based on the NEMS-S scoring protocol( Reference Glanz, Sallis and Saelens 10 ) and modified to accommodate special concerns in Flint around Pb-mitigating foods (shown in Table 1). Generalizability can be maintained by simply removing the ‘Pb-mitigating foods’ category from the score.
Flint Food Store Survey scoring

* Lean ground beef, ≤10 % fat; regular ground beef, >10 % fat.
† The prices should be based on the cost per box/bag, not by ounces.
Statistical analysis
To establish a methodology for measuring location-specific ‘exposure’ to healthy foods, we created three spatial metrics including average score, numbers of stores above certain score thresholds and a KDA of all food store scores in the area. Prior to surveying, each food store was geocoded to its exact point location using an address locator designed for Flint and Genesee County, Michigan, in ArcGIS 10.3 (Environmental Systems Research Institute, Redlands, CA, USA). This mapping guided the efficient collection of data from spatially proximate food stores and formed the foundation of the spatial analyses.
Subsequently, food store scores were appended to each store. Individual address-level analysis was run for the average score of all stores and the total number of stores with a score >70 within 0·5 miles (0·8 km), 1 mile (1·6 km) and 2 miles (3·2 km; 70 was chosen as a cut-off point because this included all major grocery store chains conventionally referred to as ‘supermarkets’ and offered a natural break in the data. We did this rather than utilizing NAICS (North American Industry Classification System) codes or local health department classifications to account for the error inherent in those designations). This provided every point in the city (and thus every residence) with multiple estimates of the neighbourhood-level healthy nutrition environment. As well, KDA was run independent of individual addresses. The result of the KDA is a rasterized (or pixelated) surface with predicted values for any region based on weighting points by some defined value( Reference Sadler, Clark and Gilliland 31 ). In this application, stores were weighted according to their healthy food score and a ‘healthy food hot spot’ map (using food store scores within 1 mile (1·6 km) of any given pixel) was generated to highlight areas with more access or less access to healthy food options. From this, local KDA scores can be derived for any point in the city.
Additionally, maps of food store scores in relation to socio-economic and racial variables were also created using ArcGIS. Each food store was given the characteristics of the census block group (referred to as ‘neighbourhoods’ throughout the present paper) in which it resided; these characteristics included socio-economic and racial variables from the 2015 American Community Survey. Additional variables are likewise available from the census, and can be used in analyses as needed. Here we conceptualize neighbourhoods only for this purpose; results are not constrained to neighbourhoods as they would with container-based approaches to measuring food access.
Student t tests and χ 2 analyses were used to compare means between neighbourhoods with higher (>60 %) and lower (≤60 %) concentrations of African Americans as well as higher and lower socio-economic distress (SED). SED represented an unweighted composite score of variables representing single-parent households, unemployment, poverty and low educational attainment in the census block group. The scoring for SED in the Flint region ranges approximately from −7 to 7, where 7 indicates extremely high distress( Reference Sadler, Gilliland and Arku 32 ). For the current analysis, low/average SED included any score <0·5 and high distress included any score >0·5. Student t tests were used to compare means of food store scores and sub-scores (including dairy, meat, fruit and vegetable sub-scores, and the total number of fruits and vegetables), and χ 2 analyses were used to compare mean differences in the percentage of liquor stores, grocery stores, supermarkets, stores with a score of 0 and stores with a score of >70 among these race and SED categories. To see if race influenced these relationships with SED and vice versa, multiple linear regressions of store scores and sub-scores and logistic regressions of liquor stores, grocery stores, supermarkets, stores with 0 score and stores with >70 score were run with both race and SED as independent variables. A priori significance for all analyses was set at P<0·05. The statistical software package Stata Special Edition 14 was used for all analyses.
Results
Tables 2 and 3 highlight results based on our analysis of food store scores relative to race and SED in Flint, respectively. Table 2 demonstrates that neighbourhoods with a higher concentration of African Americans had a significantly lower total score (P=0·049), dairy sub-score (P=0·01) and fruit sub-score (P=0·01), as well as lower percentage of supermarkets (P=0·049), compared with those with fewer African Americans. The percentage of liquor stores in predominantly African-American neighbourhoods was significantly greater than in those with fewer African Americans (P=0·01). No significant differences were seen in meat sub-score, vegetable sub-score, number of fruits and vegetables, percentage of grocery stores, percentage of stores with a score of 0 and percentage of stores with a score of >70 (all P>0·05).
Store characteristics by neighbourhood racial composition, Flint, Michigan, USA, September 2016

AA, African American.
Store scores/sub-scores and percentage of stores out of the total number of stores in each respective column are represented here.
*P<0·05.
Store characteristics by neighbourhood socio-economic composition, Flint, Michigan, USA, September 2016

SED, socio-economic distress.
Store scores/sub-scores and percentage of stores out of the total number of stores in each respective column are represented here.
*P<0·05.
Results of scores by SED, presented in Table 3, demonstrate that neighbourhoods of high, very high and extremely high SED had a significantly lower total score (P=0·049), dairy sub-score (P=0·001) and percentage of supermarkets (P=0·01) compared with neighbourhoods with low and average SED. The percentage of liquor stores was also significantly greater in high-distress neighbourhoods compared with lower- or average-distress neighbourhoods (P=0·02). No significant differences were seen in meat sub-score, fruit sub-score, vegetable sub-score, number of fruits and vegetables, percentage of grocery stores, percentage of stores with a score of 0 or percentage of stores with a score of >70 (all P>0·05).
The results of our regression models with both race and SED as predictors are presented in Tables 4 and 5, respectively. Regarding food store scores (seen in Table 4), only the dairy sub-score remained significantly different between high- and low-SED neighbourhoods with race as a covariate (P=0·04). Total food store score, meat sub-score, fruit and vegetable sub-scores, and the number of fruits and vegetables were not significantly different (all P>0·05). Table 5 demonstrates that the odds of a store being a supermarket was perfectly predicted by neighbourhoods with fewer African Americans and SED (OR=1·0). The odds of a store being a liquor store, grocery store, store with a score of 0 or store with a score of >70 was not significantly related to neighbourhood race or SED.
Multiple linear regression of store scores and sub-scores in relation to neighbourhood-level race and socio-economic composition, Flint, Michigan, USA, September 2016

SED, socio-economic distress.
*P<0·05.
Logistic regression results of liquor stores, supermarkets, grocery stores, stores with score of 0 and stores with score of >70 by neighbourhood-level race and socio-economic composition, Flint, Michigan, USA, September 2016

SED, socio-economic distress.
*P < 0·05.
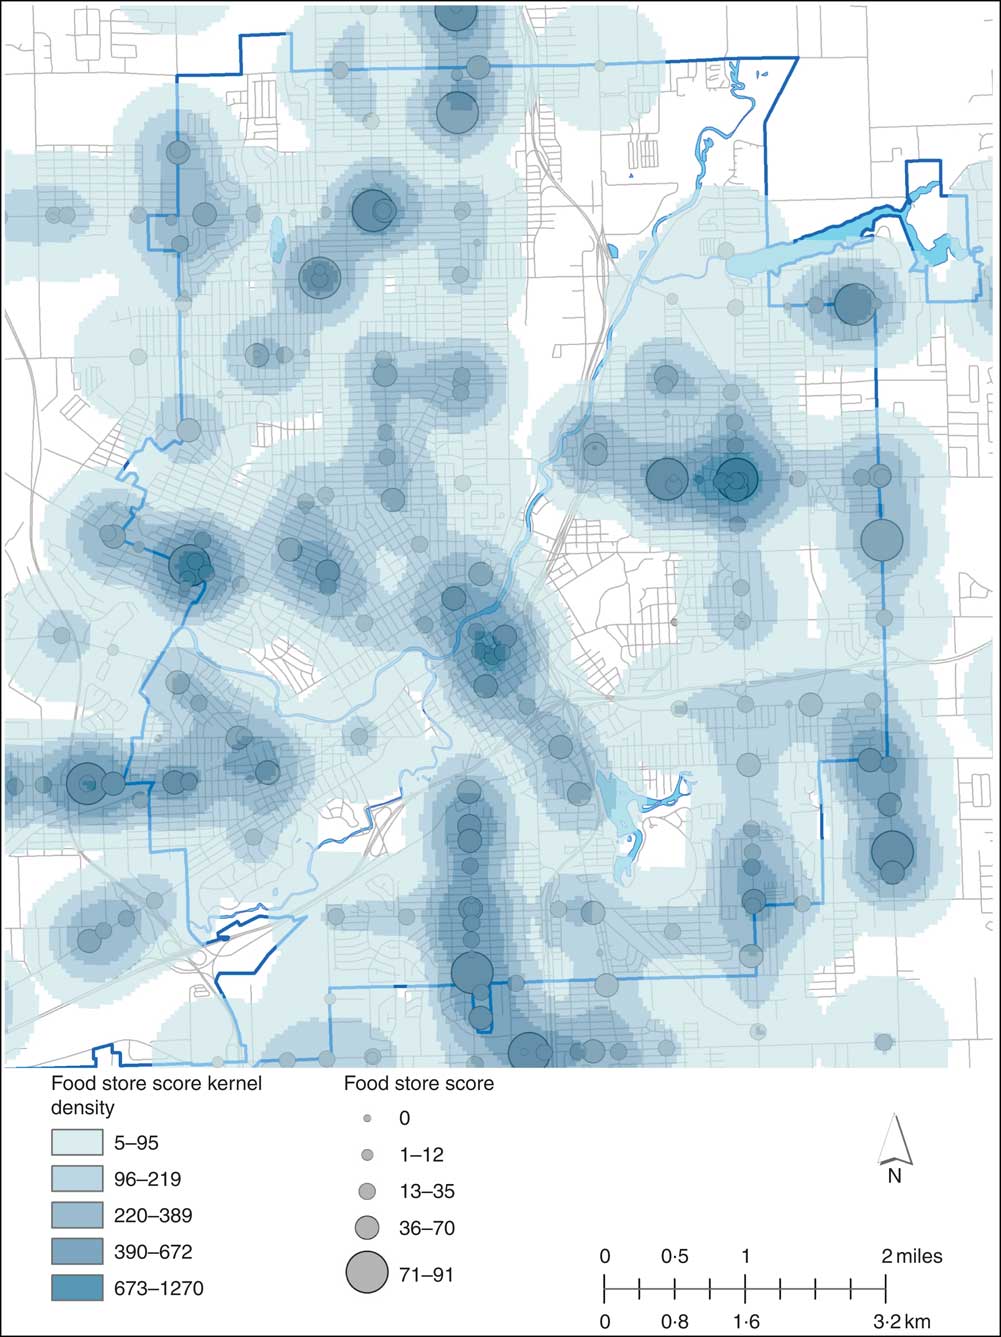
The results of our KDA (in Fig. 1) reveal key areas throughout the city with scores of 0, suggesting that there are no stores within 1 mile (1·6 km) of these places that sell healthy foods. Additional areas in light shading suggest very few healthy food items may be found in these locations. Of note are two sizeable areas with 0 scores. One area immediately east of the centre of the city coincides with a relatively low-distress neighbourhood, while the other in the far north-east coincides with a neighbourhood of very high distress. Looking at the remainder of the map, clusters of high scores are seen in bands running to the south, near north-east and south-west of the city (these are places where the presence of multiple grocery stores and convenience stores generates high cumulative scores, suggesting places where people would have a decent variety of healthy food options).
(colour online) Kernel density analysis of food store scores, Flint, Michigan, USA, September 2016
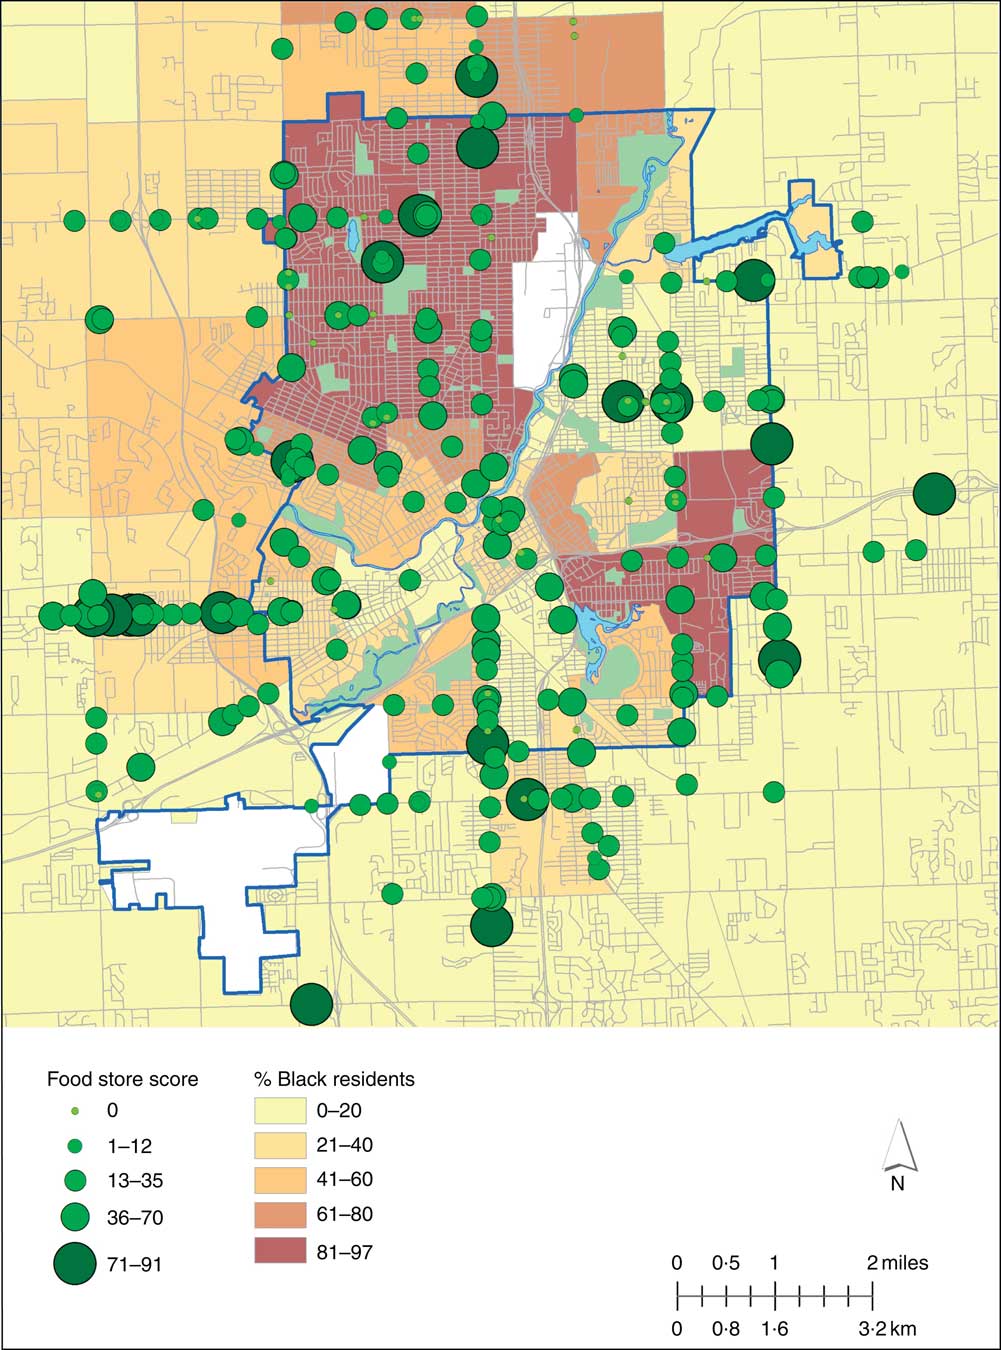
Figures 2 and 3 represent food store scores in relation to racial and socio-economic composition, respectively. These are particularly important in contextualizing the KDA discussed above. In Fig. 2, neighbourhoods with higher proportions of African Americans tend to cluster in the north-west and south-east of Flint. Suburbs to the north and west of Flint also tend to have higher proportions of African Americans, while they are virtually absent from suburbs in the east and south. A few stores in north-west Flint do have high scores, but in addition, many stores in this neighbourhood have very low scores. The high scores outside the city represent major chain grocery stores, while high scores in the city almost exclusively represent independent stores that tend to have higher prices.
(colour online) Food store scores and racial composition, Flint, Michigan, USA, September 2016
(colour online) Food store scores and socio-economic distress, Flint, Michigan, USA, September 2016

Figure 3 illustrates the relationship between SED and food store scores. A band of high-distress neighbourhoods runs from the north-east of the city down towards the centre and thence out towards the south-east of the city. Particularly notable here is that the concentrated high-distress neighbourhood runs east of the four major stores in the north-west of Flint, highlighting the gap in healthy food access in high-distress neighbourhoods. Also notable is the fact that nearly all the suburban stores outside the city limits are in areas with low distress.
Discussion
The primary goal of the present study was to develop a methodology that accurately and reliably describes the availability, price and quality of healthy foods at both the store level and the community level in Flint, Michigan, USA, using the NEMS-S. This new methodology combined spatial analysis metrics (i.e. KDA) to measure neighbourhood-level food availability using consumer-level variables (NEMS-S scores). This methodology also visualizes how other neighbourhood-level variables, such as income and racial composition, relate to food store scores. The current analyses revealed dairy sub-scores were significantly lower in high-SED neighbourhoods compared with low-SED neighbourhoods. Additionally, predominantly African-American and high-SED neighbourhoods had a lower percentage of supermarkets compared with their neighbourhood counterparts. By combining GIS methodology with NEMS-S scores, the current study presents new methodology connecting neighbourhood-level and individual-level nutrition environments that can be used to inform local efforts to improve healthy food availability and can be replicated in other cities to provide comparable results.
Similar to previous research, predominantly African-American neighbourhoods had no supermarkets available( Reference Morland and Filomena 33 , Reference Block and Kouba 34 ). Research suggests that lower supermarket availability is associated with a lower intake of fruits and vegetables( Reference Sallis and Glanz 1 ) and greater consumption of dietary fats( Reference Morland, Wing and Diez Roux 3 ). Morland et al.( Reference Morland, Wing and Diez Roux 3 ) compared individual eating patterns measured by an FFQ with their census-level supermarket availability. The current study provides further insight into overall healthy food availability using the NEMS-S tool in all food stores, including supermarkets. In congruence with Morland et al.( Reference Morland, Wing and Diez Roux 3 ), the present study found that African-American and low-income areas had fewer supermarkets, indicating that overall less healthy foods were available. Additionally, the dairy sub-score was significantly lower in high-SED neighbourhoods compared with low-SED neighbourhoods. One possible reason for lower NEMS-S scores is a greater concentration of liquor stores in African-American and high-SED neighbourhoods, a finding similar to previous research( Reference Romley, Cohen and Ringel 35 – Reference Pollack, Cubbin and Ahn 38 ). Although some liquor stores had a small selection of healthy foods (such as 2 % or whole milk), the abundance of unhealthy foods at liquor stores, in addition to the empty energy of alcohol itself, are causes for concern in building healthy nutrition environments. Such stores have potential to become sites of small-scale healthy food access, and the data gathered here can help local authorities in their work to reduce alcohol outlet density and increase the offer of healthy foods.
In the context of Flint’s ongoing concerns with Pb in water and other environmental sources( Reference Hanna-Attisha, LaChance and Sadler 39 , Reference Laidlaw, Filippelli and Sadler 40 ) and pushes to increase consumption of Pb-mitigating foods high in vitamin C, Fe and Ca, Fig. 1 highlights how well neighbourhoods are equipped to address healthy eating concerns. Figure 1 reveals that a neighbourhood in the north has a food store score of 0, indicating a lack of healthy foods. This northern neighbourhood is also an area where paediatric blood Pb levels were high at the height of the Flint water crisis( Reference Hanna-Attisha, LaChance and Sadler 39 ). It is concerning that this neighbourhood is also has high SED (as seen in Fig. 3) because it has lower availability of dairy products, which is an important source of Ca, compared with low-SED neighbourhoods, even when controlling for race. In combining our findings, we can now identify these neighbourhoods as not only the poorest and most Pb-exposed, but also among the poorest served in terms of healthy foods, particularly Pb-mitigating foods. The other area immediately east of the city’s centre with a 0 score according to Fig. 1 is of less concern because Fig. 3 demonstrates that this area has low SED, suggesting that residents are likely more able to travel to stores with healthier foods.
These maps have broad utility for future work on healthful eating interventions, not only in Flint but anywhere this method is replicated. For instance, research attempting to derive healthful eating indices can use Fig. 1 to determine not only how many food stores are within a given distance of a home, workplace or daily activity space( Reference Sadler and Gilliland 41 ), but also the average healthy food index score, the maximum and minimum store scores, and the distribution of scores. Additionally, these statistics can also be stratified by neighbourhood socio-economic characteristics to determine inequalities in levels of access (Figs 2 and 3).
The present study has many advantages, including the combined use of GIS and NEMS-S to provide a comprehensive picture of a food environment and the use of a valid tool to assess the consumer nutrition environment. We do, however, acknowledge limitations in our current study. First, our novel spatial metrics have not been used widely, so their applicability and transferability require further study. Relatedly, although we did not observe spatial patterns in food store scores, we did not test for spatial autocorrelation. Third, we did not run formal inter-rater reliability tests on the food store surveys because each store was visited only once, and survey data were collected as a team of two or three individuals to economize on time and ensure data collector safety. Nevertheless, the original NEMS-S demonstrated high inter-rater reliability (>90 % agreement)( Reference Glanz, Sallis and Saelens 10 ) and the data collectors in our survey were trained by the same certified NEMS-S rater. Finally, we also acknowledge that the ways people make use of nutrition environments are highly variable and, thus, these data only provide a template on which to define individual nutrition environments. Future inquiries will ideally connect validated measures of individual consumption (such as 24 h dietary recalls and food diaries) to determine the influence of the nutrition environment on behaviour.
The present paper is important in light of numerous ongoing efforts to address gaps in healthy foods in the Flint community. Thus, we have already made store-level data available to stakeholders aiming to deploy retail-based interventions. One such effort now known as the Flint Fresh Mobile Market grew out of a participatory mapping exercise to determine potentially feasible sites for a healthy food retail intervention( Reference Sadler 42 ). Ongoing efforts by Michigan State University Extension on its ‘Refresh MI Corner Store’ initiative are geared towards using both the data in the present paper and in past work( Reference Sadler 42 ) to target healthy corner store interventions in stores that currently provide few healthy foods but are amenable to increasing their offer of such foods. The initial work confirms reasons why smaller stores are unable to stock healthy foods, including minimum order sizes, a lack of capacity, and higher wholesale prices by companies that work with these stores. Data like ours will aid in this effort by identifying spatial gaps in the nutrition environment. Lastly, while larger-scale grocery stores are often the best option for healthy foods (given the composition of our current food retailing system), they are not always the most feasible, particularly in our study area. Yet because of the central importance of larger stores that can meet better price points, the Flint & Genesee Chamber of Commerce has investigated the possibility of new traditional food retail. The Chamber is currently working with two non-profit organizations to plan and finance the development of two new stores in neighbourhoods currently underserved by the existing food retailing system.
The current study also has relevance to the academic literature on nutrition environments. Past studies have been limited in either using validated surveys without GIS or using simplistic spatial measures of the nutrition environment based only on proximity to certain store types. Our study is the first to combine scores from a validated food store survey (the NEMS-S) for an entire region with higher-level GIS analysis to derive nutrition environment scores. Future research on Flint will benefit from having individual-level neighbourhood food store scores – such scores can serve as covariates in analyses examining the effectiveness of food-based interventions. Likewise, others may replicate these methods to provide better estimates of the nutrition environment in other locales.
In the same way, when we combined these geocoded store scores to their neighbourhood-level racial and socio-economic characteristics, we offered a pathway for linking individuals to their nutrition environment. As noted, geocoding a resident to his/her home location affords the opportunity to determine the availability, density or average score of stores within a certain distance of home (as we have done here). These NEMS-S assessment data, however, can then be combined with additional health data which could include clinical outcomes related to diet, obesity, diabetes or heart disease. Making this link would allow future researchers to ascertain whether a relationship existed between the objectively measured community-level food environment and health behaviours and outcomes.
The scores derived here can also be combined with activity space metrics that describe all of the places an individual travels beyond his/her home address( Reference Sadler, Clark and Wilk 43 ) to generate food store score-weighted activity spaces (in contrast to previous estimates, which considered only food store type). As new work has increased our understanding of multiple pathways of exposure to built environmental features like healthy foods( Reference Matthews and Yang 18 , Reference Hurvitz and Moudon 44 ), we can extend this work by geocoding residents at multiple points in space to derive not only home-based nutrition environment metrics, but also activity space-based metrics that incorporate more of their daily lives.
Conclusions
Ultimately, we have provided a methodological basis for measuring the nutrition environment with a spatial lens, as well as further evidence of the inequity in availability of healthy foods by race and socio-economic status. Earlier food access studies have been limited by uncritical conceptions of either in-store or neighbourhood-level food access. By combining these tools together, we offer the first glimpse into the possibilities for GIS-based NEMS-S food access inquiries. Researchers in other locales may use this methodology to derive more detail about food access in their communities; with this future work, we will then be able to compare and determine the generalizability of our and future findings. Such work furthers our understanding not only of the problem of healthy food availability, but of meaningful ways we can intervene in the nutrition environment to address imbalances.
Acknowledgements
Acknowledgements: The authors would like to thank Dr Laura Carravallah and other supporting colleagues at the University of Michigan and Michigan State University College of Human Medicine, as well as the University of Pennsylvania NEMS Training staff who helped develop and implement the tool. Financial support: This study was financially supported by Michigan State University Extension Supplemental Nutrition Assistance Program Education (SNAP-Ed). The funder had no role in the design, analysis or writing of this article. Conflict of interest: There are no conflicts of interest to report. Authorship: E.R.S. was leader in the formulation of research questions; designed and provided training for the survey; ran statistical analyses; and drafted the manuscript. R.C.S. assisted with developing research questions and design/implementation of the survey; ran the GIS analyses; and assisted with writing the manuscript. A.B.H. assisted with the design of the survey and assisted in development of and revisions on the article. K.B., M.R., J.C.-S., J.L. and T.S. implemented the survey and assisted in development of and revisions on the article. A.D.J. assisted with survey development the survey and revised the article. Ethics of human subject participation: This project was determined non-human subjects by the Michigan State University Institutional Review Board.
Supplementary material
To view supplementary material for this article, please visit https://doi.org/10.1017/S1368980017003950


