


Introduction
We have yet to know the ultimate global impact of the novel coronavirus pandemic. However, we do know that delays, denials and misinformation about COVID-19 have exacerbated its spread and slowed pandemic response, particularly in the U.S. (e.g., Abutaleb et al., Reference Abutaleb, Dawsey, Nakashima and Miller2020).
While the role that misinformation played in slowing the federal government's response to COVID-19 is well-understood, less is known about why Americans might accept misinformation about the virus and how misinformation might affect trust in public health experts.
Polling from the early stages of the pandemic suggests that many Americans are misinformed about COVID-19. In early March 2020, a poll conducted by YouGov and The Economist found that 13 per cent of Americans believed the coronavirus was a hoax, 49 per cent believed the coronavirus was manmade, and 44 per cent believed the threat of the coronavirus was being exaggerated for political reasons (Economist, 2020). However, while COVID-19 misinformation is prevalent, it is not necessarily bipartisan. A March 1 Civiqs poll found 68 per cent of Democrats were moderately or extremely concerned about COVID-19, but only 21 per cent of Republicans expressed moderate or extreme concern (Badger and Quealy, Reference Badger and Quealy2020). Another Quinnipiac University poll released early in March found that roughly 6 in 10 Republican voters were not especially concerned that the coronavirus would disrupt their lives (Quinnipiac University/Poll, 2020; Russonello, Reference Russonello2020a). Further, there have been considerable partisan gaps with respect to how people were behaviorally responding to the crisis, for example, washing their hands, working from home, or changing their travel plans (Stecula, Reference Stecuła2020).
We expect that variation in media coverage of the pandemic in its early stages may help explain these partisan differences. Some American media, particularly popular right-leaning outlets and pundits, spouted hoaxes and conspiracy theories behind the pandemic: Sean Hannity said the virus was a fraud by the “deep state” trying to spread panic, manipulate the economy, and suppress dissent; Rush Limbaugh suggested the virus was a plot hatched by the Chinese to harm the U.S. economy; and Fox Business anchor Trish Regan told viewers that the worry over coronavirus “is yet another attempt to impeach the president” (Peters and Grynbaum, Reference Peters and Grynbaum2020). As denial and disinformation exploded on right-leaning media outlets, many conservative elites correspondingly downplayed concern about the virus (Abutaleb et al., Reference Abutaleb, Dawsey, Nakashima and Miller2020; Badger and Quealy, Reference Badger and Quealy2020; Peters and Grynbaum, Reference Peters and Grynbaum2020; Russonello, Reference Russonello2020b; Warzel, Reference Warzel2020).
Consistent with this view, polling data from mid-March revealed that only 38 per cent of Fox News viewers were worried about coronavirus, compared to 72 per cent of national newspaper readers or 71 per cent of CNN viewers.
Previous academic research has demonstrated that people accept factually incorrect information as true if it originates from trusted sources or affirms their political and social worldviews (Kahan, Reference Kahan2017). Considerable evidence also suggests that political identity leads people to engage in motivated conspiracy endorsement impugning their political rivals (Flynn et al., Reference Flynn, Nyhan and Reifler2017; Miller et al., Reference Miller, Saunders and Farhart2016). These motivations may be amplified in an environment where the pandemic is highly politicized and trusted opinion leaders also endorse dubious COVID claims (Stecula, Reference Stecuła2020). As a result, we believe that even seemingly innocuous denials or false claims from relied-upon media sources may lead individuals either into a false sense of security or lead others to ignore government recommendations.
The spread of misinformation about COVID-19 could be particularly problematic if misinformed people are subsequently less likely to trust advice from medical professionals. Previous research has found that misinformation about vaccine safety is associated with increased skepticism about the role medical professionals play in the policy-making process (Motta et al. Reference Motta, Callaghan and Sylvester2018) and also with noncompliance with expert-backed health behaviors (such as wearing sunscreen or vaccinating children) (see Oliver and Wood, Reference Oliver and Wood2014).
Thus, we suspect that the highly partisan nature of early media coverage of the coronavirus pandemic had important public health consequences. The relative prominence of COVID misinformation shared by right-leaning media may have contributed to the spread of misinformation about COVID and subsequently undermined support for information from public health experts.
In this article, we show that right-leaning broadcast and cable media (for example, Fox News, Breitbart) regularly discussed misinformation about COVID-19 during the early stages of the pandemic. Further, nationally representative survey data suggest that people who consumed right-leaning media during that time were more likely to endorse COVID-19 misinformation. We find that misinformed people were more likely to believe that the CDC exaggerated COVID's health risks, suggesting that media coverage of the virus in the early stages of the pandemic may have had important public health consequences.
Material and Methods
We gathered mentions of COVID misinformation from MediaCloud. We searched for key terms and phrases associated with coronavirus misinformation, such as the claim that COVID-19 was designed in a lab or that a vaccine already exists. These two claims mirror how we measure misinformation in our public opinion data (which we discuss shortly). The exact search protocol is outlined in the online Appendix and is summarized in Figure 1.
Prevalence of COVID-19 misinformation on right-leaning vs. mainstream media (February 1–March 23, 2020).
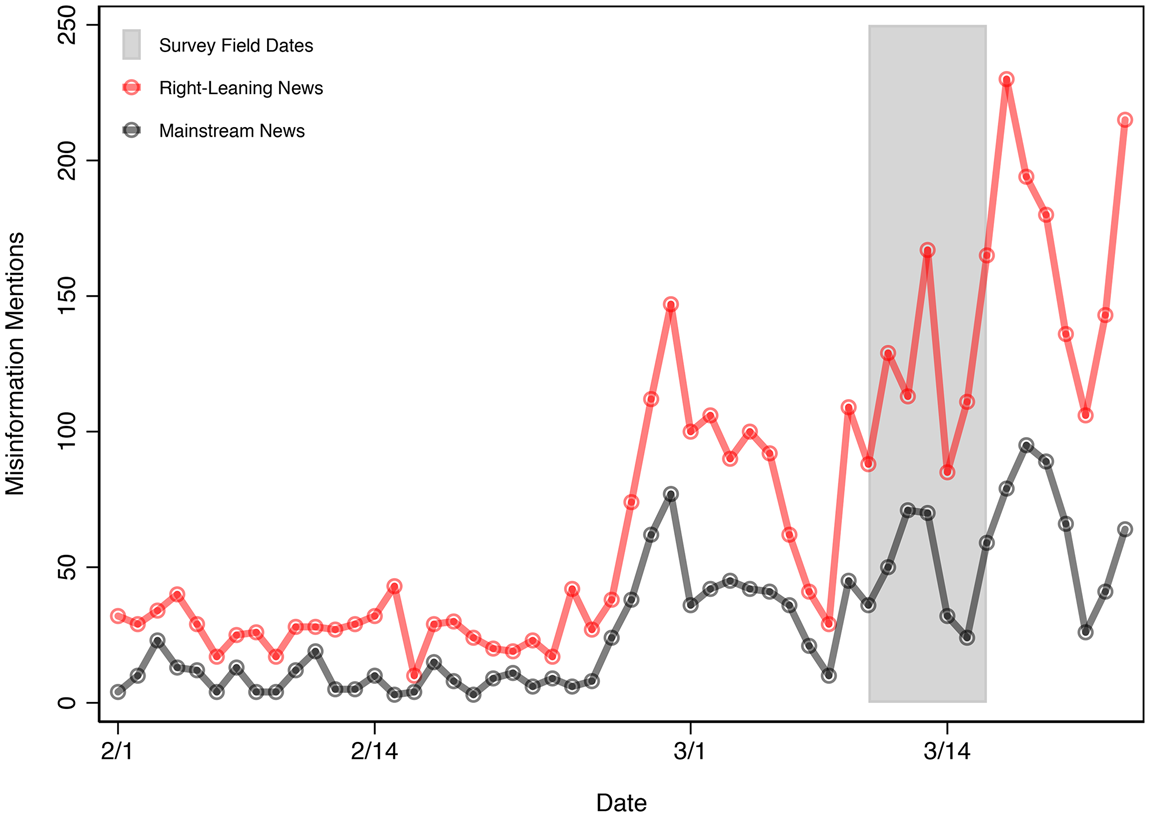
We examined the volume of misinformation covered between February 1 and March 23, 2020, in two key types of sources. First, we looked at mainstream news, such as the New York Times or USA Today (MediaCloud “Top” Sources). Second, we examined explicitly conservative, right-leaning outlets, such as Fox News or Breitbart (Media Cloud “Right” Sources). For more details about the types of sources in each category, please see the online Appendix.
Survey data for this study come from Wave 63.5 of Pew's American Trends Panel (ATP). Panelists were invited to participate in ATP's nationally representative online panel from several probability-based surveys, from Winter 2014 to Fall 2019. Wave 63.5 was fielded between March 10 and March 16, 2020. Ipsos (on behalf of Pew) invited all 11,028 remaining panelists to participate, 8,914 of whom ultimately completed the survey.
All data used in this study are publicly available (Pew Research Center, 2020). Please consult the online Appendix for additional information about these data, including detailed information about how we measured key dependent and independent variables in the survey study.
Results and Discussion
Right-Leaning Media Were More Likely to Discuss COVID-Related Misinformation in Early March
Figure 1 plots news media stories in right-leaning and mainstream outlets, in the time period beginning on February 1 until March 23, several days after our survey data were collected. The patterns are clear: right-leaning outlets, such as Fox News, dedicated 3,839 stories that reference misinformation about COVID-19 in that time period, while mainstream outlets highlighted misinformation considerably less frequently (1,541 stories). Over-time patterns also highlight that misinformation spiked in early March, and the gulf in misinformation widened as the novel coronavirus continued to spread in March.
More than One in Three Americans Endorse COVID-Related Misinformation
Figure 2 displays the percentage of survey respondents in Pew's nationally representative American Trends Panel who endorsed COVID-related misinformation, between March 10 and March 16. The results suggest that more than one in five Americans (22%) believe that COVID-19 was purposefully created in a lab, and nearly one in four (24%) believe that a coronavirus vaccine exists now or will exist within the next few months. Fewer believe that COVID-19 was made in a lab by accident (7%) or that the virus does not exist at all (<1%). Overall, we find that more than one-third of Americans (38%) endorse at least one of these misinformed statements.
COVID-19 misinformation endorsement (March 10–16, 2020).

Right-Leaning Media Viewers Are More than Twice as Likely to Endorse COVID-Related Misinformation
Figure 3 plots the association between survey respondents’ partisan news consumption habits and misinformation endorsement; this estimate controls for political, social, and demographic factors that might also influence misinformation endorsement. Circles falling to the right of the dashed red line indicate a positive relationship between a variable and endorsing a particular piece of misinformation. Circles falling to the left indicate a negative relationship. When the lines extending out from each circle do not intersect with the dashed red line, that relationship is statistically significant. For more technical information about the results of the logistic regression models used to produce this figure, please consult the Methods in the online Appendix.
Correlates of misinformation endorsement (March 10–16, 2020).

We find that both people who solely (row 2 in Figure 3) or sometimes (row 3) consume right-leaning media were significantly more likely to believe that COVID was purposefully made in a lab, and that a COVID vaccine exists now (or will exist soon). However, we find no evidence that right-leaning news consumption was significantly associated with believing that COVID was accidentally lab-made. According to our models, while just 17 per ceny of people who primarily consume left-leaning media believed that COVID was purposefully lab-made, nearly double that number (34%) of exclusive right-leaning news consumers believed the same. Similarly, while 17 per cent of left-leaning news consumers believed that a COVID-19 vaccine already (or will soon) exist, more than double (35%) believed this claim among right-wing news consumers.
Misinformed Americans Think that the CDC Exaggerated COVID's Health Risks
Finally, Figure 4 plots (as green bars) the likelihood that people who endorse either one of the two pieces of COVID-related misinformation that we found to be influenced by right-leaning media viewership also report that the CDC is exaggerating COVID's public health harms risks. Here, too, 95 per cent confidence intervals are marked with black lines.Footnote 1 Alarmingly, we find that people who believe that COVID was purposefully lab-created (26%) are significantly more likely to believe that the CDC is exaggerating the health risks of the virus than those who do not (19%). Similarly, people who believe that a vaccine already exists (24%), compared to those who do not (20%), are significantly more likely to distrust claims from the CDC.
The effect of misinformation endorsement on anti-CDC attitudes (March 10–16, 2020).

Conclusion
Our analyses suggest a clear relationship between right-leaning media consumption and pandemic-related public health beliefs. Right-leaning outlets were more likely to make inaccurate claims about the origins and treatment of COVID-19, and people who self-reported consuming more right-leaning news were subsequently more likely to express misinformed views. In turn, misinformed individuals were more likely to think that public health experts over-estimated the severity of the pandemic.
These findings must be interpreted with caution. While right-leaning media were more likely to discuss COVID-19 misinformation, we cannot observe directly whether people consumed specific stories that contained COVID-19 misinformation. Neither can we definitively disentangle the effects of factors, political ideology for example, that might encourage both right-leaning news consumption and misinformation endorsement. What we can say with confidence, however, is that we find a strong correlation between right-leaning media consumption and misinformation endorsement—one that holds even when we adjust for respondents’ ideological leaning and other social and demographic factors. We welcome experimental and longitudinal efforts that will replicate and expand upon the results presented here.
Supplementary material
To view supplementary material for this article, please visit https://doi.org/10.1017/S0008423920000396.


 Open access