

Introduction
German Chancellor Angela Merkel,Footnote 1 New Zealand Prime Minister Jacinda Ardern,Footnote 2 Taiwanese president Tsai Ing-Wen,Footnote 3 and Norwegian prime minister Erna SolbergFootnote 4 are all female leaders who were at the forefront of media reports on successful management of the COVID-19 pandemic crisis. For the first time in the current generation’s history, the entire world has been hit by what might be considered a global “feminine crisis” (Johnson and Williams Reference Johnson and Williams2020; Bauer et al. Reference Bauer, Kim and Kweon2020; Dimitrova-Grajzl et al. Reference Dimitrova-Grajzl, Gornick and Obasanjo2022; Davidson-Schmich et al. Reference Davidson-Schmich, Jalalzai and Och2023; O’Brien and Piscopo Reference O’Brien and Piscopo2023). It has been suggested that “[t]here is clear evidence that some traits considered feminine are more suited to handling the current crisis than more masculine traits.”Footnote 5 Health issues, in general, seem to be perceived as being within the purview of women more than finance, economy, interior, or foreign affairs (Escobar-Lemmon and Taylor-Robinson Reference Escobar-Lemmon and Taylor-Robinson2016; Goddard Reference Goddard2019; Krook and O’Brien Reference Krook and O’Brien2012), which are considered as more prestigious (Kroeber and Hüffelmann Reference Kroeber and Hüffelmann2022). Women are traditionally perceived as those taking care of the sick, in charge of the hygiene in the household, and those caring and empathetic in times of crisis. Furthermore, in the positive media coverage, the feminine stereotypes such as “kind”, “caring”, “sincere”, and “thoughtful” were explicitly used (Johnson and Williams Reference Johnson and Williams2020). This is in contrast to international and national terrorism, stereotypically male crises, which have been especially salient in many countries around the world in the past two decades. In a world where women constitute slightly more than half of the population, yet only 5.2 percent of heads of government (UN Women 2019), the new “feminine crisis” presents a unique opportunity to research the role gender plays in the perception of political leaders.
The reasons for women’s underrepresentation in political leadership has been investigated for decades. One common explanation is the bias against female candidates (Huddy and Terkildsen Reference Huddy and Terkildsen1993; Paul and Smith Reference Paul and Smith2008; Dolan Reference Dolan2010; Ono and Burden Reference Ono and Burden2019), which might be the consequence of the incongruity between perceived female characteristics and the expected requirements for the role of a political leader (Eagly and Karau Reference Eagly and Karau2002). Nevertheless, the evidence for gender stereotype effects on political decisions is inconclusive. While some studies find (small) effects of gender stereotypes on people’s perceptions of political leaders (Huddy and Terkildsen Reference Huddy and Terkildsen1993; Lawless Reference Lawless2004; Smith et al. Reference Smith, Paul and Paul2007; Paul and Smith Reference Paul and Smith2008; Dolan Reference Dolan2010; Bauer Reference Bauer2015; Valentino et al. Reference Valentino, Wayne and Oceno2018; Ono and Burden Reference Ono and Burden2019), other research papers show that such stereotypes do not play a role (Hayes Reference Hayes2011; Dolan Reference Dolan2014; Hainmueller et al. Reference Hainmueller, Hopkins and Yamamoto2014; Kirkland and Coppock Reference Kirkland and Coppock2018; Teele et al. Reference Teele, Kalla and Rosenbluth2018). Furthermore, some investigations even demonstrate that gender stereotypes help women in elections (Fridkin and Kenney Reference Fridkin and Kenney2009; Schwarz and Coppock Reference Schwarz and Coppock2022). We argue that recent studies on politics and gender emphasize the need to shift the focus from the dichotomous crisis-gender approach to the question of whether different crises are perceived to require stereotypically more masculine or feminine traits to manage them (Davidson-Schmich et al. Reference Davidson-Schmich, Jalalzai and Och2023; O’Brien and Piscopo Reference O’Brien and Piscopo2023; Kroeber and Dingler Reference Kroeber and Dingler2023). The global “feminine context” of the COVID-19 pandemic poses a unique opportunity to investigate the more nuanced gender/traits question.
In this paper, we aim to investigate whether the stereotypical perception of female and male personality traits, as they are linked to policy issues, affect people’s evaluation of potential candidates’ competence to manage different types of crises, including a pandemic crisis such as COVID-19. Particularly, we aim to disentangle the potential effect of gender from the effects of personality traits, which are commonly perceived as feminine or masculine. This issue is connected to the role congruity theory (Eagly and Karau Reference Eagly and Karau2002) and the concept of the double bind (Diekman Reference Diekman2007), which suggest that inconsistency between an individual’s role and their stereotypically perceived traits may lead to a negative evaluation of their competencies.
In our research, we include three types of crises for comparison: 1) a health crisis such as the COVID-19 pandemic, which is the focus of this paper; 2) a national security crisis, where male leaders seem to be perceived more competent (Merolla and Zechmeister Reference Merolla and Zechmeister2009; Lawless Reference Lawless2004; Dolan Reference Dolan2010); 3) an economic crisis, which is a more neutral context where there is no clear evidence supporting masculine or feminine trait preferences (Huddy and Terkildsen Reference Huddy and Terkildsen1993; Dolan Reference Dolan2010; Dolan and Lynch Reference Dolan and Lynch2016). If choices are gender biased, then hypothetical candidates of a certain gender will always be perceived as more competent, irrespective of their traits (gender bias). On the other hand, if choices are simply driven by personality traits which are perceived as more important for each context, gender will play a lesser role, and choices will be affected by the traits of the hypothetical candidate (gender-trait effect).
To examine our question of interest, we conducted a vignette experiment in June 2020 on a quota-representative sample of the Polish population, generally following the design of Huddy and Terkildsen (Reference Huddy and Terkildsen1993), varying the gender of the hypothetical candidate and his/her personality traits. However, we differ in the position for which the candidate is being considered (prime minister instead of a general position at the local/federal level), what needs to be evaluated (competence to handle a crisis instead of policy issue), and some of the traits (to better adjust the scenario to current times). Additionally, we examine the moderating effects of respondents’ characteristics (gender, religiosity, conservatism) on the role gender plays in the evaluation of competence. This study has been pre-registeredFootnote 6 and approved by the Research Ethics Review Committee of the Erasmus School of Law Research Ethics Review Committee (approval No. 20-04).
We chose to conduct our experiment in Poland because there are two features in this country which can lead to competing results. On the one hand, Poland is considered to be a religious and democratic country. Given the literature connecting religiosity to gender roles (Setzler and Yanus Reference Setzler and Yanus2009; Setzler and Yanus Reference Setzler and Yanus2015), we might expect to observe a gender bias against women political leaders. On the other hand, Poland for decades has been under a socialist regime, which promoted egalitarian views (Gaweda Reference Gaweda2021; Fuszara Reference Fuszara, Franceschet, Krook and Tan2019). Therefore, it might be the case that the gender bias is smaller than in other democracies, or even non-existent.
Our main finding is that people in Poland treat stereotypically feminine and masculine traits as equally important for managing a pandemic crisis such as COVID-19. They also do not disadvantage any gender in their perceived ability to handle such a crisis. However, stereotypically feminine traits are perceived more negatively than stereotypically masculine traits concerning national security and economic crises. These results suggest the persistence of the double bind. Even in a crisis where stereotypically feminine traits could advantage women leaders, they do not, and those traits are also perceived negatively in stereotypically male domains. This result is exacerbated when looking only at respondents who support conservative parties. Those respondents view male candidates as more competent than female candidates to handle any type of crisis, including a potentially “feminine” one.
Our contribution is threefold. First, the focus of this article is the COVID-19 pandemic. Given the nature of this crisis, this is the first time the question of political gender stereotypes can be investigated in a context globally dominated by a stereotypically feminine issue. This provides an opportunity to examine whether people are biased against women political leaders, or if such bias exists, whether it goes both ways. Second, with a few exceptions (Blackman and Jackson Reference Blackman and Jackson2019), most of the literature on the interaction between gender stereotypes and political choices focuses on American politics and relies on U.S. participants. However, given the global trend of the under-representation of women in high political positions, it is important to study this issue in other countries, as well. Therefore, we have chosen to examine our research question in a different geographical context. Finally, we provide unique experimental evidence of the individual determinants of the perception of leaders. In other words, we not only look at how female/male leaders, or leaders with feminine/masculine traits, are perceived, but also what might drive these perceptions.
The paper includes several sections. In the first, we develop the theoretical framework using the role congruity theory of prejudice and the double bind theory. Based on these theories, it can be predicted that expectations regarding gender roles and stereotypical traits play a role in how people evaluate the competence of leaders during different crises. We put forward testable hypotheses with respect to the positive perception of women leaders or leaders with stereotypically feminine traits during a pandemic crisis, as compared to security and economic crises. Next, we discuss the Polish context, where it is interesting to examine our research question due to the relatively egalitarian nature of the society in terms of gender on the one hand, and the high level of religiosity on the other. We then describe the experimental design, which includes descriptions of hypothetical candidates who only vary by their gender and their gender-traits. Participants are asked to rate the candidates’ competence to manage a pandemic crisis, national security, and an economic crisis. This is followed by the results section, where we find that being a woman leader or having stereotypically feminine traits does not advantage leaders in times of a health crisis such as the pandemic. At the same time, feminine characteristics lead to a more negative perception of competence with respect to security and economic crises. We finish with a discussion of the results, suggesting that the double bind seems to persist. Such results are important for researchers in the field as well as policymakers, as they suggest that even if we do not observe direct gender bias in political leadership, there are other ways in which women leaders may be disadvantaged. This requires further research focused on the perception of gender traits and the role they play in how leaders are perceived and which opportunities they have.
Gender and Traits in the Evaluation of Political Candidates
Given the uneven distribution of political leaders across gender despite a roughly balanced gender distribution in the population, political scientists have investigated the question of gender bias for decades. A great deal of literature demonstrates that voters associate certain personality traits with men or women and based on this, derive competence in policy issues. For example, men are often seen as better in military issues, while women are viewed as more competent in education (Alexander and Andersen Reference Alexander and Andersen1993; Huddy and Terkildsen Reference Huddy and Terkildsen1993; Sanbonmatsu and Dolan Reference Sanbonmatsu and Dolan2009; Dolan Reference Dolan2010).Footnote 7 Furthermore, many people seem to have a predisposed preference for either male or female leaders (Sanbonmatsu Reference Sanbonmatsu2002). People also derive ideological stances using gender as an information cue. For examples, female candidates are perceived as more liberal than male candidates (Koch Reference Koch2000; Koch 2002; McDermott Reference McDermott1997). The above considerations suggest that gender did not become irrelevant (e.g. Lawless Reference Lawless2004; Mo Reference Mo2015; Ono and Burden Reference Ono and Burden2019). On the supply side of political leadership, studies suggest that the underrepresentation of women may result from the low entry rates of women into political competition (Bledsoe and Herring Reference Bledsoe and Herring1990; Fox, Lawless, and Feeley Reference Fox, Lawless and Feeley2001; Fox and Lawless Reference Fox and Lawless2004; Fox and Lawless Reference Fox and Lawless2011; Lawless Reference Lawless2015; Kanthak and Woon Reference Kanthak and Woon2015; Bernhard at al. Reference Bernhard, Shames and Teele2021).
In this article, we focus on political leadership in the context of the COVID-19 pandemic. As with other crises, the choice of a candidate for a leadership position should depend on his or her relevant competences and ideological positions. If candidates do not differ in these qualities, voters should perceive them as equally competent. Nevertheless, following the “role congruity theory of prejudice” (Eagly and Karau Reference Eagly and Karau2002), people might give undue weight to gender stereotypes when deciding which candidate is more suitable for such a position. Traditionally, women are associated with communal traits (e.g., warm, caring, concerned about others), while men are associated with agentic traits (e.g., assertive, dominant, competitive) (Eagly et al. Reference Eagly, Makhijani and Klonsky1992; Diekman and Eagly Reference Diekman and Eagly2000; Schneider and Bos Reference Schneider and Bos2014; Eagly et al. Reference Eagly, Nater, Miller, Kaufmann and Sczesny2020). According to this theory, if there is incongruence between a candidate’s perceived characteristics and the perceived required attributes for a specific social role, the candidate will be viewed as less desirable for the position.
This connects to the concept of the double bind, where certain traits are evaluated based on their consistency with different roles (Jamieson Reference Jamieson1995). Researching this concept, Diekman (Reference Diekman2007) found that dominance, for example, is evaluated based on its congruence with occupational roles (valued for occupations where agentic behavior is important, and devalued where interpersonal relations are important), but not based on (gender) social roles. Nevertheless, a more subtle double bind has been found in the context of political leadership. For instance, Teele et al. (Reference Teele, Kalla and Rosenbluth2018) demonstrated that in American politics, having family and children is crucial for being perceived positively as a leader. But given the remaining social construction where women bear a heavier burden of upbringing, this perception disadvantages women. Successful women leaders with families either must work longer hours, or those strongly devoted to their political careers are less likely to be married, and consequently, are “penalized” by this perception.
More generally, many studies specifically on leadership find that female leaders are penalized when acting in traditionally male-dominant areas (Eagly et al. Reference Eagly, Makhijani and Klonsky1992; Rudman and Glick Reference Rudman and Glick1999; Heilman and Okimoto Reference Heilman and Okimoto2007; Okimoto and Brescoll Reference Okimoto and Brescoll2010; Krupnikov and Bauer Reference Krupnikov and Bauer2014; Ditonto Reference Ditonto2017; Costa Reference Costa2021). The explanation for this phenomenon is that the traits expected of leaders are not compatible with the stereotypical female traits (Eagly et al. Reference Eagly, Makhijani and Klonsky1992), thus women leaders are perceived as violating social norms related to gender roles (Heilman and Okimoto Reference Heilman and Okimoto2007).
Traditionally, crises raise voters’ expectations for the leaders to act decisively and swiftly. In times of threat, which often accompany different types of crises, people seem to prefer hawkish and assertive leaders (Gadarian Reference Gadarian2010). Such a demanded approach is frequently associated with stereotypically male or masculine characteristics and is incongruent with the female social role. Therefore, political science scholars predict that crises inhibit women’s ability to gain political power (O’Brien and Piscopo Reference O’Brien and Piscopo2023). In fact, there is evidence to suggest that women are kept away from crisis management task forces, even when their qualities are relevant (Van Daalen et al. Reference Van Daalen, Bajnoczki, Chowdhury, Dada, Khorsand, Socha and Lal2020).
On the other hand, literature from psychology, mainly applied to leadership in firms, suggests that due to the glass cliff effect, women are more likely to be selected for leadership positions in times of crisis, while men rise into leadership positions when an organization is successful (Ryan and Haslam Reference Ryan and Haslam2005). This is often termed “think crisis – think female.” The explanations offered for this phenomenon usually cover the path dependence of male leadership and the status quo bias, as well as the different characteristics perceived as important in times of crisis. According to the first explanation, the status quo bias, because most managers are males, if the firms are successful there is no need for a change. When a crisis emerges, the need for a change arises. According to the second explanation, even though leaders are stereotypically associated with male characteristics, people perceive feminine characteristics related to interpersonal relationships as important for handling a crisis (Bruckmüller and Branscombe Reference Bruckmüller and Branscombe2010; Ryan et al. Reference Ryan, Haslam, Hersby and Bongiorno2011; Gartzia et al. Reference Gartzia, Ryan, Balluerka and Aritzeta2012). Similar arguments have also been put forward in the political science literature to suggest that crises sometimes open opportunities for women to become leaders, as new and different approaches are desired (Beckwith Reference Beckwith2015) and stereotypically feminine qualities, such as compassion, become valuable (O’Brien and Piscopo Reference O’Brien and Piscopo2023). Finally, for women, times of crisis might be the only opportunities to obtain leadership positions. Therefore, we might observe more women in leadership positions during crises due to women’s own (potentially inevitable) choices (Ashby et al. Reference Ashby, Ryan and Haslam2006; Ryan et al. Reference Ryan, Haslam, Morgenroth, Rink, Stoker and Peters2016).
Yet, perceived competency of leaders may also simply depend on the type of crisis (Davidson-Schmich et al. Reference Davidson-Schmich, Jalalzai and Och2023; O’Brien and Piscopo Reference O’Brien and Piscopo2023; Kroeber and Dingler Reference Kroeber and Dingler2023). A crisis that raises expectations of a clear response and assertive communication might benefit male leaders, while women leaders might be advantaged when the required response to the crisis is ambiguous and demands a more empathetic communicative approach (Davidson-Schmich et al. Reference Davidson-Schmich, Jalalzai and Och2023). Therefore, the role congruity theory leads to competing predictions in times of crisis in general, and in the context of the COVID-19 pandemic.
Given that COVID-19 is a large-scale crisis that imposes a threat, people might prefer male leaders or leaders with stereotypically masculine features. Therefore, we put forward the following hypotheses:
H1a. Male candidates will be ranked as more competent to manage a COVID-19 crisis than female candidates (gender bias).
H1b. Candidates with masculine traits will be ranked as more competent to manage a COVID-19 crisis than candidates with feminine traits, irrespective of their gender (gender-trait effect).
On the other hand, a global pandemic is a special type of crisis where the success of its management is strongly dependent on people’s willingness to cooperate and comply with governments’ instructions. Until a vaccine against COVID-19 was developed, the only way to contain the spread of the virus was through specific social behavior rules. It was possible to manage the crisis if people kept physical distance from each other, wore masks, complied with lockdown rules, and maintained proper hygiene, etc. The enforcement of such social behavior is prohibitively expensive given that the target of enforcement is the entire population. Hence, countries heavily depended on people’s willingness to cooperate and comply with these rules. Therefore, a leader who is more compassionate and has stronger people skills might be perceived as more successful in eliciting voluntary compliance. Women are perceived as possessing such qualities and as being able to introduce more congeniality and cooperation in their leadership styles (Hayes and Lawless Reference Hayes and Lawless2015; Lawless Reference Lawless2015; Johnson and Williams Reference Johnson and Williams2020). Furthermore, while men are perceived as more competent to deal with issues such as national security (Lawless Reference Lawless2004; Dolan Reference Dolan2010), finance, economy, interior, or foreign affairs (Escobar-Lemmon and Taylor-Robinson Reference Escobar-Lemmon and Taylor-Robinson2016; Goddard Reference Goddard2019; Krook and O’Brien Reference Krook and O’Brien2012, Kroeber and Hüffelmann Reference Kroeber and Hüffelmann2022), women are perceived as more capable in handling, among others, health care policies (Alexander and Andersen Reference Alexander and Andersen1993; Dolan Reference Dolan2010; Dolan Reference Dolan2014). Health issues in politics are assigned to women according to stereotypes about their traditional roles in society (Kroeber and Hüffelmann Reference Kroeber and Hüffelmann2022). For instance, Bauer et al. (Reference Bauer, Kim and Kweon2020) found that compliance with personally invasive policies during COVID-19 weakly increased when the recommendation came from a co-partisan female leader. Consequently, women, or feminine characteristics might be perceived more congruent with what is needed to manage this type of crisis.
As a counterargument, it may be suggested that COVID-19 is what is called a human security crisis (Newman Reference Newman2022). Therefore, it falls in the traditional male purview. However, while the traditional notion of security refers to threats to states or nations, human security (UNDP 1994) relates to a threat to the ability of humans to live, e.g., due to a humanitarian crisis which causes famine (Kaldor, Reference Kaldor2007; Detraz, Reference Detraz2013). Despite the developing scholarship on human security, this concept and its inclusion in the traditional understanding of security is not without controversy (Khong Reference Khong2001; Oberleitner, Reference Oberleitner2005; Persaud Reference Persaud and Collins2016). Furthermore, due to its nature, often concerning health and wellbeing of individuals, even if classified as a human security crisis, the COVID-19 pandemic seems to be a more “feminine” crisis, as it may require different approaches than those perceived necessary to handle a national security crisis.
Therefore, we put forward the following hypotheses:
H1c. Female candidates will be ranked as more competent to manage a COVID-19 crisis than male candidates (gender bias).
H1d. Candidates with feminine traits will be ranked as more competent to manage a COVID-19 crisis than candidates with masculine traits, irrespective of their gender (gender-trait effect).
Given that the COVID-19 crisis is a new context, it is important to compare it to more commonly known types of crises. Furthermore, by looking only at one type of crisis we cannot disentangle the glass cliff effect, which suggests that generally women are perceived as more suitable to handle a crisis, from the perception of women in this particular “feminine” crisis. In other words, if we find that being female or possessing feminine traits matters for the perception of competence, we still do not know if it is because the pandemic is a crisis, or because the pandemic is a more “feminine crisis.” Therefore, we add two more contexts that were widely investigated in past literature. In particular, it has been found that women are disadvantaged in the context of national security crisis leadership (Huddy and Terkildsen Reference Huddy and Terkildsen1993; Dolan Reference Dolan2010, p. 77; Lawless Reference Lawless2004; Kroeber and Dingler Reference Kroeber and Dingler2023).
Therefore, we predict that:
H2. Male candidates/candidates with masculine traits will be rated as more competent to manage a national security crisis.
With respect to economic crises, the evidence is inconclusive. On the one hand, political positions related to finances and treasury are still dominated by men (Kroeber and Hüffelmann Reference Kroeber and Hüffelmann2022). This may lead to some gender bias in the perception of competence to handle an economic crisis. On the other hand, literature shows that often the gender of the candidate does not play a role in the context of an economic crisis (Huddy and Terkildsen Reference Huddy and Terkildsen1993; Dolan Reference Dolan2010; Paul and Smith Reference Paul and Smith2008). Therefore, we predict that:
H3. There will be no difference between the level of perceived competence of male and female candidates/candidates with feminine or masculine traits in handling an economic crisis.
Disentangling the effect of gender from the effect of characteristics is important. Merely finding a gender bias does not provide the underlying reason for the choice. With low information cues, people might assume a certain leader possesses a certain trait (women are compassionate, men are assertive). If they perceive this trait as important for the given role, they may favor one leader over the other (one gender over the other). However, this does not necessarily mean that those people are predisposed to favor men or women. Instead, they might be driven by the trait. In other words, any leader who possesses this trait, irrespective of their gender, would be perceived as more competent to handle the crisis. And indeed, different investigations do not just look at gender, but independently focus on gender traits (Huddy and Terkildsen Reference Huddy and Terkildsen1993; Bauer Reference Bauer2015).
From a normative perspective, the most “problematic” result for gender equality would be a pure gender bias which goes only in one direction (expectedly favoring male and disfavoring female leaders). A second type of gender bias is a bias that goes both ways. It indicates that men are perceived as more competent leaders when issues are stereotypically male, and women are viewed as more competent when the context is dominated by stereotypically female issues. Despite leading to a biased decision, because male leaders can possess stereotypically female traits and vice versa, it does not entail gender inequality. Finally, a gender-trait effect, independent of gender, might not constitute a problem for gender equality. It is sensible to choose leaders that possess certain traits, which can be helpful to manage a particular national crisis. Yet one should remember all this is true only if we overcome the double bind problem. If, however, women are penalized for possessing stereotypically masculine traits, gender inequality will persist.
Besides focusing on the gender and characteristics of the leaders, we also investigate the individuals’ determinants of different perceptions of the leaders. We examine whether certain characteristics of the participants affect their perception of leadership competency as a function of gender and gender-traits. First, an aspect which received attention in the literature was the question of whether there exists a gender affinity effect. The literature is inconclusive on that. However, studies have shown this effect for male respondents (Eagly and Karau Reference Eagly and Karau2002; Ono and Burden Reference Ono and Burden2019), or for both groups (Sanbonmatsu Reference Sanbonmatsu2002; Dolan Reference Dolan2010; Dolan and Lynch Reference Dolan and Lynch2016). In addition, because placing women in leadership positions supposedly disrupts the traditional societal gender hierarchy, male participants might generally perceive female leaders in a crisis more negatively (Eagly et al. Reference Eagly, Makhijani and Klonsky1992). Therefore, we conjecture that:
H4a. Male participants will perceive male candidates as more competent to manage a crisis than women will perceive.
H4b. Female participants will perceive female candidates as more competent to manage a crisis than men will perceive.
Second, stereotypical perceptions can also be influenced by religiosity. The influence of religion on people’s political choices may take many shapes according to the existing literature. Religion serves as the fundamentals of ethics, values, beliefs, and morals, and therefore drives society (Gaito Reference Gaito2019). Multiple studies investigating the relationship between religiosity and political choices highlight the effects of religious variables on voting behavior and political attitudes (Ayers and Hofstetter Reference Ayers and Hofstetter2008; Driskell, Embry, and Larry Reference Driskell, Embry and Larry2008; Glazier Reference Glazier2015; Hayes Reference Hayes1995; Rapp et al. Reference Rapp, Traunmuller, Freitag and Vatter2014; Schoettmer Reference Schoettmer2013; Stockemer and Khazaeli Reference Stockemer and Khazaeli2014).
There are a number of research projects reporting a negative relationship between people’s religiosity and the likelihood of voting for women (Vandenbosch Reference Vandenbosch1996; Merolla, Schroedel, and Holman Reference Merolla, Schroedel and Holman2007). The above studies carried out in America indicate that states with higher membership rates in Christian congregations nominate and select a smaller number of women to local, state, and national positions in contrast with states having fewer religious residents. Whitehead (Reference Whitehead2012; Reference Whitehead2013) explains that religiosity has an impact on gender equality. Similarly, Davis and Greenstein (Reference Davis and Greenstein2009) indicate that religiosity corresponds with views questioning female leaders’ desirability in public life (Setzler and Yanus Reference Setzler and Yanus2009). This may be because various churches continue to maintain males as dominant leaders in their decision-making structures (Whitehead Reference Whitehead2012; Reference Whitehead2013). As a result, despite social pressure on gender equality, many religious individuals believe women are less effective leaders than their male counterparts (Setzler and Yanus Reference Setzler and Yanus2015). These sentiments can extend to political roles, wherein female leaders may be perceived as transgressing traditional norms and constructs.
Therefore, we put forward the following prediction:
H5. More religious people will consider men as more competent to manage a crisis than women.
Finally, conservative people are expected to hold more traditional views on gender roles. Consequently, women might be perceived by them as less competent for leadership roles than men, who are believed to hold the necessary qualities for powerful leadership positions. This view is partially supported by empirical evidence, even though there is no consensus in the more recent literature.Footnote 8 For example, different studies in the U.S. have demonstrated that gender bias is more prevalent among Republicans as compared to Democrats (King and Matland Reference King and Matland2003; Bauer Reference Bauer2020). Based on this evidence, we first predict that:
H6. Participants supporting conservative political parties will consider male candidates as more competent to handle a crisis than participants supporting liberal political parties.
However, we expect that what drives the stereotypical perception is only conservatism on the social spectrum rather than the economic spectrum. Because people might support rightist parties solely due to their economic policy position, we also measure directly their ideological position (Dolan Reference Dolan2010; Dolan and Lynch Reference Dolan and Lynch2016). We predict that:
H7. More politically conservative participants on the social spectrum will perceive male candidates as more competent to handle a crisis than more liberal participants on the social spectrum.
Women in Leadership Positions in Polish Politics – Country Context
The research was conducted in Poland, a country located in Central Europe. Poland became a member of the European Union in 2004. Women gained the right to vote in 1918, shortly after the country had regained its independence. After the Fall of Communism in 1989, Poland has become a Republic with a parliamentary democracy under the 1997 Constitution. The parliament is bicameral and composed of an upper house, the Senate (Senat), and a lower house, the Sejm. The head of state is the President of the Republic of Poland, and the government is led by the President of the Council of Ministers, i.e., Prime Minister (Premier in short)Footnote 9.
As the study took place in Poland, it feels necessary to provide the context related to women in Polish politics. Poland seems to be an interesting country in which to investigate the relationship between gender stereotypes and leadership, as constructs such as gender, religiosity, and ideology can be observed (Gwiazda Reference Gwiazda2023).
The situation of women in leadership positions in Polish politics has improved slightly over the last decade or so. Currently, women hold about 29.6% of the seats in the Sejm (29.3% in 2019) and 24% in the Senate (19% in 2019). In the European Parliament, 28.3% of Polish seats are held by women (EU Parliament 2024). In the October 2023 parliamentary election, the proportion of women on electoral lists for the Sejm was the highest ever, exceeding the 35% minimum required by the 2011 gender quota law on electoral lists initiated by the Congress of Women (Śledzińska-Simon and Bodnar, Reference Śledzińska-Simon and Bodnar2013; Druciarek et al., Reference Druciarek and Przybysz2019). Despite women making up 43.8% of the candidates, only 29.6% were elected to the Sejm. The situation of women in subnational elections is also gradually improving (Gulczyński et al. Reference Gulczyński, Köppl–Turyn and Jaroslaw2024).
Women’s presence in the parliament has grown but there is still room for improvement, especially regarding leadership positions in the Polish government. Between 1991 and 2024, (i.e., during the ten terms of the Sejm and the 19 governments appointed during this period), 61 women were appointed as ministers. During this period, women headed the Polish government three times. Two out of three female prime ministers were promoted by the left-center-wing government. The first time was in July 1992, when Hanna Suchocka became Prime Minister. The next Prime Minister was Ewa Kopacz, who held the post from September 2014 to November 2015. The last head of the Polish government was Beata Szydło - she held the position of Prime Minister from November 2015 to December 2017. Three female prime ministers versus eleven male prime ministers of Poland, including some of them holding the post more than once, is a definite minorityFootnote 10. Additionally, there is no women who served as president in Poland in the past.
Between 1997 and 2023, women led an average of three to four ministries in each government, while men received around 20 ministerial appointments. This large disproportion changed slightly with the 2010 Act on Equal Status of Women and Men in Public Office. After the Act’s introduction during the seventh term of the Sejm, seven ministries came under female leadership. Still, in Kroeber and Hüffelmann’s (Reference Kroeber and Hüffelmann2022) study of 27 European Countries from 1990 to 2018, Poland was behind most counterparts in the number of women reaching prestigious ministries such as finance, interior affairs, economy, or foreign affairs.
Interestingly, in the current government led by Prime Minister Donal Tusk and appointed on December 13, 2023, there are nine female ministers and 17 male ministers. This gives a 34.6% female representation and places Poland in the second gender league in 12th place in the EUFootnote 11.
In terms of religiosity, in the 2010-2014 World Value Survey, almost 80% of Polish people indicated that religion is either very or rather important in their life. This can be compared to some other democracies: in Germany, it is 38%, Sweden 26%, Australia 31%, and the U.S., 68% (Inglehart et al. Reference Inglehart, Haerpfer, Moreno, Welzel, Kizilova, Diez-Medrano, Lagos, Norris, Ponarin and Puranen2014). Although the level of religiosity declined in Poland in recent years (CBOS 2022), it is still likely much higher than in other Western democracies. Religiosity might be associated with more traditional views on gender roles, thus leading to more gender bias in political decisions.
Research Design
Design
To investigate our questions of interest, we have designed a 2x2 factorial between-subjects experiment. Participants were provided with a short description of a hypothetical candidate for a prime minister position and were asked to rate how competent, in their opinion, this candidate would be in managing three different types of crises.Footnote 12 We varied two things: (1) the gender of the candidate and (2) his/her personal traits. The chosen traits represent the stereotypical feminine (communal) and masculine traits (agentic). Despite generally following the manipulated traits as in Huddy and Terkildsen (Reference Huddy and Terkildsen1993), we changed some of them to better reflect the current reality. For example, with female emancipation and increasing financial independence in recent decades,Footnote 13 it is plausible to assume that “family-orientation” is not as strong as a stereotypical perception as it was in the past, even though it still plays a role. Nevertheless, all the traits we have included were identified in the literature as stereotypically associated with either men or women (Alexander and Andersen Reference Alexander and Andersen1993; Huddy and Terkildsen Reference Huddy and Terkildsen1993; Eagly and Johannesen-Schmidt Reference Eagly and Johannesen-Schmidt2001; Eagly and Karau Reference Eagly and Karau2002; Lawless Reference Lawless2004; Dolan Reference Dolan2014; Schneider and Bos Reference Schneider and Bos2014; Egly et al. 2020).
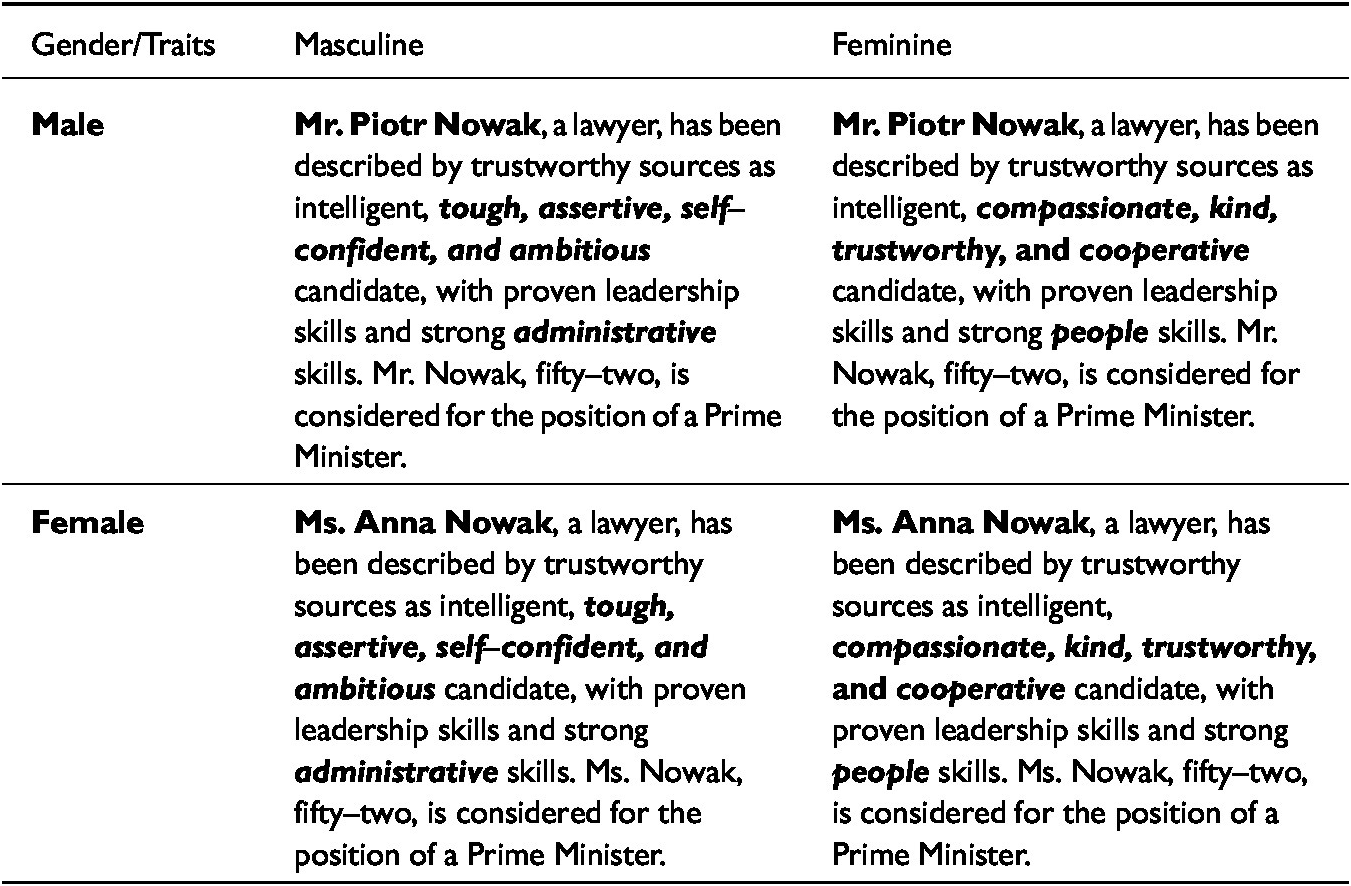
The participants received one out of four texts before making their assessment. Therefore, they either saw a male candidate with masculine traits; or a female candidate with masculine traits; or a male candidate with feminine traits; or a female candidate with feminine traits. For the experimental groups, see Table 1.
Experimental groups
After reading the candidates’ description, the participants were asked to evaluate on a Likert scale (0–10, 0=not well at all, 10=very well) how well, in their opinion, would this candidate manage all three crises (a national security crisis such as terrorism; a pandemic crisis such as COVID-19; an economic crisis such as abrupt recession, declining GDP, and mass unemployment). To avoid order effects, the order in which the three crises were presented was randomized.
This experimental design enables a disentanglement of a “pure” gender bias from gender-trait effect (H1-3). In other words, the findings allow us to determine whether the candidate’s gender or his/her traits (feminine versus masculine), or neither, drive the evaluation of competence (our outcome variable).
In order to test our additional hypotheses (H4-7), we asked several further questions. For example, to capture the level of religiosity, we asked the respondents how important religion was in their lives with four pre-defined response items, very important, important, not so important, and not important at all (the respondents were also allowed to check “don’t know”). To examine the ideology prediction, we have used two measures. The first measure asked respondents for whom they will vote in the (then) upcoming second round of the presidential elections in Poland. We exploited the close race between a conservative candidate (Duda) and a liberal candidate (Trzaskowski). The second measure asked participants’ stance on social policies (LGBT rights and abortion). The 0-10 variable capturing ideological leaning was recoded into three classes of: liberals (scores below 5), centrics (scoring 5), and conservatives (scores above 5). For the full description of the experiment, see the Supplementary Materials.
Procedure
The study was conducted in Poland, in Polish language, between June 30 and July 4, 2020, using a representative sample on age, gender, education, and place of residence (rural, small towns, and large cities). Participants were recruited through the survey firm Pollster and data was recorded in Qualtrics. We conducted a power analysis, and for detecting the small differences (effect size d=0.20), we needed 1,576 participants to achieve a power of 0.8 (given the alpha 0.05). This sample would allow us to detect the main effect of one factor (gender traits) at each level of the other factor (gender). The sample size was derived via G*Power 3.1. The final sample (the number of respondents completing the survey experiment) was N=1,596. Descriptive statistics of our sample can be found in Table A1 in the Supplementary Materials. This experiment was run as part of a larger survey (for the description of the full survey flow, see the Supplementary Materials).
Results
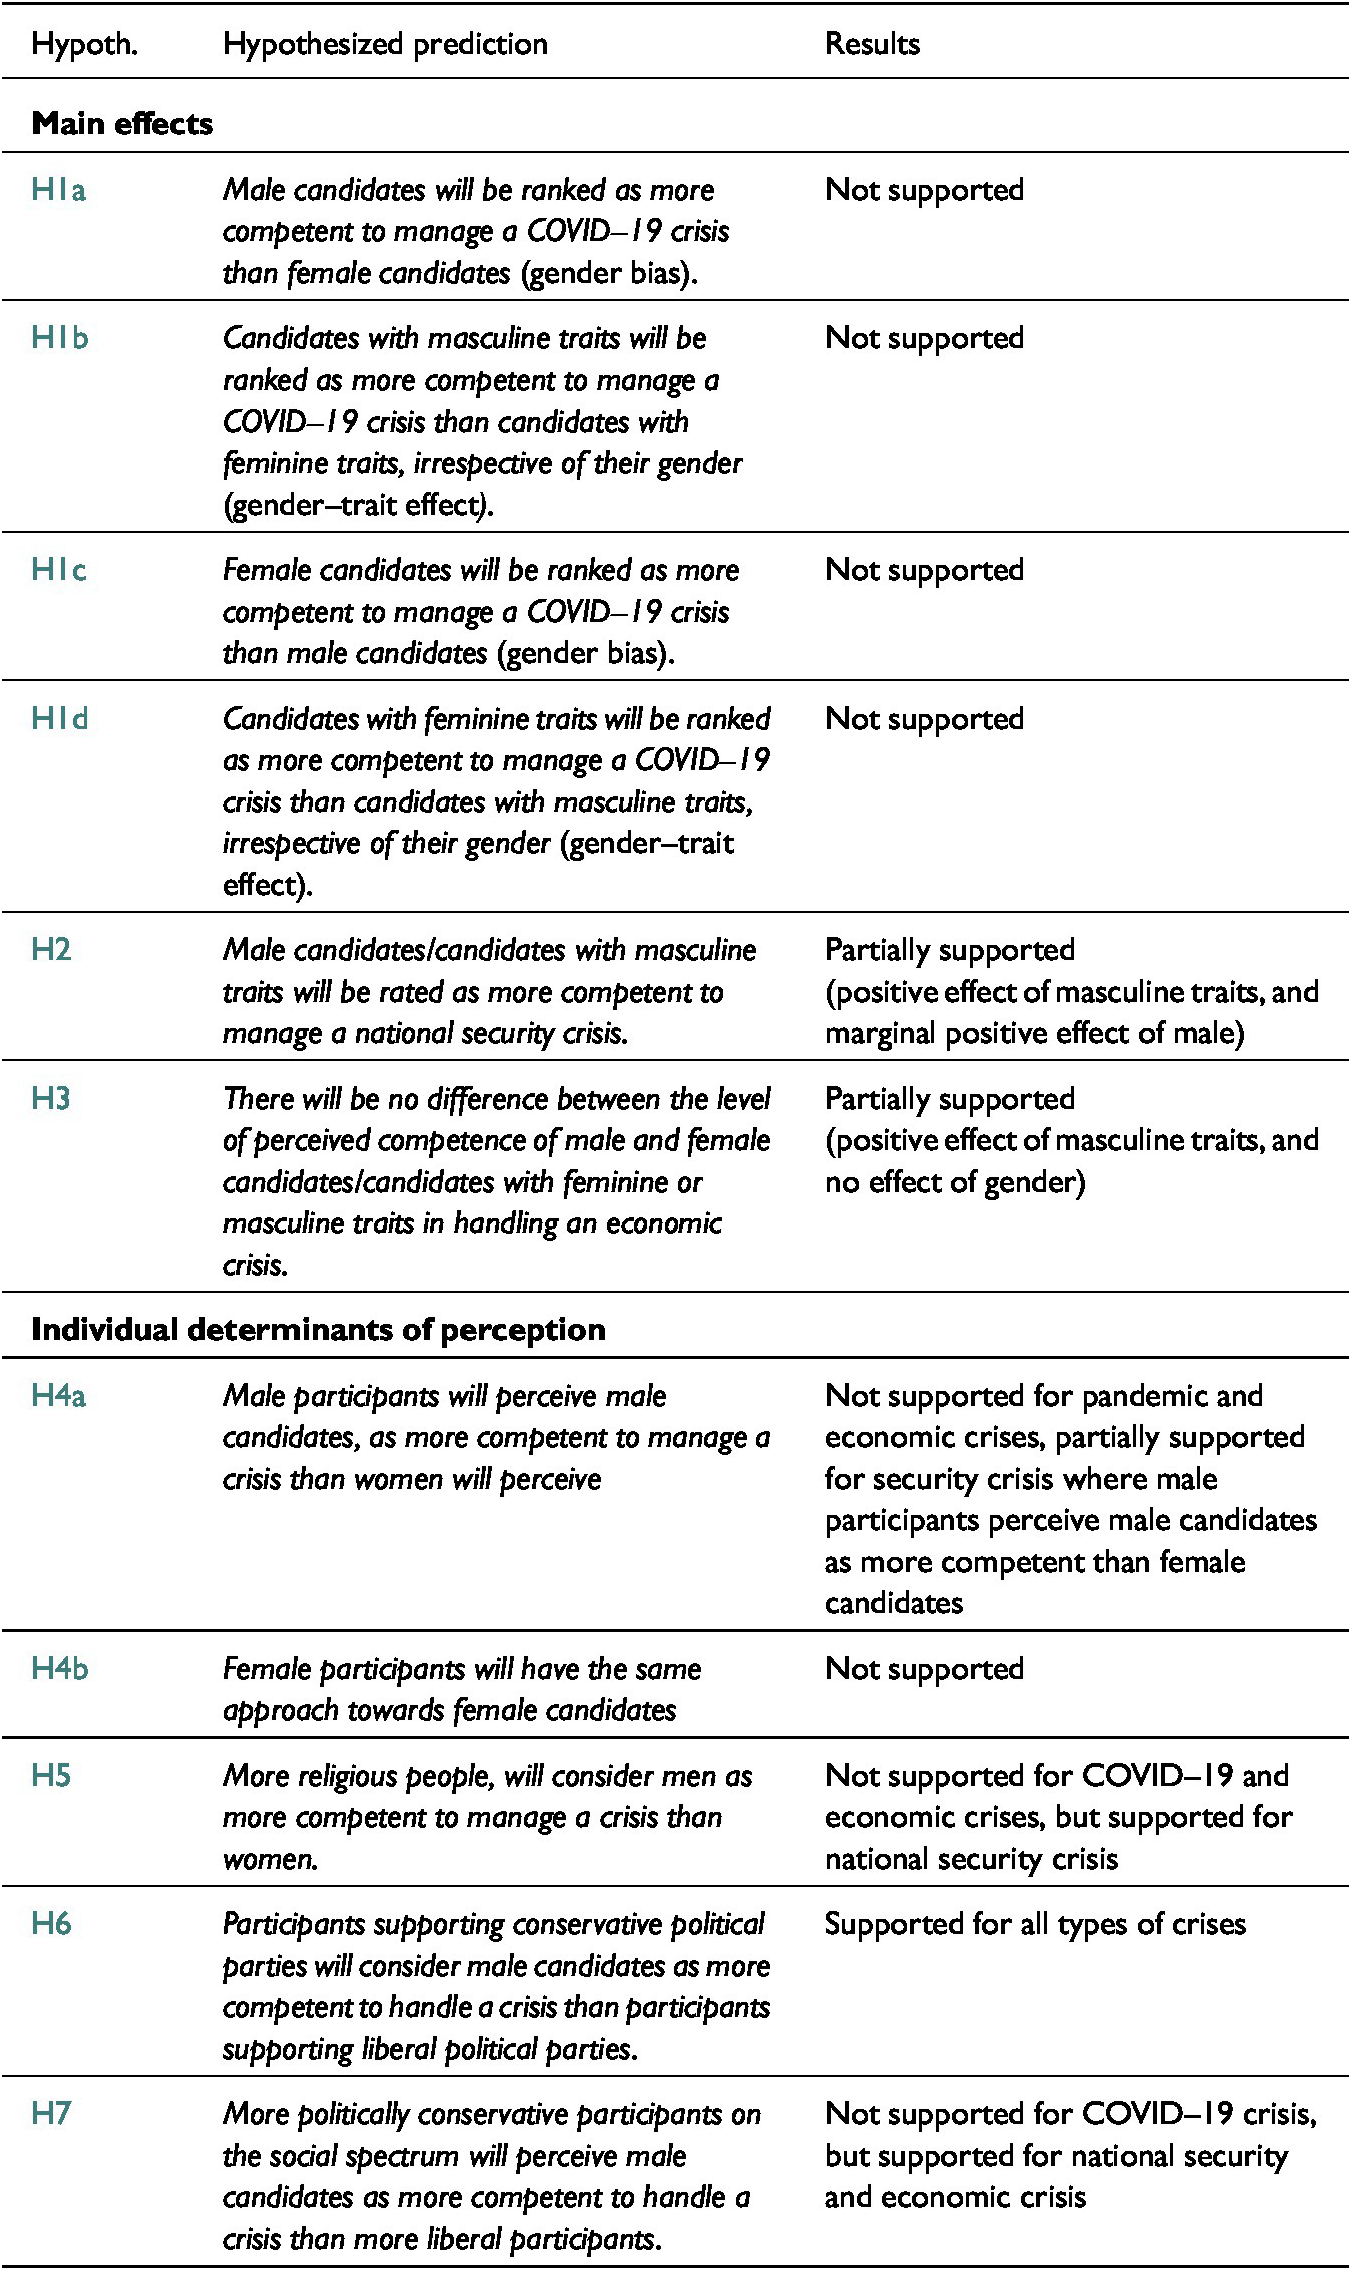
Our main outcome variable is the level of the indicated competence of the candidate on a Likert scale (0–10) for three types of crises. We first report the results for gender and gender-trait comparison within each crisis. For this purpose, we used two sample t tests to measure the differences in the means capturing competence between the experimental groups (main effects). As a robustness check, we also performed a nonparametric Mann-Whitney (MW) test for differences of medians across groups. For readability, we report all t tests (t statistics) and the nonparametric MW (z-statistics) results below the relevant figures. We relied on two-sided testing with alpha=0.05. We further run multiple (OLS) regression models with interaction terms to test the differences across crises. Subsequently, we report the results for gender and gender-trait effects across crises. In this case, we run ANOVA tests to compare differences in means across more than two groups. Finally, we report results for the subgroup analyses. Given the multitude of hypotheses and for the convenience of the reader, we summarize the hypotheses below in Table 2.
Hypotheses

Main Effects
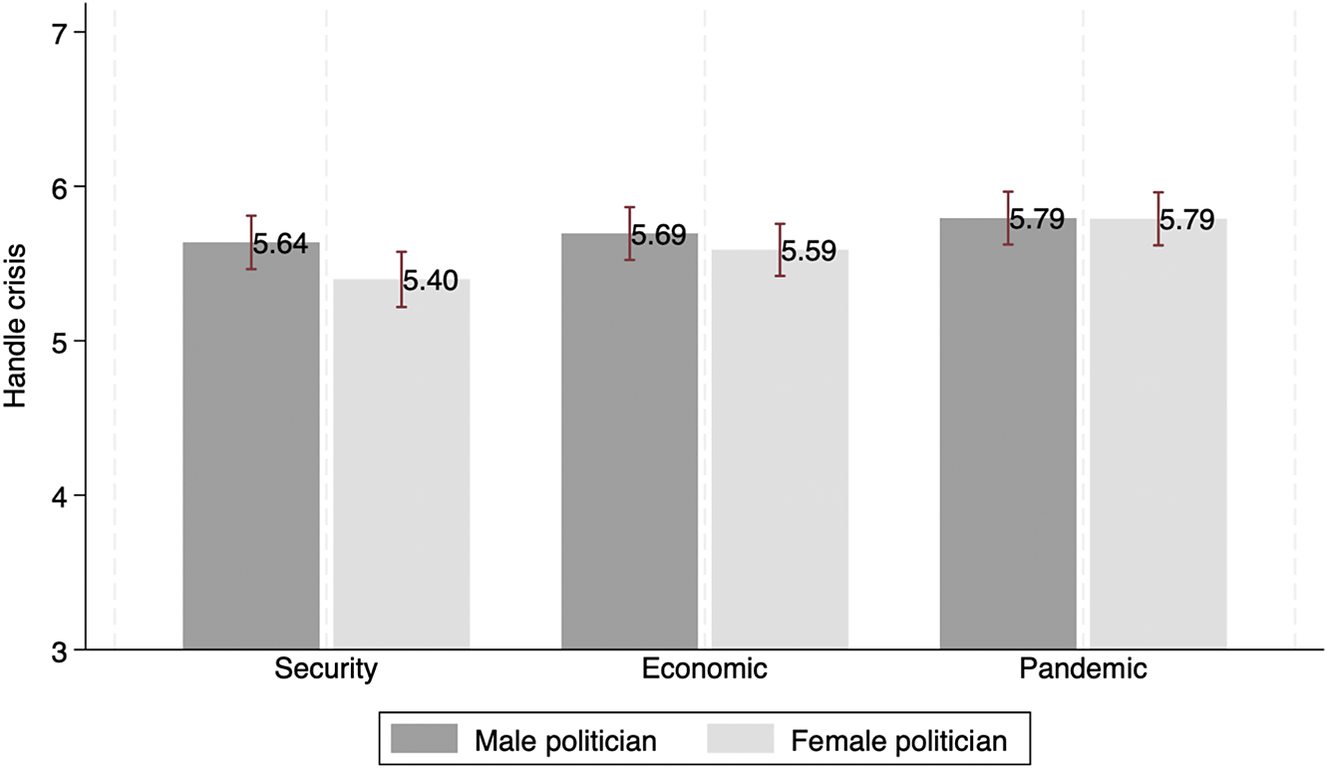
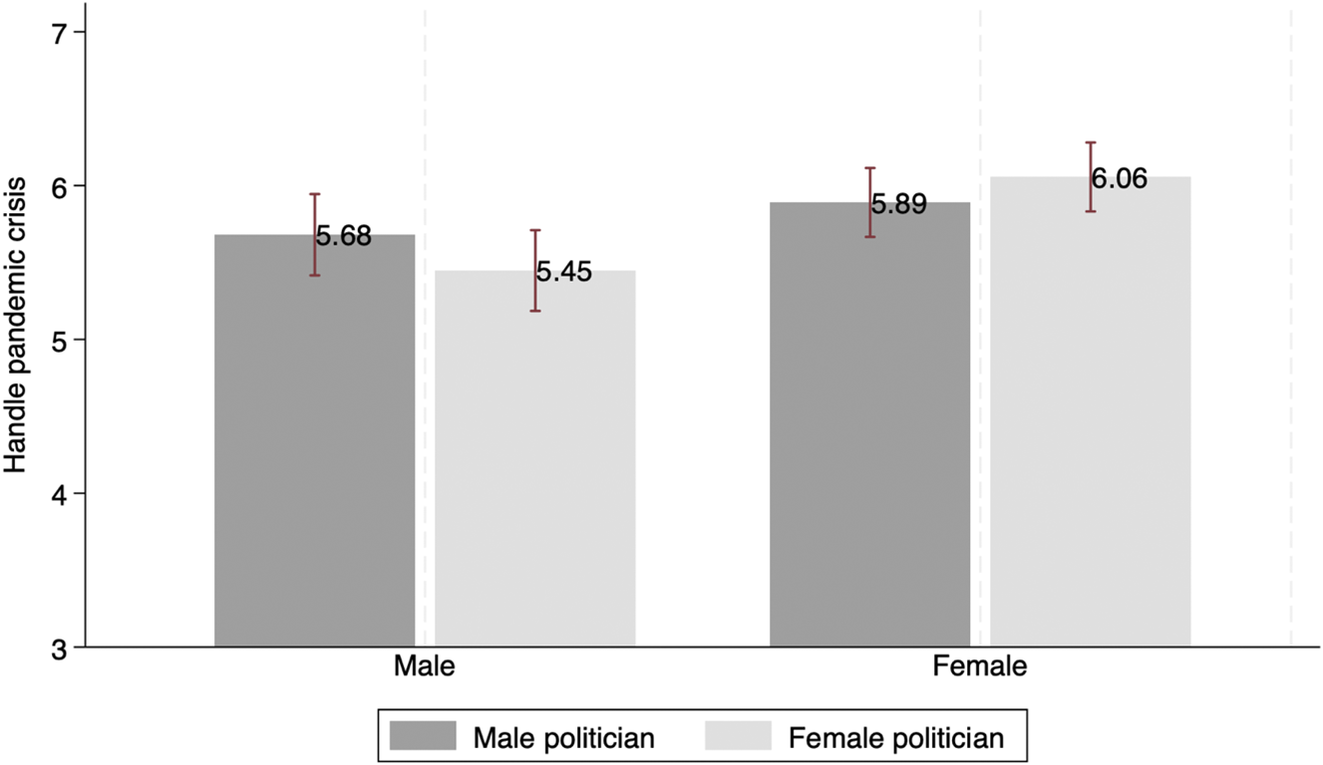
We start with Figure 1 (right bars), which shows the effect of the candidate’s gender on the respondents’ evaluation of their competence to manage a pandemic crisis for the full sample of respondents. Our main interest here is to identify whether gender has an independent effect, irrespective of the gender-traits of the candidates and vice versa. The results of our experiment show that there are no differences between male and female candidates when assessing their ability to handle a pandemic crisis. Therefore, we find neither support for H1a nor H1c.
Gender effects on perceived competence to handle a crisis.
Note: Statistical differences between the male and female politicians within: (1) the security crisis |t| = 1.884, p value = .060; |z| = 1.932, p value = .053; (2) the economic crisis |t| = 0.864, p value = .388; |z| = 0.836, p value = .403; (3) the pandemic crisis |t| = 0.039, p value = .969; |z| = 0.230, p value = .818.
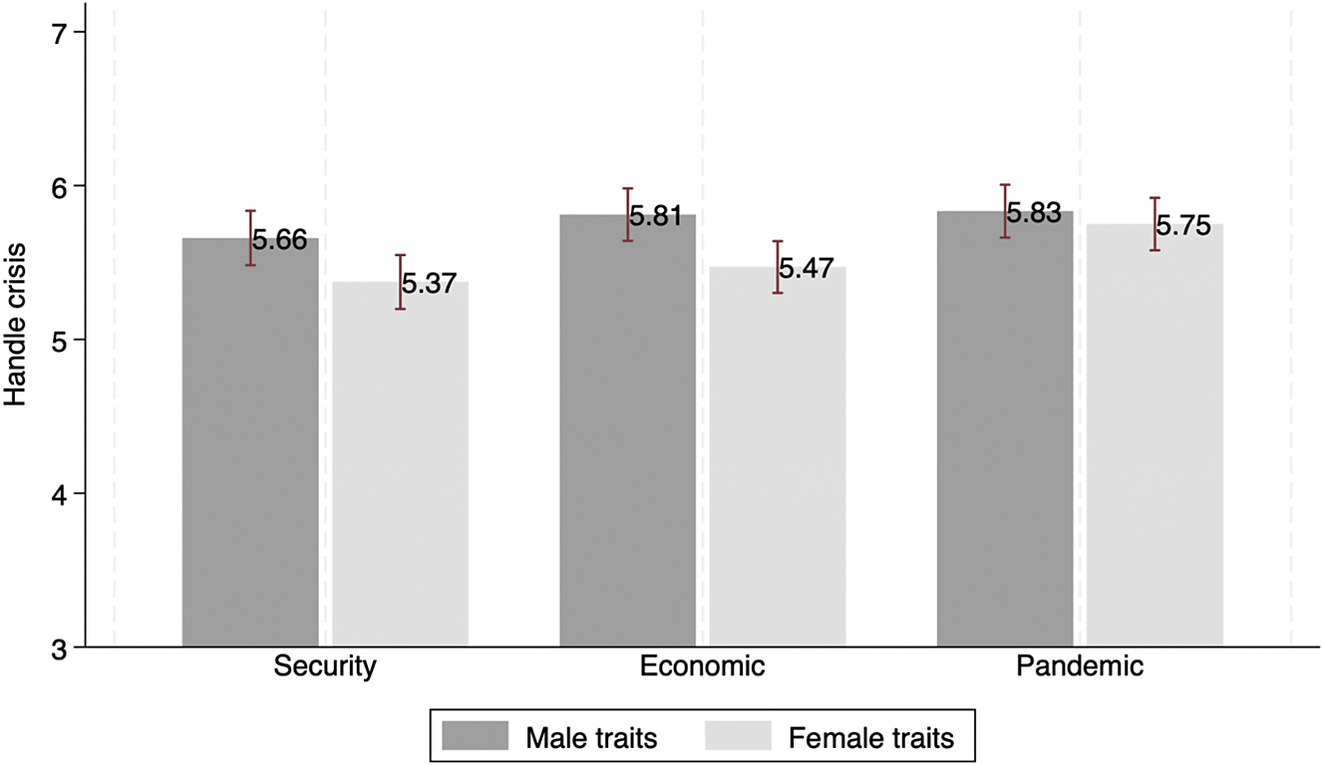
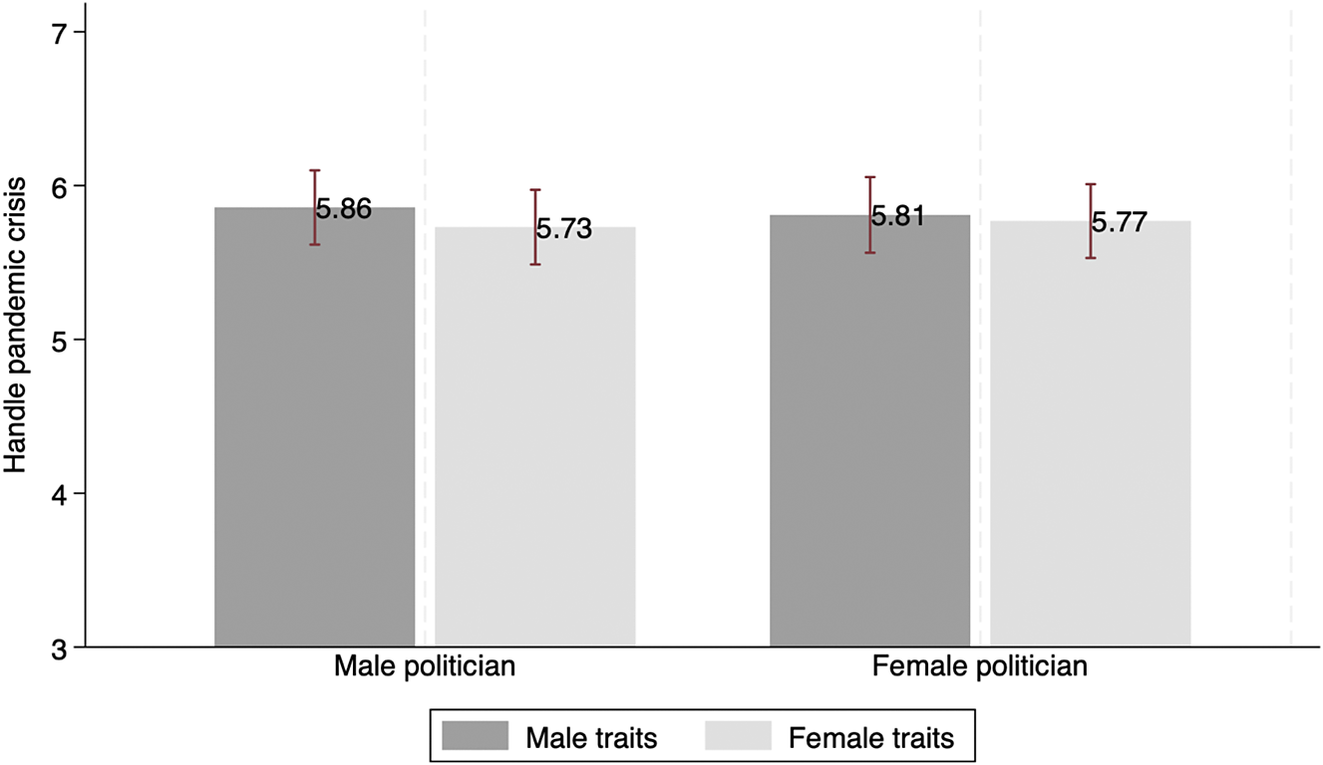
With respect to gender-traits, looking at Figure 2 (right bars), we see that irrespective of the gender of the candidate, having feminine traits did not advantage nor disadvantage the candidate in terms of their perceived competency to handle a pandemic crisis. Therefore, we also do not find support for H1b and H1d.
Gender-traits effects on perceived competence to handle a crisis.
Note: Statistical differences between the male and female traits within: (1) the security crisis |t| = 2.249, p value = .025; |z| = 2.925, p value = .003; (2) the economic crisis |t| = 2.789, p value = .005; |z| = 3.123, p value = .002; (3) the pandemic crisis |t| = 0.681, p value = .496; |z| = 1.101, p value = .271.
We also examined whether gender traits play a different role within different genders. To put it differently, we looked at whether certain traits advantage or disadvantage certain genders. Looking at Figure 3 and the test results, we see that neither masculine nor feminine traits advantage female or male candidates, respectively.
Interaction effects between gender and gender-traits.
Note: Statistical differences between the male and female traits within the candidates’ gender groups: (1) male politician group: |t| = 0.734, p value = .463; MW |z| = 1.027, p value = .304, (2) female politician group |t| = 0.229, p value = .819; |z| = 0.552, p value = .581. Difference-in-differences estimation: |t| = 0.36, p value=.722.
Also, in the context of economic crisis, as can be seen from Figures 1 and 2 (middle bars), there are no gender effects on the evaluation of candidates’ competency to handle this type of crisis. Nevertheless, the effect of gender-traits, which is detectable but small, is statistically significant in the direction of preferred masculine traits. This partially confirms H3.
We have also run multiple regression models to test for the differences across the crisis types, and the core results are reported in the Supplementary Materials (Table A2). In line with the other tests, we find that during the pandemic crisis people are indifferent between male and female politicians, and between masculine and feminine traits. The situation is quite different when it comes to different types of crises. When looking at the interaction effects between experimental manipulation of gender and crisis types, we see that female politicians are disadvantaged when it comes to a security crisis if compared to a pandemic crisis. Also, feminine traits are quite disadvantageous for dealing with a security crisis and even more so with an economic crisis as compared to a pandemic crisis.
However, a more telling picture is derived when looking separately at female and male candidates across crises (Figure 1). For this purpose, we have run ANOVA tests, which allow a comparison of differences in means across more than two groups. When looking at female candidates, not only are they not advantaged vis-à-vis male candidates in the feminine context of a pandemic crisis, but they are also “punished” once the type of crisis is stereotypically male, i.e., national security (F=4.93, p value=.007). On the contrary, when looking at male candidates, they are ranked roughly the same across all three crises, and never lower than the female candidates (F=0.83, p value=.436). Therefore, the data indicate that male candidates are not disadvantaged, even when the crisis is stereotypically feminine (e.g., a health crisis such as the COVID-19 pandemic).
We have also looked separately on feminine and masculine traits across crises (Figure 2). Irrespective of gender, feminine traits lead to a higher rank of competence in the COVID-19 crisis as compared to the context of a national security and an economic crisis (F=4.99, p value=.007). This is not the case for masculine traits, which are perceived the same across crises (F=1.16, p value=.315).
Gender and Gender-Trait Effects by Subgroups of Respondents
We now turn to the effects of candidates’ gender and gender traits on competence to handle a pandemic crisis by subgroups of respondents. First, we examine whether there is gender affinity effect. Looking at Figure 4, it seems that the evaluation of competence is in the predicted direction, i.e., male respondents perceive male candidates as more competent and female respondents perceive female candidates as more competent. However, these differences are not statistically significant, neither for male respondents nor for female respondents. Therefore, we find no support for H4a and H4b.
Gender effects on perceived competence to handle a COVID-19 pandemic crisis by the gender of the respondent.
Note: Statistical differences between the male and female politicians within the groups of (1) male respondents |t| = 1.227, p value = .220; |z| = 1.039, p value = .299, (2) female respondents |t| = 1.026, p value=.305; |z| = 1.232, p value = .218.
We have performed a similar exercise for the other two crises. In brief, for sake of comparison, in the context of national security, male respondents perceive male candidates as more competent in handling such a crisis than female candidates. Female respondents, on the other hand, do not advantage nor disadvantage candidates based on gender. Therefore, it seems that the results in the context of a national security crisis are partially in the direction of the prediction. When evaluating competence in handling an economic crisis, the gender of the candidate does not seem to play a role. Further results are reported in the Supplementary Materials (Figure A1).
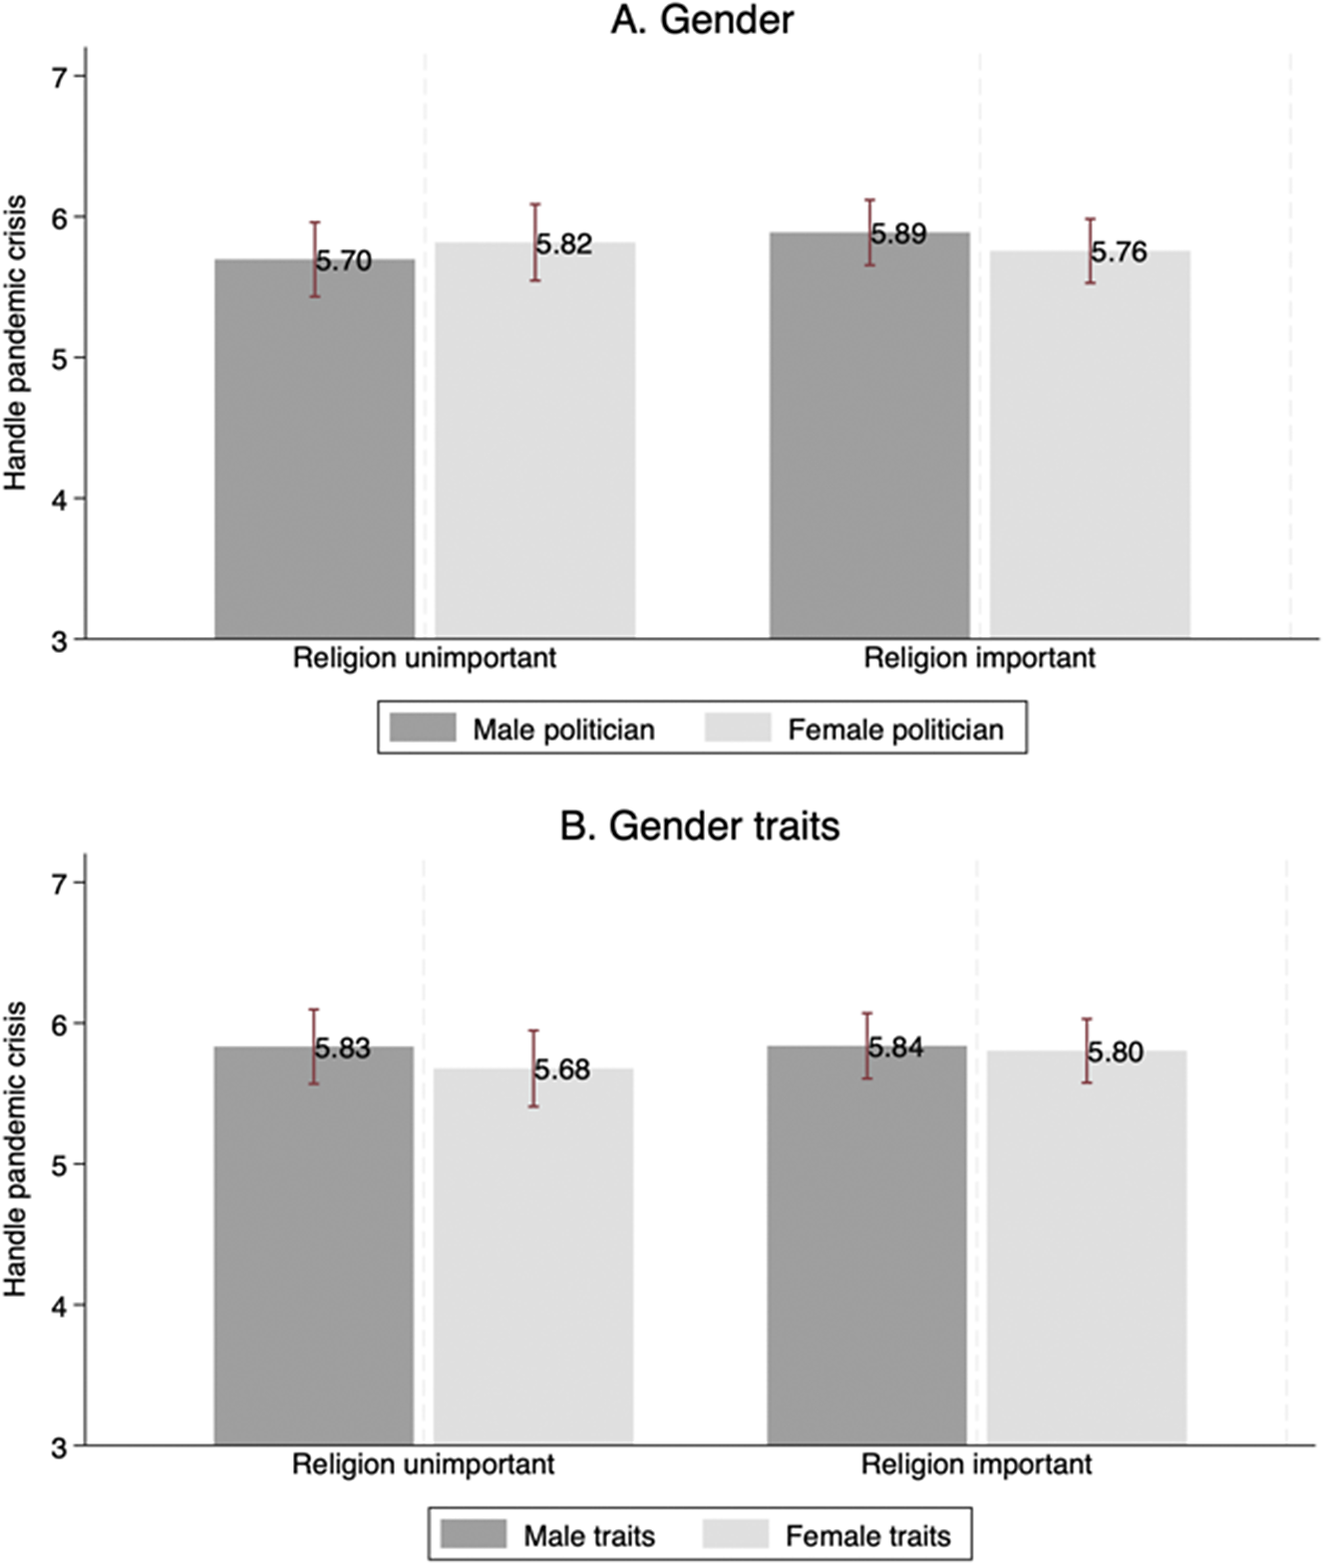
The second subgroup analysis we have performed was based on respondents’ reported level of religiosity. For simplicity, in the text we refer to the two groups as either religious (grouping respondents for whom religion is either important or very important) or non-religious respondents (i.e., for whom religion is not so important or not important at all). It is evident from Figure 5 that respondents’ level of religiosity is not consequential for the assessment of a candidate’s competence to handle a pandemic crisis. Therefore, the results indicate that religious respondents do not perceive female candidates or candidates with feminine traits as less competent than male candidates or candidates with masculine traits to handle a pandemic crisis. Thus, our evidence does not support H5 in the specific context of the COVID-19 pandemic.
Gender and gender-traits effects on perceived competence to handle a COVID-19 pandemic crisis by the level of religiosity of the respondent.
Note: Statistical differences between the male and female politicians within the groups of (1) non-religious respondents (|t| = 0.627, p value = .531; |z| = 0.701, p value = .483), (2) religious respondents |t| = 0.791, p value = .429; |z| = 0.587, p value = .557. Statistical differences between the male and female traits within the groups of (1) non-religious respondents |t| = 0.808, p value = .420; |z| = 1.092, p value = .275, (2) religious respondents (|t| = 0.214, p value = .831; |z| = 0.505, p value = .614.
For the comparative perspective, we also report the results for the other two crises. In a nutshell, in the context of a national security crisis, consistent with the prediction, religious respondents perceive male candidates as more competent to handle this crisis. Interestingly, for non-religious respondents, gender as such does not play a role, but at the same time, they do perceive candidates with masculine traits as more competent to handle a national security crisis. With respect to an economic crisis, gender is not influential in the decision of competence for either group. However, gender-traits are, again, important for the non-religious respondents in the same direction as in the national security crisis. Full results are reported in the Supplementary Materials (Figures A2-3).
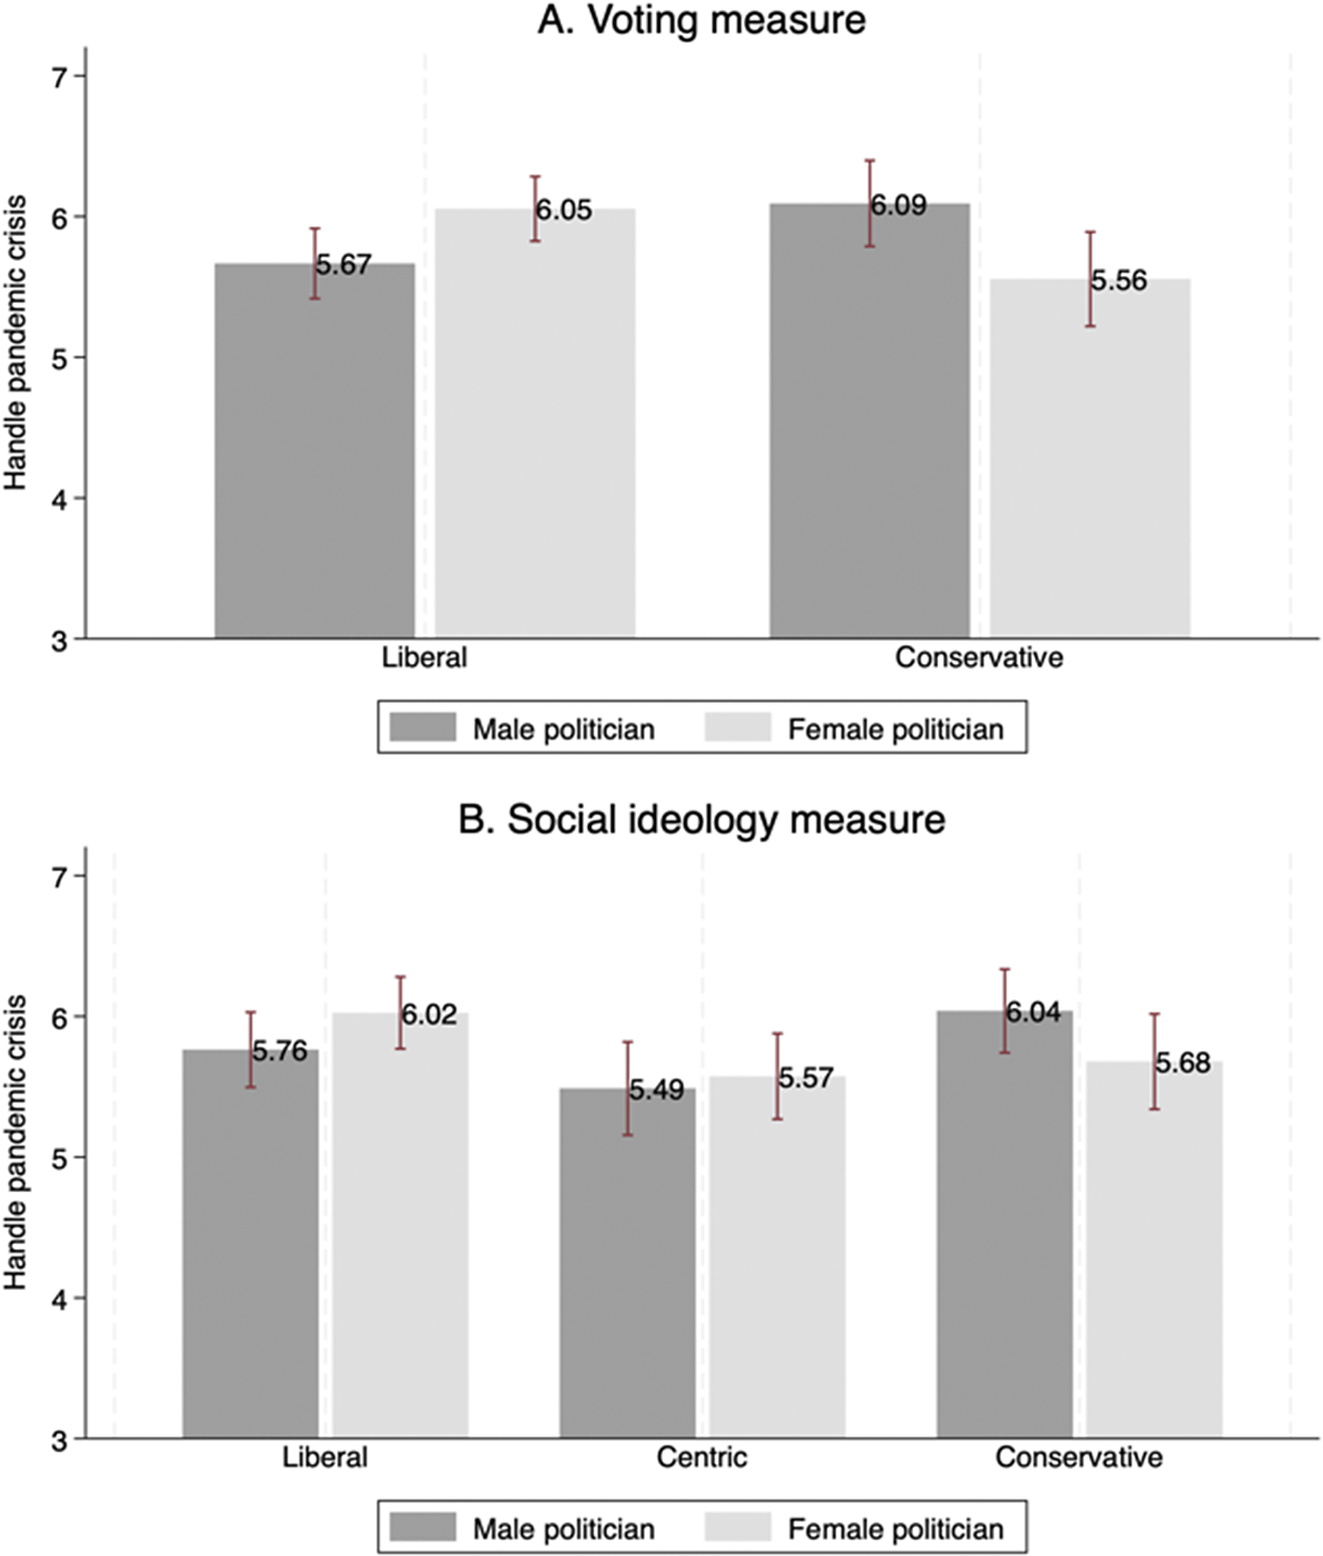
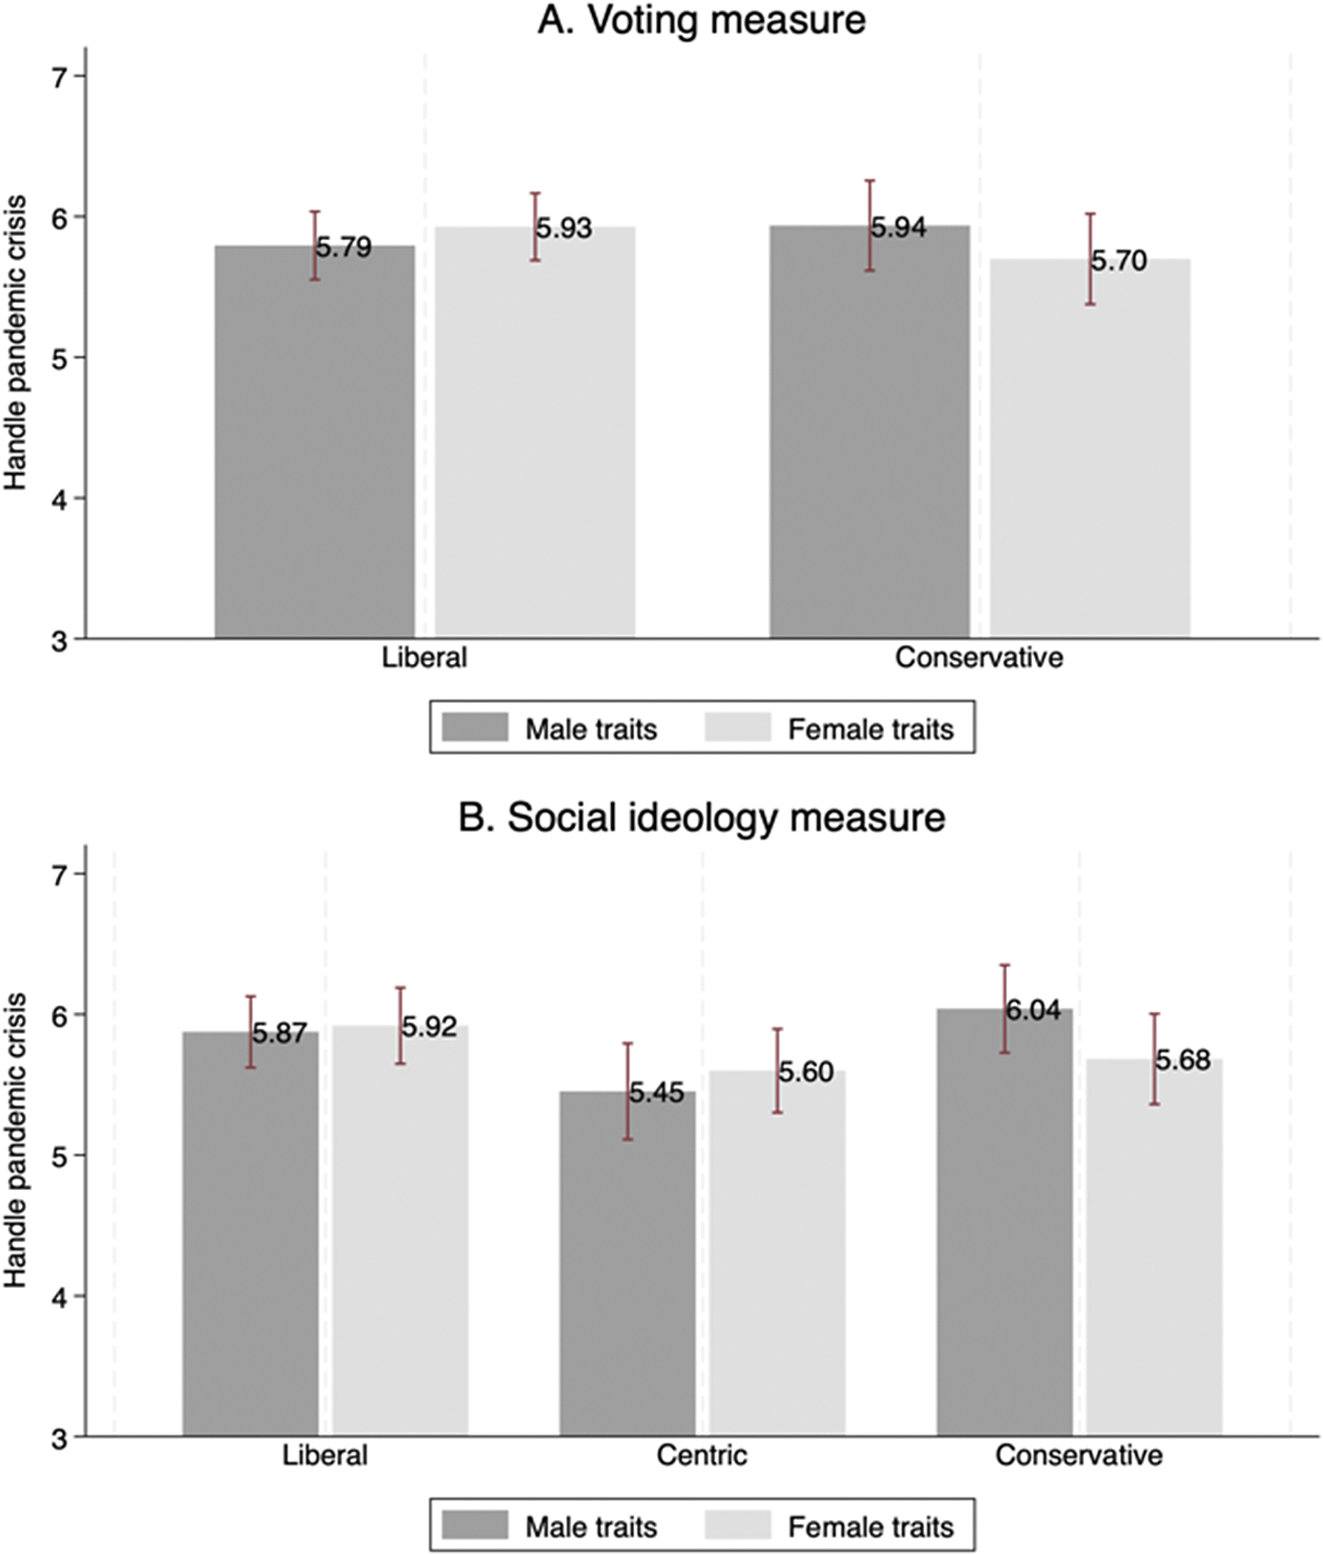
Our final subgroup analysis investigates the moderating effect of ideological stance (conservative versus liberal). We used the reported voting intentions and reported stance on social policy to measure ideology. With respect to the gender of the candidate, we see in Figure 6 that the ideological position as measured by the voting choice is a predictor of the evaluation of competence to handle a pandemic crisis in the predicted direction. Namely, respondents who intended to vote for the liberal candidate rank, on average, the female candidate as more competent. On the other hand, respondents who intended to vote for the conservative candidate rated the male candidate as more competent to handle a pandemic crisis. The direction of these results is supported by the second measure (social ideology position). However, in that case, the differences are not statistically significant. Therefore, we find evidence for H6 but not H7.
Gender effects on perceived competence to handle a COVID-19 pandemic crisis by respondents’ ideology position.
Note: Statistical differences between the male and female politicians within the groups of (1) liberal (Trzaskowski’s) voters |t| = 2.253, p value = .025; |z| = 2.286, p value = .022; (2) conservative (Duda’s) voters (|t| = 2.329, p value = .020; |z| = 2.073, p value = .038). Statistical differences between the male and female politicians within the groups of respondents displaying (1) liberal positions |t| = 1.392, p value = .165; |z| = 1.500, p value = .134; (2) centric positions |t| = 0.378, p value = .705; |z| = 0.509, p value = .611; (3) conservative positions |t| = 1.573, p value = .116; |z| = 1.285, p value = .199.
Two potential channels can explain these results. First, liberal people are more open for gender equality and less stereotypical. Therefore, they are more prone to perceive women as competent leaders. Second, women are perceived as more liberal than men (Alexander and Andersen Reference Alexander and Andersen1993; McDermott Reference McDermott1997) and, thus, might be more supported by liberals rather than conservatives (alignment of assumed ideology). Both explanations are plausible, but given that we did not examine the channel, we are not offering a conclusion on that point.
Now we turn to the gender-traits effect. When looking at Figure 7, we see that the first measure of ideological stance does not predict any difference between the candidates. It means that the gender traits do not advantage or disadvantage candidates when their competency to handle a COVID-19 pandemic crisis is assessed, irrespective of whether the respondent intended to vote for the liberal or the conservative candidate. Similar results appear when using the second measure. There as well, respondents’ ideological stance does not serve as a mediator for the gender-traits effect.
Gender-traits effects on perceived competence to handle a COVID-19 pandemic crisis by respondents’ ideology position.
Note: Statistical differences between the male and female traits within the groups of (1) liberal (Trzaskowski’s) voters |t| = 0.769, p value = .442; |z| = 0.539, p value = .590); (2) conservative (Duda’s) voters |t| = 1.021, p value = .308; |z| = 1.472, p value = .141. Statistical differences between the male and female traits within the groups of respondents displaying (1) liberal positions |t| = 0.235, p value = .815; |z| = 0.013, p value = .990; (2) centric positions |t| = 0.640, p value = .523; |z| = 0.317, p value = .751; (3) conservative positions |t| = 1.560, p value = .119; |z| = 1.804, p value = .071.In order to place the pandemic crisis into perspective, we also examined the perceived competency of the hypothetical candidates in handling a national security crisis (stereotypically male issue) and an economic crisis (not strongly attributed to any of the genders). Gender differences, as such, are in the expected directions (Figure 1 left bars); however they are small and only marginally significant, at the 10% level. Additionally, consistent with the literature, we find that candidates with masculine traits are perceived as more competent to handle a national security crisis than candidates with feminine traits. This difference, also seen in Figure 2 (left bars) and although small, is statistically significant. Therefore, we find partial support for H2.
We again look at the national security and the economic crises for comparison. With respect to a national security crisis, conservative respondents are consistent across the two measures and rate male candidates as more competent to handle this type of crisis than female candidates. However, the positive effect of masculine traits on competence is statistically significant with the social ideology measure, and only marginally significant with the voting measure. With respect to an economic crisis, the results are similar. Conservative respondents evaluate male candidates as more competent to handle an economic crisis than female candidates. This result is consistent across measures. With respect to the gender-traits effect, based on the social ideology measure, conservative respondents rank masculine candidates as more competent. The voting measure goes in the same direction, but it is not statistically significant. For the full results, see the Supplementary Materials (Figures A4-7).
As an exploratory exercise, we also looked at whether there exist any differences in how younger and older respondents perceive leaders’ gender and gender traits. Because this analysis was not pre-registered, we report the results in the Supplementary Materials (Figures A8-9). Briefly, age does not play a role in the perception of gender and gender-traits with respect to competence to manage a pandemic crisis.
Discussion
In this section, we discuss the results and their implications. We start by summarizing our findings in Table 3.
Summary of results
When pooling all participants together, a “pure” gender bias with respect to general competency to manage a crisis was not found. In addition, despite our initial assumption that COVID-19 is a “feminine crisis,” stereotypically feminine traits were not perceived as more (or less) important than stereotypically masculine traits to handle, specifically, a pandemic crisis. However, masculine traits led to more positive evaluations of competence regarding a national security crisis, as well as an economic crisis. This suggests that gender-trait bias persists in the context of the more traditionally male policy areas. Finally, when looking from the comparative perspective, we see that stereotypically feminine traits do play a positive role in the context of a pandemic crisis as compared to the other two types of crises. This suggests that, even though participants do not perceive COVID-19 as a pure “feminine crisis,” they do perceive it as a more “feminine crisis” than national security and economic crises.
Our results, combined with previous findings of the “penalties” women pay for possessing stereotypically masculine traits, may suggest the persistence of the double bind effect. Traits which are often associated with women are not perceived more positively than stereotypically masculine traits in the context of a potentially “feminine crisis,” or at least in a crisis which is more feminine than other crises. At the same time, such traits are perceived negatively in the context of other crises. Hence, there seems to be no terrain where women leaders can be advantaged.
Contrary to some of the previous studies, in the context of the COVID-19 pandemic, we do not find supporting evidence for the affinity effect. Neither men nor women perceive political leaders more favorably who belong to their gender group. However, in the traditionally male domain, national security, male participants do perceive male candidates as more competent.
Religiosity does not play a role in the context of the COVID-19 pandemic, but it is consequential for a national security crisis, where male leaders are perceived as more competent by more religious participants. Furthermore, even the less or non-religious participants perceive stereotypically masculine traits more favorably in the context of managing national security and economic crises. With respect to ideology, participants voting for the conservative candidate in the real elections perceive male candidates as more competent to manage any type of crisis, even a pandemic crisis. Liberal participants perceive male candidates to be more competent to handle a national security crisis. These results demonstrate the double bind problem for women, who are not advantaged when an issue can benefit from stereotypically feminine traits, and at the same time disadvantaged on issues traditionally within the male purview.
Conclusions
The situation of a global pandemic crisis posed new challenges to national leaders. Unlike other crises familiar to the current generations, such a crisis demanded a different approach. The adopted measures did not target only particular groups, but the entire population. This crisis was a large-scale coordination game. Therefore, it may have also required a different set of skills than traditionally expected from leaders. Salient examples of female-led nations which managed the COVID-19 pandemic successfully, and the perception that this was a “feminine crisis,” raised the question of whether women would be perceived as more competent to handle such a crisis. Consequently, the COVID-19 pandemic crisis offered a new context in which researchers could investigate the issue of gender stereotypes and political leadership, the focus of this paper.
Unlike with a national security crisis, where male and masculine candidates are ranked as more competent, and an economic crisis, where masculine candidates are ranked more competent, we find no evidence for the effect of gender or gender-traits on the evaluation of competence to manage a pandemic crisis such as COVID-19. We also do not find moderating effects of participants’ gender and level of religiosity, even though such moderating effects are found in the context of a national security crisis and an economic crisis. The only moderating effect is found for the ideological position of the respondents, in the predicted direction, where the respondents identifying themselves with the conservative presidential candidate disadvantage female candidates, also with respect to the pandemic crisis.
These results confirm the need for a more nuanced look at different types of crises (Davidson-Schmich et al. Reference Davidson-Schmich, Jalalzai and Och2023; O’Brien and Piscopo Reference O’Brien and Piscopo2023; Kroeber and Dingler Reference Kroeber and Dingler2023) rather than assuming all crises have the same result for the gender-leadership question. However, it seems that the findings do not constitute good news for female political candidates. The pandemic crisis was the closest to being perceived as a feminine crisis, where women might have been expected to perform better than men. This is contrary to international and national terrorism and economic crises, evident in recent years in many countries around the world. Yet even though male or masculine leaders are still perceived as somewhat more competent in managing the latter crises, women and feminine candidates did not receive any advantage in the potentially “feminine crisis.” They are even disadvantaged in the pandemic context by conservative respondents by potentially being perceived as less competent to manage a national crisis as such. As correctly stated by Lawless (Reference Lawless2004) “[i]f women fare as well as men when the political climate is dominated by issues that play to women’s stereotypical strengths but are disadvantaged when [a] ‘men’s issue’ dominates the political agenda, then we must reconsider the conclusion that ‘winning elections has nothing to do with the sex of the candidate.’” (480). Our results seem to confirm the theoretical argument made by Davidson-Schmich et al. (Reference Davidson-Schmich, Jalalzai and Och2023) that “for men, social role incongruency does not elicit the same degree of backlash.”
To the best of our knowledge, this is the first study to empirically investigate gender bias versus gender-trait effects in political leadership during a pandemic crisis. Despite its importance, future research should examine this question in other countries. Different characteristics of the societies may play a role in the evaluation of leaders’ competence. For example, due to a long period in which Poland has been under a socialist regime, a more egalitarian view has been promoted (Gaweda Reference Gaweda2021). This led to larger share of women leaders in politics as well as business in Poland as compared to other democracies (Fuszara Reference Fuszara, Franceschet, Krook and Tan2019; Jarska Reference Jarska2019). On the other hand, the level of religiosity in this country is high as compared to other democracies. Those two features may have played a role in how people perceive women leaders, or leaders with stereotypically feminine traits. In order to examine the generalizability of our results, similar studies should be conducted in other countries, which have different track records of women in leadership positions. Such research will help to establish whether the persistence of the double bind can be found across different countries or is restricted to certain societies.
In addition, we used a low-information setting, varying only gender and traits, to make them salient informational cues for the decision and to activate stereotypical assessment of the candidates (McDermott Reference McDermott1997; Sanbonmatsu Reference Sanbonmatsu2002; Bauer Reference Bauer2015). We did not provide the candidate’s political affiliation, a feature which was found in the literature to outweigh other factors (Rahn Reference Rahn1993; Bartels Reference Bartels2000; Hayes Reference Hayes2011). In Poland, the electorate votes for the party, but the winning party eventually nominates the candidate for the prime minister from within its members. Therefore, similarly to the American primaries, candidates who compete for this nomination have the same political affiliation. Even though our results are relevant, in order to examine whether gender bias persists, future research should include party affiliation.
Supplementary material
The supplementary material for this article can be found at http://doi.org/10.1017/S1743923X24000369.
Acknowledgements
We would like to thank the anonymous reviewers and the editor for their comments and support.
Data
The data and the replication files can be accessed on https://osf.io/jyq5k/.
Competing interest
The authors have no competing interests to declare.


 Open access