

Obesity is a significant public health challenge in both developed and developing countries( Reference Ng, Fleming and Robinson 1 ). Accumulating evidence suggests that portion sizes – that is, the amount of a food item consumed on a single eating occasion – have increased over the last several decades and have contributed to increased population energy intake and the obesity epidemic( Reference Duffey and Popkin 2 , Reference Nielsen and Popkin 3 ). Expanding portion sizes of energy-dense, nutrient-poor, highly processed packaged products such as sugar-sweetened beverages (SSB) and salty snack foods are particularly concerning( Reference Nielsen and Popkin 3 , Reference Kerr, Rennie and McCaffrey 4 ), as there is widespread consensus among dietary guidelines to limit intake of such ‘discretionary’ foods( 5 , 6 ). Thus, there is an urgent need to identify effective approaches that can aid consumers to reduce the portion size of discretionary foods, as part of an overall public health goal to limit intake of such foods and shift towards a healthier population dietary pattern.
Nutrition labelling on packaged foods is a widely promoted public health strategy aimed at providing an enabling environment for healthier consumer choices( Reference Hawkes, Smith and Jewell 7 ). Declared serving size is a mandatory part of nutrition labels in many different countries, including Australia( Reference Hawkes 8 ). However, little research has been carried out to evaluate the effect of such labels on consumer preferences( Reference Faulkner, Pourshahidi and Wallace 9 ). Limited evidences from controlled laboratory studies suggest that consumers may alter the amount of food they serve for themselves and others when exposed to various declared serve sizes( Reference Dallas, Liu and Ubel 10 ). However, whether such findings are generalisable to real consumption settings remain unclear. Previous evidence also suggests that many consumers have difficulty interpreting and using declared serving sizes( Reference Rothman, Housam and Weiss 11 ). The potential for declared serving size to provide guidance to consumers on what constitutes an appropriate portion size therefore remains unclear. Serving size declarations also directly influence other nutrient information that is presented on a per serving basis. Recognising the likely contribution of large portion sizes to over-consumption, policy makers and food companies are increasingly providing recommendations for declared serving size on nutrition labels. For example, in both the USA and Australia, recent government recommendations have suggested that if a product is packaged in a size such that it could reasonably be expected to be consumed at a single sitting (i.e. a single-serve product), then the declared serving size should be the same as the package size( 12 , 13 ).
Despite the potential of declared serving size to encourage appropriate portion size consumption, many countries including Australia have not developed clear reference guidelines for serving size, which are therefore left at the discretion of food manufacturers( Reference Roberto and Khandpur 14 ). There is some evidence to suggest that there are substantial inconsistencies in the declared serving sizes of packaged foods in Australia( Reference Cleanthous, Mackintosh and Andersen 15 ), including for discretionary products such as SSB( Reference Poelman, Eyles and Dunford 16 ). This has led to concerns of causing confusion among consumers due to disparate serving size declarations for otherwise nutritionally similar products. Such problems could be further compounded by the influence of serving size variability on nutrient profiling schemes (e.g. traffic lights) that use per serving nutrient values to determine the overall healthiness of products( Reference Roberto and Khandpur 14 ). Very few studies have conducted in-depth examinations of how manufacturer serving size declarations are implemented in Australia. To address these important gaps in knowledge, we conducted a comprehensive evaluation of the declared serving size within fifteen categories of commonly consumed discretionary foods and beverages in Australia. Our primary objectives were to describe the variability in serving sizes across discretionary food categories, assess the degree to which manufacturer-declared serving sizes are aligned with government recommendations and to provide an empirical evaluation of how variations in manufacturer-declared serving size could impact specific nutrient profiling schemes.
Methods
Data collection
Nutritional information (including reported serving size) was obtained from the Nutrition Information Panel (NIP) for all packaged food and beverage products available for sale between July and September 2013 at four large supermarket stores (Coles, Woolworths, ALDI, IGA) in Sydney, Australia, and recorded in The George Institute for Global Health’s branded food database, according to standardised methods and quality assurance procedures( Reference Trevena, Neal and Dunford 17 – Reference Dunford, Webster and Metzler 19 ). The four supermarkets where packaged foods were sampled are a mix of large (Woolworths and Coles), discount (ALDI) and independent (IGA) retail supermarket stores. Woolworths and Coles hold between them 73 %, ALDI 10·3 % and IGA 9·5 % of all grocery (inclusive of food and non-food) spent in Australia( 20 ). For each food product, the product name, brand name, manufacturer, nutrient information/100 g or 100 ml, ingredients and reported serving size (as consumed) were recorded. We excluded from the study variety packs with multiple NIP displayed.
Discretionary food categories
Products were categorised (based on their name) according to the 2013 Australian Dietary Guidelines (ADG)( 6 ) into fifteen discretionary food categories: processed meat; chocolate-based confectionery; sweet biscuits; cakes and muffins; crisps and snacks; jam, marmalades, honey and syrup; non-alcoholic beverages; sugar-based confectionery; ice cream, frozen yogurt and edible ices; pastries; dairy desserts; protein and diet bars; frozen potato products; and cream and butter. Classification of products was at the minor group level (details of foods included in each food category are shown in the online Supplementary Table S1).
Australian Dietary Guidelines, policy initiatives and nutrient profiling schemes relevant to this evaluation
-
(1) Although there are no agreed reference serving sizes for specific discretionary foods in Australia, the 2013 ADG suggests one ‘standard serve’ of a discretionary food as the amount that contains about 600 kJ of energy( 6 ). The standard serve defines the equivalent serving size that provides similar levels of energy and nutrients for different foods within the same group, and thereby allows health agencies to translate dietary guidelines into practical advice to compose a healthy diet( 6 ). For example, the 600 kJ standard serve translates to a standard serve size of 75 and 25 g for ice creams and chocolates, respectively. Although the ADG standard serve for discretionary foods is not designed to be a reference to define manufacturer-declared serving size, for the purpose of the present analyses, we used it as a benchmark to identify declared serving sizes that could be considered as inappropriately large (i.e. products with a declared serving size >600 kJ).
-
(2) A relevant policy initiative identified was the Food and Health Dialogue (FHD). The FHD was established by the Australian Government in 2009 with the aim of partnering with the food industry to improve the nutritional content of commonly consumed foods through the reformulation of products, and also provides guidance for declared serving sizes in similar foods. One of the FHD principles for declared serving size states that ‘multiple serve items should consist of appropriate serve sizes in relation to single serve packs’( 12 ). In addition, the FHD also suggests that if a product is packed in a way that it can be reasonably expected to be consumed by the target market in one serving, then the declared serving size should be the same as the package size.
-
(3) Using a case-study approach, we reviewed multiple nutrient profiling schemes used to classify the healthiness of foods that are currently in use in Australia( 21 – Reference JC-Y, Flood and Rangan 23 ). We ascertained that each of the schemes reviewed used a per serve nutrient-based algorithm for multiple discretionary food categories, and therefore could potentially be influenced by variability in declared serving size. For illustrative purposes, we chose one of the traffic light schemes (Fresh Tastes @ School guidelines, FTAS)( 21 ), in order to assess how variability in serving size may affect the classification of discretionary foods. The FTAS guideline was developed by the government of New South Wales (a state in Australia) to enable school canteens to procure healthier products, and specifically recommends canteens to limit the sale of products that are classified as ‘red’ under the FTAS criteria( 21 ).
Statistical analysis
Summary statistics for declared serving size are presented as medians and interquartile ranges (IQR) (unless otherwise stated) as not all categories were normally distributed, using weight (g) for solid foods or volume (ml) for liquids/beverages. If a product was available in multiple package sizes, we randomly selected one product for inclusion in analyses 1, 3 and 4.
Analysis 1
The serving size as declared by the manufacturer on packaged food labels was compared with the ADG standard serve for discretionary food by calculating the percentage difference between energy per serve and the ADG-defined 600 kJ/standard serve( 6 ).
Analysis 2
To assess the variability of declared serving size by product across different package sizes, we identified products with three or more different package sizes and assessed the variability in declared serving size (median percentage difference between the minimum and maximum serving size across the package sizes).
Analysis 3
We identified single-serve packs as products with a total package size equal to or less than the ADG standard serve (approximately 600 kJ). This was equivalent to 25 g (half a bar) for chocolate-based confectionery, 40 g (five to six small pieces) for sugar-based confectionery, 30 g (half-sized packet) for crisps and snacks and 375 ml (one can of SSB) for non-alcoholic beverages. For each of these categories, we calculated the proportion of products with a declared serving size equal to or less than the package size.
Analysis 4
To illustrate the potential effect of serving size variation on nutrient profiling schemes, we classified products into three categories – that is, SSB, ice creams and savoury snacks – as ‘red’ or ‘non-red’ according to nutrient criteria for the FTAS system: for SSB, a product is classified as red if it contains >300 kJ of energy or >100 mg Na per serve; for ice creams, energy >600 kJ or SFA>3 g per serve; and for savoury snacks, energy >600 kJ or SFA>3 g or Na>200 mg per serve. Subsequently, we compared the distribution of energy for red v. non-red products on a per 100 g or per 100 ml basis.
All analyses were conducted using Stata (release 13.1; StataCorp LP).
Results
There were 4466 unique products identified across the fifteen discretionary categories analysed in this study (Table 1). The largest categories included the following: processed meats (n 774, 17 %), chocolate-based confectionery (n 556, 12 %) and sweet biscuits (n 486, 11 %). Conversely, there were relatively few protein bars, frozen potato products, cream and butter items (all n≤100 products, ≤2·2 %).
Summary statistics for declared serving sizes and energy per serve for 4466 unique products across fifteen discretionary food categories identified from four major Australian supermarkets (Medians and interquartile ranges (IQR))

* All units are in grams except for non-alcoholic beverages, which are in millilitres.
Variability of serving size within product categories
Substantial variability in the declared serving size was observed for several discretionary food categories (Table 1; Fig. 1). For example, among 347 non-alcoholic beverages, the median for serving size was 250 (IQR 250, 355) ml, and the range observed was between 100 and 750 ml. However, serving size was much more homogeneous for other product categories including butter, with a median value of 5 (IQR 5, 5) g, and for jam, marmalade, honey and syrup it was 15 (IQR 15, 20) g. As expected, large variability was also observed in energy per serve for product categories with a wide range of serving size – for example, the median energy per serving size for cakes and muffins was 835 (IQR 606, 1212) kJ.
Declared serving size distribution by discretionary food category. The box represents the interquartile ranges (IQR), the horizontal line in the box is the median and the whiskers are the values within 1·5 times the IQR. Values outside of this range are marked as dots. Plots are shown for the six categories with the largest IQR in the current analyses.

Comparison with Australian Dietary Guideline standard serve
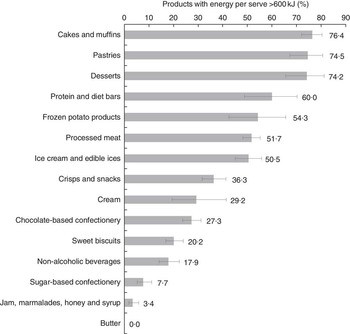
Seven out of the fifteen categories analysed in this study had ≥50 % of products with energy per serving above the ADG discretionary food standard serve of 600 kJ, including cakes and muffins (76 % of products with energy/serve >600 kJ), pastries (75 %), desserts (74 %), protein and diet bars (60 %), frozen potato products (54 %), processed meats (52 %) and ice cream, frozen yogurt and edible ices (51 %) (Fig. 2).
Percentage of products and 95 % CI by discretionary food category with declared serving size above the Australian Dietary Guideline standard serve size (600 kJ).
Multiple package sizes for the same product
Four of the discretionary food categories included unique products with three or more different package sizes (Table 2). The median percentage difference between the minimum and the maximum serving size for products with multiple package sizes ranged from 183 (IQR 150) % for chocolate-based confectionery to 31 (IQR 23) % for sweet biscuits. For example, for Cadbury Cherry Ripe Chocolate, the largest package size (216 g) had a declared serving size of 18 g, whereas the smallest package size (52 g) had a serving size of 52 g, a difference of 189 %. Similarly, in the non-alcoholic beverages category, Coca-Cola of 2-litre package size had a declared serving size of 250 ml, whereas a 375 ml can had a serving size of 375 ml, a difference of 50 %.
Median percentage difference between the smallest and the largest declared serving size for the same product with multiple different pack sizes (Medians and interquartile ranges (IQR))
Single-serve products and declared serving size
For foods commonly consumed as snacks, we identified single-serve packs as products with a total package size equal to or less than the ADG standard serve (approximately 600 kJ), and then evaluated the consistency between declared serving size and package size for these products. Overall, the majority of declared serving sizes was equal to the package size in sixty-two (65 %) of ninety-five identified single-serve products (Table 3). For the other thirty-three products (35 %), all had serving size labels smaller than the total package size. Some heterogeneity was observed between product categories. For example, the declared serving size was equal to the package size for nine out of eleven (82 %) single-serve chocolate-based confectionery products and for only eight out of twenty-six (31 %) single-serve sugar-based confectionery products. We found similar results in a sensitivity analysis, where we included products up to 50 % larger than the ADG standard serve (i.e. for chocolate-based confectionery, those with a total package size up to 50 g; results not shown).
Proportion of products with declared serving size equal to or less than the Australian Dietary Guideline (ADG) standard serve amount for discretionary foods (equivalent to 600 kJ), in categories of foods and beverages frequently consumed as single-serve items (Numbers and percentages)
* All units are in grams except for non-alcoholic beverages, which are in millilitres.
† Products with a package size equal or less than the estimated single serving size.
Effect of serving size variability on nutrient profiling
The effect of serving size variability on the FTAS product classification system was explored in three product categories – SSB (i.e. excluding sugar-free, non-alcoholic beverages), ice creams and savoury snacks (Table 4). We found that within each discretionary food type, products with similar nutrient profiles received different traffic light ratings. For example, for the fifty SSB products with similar energy content that ranged between 133 and 180 kJ/100 ml, their energy per serve actually varied between 149 and 656 kJ/serve due to serving size variability. Therefore, when these products were classified according to FTAS cut-off points (>300 kJ/serve receives a red light), forty-one (82 %) received a red traffic light, while the other nine (18 %) did not. This can be further illustrated by comparing individual products – for example, Coles Pineapple & Mango Mineral Water (194 kJ/100 ml, declared serving size of 250 ml) received a red traffic light rating under FTAS, while Santa Vittoria Chinotto (195 kJ/100 ml, declared serving size of 100 ml) did not. Similar findings were also observed for ice creams and savoury snacks.
Number of sugar-sweetened beverages (SSB), ice creams and savoury snack products classified as ‘red traffic light’ according to the Fresh Tastes @ School (FTAS) guidelines for school canteens’ menu planner in New South Wales, AustraliaFootnote * (Numbers and percentages)
* According to FTAS, a SSB product is classified as ‘red’ if it contains >300 kJ energy/serve or >100 mg Na/serve. From the 347 SSB included our data set, we identified a subset of 237 products whose Na content was ≤100 mg/serve. For these products, the traffic light rating is therefore solely dependent on their energy per serve. Similar approaches were used to identify subsets of ice cream and savoury snack products whose FTAS classification is solely dependent on their energy per serve. Products within food categories were then divided into quintiles according to their energy/100 ml or 100 g to identify products of similar energy density. Products within energy quintiles were then classified using the FTAS energy criteria.
† In millilitres (for SSB) or grams (for ice creams and savoury snacks).
‡ Sugar-free, non-alcoholic beverages were excluded from this category for this analysis.
Discussion
In this cross-sectional analysis of almost 4500 packaged discretionary food and beverage items in Australia, we observed large variability in manufacturer-declared serving sizes within almost all discretionary categories examined, including for identical products available in multiple package sizes. We further found that a substantial proportion of products had declared serving sizes that exceeded the ADG standard serve for discretionary foods, and identified discrepancies between declared serving sizes for single-serve products and products with multiple package sizes and government recommendations. Finally, these results highlighted the potentially misleading effects of disparate declared serving sizes on nutrient profiling systems that are currently used in some institutions to classify the healthiness of food products.
Accumulating experimental and observational evidence supports a link between excessive portion sizes, particularly for discretionary foods, and the obesity epidemic( Reference Rolls 24 ). Although it has been suggested that manufacturer-declared serving size on packaged foods could educate consumers on appropriate portion size selection, its effect on consumer behaviour remains little investigated( Reference Roberto and Khandpur 14 ). Although limited experimental studies suggest drawing participants’ awareness to serving size recommendations can change portion selection( Reference Dallas, Liu and Ubel 10 , Reference Versluis, Papies and Marchiori 25 ), such findings may not be generalisable to real-world settings where consumers may not use, or have difficulty interpreting, food labels. Our results suggest that, in practice, high variability in declared serving size – for example, with up to 200 % difference between the smallest and the largest reported serving size for the same product available in multiple package sizes – may confound interpretation and understanding even for consumers interested in using declared serving size to understand and control portion sizes.
Discretionary products that can reasonably be consumed at a single eating occasion, such as chocolate confectionery and potato chips, are popular snack foods( Reference Jahns, Siega-Riz and Popkin 26 , Reference Astrup, Bovy and Nackenhorst 27 ) that are ubiquitous in the food environment( Reference Farley, Baker and Futrell 28 , Reference Lucan, Karpyn and Sherman 29 ). In order to clarify for consumers the energy and nutrient contents of these types of products, nutrition guidelines (e.g. the FDA Nutrition Facts label and the Australian FHD) have mandated or recommended that the declared serving size should equal the entire package size( 12 , 13 ). Our findings suggest reasonable compliance of Australian manufacturers with the Australian guidelines, although for 35 % of the products their serving size was smaller than the total package size, that is, multiple servings declared in a ‘single-serve’ package. Declaring smaller serve sizes for single-serve packaged products could cause over-consumption due to ‘health framing’ – whereby consumers perceive such products as ‘healthier’ than a similar product with a larger declared serving size, which may subsequently result in excess consumption of such items due to the health halo effect( Reference Mohr, Lichtenstein and Janiszewski 30 ). Although in Australia the nutrient values per 100 g or per 100 ml are available and could be used to compare products, many consumers prefer the per serving size label format, which is also the only option available on nutrition labels in some countries( Reference Hawkes 8 , Reference Mandle, Tugendhaft and Michalow 31 ). Our findings therefore further reinforce the importance of standardising declared serving size.
Despite national and international dietary guidelines that consistently advocate for reductions in discretionary food consumption( 5 , 6 ) to lower the risk of obesity and chronic diseases, current levels of intake remain high in many parts of the world, including Australia. For example, discretionary foods contributed to approximately 35 % of daily energy intake in Australia based on the 2011–2012 Australian Health Survey( 32 ). These high levels of discretionary food intake underscore the fact that other factors also influence food and drink consumption, such as the food environment, food prices and labelling. Our finding that the majority of discretionary products have declared serving sizes greater than the ADG standard serve of 600 kJ/serve is concerning, as such declared serving sizes may encourage over-consumption of discretionary food portions. These results indicate the disconnect between some discretionary food labels and prevailing health advice to reduce intake of these foods, and emphasise the need to adopt policy efforts to standardise declared serving sizes to encourage reduced energy intake from discretionary foods.
Nutrient profiling schemes that convert numeric nutrient information into easy-to-interpret symbols (e.g. traffic lights) are increasingly endorsed and used by the food industry( Reference Roberto and Khandpur 14 ). Such interpretive schemes have also been adopted by government agencies to assist with dietary guidance and food procurement choices; thus, their accuracy will significantly impact on individual consumer and even community dietary choices. Our results show that even for products with very similar nutrient content, some discretionary products are interpreted as healthier than others, solely due to their declared serving size on packages, which can be misleading to the consumer. Nutrient profiling schemes evaluated on a per serving basis are not only used in Australia but also in other countries such as South Korea( 33 , 34 ). Our findings suggest that in order to improve the accuracy of these nutrient profiling schemes and to allow a more reliable comparison between products, industry and government should either standardise declared serving size labels or evaluate nutrients based on per 100 g or 100 ml as reference.
In the absence of government regulation, it is not clear how declared serving size values are determined by manufacturers in Australia. Instead, voluntary food industry targets have been set for a limited number of discretionary products, including for chocolate/sugar confectionery (25 g) and beverages (serving size equals total package size if total package size is ≤600 ml, and serving size of 250 ml if total package size is >600 ml)( 35 ). In this analysis, although the declared serving sizes centred around the voluntary targets, substantial variability was still observed in these food categories, suggesting incomplete uptake. Overall, our findings highlight the need for serving size guidelines across discretionary food and beverage categories, due to the observed degree of variability, the proportion greater than the ADG discretionary standard serve and anomalies observed with nutrition profiling schemes using declared serving sizes. Such guidelines could potentially be based on energy content cut-off limits; such an approach would require the limits to be relevant to the type of discretionary products to avoid perverse outcomes, that is, serving sizes perceived as promoting larger portion sizes. Another approach would be to use household food consumption survey data of typical portion sizes consumed, which could be determined based on recent Australian dietary surveys( 32 ), that is, the reference amounts customarily consumed approach used by the US FDA( Reference Taylor and Wilkening 36 ). Regardless of the approach, caution is required that any guidelines for declared serving size for discretionary foods are not perceived by the food industry as a need to increase smaller single-serve packages or consumers to increase their smaller portion sizes, but instead considered a cap or upper limit to avoid excessive portion sizes. Development and implementation of guidelines will also require robust monitoring to determine adherence, particularly if a voluntary implementation model is adapted.
Our study has several strengths. It is the most recent survey of packaged discretionary foods in Australia and the findings are consistent with previous studies, showing high variability in declared serving sizes( Reference Vartanian and Sokol 37 – Reference Watson, Kury and Wellard 39 ). We also included a much larger number of products across a wider range of discretionary food categories than previous studies. We utilised rigorous and validated sample collection and data entry methods( Reference Trevena, Neal and Dunford 17 , Reference Dunford, Trevena and Goodsell 18 ), and the large number of products collected from the leading Australian retailers ensured a high level of market coverage for commonly consumed Australian packaged foods. The limitations of our study should also be considered. Owing to the lack of agreed standardised serving size for single-serve food products in Australia, we used the ADG 600 kJ standard serve for discretionary foods as an ‘upper limit’ and to identify single-serve snacks and beverages, and it should be noted that declared serving sizes <600 kJ, and portion sizes for that matter, are not considered ‘low’ or expected to be increased to the 600 kJ standard serve value. Our product survey was only carried out in Australian supermarkets, and therefore our results may have limited generalisability to other countries.
To conclude, our data demonstrated that large variability in declared serving sizes in discretionary food and beverage items in Australia is the norm in the absence of a strong regulatory environment, which may reduce the effectiveness of serving size guidance. The use of standardised serving size based on a reference serving size could create an enabling environment that aids consumers to select more appropriate portion sizes to reduce over-consumption and obesity. Future research is urgently needed to assess the benefits and limitations of developing and implementing such standards in Australia and globally.
Acknowledgements
The authors thank Michelle Crino for her assistance with data extracts.
This work was supported by the National Heart Foundation Focus grant (FG-100754). B. N. is supported by an Australian Research Council Future Fellowship (DP100100295) and a National Health and Medical Research Council (NHMRC) of Australia Senior Research Fellowship (APP100311). He holds an NHMRC Program Grant (APP1052555). B. N. and J. H. Y. W. work within the NHMRC Centre for Research Excellence (APP1041020). H. T. is supported by a postgraduate scholarship from the NHMRC. E. D. is supported by an NHMRC early-career fellowship.
H. H., B. N., E. D., V. F., A. R., B. T., X. C., H. T., J. M. Z., J. C. Y. L., T. G. and J. H. Y. W.: study concept and design, interpretation of data, critical revision of the manuscript for important intellectual content and approval of final version of the manuscript for submission; J. H. Y. W., V. F., T. G. and B. N.: obtained funding; H. H., H. T. and B. N. conducted research, acquisition of data and statistical analyses; H. H. and J. H. Y. W. drafted the manuscript and had primary responsibility for the final content.
The authors have no conflicts of interest to disclose.
Supplementary Material
For supplementary material/s referred to in this article, please visit http://dx.doi.org/doi:10.1017/S0007114516000799


