


Introduction
It is likely that climate change in the coming decades will lead to the most rapid environmental changes that have occurred in Iceland for many centuries (Reference Björnsson and PalssonBjörnsson and others, 2008), with widespread retreat and thinning of ice caps and glaciers as a consequence. Glaciers in Iceland store a total of ∼3600 km3 of ice and cover ∼11 000 km2, corresponding to ∼ 1 1% of the area of the country, and are retreating and thinning rapidly at present (annual reports of glacier variations in Iceland are published in the journal Jökull) (Reference Björnsson and PalssonBjörnsson and Palsson, 2008; Reference SigurðssonSigurðsson, 2011). The downwasting of the glaciers is projected to intensify during the coming decades, leading to their almost complete disappearance within the next 150-200 years (Reference AðalsgeirsdottirAðalgeirsdottir and others, 2011; Reference JóhannessonJóhannesson and others, 2012). This will have a large effect on glacier runoff, which is simulated to increase by >50% between 1961-90 and the mid-21st century, with substantial implications for design assumptions and operational plans for Icelandic hydropower plants (Reference Sveinsson, Linnet, Elıasson, Thorsteinsson and BjörnssonSveinsson and others, 2012). Subglacial watercourses and outlet locations of many glacial rivers are also likely to change due to the thinning of ice caps and the retreat of glacier margins which will affect infrastructure (e.g. roads, bridges and power and telecommunication lines) in many areas (Reference Björnsson and PalssonBjörnsson and others, 2008). Total melting of all glaciers in Iceland would lead to a ∼1 cm rise in global sea level.
During the International Polar Year (IPY) 2007-09, an effort was initiated to produce accurate digital elevation models (DEMs) of the main glaciers in Iceland using airborne lidar technology. The purpose was to obtain a good estimate of the current rate of change in glacier geometry and to establish an accurate baseline for monitoring of future changes. Icelandic glaciers are close to several populated areas and travel routes, are important for the hydrology of the country and affect the design and operation of infrastructure. They are frequently visited by tourists and often need to be accessed in connection with search-and-rescue operations. They are the object of scientific research, both in connection with their importance for neighbouring settlements and also in an international context as a part of the global reservoir of ice stored in small glaciers and ice caps and as accessible ‘laboratories’ for glaciological research.
At the end of the lidar surveying project in 2012, ∼90% of the area of glaciers in Iceland had been mapped. The total surveyed area was >15 000 km2, including proglacial areas and repeated mapping of some areas with rapid changes due to subglacial eruptions and emptying of subglacial water bodies. In addition, ∼60% of Langjökull ice cap was mapped with lidar in 2007 by the Scott Polar Research Institute (SPRI; Reference Pope, Willis, Reese, Arnold and PalssonPope and others, 2013) and it was possible to create an accurate DEM of the entire ice cap using SPOT5 (Systeme Pour l’Observation de la Terre) data from 2004 for gap filling (Palsson and others, 2012). Together with the SPRI lidar DEM of Langjökull from 2007, all glaciers in Iceland larger than 10km2 and several smaller glaciers have been mapped by lidar in the period 2007-12, leaving <150 km2 of small glaciers and cirque glaciers unsurveyed, mainly located in central northern Iceland. In light of the societal and scientific importance of the glaciers, it was decided to acquire high-resolution (5 m x 5 m grids), high-quality DEMs (<0.5 m vertical accuracy) and make them publicly available for both non-commercial and commercial use.
Various older maps of the surface of ice caps and glaciers in Iceland are available. Contour maps of the whole of Iceland that are believed to be reasonably accurate up to ∼1000 m a.s.l. on glaciers were produced by the US military based on aerial photographs taken in 1945 and 1946. Another set of maps of similar quality covering most glaciers in Iceland was made by the US military based on photographs from the period 1979-87. Surface maps of the main ice caps in Iceland were made in the period 19802000 based on elevation profiles measured by barometric altimetry with ∼1 km between profiles (Reference BjörnssonBjörnsson, 1988), and in the last two decades several glacier areas have been mapped with various remote-sensing methods (Reference Magnússon, Björnsson, Dall and PalssonMagnusson and others, 2005; Reference Berthier, Björnsson, Palsson, Feigl, Llubes and RemyBerthier and others, 2006; Reference GuðmundssonGuðmundsson and others, 2011). Some digital maps of glacier surfaces based on aerial photographs taken in the last 10-15 years are available from commercial mapping companies.
This paper gives an overview of the lidar mapping that was initiated in 2008 and describes the results of some studies where the lidar DEMs have been used to determine recent changes in ice volume by comparison with existing maps, interpret mass-balance measurements and radio echo-sounding (RES) data and estimate source areas and paths of subglacial outburst floods.
Observations and Methods
Survey areas
The lidar survey areas and the survey year for each glacier are shown in Figure 1. The survey plan includes all glaciers and ice caps in Iceland larger than 10 km2, and some smaller glaciers. Glaciers in Trollaskagi in northern Iceland (>150 individual glaciers, ∼150 km2 in total) and some other small glaciers in other parts of the country are not covered because of the high cost of surveying so many glaciers scattered over a large area.
Location map of Icelandic glaciers showing the status of the lidar mapping at the end of the 2012 surveying effort. Glacier outlines (red curves) were delineated based on orthocorrected SPOT5 and Landsat 7 images and aerial photographs from the period 1999-2004. The blue areas were surveyed in 2008-11. Hatched areas on south and southwest Vatnajökull with an area of ∼2200km2 were surveyed in 2012 and are being processed. Sixty per cent of Langjökull ice cap (coloured yellow) was surveyed by SPRI in 2007 (Reference Pope, Willis, Reese, Arnold and PalssonPope and others, 2013). An area on Myrdalsjökull that was resurveyed in 2011 is indicated with a rectangle.
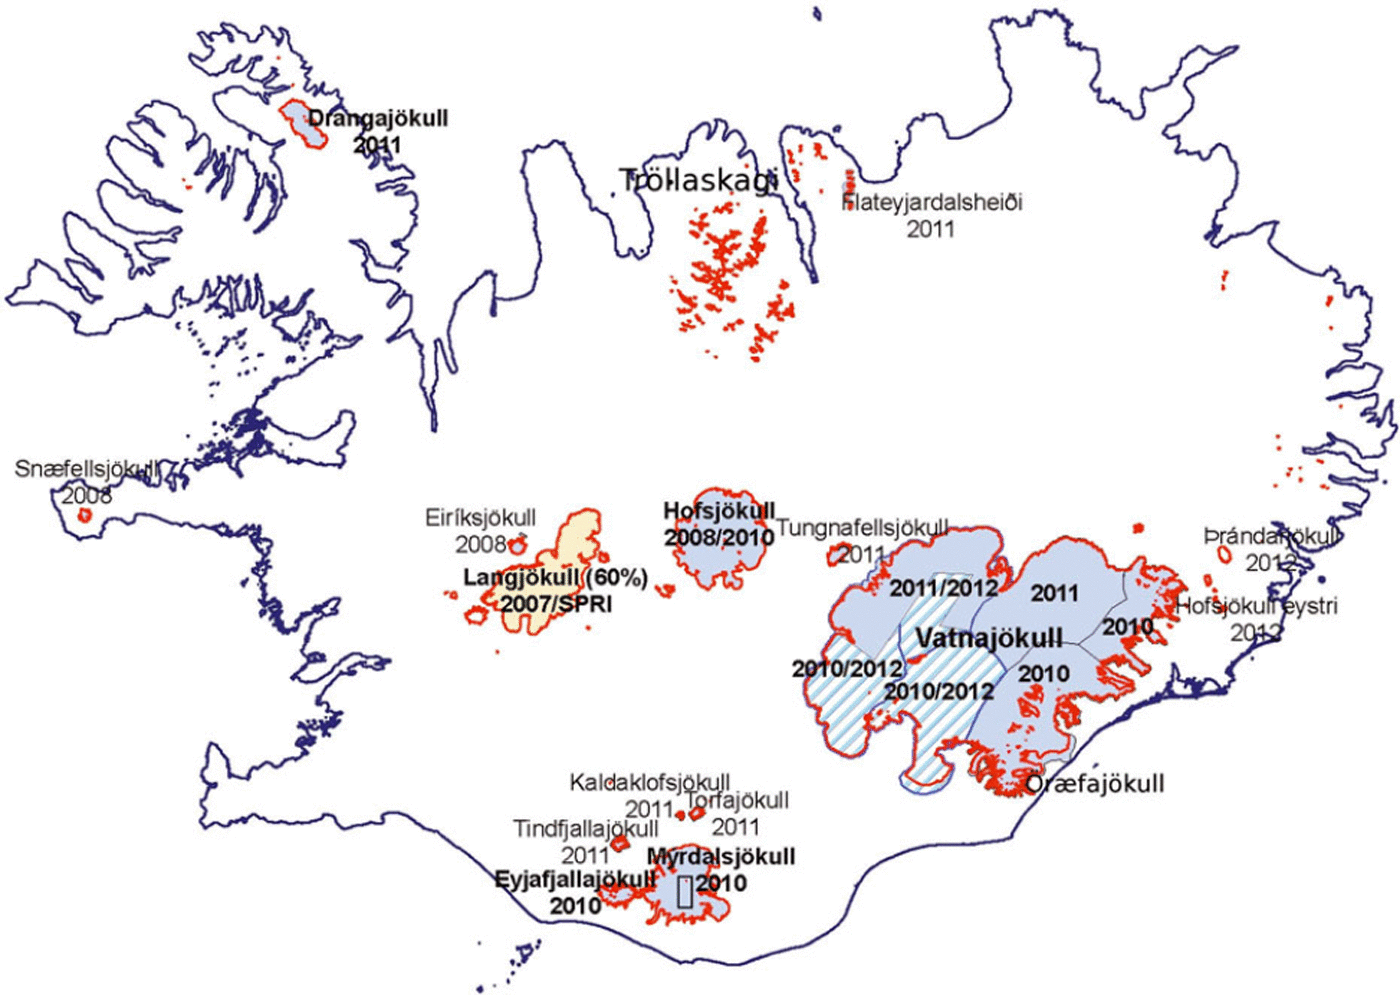
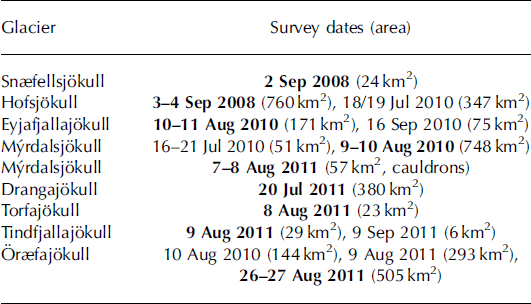
An attempt has been made to survey each glacier and ice cap in its entirety during a short time window in late summer to obtain a consistent DEM suitable for ice-volume and mass-balance studies. Where this has not been possible due to cloud conditions, an attempt has been made to survey whole ice-flow basins in each surveying effort. In particular, the Vatnajökull ice cap (8100km2) needed to be surveyed in several efforts over a 3 year period. In some cases, composite DEMs have been created from the results of several surveying efforts using altitude-dependent vertical offsets derived from overlap areas to produce a consistent DEM of a whole glacier that can be considered an estimate of the ice surface geometry of the glacier in question at a definite point in time. Table 1 gives an overview of the lidar surveys of the glaciers Hofsjökull, Drangajökull, Eyjafjallajökull, Tindfjallajökull, Torfajökull, OræfaJökull, Myrdalsjökull and SnæfellsJökull (Fig. 1), which are considered below in an analysis of ice-volume changes and other applications of the lidar DEMs.
Dates of lidar surveying of the eight glaciers considered in this paper. Total survey area, including adjacent ice-free areas and overlapping regions, is given in parentheses for each survey. The date of the main survey is given in bold where several efforts were needed to map the entire glacier, in which case data from the other surveys have been adjusted in altitude to create a composite DEM corresponding to the time of the main survey.
Lidar measurements
Lidar measurements have been shown to be an accurate method for measuring ice surface elevations independently of surface texture and external light sources (Reference Favey, Geiger, Guðmundsson and WehrFavey and others, 1999; Reference Arnold, Rees, Devereux and AmableArnold and others, 2006; Reference KohlerKohler and others, 2007), in contrast to traditional photographic methods that often fail in the accumulation area of glaciers due to lack of contrast. The high-resolution DEMs may also be used to reliably assess glacier area and analyse periglacial features (Reference Abermann, Fischer, Lambrecht and GeistAbermann and others, 2010), and accurate ground-control points extracted from the lidar measurements can be used to aid the photogrammetric processing of existing stereo imagery (Reference Barrand, Murray, James, Barr and MillsBarrand and others, 2009).
The lidar surveying of Icelandic glaciers described here has been carried out by the mapping company TopScan GmbH of Germany using an Optech ALTM 3100 laser scanner operated from ∼2500m above ground with a ∼1200m distance between flight-lines and a swath width of ∼1800 m. The wavelength of the ALTM lidar is 1064 nm, and the laser scan rate was set at 33 kHz. GPS base stations from the Icelandic ISGPS station network (Reference GeirssonGeirsson and others, 2010) operated by the National Land Survey of Iceland and temporary base stations operated at ISN2004 triangulation network points were used for kinematic correction of the on-board GPS instrument, ensuring a distance of <50-100 km from the survey areas to the nearest base station. The average measurement point density was ∼0.33 m–2, i.e. approximately one measurement every 3 m2. The measurements were averaged and interpolated onto a regular 5 m x 5 m grid (DEM) using a modified version of the linear prediction method as implemented in the SCOP.DTM software (IPF, 2002). On average, approximately ten lidar measurements from the randomly distributed point clouds are available to determine each point in the 5 m x 5m regular grid. For specialized applications, even higher-resolution DEMs of limited areas may be derived from the original point clouds.
Two measurements are obtained from each reflected laser pulse, corresponding to the first and the last returned pulse. The measurements corresponding to the first pulse were used to calculate the regular DEMs, as these are considered more likely to originate from the ‘smooth’ ice surface that the DEM is intended to represent. The last pulse measurements, which may be expected to be more affected by surface irregularities (e.g. crevasses and melt channels), may be used together with the first pulse measurements in special-purpose studies such as digital delineation of crevasses or geomorphological analysis.
GPS validation measurements on ice-free land and on the glaciers, taken on a day close to the lidar surveying, and comparison of lidar results in overlap areas indicate that the vertical accuracy of the lidar measurements and the horizontal positioning accuracy is <0.5 m (Reference Jóhannesson, Björnsson, Palsson, Sigurðsson and ThorsteinssonJóhannesson and others, 2011).
Maps based on aerial photographs
Contour maps based on aerial photographs from the US Defense Mapping Agency (DMA) map series created in 1982-86 and elevation models based on digital processing of aerial photographs from Loftmyndir ehf. since the late 1990s have been used to derive digital models of the ice surface elevation of several glaciers in Iceland. Here 20 m contour DMA maps of Hofsjökull from 1986, Drangajökull from ∼1990, Eyjafjallajökull from 1984, Tindfjallajökull from 1980 and Torfajökull from 1979, as well as a 1999 DEM from Loftmyndir of the ablation area of Hofsjökull, are compared with DEMs from the lidar surveying.
The DMA DEMs were shifted horizontally to eliminate offsets by maximizing the horizontal cross-correlation with more recent DEMs in adjacent ice-free areas (Guðmundsson and others, 2012), and vertical biases were eliminated by comparison with the altitude in the ice-free areas. The reliability of the resulting DEMs was checked by comparison with the more recent DEMs, and an 85 km2 region in the accumulation area near the centre of Hofsjökull was eliminated. In this region, the DMA DEM had a low spatial correlation with the lidar and SPOT5/HRS (high-resolution stereo; see below) DEMs due to lack of contrast on the white glacier surface that appears to have prevented adequate stereo delineation of the surface altitude. In order to create a contiguous DEM, this region was filled with an estimate based on the altitude dependence of the elevation difference between the lidar and DMA DEMs in nearby areas. As elevation changes at the highest altitudes are comparatively small, the lack of DMA elevation information in this area has little effect on derived ice-volume changes. The gap filling does not add any new information as it is based on the altitude dependence of elevation differences in nearby areas, but it aids the visualization of the spatial distribution of elevation changes which can be presented without a hole in this region. The random vertical error of the DMA DEMs, after correcting for horizontal offset and vertical bias, was cautiously estimated as 10m in rough mountain areas and <5m for gentle terrains and smooth glacier topography by Reference GuðmundssonGuðmundsson and others (2011). The remaining nonrandom vertical error that could lead to vertical biases in subregions of the DEM is, however, expected to be <2m (Guðmundsson and others, 2012).
The Loftmyndir DEM from 1999 covers 404 km2 of the 890 km2 of Hofsjökull in 1999 (Fig. 2). GPS measurements along a network of lines in August 2001 were used to construct a DEM of a 53 km2 area near the top of the ice cap which was merged with the Loftmyndir DEM. Changes in elevation with time at the highest altitudes near the centre of the ice cap are small compared with the magnitude of the changes in the lower part of the ablation area, so using the GPS data from 2001 has little effect on estimated ice volume changes of the whole ice cap that are considered here. The accumulation area above the upper limit of the Loftmyndir DEM and below the area covered by the GPS measurements, 333 km2 in total, was filled with vertically shifted points from the lidar DEM using an intermediate altitude correction derived from the difference of the lidar DEM with respect to the 1986 DMA and 2004 SPOT5/HRS DEMs, which show a regular pattern with altitude in this altitude range. After correction for horizontal and vertical offsets, the remaining non-random vertical error of the composite 1999 DEM is expected to be 1-2 m.
Annual average change in ice surface elevation of Hofsjökull: (a) 1986–1999/2001; (b) 1999/2001–2004; and (c) 2004–08. The figure shows elevation contours based on the 2008 lidar DEM and the outline of the ice cap in 1999 as a black curve. The outline of the ice cap in 1986 is shown with a red curve in (a) (mostly coinciding with the 1999 outline). A dashed curve in (a) encloses the region in the 1986 DMA map with low spatial correlation with later DEMs. The 1986 DEM in this region was estimated from the altitude dependence of the elevation difference between the lidar and DMA DEMs in nearby areas. The dashed curves in (b) indicate that the 1999/2001 DEM is based on aerial photographs from 1999 in the ablation area (area below the blue dashed curve), GPS measurements from 2001 near the summit (area above the magenta dashed curve) and interpolation based on the altitude distribution of previous and later elevation changes at intermediate altitudes (area between the dashed curves). (c) shows the main ice flow basins of the ice cap as delineated on the basis of the lidar DEM (thin black curves).

It has not been possible to obtain information from the US military about the exact timing of the aerial photographs used to create the DMA map of Drangajökull in the late 1980s to early 1990s, about which it is only stated that ‘best available information’ was used. It is even possible that photographs taken by military reconnaissance satellites were used (personal communication from R.S. Williams, Jr, 2012). However, it is considered most likely that the map is based on photographs taken in the period 1988-91. Available aerial photographs from 1985 and 1986 indicate that the KaldalonsJökull outlet glacier was then larger than shown on the DMA map, whereas the map does not show an advance of the glacier margin due to the surge in KaldalonsJökull that started before 1994. The years 1992 and 1993 are unlikely because of extensive snow cover in late summer that would not have allowed the delineation of the glacier margin that is shown on the DMA map.
SPOT5/HRS and EMISAR remote-sensing DEMs
For Torfajökull, Tindfjallajökull and Eyjafjallajökull, an EMISAR (synthetic aperture radar) DEM from August 1998, measured using airborne electromagnetic equipment of the Technical University of Denmark, is available (Reference MagnússonMagnusson, 2003; Reference Magnússon, Björnsson, Dall and PalssonMagnusson and others, 2005) (5 m x 5 m resolution, <2 m accuracy in elevation, ∼ 5 m positioning accuracy). Satellite DEMs from August 2004 are available for these three glaciers and for Hofsjökull. They are derived from SPOT5/HRS optical images obtained from the SPIRIT (SPOT 5 stereoscopic survey of Polar Ice: Reference Images and Topographies) project (Reference Korona, Berthier, Bernard, Remy and ThouvenotKorona and others, 2009) (40 m x 40 m resolution, <5-10m accuracy in elevation in ice-free gentle relief areas and higher-relief areas with slopes less than 20%, 30 m position accuracy). After correction for horizontal and vertical offsets, the remaining non-random vertical error is expected to be <0.6m for both the EMISAR and SPOT5/HRS DEMs (Reference GuðmundssonGuðmundsson and others, 2011). Ice-volume changes for Torfajökull, Tindfjallajökull and Eyjafjallajökull from around 1980 to 1998 and from 1998 to 2004, derived from these data and the DMA maps, are described by Reference GuðmundssonGuðmundsson and others (2011) who give a detailed technical description of the processing of these remote-sensing data.
Summary of Results
Ice-volume changes
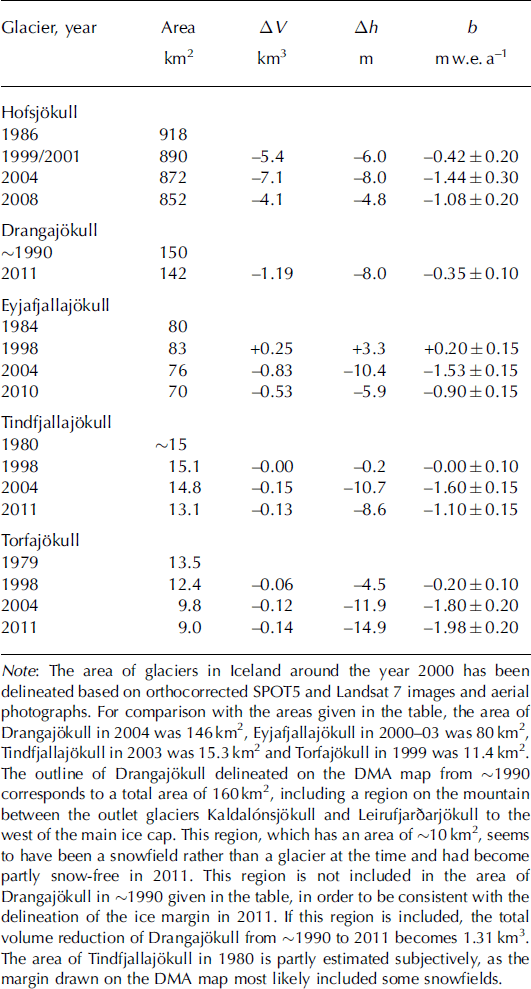
The lidar DEMs have been compared with available DEMs since ∼1980 for five ice caps and glaciers to derive spatial and temporal patterns of ice-volume changes in different regions of Iceland. The results are summarized in Table 2 and described and discussed in the following subsections.
Changes in ice volume, AV, mean changes in ice surface altitude, Ah, and the average annual mass balance, b, for five Icelandic glaciers, derived from a comparison of lidar measurements with older ice surface maps based on aerial photographs and remote sensing. Changes in the AV, Ah and b columns refer to intervals starting from the year of the preceding line in the table. All changes are calculated directly from the DEMs without correction to take into account slightly different times of surveying within the mass-balance year. The mass balance is calculated from the mean change in the ice surface altitude using a fixed density equal to the density of ice, 900 kg m - 3 (Sorge’s law; Reference PatersonPaterson, 1994). Error estimates for b take into account the estimated error of the DEMs and the glacier areas
Hofsjökull
The annual average change in the surface elevation of Hofsjökull, the third largest glacier in Iceland (Fig. 1), over the three time periods spanned by the available DEMs is shown in Figure 2. As expected from the mean values given in Table 2 and from available mass-balance measurements of Icelandic glaciers, the rate of elevation change is small in the period before 1999, compared with the two later periods, which have a similar magnitude and pattern of change.
Figure 2 indicates an overall regular spatial pattern in the downwasting of the ice cap, with the greatest rates observed at the lowest altitudes on all sides of the ice cap, where the annual lowering is >5ma–1 over a 50-100 m altitude range at many locations in both 1999-2004 and 2004-08. Much slower changes are found at intermediate and high altitudes. The maximum accumulated lowering from 1986 to 2008 exceeds 80 m at ∼800 m a.s.l. near the middle of the eastern margin. Above ∼1600 m a.s.l., the ice surface elevation was reduced by several metres from 1986 to 2001 followed by a small increase to 2004.
These changes may to some extent depend on the different timing of the measurements within the mass-balance year and on random interannual variations in the snow accumulation, and they depend sensitively on the accuracy of the 1986 contour map at the highest elevations (as mentioned above, an area of 85 km2 in the 1986 DEM is estimated from the 2008 lidar DEM using an extrapolation of elevation differences in the surrounding areas; see region enclosed by a dashed curve in Fig. 2a). The magnitude of seasonal variations in the elevation of the glacier surface is typically ∼ 3 - 5m on the glaciers considered here, and differences in the timing of the late-summer aerial photographs and remote-sensing surveys used here (typically less than 2-4 weeks) correspond to differences of ∼0.5-1 m w.e. when expressed as an areal average over entire glaciers or ice flow basins. Local increase in the surface altitude at 1300-1600 m a.s.l. on the western flank of the ice cap from 1986 to 1999, in combination with the lowering of the ice surface within the caldera at the top of the ice cap, could be related to increased speed of the ice flow out of the caldera sometime in this period. This could explain accounts of increased crevassing in this part of the ice cap around this time. Irregularities in the spatial pattern of altitude change at 700-1500 m a.s.l. on the eastern flank of the ice cap in 1986-99 are likely to be related to surges in the main eastern outlet glacier, þjorsarjökull, in 1991 and 1994 (Björnsson and others, 2003).
Drangajökull
Drangajökull in northwest Iceland (Fig. 1) is the fifth largest glacier in the country. The main outlet glaciers are surge-type, with 50-150year intervals between surges (Reference Björnsson, Palsson, Sigurðsson and FlowersBjörnsson and others, 2003). Apart from monitoring of terminus positions, relatively little glaciological research has been carried out on Drangajökull. Mass-balance measurements were started in 2005, but the stakes are too few to provide a good estimate of the average mass balance over the whole ice cap.
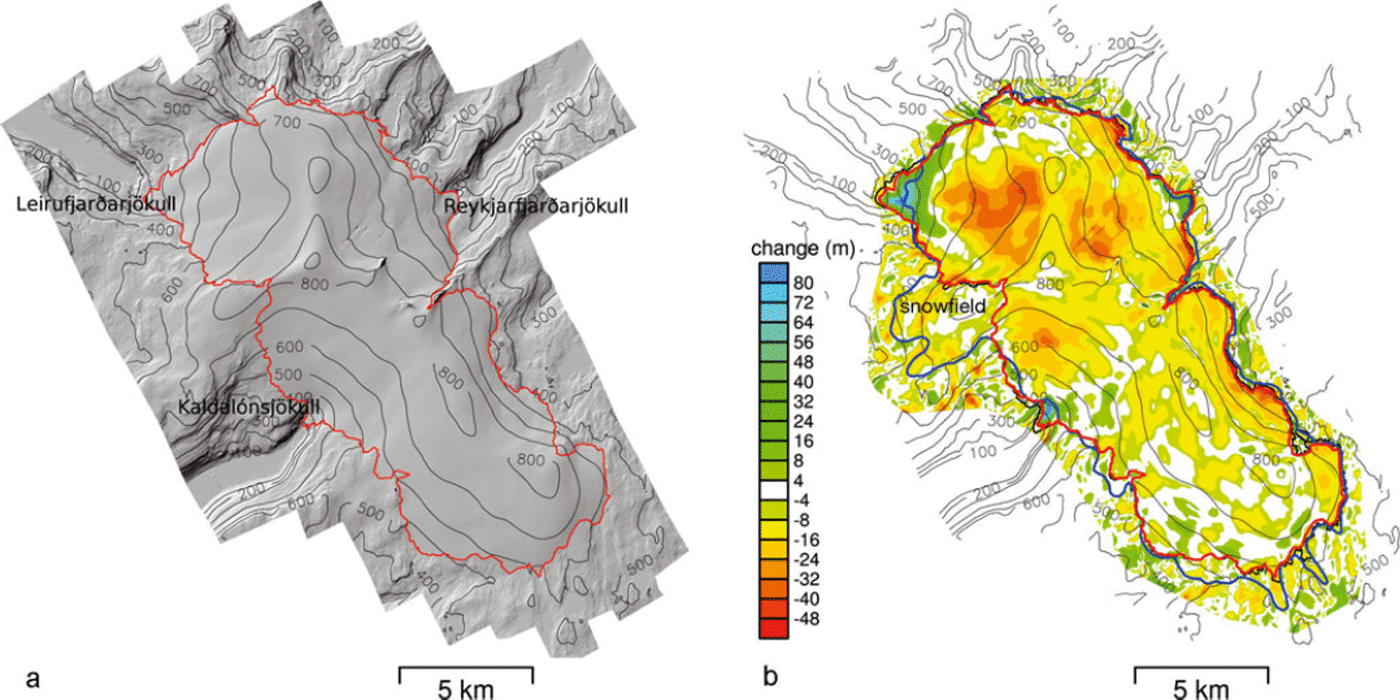
The lidar DEM from 2011, together with the DMA map from ∼1990, provides an opportunity to estimate variations in the ice volume of Drangajökull during recent decades. Table 2 shows that the ice cap thinned by ∼ 9 m on average during this ∼26year interval, and Figure 3 shows a spatial distribution of the thickness change that is strikingly different from the thickness changes of Hofsjökull described in the previous subsection. The main three outlets, KaldalonsJökull, Leirufjarðarjökull and ReykjarfjarðarJökull, all surged between 1995 and 2005. They have all thickened substantially in the area where the surging termini advanced beyond the ∼1990 location of the ice margin. Large source areas corresponding to the surging outlets have, on the other hand, thinned by tens of metres. The thickness changes are much smaller in the parts of the ice cap that are not affected by the surges. A mountainous area between KaldalonsJökull and Leirufjarðarjökull, included within the DMA outline of the ice cap (Fig. 3b), appears to have been more akin to a snowfield than a glacier, as bare ground appears at scattered locations in this area according to the lidar measurements.
(a) A hillshade of the 2011 lidar DEM of Drangajökull. (b) The difference in ice surface elevation between the ∼1990 DMA map and the lidar DEM. Also shown is the outline of Drangajökull in ∼1990 as drawn on the DMA map (blue curve), in 2004 as derived from orthocorrected SPOT5 images (black curve) and as delineated from the lidar DEM (red curve, mostly overplotting the 2004 SPOT5 outline).
The rate of volume change of the other glaciers in Table 2 is much slower before 1998 or 1999 than after this time, reflecting the warming of Iceland after 1999. Many Icelandic glaciers appear to have been roughly in balance during the last two decades of the 20th century, and the volume loss of Hofsjökull in 1986-99 was at about one-third of the average rate of loss estimated for 1999-2008. If Drangajökull was roughly in balance in the period ∼1990 to near the end of the 20th century, or losing volume at one-third or less of the rate after ∼1999, then one may roughly estimate an average annual mass balance of b = -(0.48-0.60) mw.e. a-1 for the period 1999-2011. A similar value of b«-0.5 m w.e. a-1 is obtained if all the volume change derived from the difference between the DMA and lidar DEMs is assumed to have taken place after 1996 when the mass balance of Icelandic glaciers first became strongly negative according to mass-balance measurements (Reference BjörnssonBjörnsson and Palsson, 2008). This interpretation of the volume loss indicates that the average mass balance of Drangajökull since about the beginning of this century is approximately half the mass balance of Hofsjökull during the same period.
Eyjafjallajökull, Tindfjallajökull and Torfajökull
The lidar maps make it possible to extend Guðmundsson and others’ (2012) analysis of the downwasting of Eyjafjallajökull, Tindfjallajökull and Torfajökull (Fig. 1) to 2010 or 2011. Table 2 shows that the rate of ice volume loss since 2004 is somewhat smaller than in the period 1998-2004 for Eyjafjallajökull and Tindfjallajökull, similar to the finding for Hofsjökull above, but it is slightly larger for Torfajökull. The uncertainty in the mass-balance estimates for these glaciers in Table 2 is in some cases lower than given by Reference GuðmundssonGuðmundsson and others (2011) because the glacier areas can be esimated more accurately with the data now available. The August 2004 SPOT5/HRS measurements for Tindfjallajökull do not cover the entire glacier, so ice-volume changes before and after 2004 are partly based on interpolation from other sources (see Reference GuðmundssonGuðmundsson and others, 2011, who also give a more detailed error analysis). The reduction in the estimated rate of ice volume loss for Tindfjallajökull after 2004 could partly arise from uncertainties due to this interpolation.
The volume loss of Eyjafjallajökull is affected by the spring 2010 eruption in the top caldera (Reference SigmundssonSigmundsson and others, 2010; Reference Magnússon, Guðmundsson, Roberts, Sigurðsson, Hoskuldsson and OddssonMagnusson and others, 2012a), which melted ice within the caldera and along the GıgJökull outlet glacier to the north. The eruption also covered the ice cap in a thick layer of tephra that both increased the altitude of the glacier surface and reduced the melting of snow and ice that would otherwise have taken place the following summer before the lidar survey in August 2010. The volume change of Eyjafjallajökull between 2004 and 2010 given in Table 2 can therefore not be directly compared with earlier mass loss and interpreted in terms of climate variations only.
Figure 4 shows hillshades of the lidar DEMs of the three glaciers. The 2010 hillshade of Eyjafjallajökull shows the northward path of lava flow down the GıgJökull outlet glacier, and several eruption craters within the top caldera. It also shows the path of a swift Jökulhlaup down the southern slopes of Eyjafjallajökull on 14 April 2010, as well as fracture lines and widespread flow marks due to lahar floods on 19 May 2010 in the tephra deposited on the southern flanks of the glacier. These features are well resolved due to the high resolution and good relative accuracy of the lidar measurements and they demonstrate the value of lidar surveying for monitoring subglacial eruptions and dynamic glaciological processes that lead to changes in the ice surface. The hillshades of the much smaller Tindfjallajökull and Torfajökull show retreating margins on all sides of the ice caps, both of which have lost >2km2 of their area since 2003 and 1999, respectively. These ice caps will not last more than a few decades if the warm climate of Iceland in recent years persists.
Hillshades of the lidar DEMs of Eyjafjallajökull (top), Tindfjallajökull (bottom left) and Torfajökull (bottom right). Also shown are the outlines of Torfajökull in 1999 as derived from aerial photographs, Eyjafjallajökull from 2000 to 2003 and Tindfjallajökull in 2003 as derived from orthocorrected SPOT5 images (black curves) and as delineated from the lidar DEMs from 2011 (red curves).

Bias estimation of mass-balance measurements
It is well known that traditional mass-balance measurements at stake locations can be biased when averaged over whole ice-flow basins or entire glaciers (Reference AndreassenAndreassen, 1999; Reference KrimmelKrimmel, 1999; Reference Østrem and HaakensenØstrem and Haakensen, 1999; Reference Haug, Rolstad, Elvehøy, Jackson and Maalen-JohansenHaug and others, 2009), partly due to spatial variations in snow accumulation that may not be adequately sampled by the stake network (Reference Machguth, Eisen, Paul and HoelzleMachguth and others, 2006). Although relatively few stakes can suffice to represent the mass-balance distribution with elevation in some cases (Reference Fountain and VecchiaFountain and Vecchia, 1999), systematic biases, which can for example arise due to the interplay between snowdrift and short-scale landscape and crevasse fields, tend to be of the same sign from year to year, and the mass-balance measurements may therefore give misleading indications of long-term changes in the volume of the glacier (Reference Thibert, Blanc, Vincent and EckertThibert and others, 2008; Reference Haug, Rolstad, Elvehøy, Jackson and Maalen-JohansenHaug and others, 2009). Sinking of mass-balance stakes in the accumulation area through the previous year’s summer surface was suggested by Reference Østrem and HaakensenØstrem and Haakensen (1999) as a possibly important source of systematic positive biases. In spite of substantial differences in individual cases, direct and geodetic mass-balance measurements were believed to be unbiased with respect to each other when results from many glaciers are considered (Reference CogleyCogley, 2009), but recent analysis of available direct and geodetic mass-balance data from many glaciers from several regions on Earth (Reference Cogley, Henderson-Sellers and McGuffieCogley 2012) indicates that there may be an overall tendency for positive bias in direct mass-balance measurements.
The lidar measurements of Hofsjökull provide an opportunity to estimate the bias in the mass-balance measurements that have been conducted on the outlet glaciers Satujökull, þjorsarjökull and BlagnıpuJökull since 1988 (Table 3; see ice flow basins in Fig. 2c; note that Satujökull and þjorsarjökull are delineated as two ice flow basins each on the map).
Comparison of traditional mass-balance measurements (mb) conducted by the Icelandic Meteorological Office on Hofsjökull with ice-volume changes derived from a comparison of lidar measurements with older ice surface maps based on aerial photographs and SPOT5/ HRS images. Ice-volume changes are converted to mw.e. a–1 using a fixed density equal to the density of ice, 900 kgm–3 (Sorge’s law; Reference PatersonPaterson, 1994). The mass-balance values in the first three columns have similar errors to those given in Table 2 for Hofsjökull for the corresponding time periods. The errors for the two longer time periods in the last two columns are smaller by a factor of approximately one-half
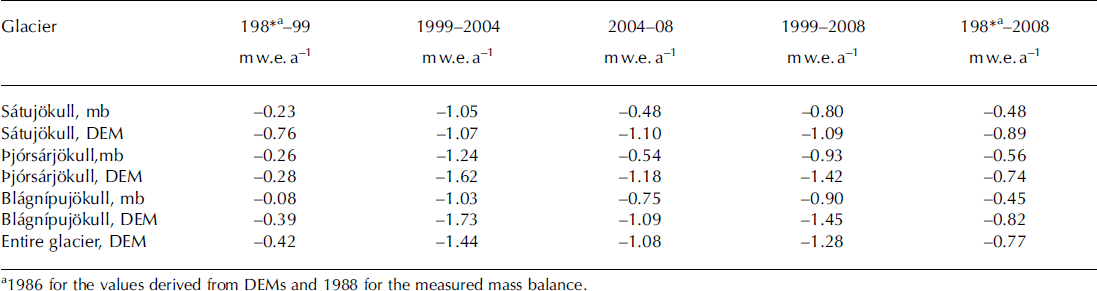
Comparison between the mass-balance measurements and the average annual ice volume reduction within the corresponding ice flow basin calculated from the DEMs shows a consistent positive bias, with a median value of 0.38 m w.e. a- 1 . The magnitude of the bias of the mass-balance measurements is on the order of one-half of the average negative mass balance indicated by the mass-balance measurements of Hofsjökull during the period 1999-2008. The difference in the rate of volume loss between Hofsjökull and Langjökull ice caps indicated by the mass-balance measurements of the Icelandic Meteorological Office and the Institute of Earth Sciences (Palsson and others, 2012) appears to be largely due to the bias of the Hofsjökull measurements. An even larger magnitude of the bias of traditional mass-balance measurements has been found for the Engabreen drainage basin in the west Svartisen ice cap, northern Norway, where a positive bias of ∼0.8mw.e.a–1 was reported by Reference Haug, Rolstad, Elvehøy, Jackson and Maalen-JohansenHaug and others (2009) for the period ∼1970-2002. A similar bias to that for Hofsjökull, ∼0.5m w.e. a- 1 , was found for Alfotbreen, western Norway, for the period ∼1968-88 (Reference Østrem and HaakensenØstrem and Haakensen, 1999), whereas a much smaller difference of ∼0.2mw.e.a– 1 between traditional and geodetically determined mass balances was found by Reference Andreassen, Kjøllmoen, Rasmussen, Melvold and NordliAndreassen and others (2012) for Langfjordjøkelen, northern Norway, for the period 1994-2008.
It should be noted that the mass balance derived from the DEMs has not been corrected for the effect of different timing within the year of the mass-balance measurements and surveys on which the DEMs are based, and that the mass-balance measurements on the three outlet glaciers started in the period 1988-90 and do not cover the entire earliest period 1986-99. Mass-balance modelling (not shown) indicates that the mass balance for the years 1986-88 was positive, so the biases for the earliest period would probably be greater if these values were available. The ice flow basins used in the DEM analysis are not fully consistent with the hydrological basins that have been used in the reduction of the mass-balance data, and the results for þjorsarjökull may to some extent be affected by its surges in 1991 and 1994. Differences between ice flow and hydrological basins have been found to correspond to about half of the bias in traditional mass-balance measurements for Engabreen (Reference Elvehøy, Jackson and AndreassenElvehøy and others, 2009), but this is unlikely to be the case for Hofsjökull because the geodetically determined mass balance is similar for all the main ice flow basins of the ice cap (Fig. 2c) and similar biases are estimated for the three outlet glaciers where the mass balance is measured. The above shortcomings will be addressed in a further study, but they do not alter the conclusion that there appears to be a substantial bias in the mass-balance measurements of Hofsjökull on all three outlet glaciers where they are conducted. The reason for this bias has so far not been identified. The bias of the mass-balance measurements for Hofsjökull is larger than was obtained by Reference AðalsgeirsdottirAðalsgeirsdottir and others (2011) and Palsson and others (2012) for Hoffellsjökull in southeast Vatnajökull and Langjökull, respectively, where traditional mass-balance measurements integrated over the considered ice-covered areas were found to be consistent with DEM-derived ice-volume changes within ±0.10 m w.e. a- 1.
The estimated uncertainty of mass-balance measurements conducted on Icelandic glaciers is ± 1 5% (Björnsson and others, 1998). If this error estimate is applied separately to the winter and summer mass-balance measurements (typically several mw.e. a- 1 each), the expected relative error in the numerically much smaller annual mass-balance value (typically <1 mw.e.a- 1 in absolute value) may be much larger. In fact, errors on the order of ±0.5 m w.e. a- 1 might be expected. This indicates that bias correction based on estimated ice-volume changes over extended periods should be an integral part of long-term mass-balance monitoring programmes (Reference Thibert, Blanc, Vincent and EckertThibert and others, 2008), even if smaller errors than this are often found (e.g. Hoffellsjökull and Langjökull as mentioned above).
Cointerpretation of lidar and RES data for Oræfajökull
The new lidar DEM of south Vatnajökull was used to create a contiguous DEM for the bedrock geometry of the OræfaJökull volcano near the southern margin of the ice cap (Fig. 1). The snow-covered peak Hvannadalshnjukur on the northwest rim of the caldera at the top of OræfaJökull is the highest point in Iceland, traditionally listed as 2119ma.s.l. based on measurements in 1904, but measured to be 2111 ma.s.l. in 2004 by accurate GPS surveying. The lidar measurements in 2010 and 2011 showed an elevation of 2010ma.s.l. for the highest point, in agreement with the earlier GPS result when expected variations in the elevation of the snow-covered surface are considered.
Several RES profiles are available from the caldera region and on its northern side, and RES measurements at scattered points could be acquired at intermediate and low elevations on outlet glaciers on the flanks of the volcano, but large regions could not be accessed for RES because of crevasse areas. A relationship between the local ice thickness and the slope of the ice surface was derived from the available ice-thickness measurements and the lidar map, and this relationship, together with the ice surface altitude and the altitude of the adjacent ice-free terrain from the lidar surveying, was used to fill gaps in the RES bedrock map (Fig. 5). A more detailed description of these results is given by Reference Magnússon, Palsson, Björnsson and GuðmundssonMagnusson and others (2012b). OræfaJökull is considered one of the most dangerous volcanoes in Iceland due to large debris- and ice-laden outburst floods (Jökul-hlaups) that may be caused by subglacial eruptions within the caldera (Reference Guðmundsson, Larsen, Hoskuldsson and GylfasonGudmundsson and others, 2008). The new ice-surface and bedrock maps will be useful for the recently started hazard zoning of settlements in the vicinity of OræfaJökull.
Ice-surface and bedrock geometry of the subglacial OræfaJökull volcano in south Vatnajökull.

Emptying of subglacial water bodies
Repeated lidar mapping of the same area makes it possible to detect changes in the geometry of the ice surface due to dynamic changes in ice flow or varying conditions at the glacier base. Myrdalsjökull ice cap in south Iceland (Fig. 1) was surveyed in August 2010. On 9 July 2011, a Jökulhlaup from cauldrons in the Katla subglacial caldera destroyed a 128 m long bridge in the river Mulakvısl, causing a week-long disruption of traffic on road 1 along the south coast of Iceland.
The abrupt flood peak which lasted for <2 hours was estimated to have reached ∼3000m3s–1 maximum discharge away from the glacier and ∼6000m3s–1 near the glacier margin and to have had a volume of 7-8 x 10⁶m3 (Reference Jonsson and ThorarinsdottirJonsson and Thorarinsdottir, 2011). Several smaller peaks and a general increase in the discharge magnitude between the peaks were observed before and after the main peak, and the total discharge of the flood was initially estimated at 18 x 106m3 from aerial observations of the subsidence of ice cauldrons in the source area of the flood.
The cauldron area was resurveyed with lidar on 78 August 2011, ∼1 month after the flood (the resurveyed area is shown with a rectangle in Fig. 1). The results (Fig. 6) allow an accurate estimate of the water volume released from each of four cauldrons that were emptied during and after the flood (Reference Jóhannesson, Björnsson, Palsson, Sigurðsson and ThorsteinssonJohannesson, 2012) and show that a 2-10 m lowering took place along paths that extend several kilometres downstream from each cauldron. It is interesting that the most distinct lowering along the inferred subglacial flood path downstream of each cauldron takes place over a distance of 1-2 km, which was also observed in repeated lidar surveying before and after jökulhlaups from the Skafta cauldrons in west Vatnajökull (not shown). This distance must be characteristic of the distance scale needed for turbulent heat transfer to transport the heat corresponding to the initial temperature of flood water in the subglacial water body to the glacier ice surrounding the flood path.
(a) A hillshade of the lidar DEM of Myrdalsjökull (see location in Fig. 1) showing the source area of the July 2011 Jökulhlaup in river Mulakvısl. The location of the four cauldrons that were emptied during and after the flood is indicated (labelled according to the Institute of Earth Sciences system for cauldrons in Myrdalsjökull). (b) Difference in ice surface elevation between the August 2010 and August 2011 lidar surveys after subtraction of 0.4 m uniform shift in the altitude of the glacier surface estimated from areas that were not lowered due to the flood.

The total volume of water that appears to have been discharged from the cauldron area was estimated to be 40 x 106m3, substantially greater than first estimated from the subsidence of the cauldrons themselves only. The subsidence of the cauldrons seems to have taken place over an extended period. The northernmost of the four cauldrons (Fig. 6, cauldron 11) was lowered by ∼8m between 7 and 8 August during the 2011 lidar survey as detected by a difference between results obtained in an overlap area of the measurements on those two days.
Automated mapping of crevasses
The lidar DEMs have very high spatial resolution compared with other maps of glacier surfaces, and typically a relative accuracy of 5-10cm between adjacent points in the regular grid. Various small-scale surface irregularities, such as crevasses and nunataks on the glaciers and geomorphological features in the adjacent ice-free terrain (Reference Johnson, Schomacker, Benediktsson, Geiger, Ferguson and IngolfssonJohnson and others, 2010), can be detected and analysed. A digital procedure has been developed to delineate crevasses automatically, based on the eigenvalues and eigenvectors of the curvature tensor of the DEMs (Reference Jóhannesson, Björnsson, Palsson, Sigurðsson and ThorsteinssonJóhannesson and others, 2011). The procedure can detect both open crevasses and snow-covered crevasses where the snow cover has started to sag into the crevasse. An example of the results from the crevasse detection algorithm from SnæfellsJökull ice cap in west Iceland (Fig. 1) is shown in Figure 7. The procedure involves comparing the maximum curvature and the difference in curvature in the directions across and along potential crevasses, with thresholds chosen by trial and error to identify points in the DEM that are likely to lie along crevasses. A detailed description of the procedure is given by Reference Jóhannesson, Björnsson, Palsson, Sigurðsson and ThorsteinssonJóhannesson and others (2011).
(a) Location of crevasses delineated by a digital analysis of the 5 m x 5 m lidar DEM of SnæfellsJökull from 2008. (b) A hillshadeof the lidar DEM showing many crevasses. The glacier margin in 2008, as delineated from the lidar measurements, and the 2002 margin measured by GPS are shown with red and blue curves, respectively.

Summary
The lidar DEMs of Icelandic glaciers show their state at the onset of the ongoing downwasting of the glaciers. They will be valuable as a reference for future assessments of glacier changes and have already been used in several glaciological and geomorphological research projects. The DEMs have shown their usefulness for research on subglacial eruptions and jökulhlaups and for the estimation of bias in mass-balance measurements. They are being used in hazard assessments for settlements near the glaciers and will be useful in research on glacier dynamics (e.g. studies of surges, subglacial water flow and ice flow over bedrock topography). Comparison of the lidar DEMs with older maps shows consistently negative mass balances since the mid-1990s, with average values in the range –(1.0–2.0)m w.e. a–1 for glaciers in the central highland and in the western and southern parts of the country but close to –0.5m w.e. a–1 for the Drangajökull ice cap in the northwest. Their very high resolution and good relative accuracy also make the DEMs useful for mapping crevasses and creating detailed maps of the glaciers, including maps to improve the safety of travel and search-and-rescue operations on the glaciers. The DEMs will be available for download from the web of the Icelandic Meteorological Office for scientific research, creation of maps and other use. The public domain conditions governing the use of the DEMs are modelled after the IPY Data Policy (http://classic.ipy.org/Subcommittees/final_ipy_data_policy.pdf).
Acknowledgements
Financial support for lidar mapping of glaciers in Iceland has been provided by the Icelandic Research Fund, the Lands-virkjun (National Power Company of Iceland) Research Fund, the Icelandic Road Administration, the Reykjavık Energy Environmental and Energy Research Fund, the National Land Survey of Iceland, and the Klima- og Luftgruppen (KoL) research fund of the Nordic Council of Ministers. SPOT5/HRS DEMs were made available by the SPIRIT IPY project. Orthocorrected SPOT5/HRG images ( # CNES/SPOT Image Corporation) were provided by the National Land Survey of Iceland. Airborne EMISAR radar images and DEMs were made available by the Technical University of Denmark. Guðmundur Valsson at the National Land Survey of Iceland contributed to the surveying by providing base-station data and by calculating ISN2004 coordinates of base stations. We acknowledge the efforts of the pilots of Garðaflug and Norlandair and the survey operators of TopScan who were instrumental in the successful operation of the project. I.E.S. acknowledges the support of the Icelandic Research Fund, the University Research Fund, the Landsvirkjun Research Fund and the Jules Verne French–Icelandic programme. E.B. acknowledges support from the French Space Agency (CNES) and the Programme National de Teledetection Spatiale (PNTS). We acknowledge the developers of the analysis and graphics package R (R Core Team, 2012) which was found very useful in the preparation of the paper. We thank two anonymous reviewers for detailed and constructive comments that helped us improve the paper. This publication is contribution No. 9 of the Nordic Centre of Excellence SVALI,’Stability and Variations of Arctic Land Ice’, funded by the Nordic Top-level Research Initiative (TRI).



