

Interpretation of the growth of a population is largely dependent on the growth reference standard used(Reference de Onis and Onyango1). Based on the 1977 National Center for Health Statistics (NCHS) growth reference, Pakistan is one of three countries (with India and Bangladesh) frequently cited to have in combination more than half of the world’s under-nourished children(2). Among eight South Asian countries, Pakistan ranks 3rd, 4th and 6th, respectively, for prevalence of wasting (13 %), underweight (38 %) and stunting (37 %) among under-five children(2).
Suitability of the NCHS dataset as an international growth reference has been challenged on serious technical grounds(Reference Robert and Dallal3–Reference de Onis and Yip7) and its continued use as a reference to monitor individual growth or to estimate prevalence of under-nutrition is being discouraged(8–Reference Garza and de Onis10). To address deficiencies in the NCHS reference, the Centers for Disease Control and Prevention (CDC) produced a revised reference in 2000(Reference de Onis and Onyango1, Reference Robert and Dallal3) and WHO organised and sponsored a Multicentre Growth Reference Study (MGRS) between 1997 and 2003 to develop new growth standards(11–Reference Owusu, Lartey, de Onis, Onyango and Frongillo14). In this study, growth of 8500 children from affluent families was assessed. These children came from widely differing ethnic backgrounds and cultural settings (Brazil, Ghana, India, Norway, Oman and USA). They were reared following healthy practices, which included exclusive or predominant breast-feeding for at least 4 months and the maintenance of a non-smoking environment. WHO released a new growth standard for infants and young children in April 2006 (http://www.who.int/childgrowth/en/)(Reference Garza and de Onis15) and recommended its use in preference to the NCHS reference to assess children regardless of ethnicity, socio-economic status and type of feeding(16, 17). The new standard adopts a fundamentally prescriptive approach and not only serves as an international reference but also describes what might be considered as normal growth under ideal circumstances(Reference de Onis, Garza, Onyango and Borghi18).
Pakistan is among ninty-nine countries where the NCHS reference is currently used in the national programme(Reference de Onis, Wijnhoven and Onyango19). Recently, field testing of the new WHO growth standard for under-five children was carried out at two health centres in Karachi(Reference Onyango, de Onis, Caroli, Shah, Sguassero, Redondo and Carroli20). Comparison of the estimates of under-nutrition derived from the WHO standard and the NCHS reference in Bangladesh(Reference de Onis, Onyango, Borghi, Garza and Yang21) suggest significantly higher prevalence of underweight, stunting and wasting during infancy using WHO standards. Since Pakistan is the third largest contributor of under-nourished children worldwide, it is highly relevant to examine the impact of this change of growth standard on various parameters of nutritional status by using information from a local population-based survey. In the present paper, we compare the estimates of wasting, stunting and underweight obtained from the WHO standard and the NCHS reference for the Pakistani population and discuss the implications of changing the growth standard for national child health programmes.
Material and methods
Data sources and survey designs
Data for this study are derived from two different sources, which include the National Health Survey of Pakistan (NHSP) (1990–94) and the Thatta Health System Research Project (THSRP) (1992–93). We chose NHSP and THSRP datasets because of their availability and suitability to address the study question. Both the surveys were conducted during the early 1990s, which is the time period that served as a baseline for setting Millennium Development Goals.
NHSP (hereafter referred to as national data) was a multi-purpose cross-sectional survey conducted by Pakistan Medical Research Council (PMRC) under the technical guidance and support of NCHS in 1990–94. The details of sampling, design, survey instruments and quality control have been described elsewhere(22). The main purpose of the survey was to measure the health status of the people of Pakistan, particularly high-risk groups such as children, mothers and the elderly. An Institutional Review Board at PMRC provided ethical approval for the survey(Reference Qureshi, Wajid and Shaikh23). The survey was modelled on the National Health and Nutrition Examination Survey (NHANES) of the USA and was modified according to the information needs of Pakistan. In brief, eight broad strata were created by dividing each of the four provinces into urban and rural areas. Through a two-stage stratified design, eighty primary sampling units (PSU) were randomly selected, comprising thirty-two urban blocks and fourty-eight rural villages(22). From each PSU, thirty households were drawn systematically into the sample by taking a random start and a sampling interval. All residents of the households were included in the survey(Reference Hadden, Pappas and Khan24, Reference Pappas, Akhtar, Gergen, Hadden and Khan25). In total, 912 urban and 1408 rural households were surveyed covering a total population of 18 315 subjects. Although anthropometric information was available for children under 5 years of age, this study is limited to 1533 children aged 0–35 months from 387 urban and 723 rural households. Overall 3·1 % of the household did not participate in the survey(22).
THSRP (hereafter referred to as Thatta data) was a survey conducted by the Aga Khan University from November 1992 to February 1993 in Thatta, a rural district of Sindh Province, after approval from an Institutional Ethical and Review Committee(26). The main purpose of the survey was to measure the health and nutrition status of the population and utilisation of health services. Using a three-stage stratified sampling, twelve Union Councils (UC) with fairly complete enumeration lists were identified. Villages (PSU) located within 5 km of the government health facilities (GHF) within selected UC were listed and mapped. Five to twelve villages were randomly selected from each service area, with a target to sample at least 250 households per GHF catchment area. In this way, a population of 24 121 subjects from 2276 households and ninty-nine villages were surveyed. Overall the non-response rate was 9 %. Anthropometric information was available for 1051 children aged 0–35 months from 952 households and 95 villages.
Data collection
Age information
Mothers were interviewed to provide information about the child’s age, which was estimated with the aid of local event calendars listing important events, festivals and moon cycles.
Anthropometric measurements
Trained field workers took anthropometric measurements of children. In the Thatta survey, child’s weight was recorded to the nearest 0·1 kg using a portable 25 kg spring balance Salter Scales (Salter England, West Bromwich, UK). Weighing scales were calibrated daily using 20 kg weight. During weighing, children were lightly clad and without shoes/slippers. Recumbent length (for children less than 24 months) was measured to the nearest centimetre by portable flat wooden boards with a sliding foot piece (locally manufactured by Pakistan Medical and Dental Council). For children older than 24 months, standing height was obtained. Severely malnourished children were referred to a local hospital or a health centre for further assessment and care.
Data quality assessment
Completed questionnaires were checked and validated by field supervisors daily in both the surveys. Questionnaires with inconsistencies were re-sent to the field for correction. Data quality was maintained by supervision and retraining of the field staff. The national survey also used end-digit preference(22). Only 10·2 % of the children’s height and 13·2 % of the children’s weight were rounded to zero. A validation survey of 400 households was conducted within 2 weeks of the actual Thatta survey, for determination of data collection errors(27).
Anthropometric information was missing for 18 % and 30 %, respectively, of the national and Thatta subjects. For national data, responders were significantly younger [mean age = 15·5 months (sem = 0·51)] compared to non-responders [mean age = 17·4 months (sem = 0·22)]. There were significantly more boys (53 %) among responders compared to non-responders (44 %). For the Thatta survey however, age, gender, mean household income per capita and maternal education did not differ significantly by response status.
Data management and analysis
Measured heights and weights were converted to standard normal scores (Z-scores) on the NCHS reference and the WHO standard distributions adjusting for child’s age and gender with a software package named ANTHRO (available at http://www.who.int/nutgrowthdb). Z-score standard deviations were close to 1, suggesting reasonable quality of the measures(Reference de Onis and Blossner28).
Although WHO recommends taking a Z-score above +6 or below −6 as extreme values indicating measurement problems, we took +4 as the upper threshold of acceptable scores. This is because the probability of a child having a Z-score for weight-for-age (WAZ) or height-for-age (HAZ) greater than 4 is less than 0·0001(Reference Altman29), given that the means of WAZ and HAZ for a population like Pakistan are −1·4 (Table 2).
To account for unequal selection probabilities and to reduce bias in variance estimation, weights were calculated as the inverse of the sample selection probabilities. To account for data clustering, analysis was performed with SUDAAN(30) using the option of without replacement sampling design. Weighted prevalence of under-nutrition with 95 % confidence intervals is presented.
Prevalence of under-nutrition (percentage of children aged 0–35 months) was calculated following convention(Reference de Onis, Onyango, Borghi, Garza and Yang21, 31) as the number of children with Z-scores less than −2 sd below the NCHS reference or WHO standard for the following nutritional parameters: wasting (weight-for-height), stunting (height-for-age) and underweight (weight-for-age). 95 % CI were calculated for each prevalence measure. Mild, moderate and severe malnutrition were determined using the relevant parameters of the reference population as below −1 and down to −2 sd, below −2 and down to −3 sd and below −3 sd, respectively. Mean Z-scores (and their sd) for under-nutrition were calculated to compare the WHO standard and the NCHS reference.
Age-specific prevalence was calculated for seven age groups. During infancy, four age groups were created keeping in view the rapid growth velocity(Reference Gorstein32). These age groups included 0–3, 4–6, 7–9 and 10–12 months. During the second and third years, to account for slower growth velocities and to accommodate smaller numbers, the age groups were defined as 13–18, 19–24 and 25–35 months. To permit comparison with Thatta data, we limit our analysis to children under 3 years of age from national data.
Results
As expected, average household size was smaller for national (8·3) than for Thatta data (10·6) and the literacy level was better for national (35 %) than for Thatta (22·1 %) data. Greater proportion of the population belonged to low socio-economic status in the national sample (36 %) than in the Thatta sample (27·6 %).
Height, weight and age information were available for 1533 and 1051 children aged 0–35 months from the national and Thatta surveys, respectively. The gender distribution was similar in both datasets (53 % males). Mean ages (months) were younger for the national [boys: 8·3 (sem = 0·3) and girls: 8·9 (sem = 0·3)] compared to the Thatta sample [boys: 14·0 (sem = 0·4) and girls: 13·0 (sem = 0·4)].
Z-scores for under-nutrition
Pakistani children are shorter and lighter than the reference populations (Table 1). The mean Z-scores for all three parameters did not differ significantly with the choice of reference. However, mean Z-scores for height-for-age and weight-for-age were significantly lower for the Thatta than for the national sample.
Mean standard scores (Z-scores) and 95 % CI for indicators of under-nutrition among Pakistani children under 3 years of age: comparison of the WHO standard and National Center for Health Statistics (NCHS) reference with data from the National (1990–94) and the Thatta (1992–93) surveys

Prevalence of under-nutrition
Prevalence of wasting was higher with the WHO standard than the NCHS reference in both the national (18 % : 14 %) and the Thatta (23 % : 16 %) surveys (Table 2). The relative increase with the WHO standard was 26 % for the national and 46 % for the Thatta data. Similarly, stunting prevalence was higher with the WHO standard in both the national (37 % : 29 %) and the Thatta (53 % : 45 %) surveys, respectively, with the relative increase of 26 % and 18 %. On the other hand, prevalence of underweight was lower with the WHO standard for both the national (32 % : 36·5 %) and the Thatta data (46·5 % : 48 %), with the relative decrease of 15·5 % and 4 %, respectively, compared to the NCHS reference.
Percentage prevalence (95 % CI) of indicators of under-nutrition among Pakistani children under 3 years of age: comparison of the WHO standard and National Center for Health Statistics (NCHS) reference with data from the National (1990–94) and the Thatta (1992–93) surveys

Prevalence of severe under-nutrition
Prevalence of severely under-nourished children increased with the WHO standard compared to the NCHS reference (Table 2). The relative increase was greatest for wasting (national: 1·8 times and Thatta: twice), followed by stunting (national: 51 % and Thatta: 46·5 %) and underweight (national: 7·6 % and Thatta: 12 %).
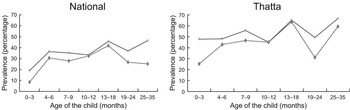
Age-specific prevalence of wasting
For both the surveys, wasting prevalence was significantly higher with the WHO standard compared to the NCHS reference up to the first 9 months (Fig. 1). The two curves began to converge at 10–12 months of age, following which the two references produced similar results.
Percentage prevalence of wasting by age with the WHO (![]() ) standard and the National Center for Health Statistics (
) standard and the National Center for Health Statistics (![]() ) reference for national and Thatta data
) reference for national and Thatta data

Age-specific prevalence of stunting
Stunting prevalence was similar across various age groups for both the surveys except for significantly higher prevalence obtained by the WHO standard for 25–35-month-old children in the national survey and 0–3- and 19–24-month-old children in the Thatta survey (Fig. 2).
Percentage prevalence of stunting by age with the WHO (![]() ) standard and the National Center for Health Statistics (
) standard and the National Center for Health Statistics (![]() ) reference for national and Thatta data
) reference for national and Thatta data
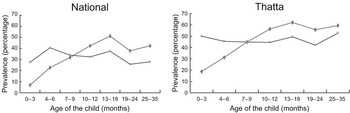
Age-specific prevalence of underweight
For both surveys, underweight prevalence was significantly higher with the WHO standard up to the first 6 months with a cross-over at 7–9 months (Fig. 3). For the rest of the ages, the WHO standard gave lower prevalence. The range of underweight prevalence across age groups was narrower with the WHO standard (40–50 %) than with the NCHS reference (20–60 %).
Percentage prevalence of underweight by age with the WHO (![]() ) standard and the National Center for Health Statistics (
) standard and the National Center for Health Statistics (![]() ) reference for national and Thatta data
) reference for national and Thatta data
Discussion
Impact of the WHO standard on prevalence of under-nutrition
Estimates of under-nutrition obtained with the WHO standard and the NCHS reference varied by growth indicator, age group and severity of under-nutrition. The high prevalence of under-nutrition in the Thatta compared to the national sample suggests that malnutrition is a very serious problem in this rural subset of the population. The WHO standard resulted in relatively higher overall prevalence of wasting and stunting and a relatively lower overall prevalence of underweight, similar to that observed in Bangladesh National Demographic and Health Survey (1996–97)(Reference de Onis, Onyango, Borghi, Garza and Yang21).
Compared to the NCHS reference, the growth pattern based on the WHO standard suggests a higher prevalence of wasting during the first 9 months, of stunting among 0–35-month-olds and of underweight during the first half of infancy (0–6 months). This is consistent with the predictions of a WHO group of experts(Reference de Onis, Onyango, Borghi, Garza and Yang21). It is interesting to note that use of the WHO standard showed higher prevalence of under-nutrition for all the three parameters during early life, including infants 0–3 months old. This indicates that under-nutrition in Pakistani children begins at a very early stage of infancy, even before weaning age. This could be related to poor maternal nutrition or health and low birth weight(Reference Rikimaru, Yartey, Taniguchi, Kennedy and Nkrumah33), suggesting that children are born malnourished(34). Relative increase in the prevalence of severe under-nutrition with the new standard would influence enrolling of children in therapeutic feeding programmes based on the criterion of severe wasting(35).
Study limitations
A number of methodological issues require attention. Misclassification of children as underweight or stunted is possible as age assessment was mainly based on recall of birth event and not on birth certificates. Use of a birth cohort would prevent the problem of age assessment and, hence, possible misclassification. In addition, age reporting in whole months could be another source of misclassification of nutritional status(Reference Gorstein32). As a result, the nutritional status of children whose actual ages were less or more than the nearest month could be under- or overestimated, respectively. For the entire population, although this effect can be balanced if the ages are equally distributed throughout the period (between the middle of the two months), such a distribution cannot be ensured and hence the possibility of misclassification remains. Prevalence of stunting and underweight obtained from computed ages and by ages rounded to the nearest month is, however, closely related(Reference Gorstein32). In a situation such as ours, where accurate age information is often not available, wasting serves as a useful parameter since it does not require knowledge of the child’s age(Reference Cole36).
Conclusion: public health implications
Use of the WHO standard provides new estimates of nutritional status. These should be taken into account while planning and implementing child health services and programmes. Under-nourished infants who are more likely to be missed under the old method than the older children are obvious beneficiaries of the new growth standard. We recommend that nutritional interventions and programmes should be especially targeted to infants (the most vulnerable group). Early onset of under-nutrition in our population points that improvement of children’s nutrition is dependent on improving maternal health and nutrition. Hence, maternal health promotion should be made an integral component of child survival programmes.
Since Millennium Development Goal 1 (1990–2015) aims to halve underweight prevalence among under-five children based on the WHO standard, the target for Pakistan would now be reduction from 32 % (based on national data) to 16 %. This is lower than reported earlier (20 %) based on the NCHS reference(Reference Bhutta37). Hence, accelerated efforts are needed to achieve the new target.
We recommend that Pakistan switch to the more robustly constructed and up-to-date WHO standard for assessing nutritional status of pre-school children. Otherwise, a significant proportion of wasted and stunted children who are at risk of excessive morbidity and mortality would be missed(Reference Pelletier and Frongillo38). A change in the growth standard will also influence the country’s ranking internationally by nutritional status and redefinition of the target population for nutritional interventions. The introduction of new standard would require re-analysis of earlier datasets based on the WHO standard for trend monitoring. Allocation of additional resources by policy makers would be needed for the introduction of new growth charts and for training of public and private health workers in their use and interpretation.
Acknowledgements
Conflicts of interest:The authors declare that there is no conflict of interest.
Funding support:Thatta Health System Research Project was provided by International Development Research Center (IDRC), Canada, and for National Health Survey of Pakistan by the US Government through the PL/480 Program.
Authors’ contributions:R.N. participated in the design of survey, conceived and designed the study, performed the literature review and data analysis and drafted the manuscript. M.K.L. participated in the study design and data interpretation and in revising the paper critically for substantial intellectual content. W.C.H. participated in the data interpretation and in revising the paper critically for substantial intellectual content. I.A. participated in the data organisation and interpretation.
We acknowledge Professor Gregory Pappas and Professor Zulifqar Ahmed Bhutta for critically reviewing the manuscript.


