In recent years, there has been growing interest in the potential of biomarkers in nutrition research. One of the areas with great expectations is the field of dietary biomarkers or food intake biomarkers. The interest in these biomarkers stems from the need for objective measures of dietary intake. The traditional methods such as FFQ, 24 h recalls and food diaries are all associated with a number of well-defined limitations including under-reporting, recall errors and difficulty in assessment of portion sizes(Reference Bingham1–Reference Dhurandhar, Schoeller and Brown3). Currently dietary biomarkers include 24 h urinary sodium, nitrogen and sucrose/fructose for estimation of salt, protein and sugar intake(Reference Ovesen and Boeing4–Reference Gibbons, Mcnulty and Nugent7). In recent years, the concept of biomarkers reflecting specific food intake has emerged. To date a number of putative biomarkers exist for the intake of a range of foods including, but not limited to, red meat, coffee, nuts, wine, vegetables, legumes, citrus fruit, tea and sugar-sweetened beverages(Reference Gibbons, Mcnulty and Nugent7–Reference Acar, Gürdeniz and Khakimov11). While some confusion exists in the literature over classification of biomarkers into recovery or concentration biomarkers, we prefer to use the newly defined flexible classification scheme for biomarkers related to food intake(Reference Gao, Praticò and Scalbert12). Food intake biomarkers are single metabolites, or a combination of metabolites, reflecting the consumption of either a specific food or food group, displaying a clear time– and dose–response after intake(Reference Gao, Praticò and Scalbert12). With this in mind, we present here an overview of the techniques used in food intake biomarker discovery, the experimental approaches used for biomarker discovery and challenges faced in the field.
Metabolomics: role in biomarker discovery
Metabolomics is the study of endogenous or exogenous metabolites in an organism. Metabolites are found in tissues and bio-fluids and are influenced by a number of factors including genetics(Reference Falcke, Bose and Artyukhin13), the microbiome(Reference Schuijt, Lankelma and Scicluna14) and environmental exposures such as food, exercise and pollutants(Reference Lampe, Huang and Neuhouser15, Reference O'Sullivan, Gibney and Brennan16). Metabolomics has emerged as a key tool in biomarker studies and in particular for biomarkers related to food intake. The sensitivity of modern instrumentation used in metabolomics can detect metabolite concentrations as low as 0·1 ng/ml in plasma(Reference Li, Yang and Buckley17). Metabolites by their nature have a prodigious range of structures which can inhibit identification as they can be transitory intermediates or end products of biological processes. Identification of the vast array of possible metabolites is currently the limiting factor in biomarker discovery. To aid the identification of metabolites, a number of databases have emerged. The human metabolite database (HMDB – http://www.hmdb.ca/)(Reference Wishart, Feunang and Marcu18) includes 114 100 empirical and in silico compounds and is readily searchable. Other databases include MyCompoundID, a library of 8 021 endogenous human metabolites with 10 583 901 predicted products of these metabolites (http://www.mycompoundid.org/mycompoundid_IsoMS/;(Reference Huan, Tang and Li19) the METLIN database (http://metlin.scripps.edu);(Reference Tautenhahn, Patti and Rinehart20) and MassBank of North America (MoNA; http://mona.fiehnlab.ucdavis.edu/).
Measurement of the metabolites
Metabolites in biofluid samples represent a wide range of molecules with diverse chemical nature and dynamic range. As a result, a number of platforms have emerged as key players in terms of measuring metabolites for biomarker discovery. A complete detailed review of all the techniques is beyond the scope of this review but an overview is given below and readers are referred to the following review for technical details on each approach(Reference Ulaszewska, Weinert and Trimigno21). In the initial years of emergence of metabolomics, the literature was dominated by NMR-based applications. NMR spectroscopy is a technique which has comparatively low sensitivity compared with other techniques(Reference Pan and Raftery22). However, it is useful as it is non-destructive, reproducible, quantitative and furnishes structural information. Little sample preparation is required, and results are consistent between different laboratories(Reference Gibbons, O'Gorman and Brennan23).
The MS-based approaches are extremely sensitive and are often coupled with a chromatography step to help with separation of the metabolites. GC–MS is a technique particularly suited to compounds of low polarity such as fatty acids, amino acids and sterols. Preparation of samples is somewhat complicated as samples must undergo chemical derivatisation prior to analysis to ensure that they are volatile. Compounds are separated on a column by their chemical properties causing them to elute at specific times (retention time). The eluted compounds are ionised and their mass-to-charge ratio (m/z) is determined(Reference Sparkman, Penton and Kitson24). This technique is particularly suited to lipids and all non-polar compounds(Reference Halket, Waterman and Przyborowska25).
Liquid chromatography MS is suitable for analysis of a broad range of metabolites. Its advantages over GC–MS include simple sample preparation and ability to analyse highly polar compounds(Reference Marquet26). Metabolites are separated on a column and the eluted compounds are ionised, and their m/z and retention time is detected as output. For analysis of large batches (greater than 100 samples), one must include the necessary controls to account for instrument instability over time and batch-to-batch variation(Reference Ulaszewska, Weinert and Trimigno21). Capillary electrophoresis separates compounds by their mobility in an electric field, based on their charge, viscosity and size. It is well suited to highly charged polar metabolites such as organics acids, nucleotides, peptides and their conjugates. It is coupled to MS instruments using electrospray ionisation(Reference Mikšík27). For high-throughput techniques where it is desirable to have low run time per sample direct infusion MS is often employed. In this approach, metabolites are analysed by nano-electrospray ion source after infusion directly into the ion source without prior separation. A high-resolution, high-accuracy instrument such as a Q-Exactive Orbitrap can identify individual metabolites based on their m/z ratios(Reference Ren, Zhang and Kong28).
As afore-mentioned, a key bottleneck in employing any of these techniques is the identification of the compounds. Tandem MS or MS/MS is a powerful technique which enables identification of compounds. Using this approach, initial ionised analytes are fragmented to produce smaller product ions from a parent ion. The ions can undergo several rounds of fragmentation, depending on the instrument. The first round (MS) is known as MS1 and the subsequent fragmentation is MS2, MS3,…MSn. As modern instruments have high mass accuracy, m/z of the fragments are used to build up a profile of a compound enabling identification which can then be confirmed with original standards(Reference Sumner, Amberg and Barrett29, Reference Blaženović, Kind and Ji30). Finally, it is worth noting that all these techniques can be run in either a targeted or un-targeted mode. In the targeted mode, a predefined list of metabolites are measured, whereas in an un-targeted mode, as many features as possible are measured. Depending on the research question, one can decide to operate in either mode or use a combination of both.
Food intake biomarkers
There are multiple study designs in which metabolomics can be applied to identify food intake biomarkers. Previous research study designs have employed one of two approaches either conducting an intervention study or using samples from a cross-sectional or epidemiology study to identify metabolites associated with food intake(Reference O'Gorman, Gibbons and Brennan31, Reference Cross, Major and Sinha32). Human intervention study designs involve requesting participants to consume specific food(s) over a defined period of time and biofluids, such as blood and urine, are collected at specific time-points depending on research interests. Once biofluids are collected, a range of metabolomic techniques as described earlier can be used to identify metabolites associated with the food intake. The time period involved in intervention studies varies depending on the research aims and can range from acute (single-day food challenge), to short- (days) or medium- (weeks) term interventions. Within the umbrella term of intervention studies, there are multiple designs and considerations. When implementing a cross-over design, participants are asked to follow specific dietary instructions, i.e. consuming a specific amount of a food of interest for a set time and changing to a diet with different amounts of, or completely lacking, the food of interest, thereby acting as their own control. Cross et al. employed this approach when examining 24 h urine samples for biomarkers of meat consumption. Participants were asked to consume four different diets for 14 d each containing a low- (60 g/d), medium- (120 g/d), high-portion of red meat (420 g/d) or a protein equivalent vegetarian diet(Reference Cross, Major and Sinha32). Targeted metabolic analyses were performed for four known meat-specific urinary metabolites, creatine, taurine, 1-methylhistidine and 3-methylhistidine. All four metabolites increased in concentration with increased meat consumption but only 1- and 3-methylhistidine concentrations were statistically different for each meat dose. In these cross-over studies, it is often necessary to consider a washout period: in this period certain dietary restrictions are in place, for example, avoiding specific foods/food groups for a time prior to consuming a high ‘food of interest’ diet. In a study related to cruciferous vegetables (CV) participants avoided CV and alliums for 12 days either side of a high CV diet intervention, containing broccoli and Brussel sprouts(Reference Edmands, Beckonert and Stella33). Clear urinary metabolic differentiation was seen between high and low CV diets, as signified in NMR spectra by four singlet peaks which were exclusive to high CV consumption and remained elevated above baseline at 48 h post consumption. The peaks were identified as S-methyl cysteine sulphoxide, a sulphur-containing amino acid ubiquitous in CV, and its metabolites.
Parallel group intervention studies have also been successful in food intake biomarker discovery. Hanhineva et al. randomised participants to follow one of three diets over a 12-week period including a healthy diet (wholegrain enriched diet, fatty fish and bilberries), a wholegrain-enriched diet or a control diet (avoiding whole grain cereals and bilberries, consuming low-fibre products, limiting fatty fish intake to one portion per week)(Reference Hanhineva, Lankinen and Pedret34). Plasma metabolomics revealed that 3-carboxy-4-methyl-5-propyl-2-furanpropionic acid was associated with fatty fish intake and alkylresorcinol metabolites were associated with wholegrain intake.
Using samples from epidemiology studies, one examines correlations between self-reported food intake and biomarkers measured in urine or blood samples. Guertin et al. applied an ultra-high-pressure liquid chromatography and GC–MS metabolomics approach when examining serum samples from a subset of the prostate, lung, colorectal and ovarian cancer screening trial to identify biomarkers related to the intake of thirty-six food groups(Reference Guertin, Moore and Sampson8). The data revealed that thirty-nine biomarkers were significantly associated with intake of food groups such as citrus, green vegetables, red meat, fish, shellfish, butter, peanuts, rice, coffee, beer, liquor, total alcohol and multivitamins. Other approaches have compared consumer and non-consumers of certain foods to identify biomarkers increased in the consumers. Using this approach, Rothwell et al. identified discriminating biomarkers in the urinary metabolome of twenty high coffee consumers and nineteen non-consumers in a subset of the SU.VI.MAX2 cohort(Reference Rothwell, Fillâtre and Martin35). Many other examples using this approach have emerged in recent years and readers are referred to Guasch-Ferré et al., for an overview of such studies(Reference Guasch-Ferré, Bhupathiraju and Hu36).
Once identified it is critical that the biomarkers are assessed for validity as biomarkers of food intake. Recently a validation procedure was put forward as part of the FoodBall consortium which included plausibility, dose–response, time–response, robustness, reliability, stability, analytical performance and inter-laboratory reproducibility as the eight criteria for assessment of validation(Reference Dragsted, Gao and Scalbert37). While assessment of all these criteria may not be possible in a single study, it is important that they are considered and that at least the plausibility and dose–response are assessed. Using the afore-mentioned study designs, a number of putative biomarkers have emerged in the literature; a full review of such markers is beyond the scope of this review and readers are referred to work by the FoodBall consortium which has performed a series of systematic reviews for commonly consumed foods. The foods covered to date in the systematic reviews include (1) apples, pears and stone fruit, (2) legumes, (3) dairy and egg products and (4) non-alcoholic beverages(Reference Ulaszewska, Vázquez-Manjarrez and Garcia-Aloy38–Reference Rothwell, Madrid-Gambin and Garcia-Aloy41). Other reviews which cover the commonly consumed foods in Europe are underway. From the presently published reviews, it is obvious that a number of putative markers exist; however, there are no fully validated markers of these foods. This highlights the urgency in developing strategies to ensure that we have fully validated biomarkers.
Use of food intake biomarkers in quantifying intake
The ultimate goal of a food intake biomarker is to quantify intake of the specific food. Despite the proliferation in the number of putative biomarkers of food intake, there is paucity of data demonstrating the quantitative ability of food intake biomarkers. Notwithstanding this, there are two examples in the literature that demonstrate the potential.
Examining the potential of the well-established marker of citrus intake, our previous work demonstrated that proline betaine could be used to determine citrus intake. Using a controlled dietary intervention approach, participants consumed standardised breakfasts for 3 consecutive days over 3 weeks where orange juice intake was decreased over the 3-week period(Reference Gibbons, Michielsen and Rundle42). Using the urinary proline betaine concentrations, calibration curves were established. Using these calibration curves, the citrus intake was determined in an independent cross-sectional study of 560 individuals. There was excellent agreement between the self-reported intake (estimated from a 4 d semi-weighed food diary) and the estimated intake from the biomarker with a low mean bias of 4·3 g between the methods. This study clearly demonstrates the potential of well-validated food intake biomarkers. In a separate study, Garcia-Perez et al. examined the ability of tartaric acid to determine grape intake(Reference Garcia-Perez, Posma and Chambers43). A dose–response relationship was established between grape intake and urinary tartaric acid levels. The agreement between estimated intake and actual intake was good and a correlation coefficient of R 2 = 0·9 was reported. Overall, these two examples provide strong evidence of the potential of food intake biomarkers and demonstrate the importance of assessing dose–response relationships on identified biomarkers. However, it is also worth noting that not all biomarkers will be fully quantitative but will still yield useful information for examining relationships with health outcomes (Fig. 1).
(Colour online) An overview of the applications of dietary biomarkers. Biomarkers can give information on (1) food intake, (2) dietary patterns and (3) relationships with health outcomes.

Biomarkers of dietary patterns
In nutrition research, there has been an increased interest in examining the diet as a whole instead of examining intake of single foods or nutrients. With this in mind, the concept of dietary patterns has emerged and the potential of using biomarkers to classify individuals into different dietary patterns is of interest. For the present review, we focus on the studies that have used a metabolomics-based approach to classify individuals into dietary patterns.
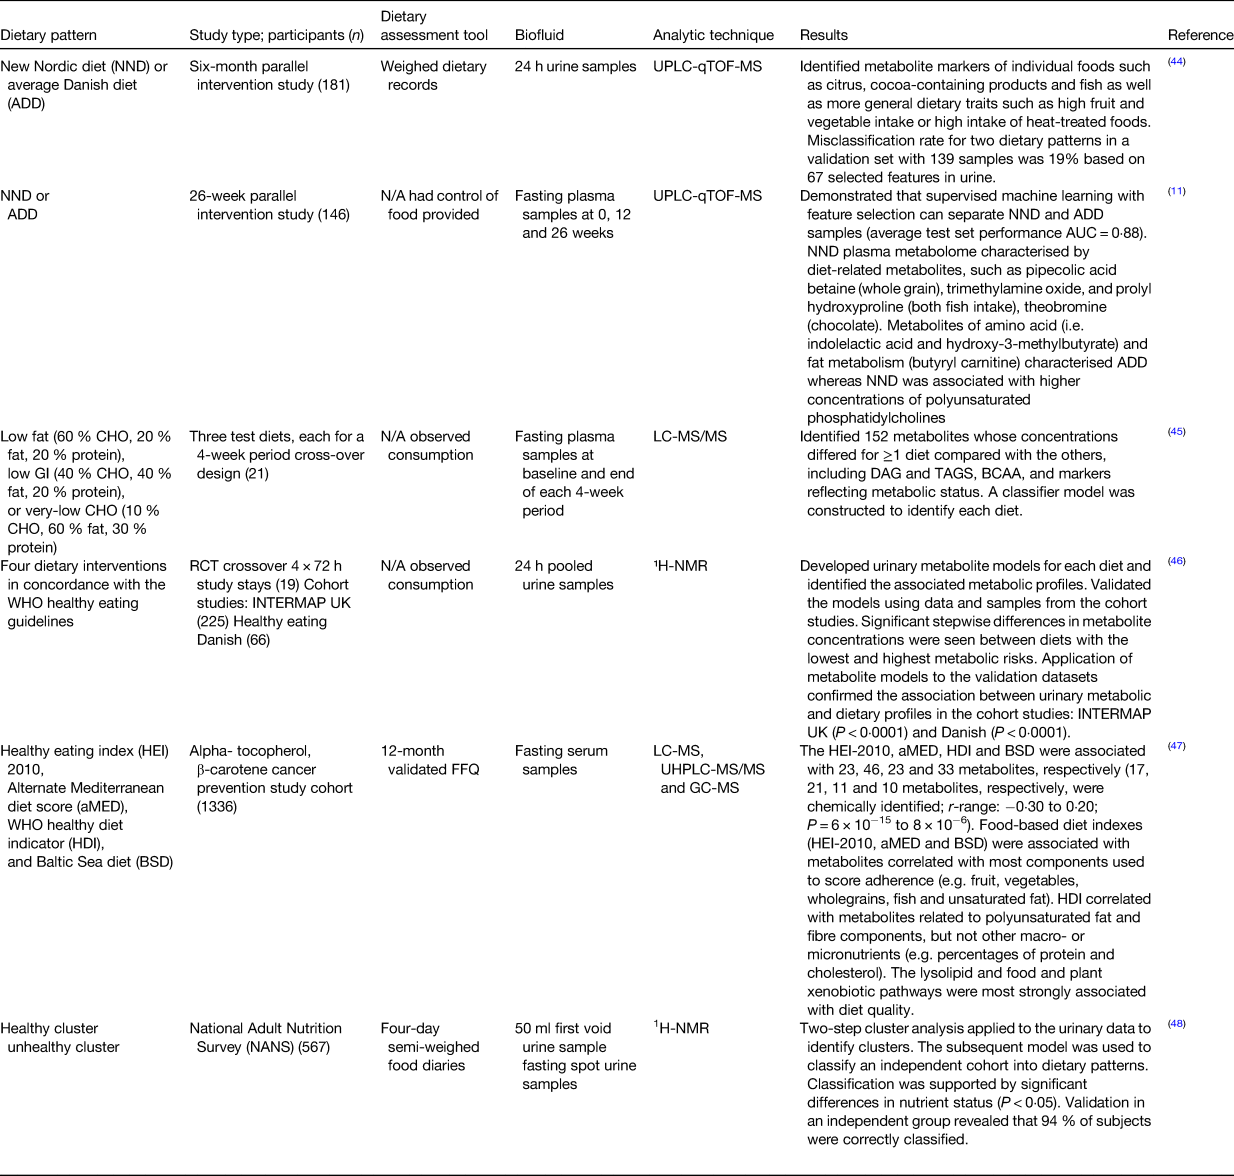
Andersen et al. used an untargeted metabolic phenotyping approach to distinguish between two dietary patterns with the purpose of developing a compliance measure for adherence to the new Nordic diet or an average Danish diet(Reference Andersen, Rinnan and Manach44) (see Table 1). Using the urinary metabolic profile, a multivariate model was established that could distinguish the two dietary patterns with a low misclassification error rate (19 %) clearly indicating that this approach could be used for the examination of compliance to a certain dietary pattern. A follow-up paper also demonstrated that a classification model could be built using plasma metabolites to assess compliance to the new Nordic diet and average Danish diet diets(Reference Acar, Gürdeniz and Khakimov11). Esko et al. used a controlled feeding study to examine three different dietary patterns. These dietary patterns differed in macronutrient composition: low fat (60 % carbohydrate, 20 % fat, 20 % protein), low glycaemic index (40 % carbohydrate, 40 % fat, 20 % protein) and very-low carbohydrate (10 % carbohydrate, 60 % fat, 30 % protein)(Reference Esko, Hirschhorn and Feldman45). A classification model was built that could distinguish the three dietary patterns using plasma metabolites. These results support the concept that a metabolite-based model could be used in checking for adherence to specific diets and for the examination of relationship between dietary patterns and health outcomes in large epidemiological studies. Garcia-Perez et al. used a controlled intervention to develop a urinary metabolomics model that could classify individuals into dietary patterns(Reference Garcia-Perez, Posma and Gibson46). The four diets were based on the WHO healthy eating guidelines for the prevention of non-communicable diseases. Work from our laboratory used a cross-sectional study to develop a model based on urinary metabolomic data which could classify subjects into either a healthy or an unhealthy dietary pattern(Reference O'Sullivan, Gibney and Brennan16). The classification into the dietary patterns was supported by significant differences in blood parameters such as higher folate and 25(OH)-vitamin D in the healthy dietary pattern. The work presented by these examples demonstrates the potential of metabolomics-based approaches to identify dietary patterns and study the relationships with health outcomes. However, further work is needed to refine and develop these concepts further so that metabolomics-based biomarkers can be used for rapid and objective classification of individuals into dietary patterns.
Overview of studies using biomarkers for determining dietary patterns

UPLC-qTOF-MS, ultra-high-performance liquid chromatography quadrupole time of flight MS; AUC, area under the curve; CHO, carbohydrate; GI, glycaemic index; DAG, diacylglycerols; BCAA, branched chain amino acids; RCT, randomised control trial; ¹H-NMR, proton NMR.
While the afore-mentioned papers have developed the concept of examination of dietary patterns using metabolite biomarkers, there is also a large interest in examining the relationship between the metabolomic profile and known predefined dietary patterns such as the Mediterranean diet. The potential of such approaches is that it will allow the examination of the impact of dietary patterns on metabolic processes and pathways(Reference Playdon, Moore and Derkach47). Collectively, the studies presented earlier provide compelling evidence for the potential of metabolite biomarkers as a method for objectively assigning individuals into dietary patterns and for studying the effects of the certain dietary patterns on metabolic pathways.
Future challenges and outlook
While significant progress has been made in the past 5 years in the area of dietary biomarkers, there remain a number of challenges that need to be addressed. The validation of putative biomarkers is often overlooked and confusion thus arises as to the validity of biomarkers. It is essential in moving forward that all food intake biomarkers are validated and a suggested validation scheme now exists. In many metabolomics studies, the identification of metabolites to a high degree of certainty is challenging and many of the current databases lack metabolites that are related to food intake. International collaborative efforts are needed to try to optimise the identification process. To ensure that the food intake biomarkers are functional in different ethnic groups, it will be essential to develop quantitative methods for biomarker measurement to ensure reliable cross-cohort comparison. Examples of other challenges include the potential use of multiple biomarkers for single foods: optimal methods for their use to estimate intake will need to be developed. Furthermore, many biomarkers will be indicators of short-term intake and defining strategies to obtain measures of long-term intake still remains a challenge. While multiple challenges exist for the field, it is also worth noting that considerable advances have been made in recent years, and with global consolidated efforts, it remains a possibility that objective biomarkers will improve our methods for assessing dietary intake.
Acknowledgements
The authors acknowledge the support from Dr Aoife O'Gorman.
Financial Support
This work was supported by a H2020 European Research Council (647783).
Conflict of Interest
None.
Authorship
L. B. conceived and oversaw the writing of the paper. All authors contributed to writing of the paper. C. C. and A. E. McN. contributed equally.