





Obesity is a global health concern, with a third of the world’s population being overweight or obese. The current prevalence of obesity is twofold compared with that recorded in 1980(Reference Chooi, Ding and Magkos1). Obesity is associated with chronic metabolic diseases, including CVD, diabetes, fatty liver disease and several cancers(Reference Bluher2), leading causes of mortality globally. The aetiology of obesity is multifactorial(Reference van der Klaauw and Farooqi3), and several metabolic pathways contribute to obesity. Moreover, numerous genetic variants have been linked to obesity(Reference Loos and Yeo4). Genetic predispositions to obesity can stimulate increased adiposity throughout adulthood(Reference Song, Zheng and Qi5). However, increasing evidence suggests that the interaction between genetic factors and healthy dietary habits may modify the genetic association with obesity(Reference Wang, Heianza and Sun6).
Several epidemiological studies have revealed an attenuated genetic association with obesity by consuming healthy diets, including fruits, vegetables and whole grains. A study of two large cohorts in the USA showed that increasing fruit and vegetable intake can mitigate BMI and body weight increases among individuals with a greater genetic susceptibility to obesity(Reference Wang, Heianza and Sun7). A plant-based dietary pattern was associated with low adiposity and reduced risk of high blood pressure and stroke among individuals with a genetically higher risk of obesity in a large cohort study from the UK(Reference Heianza, Zhou and Sun8).
In contrast, unhealthy eating habits, such as high-fat or sugar consumption, increase the genetic association with obesity. The intake of total and saturated fats had a stronger positive association with BMI in individuals with a higher genetic risk score (GRS) for obesity than in those with a lower GRS(Reference Celis-Morales, Lyall and Gray9). In particular, interactions between GRS and poor fat quality were shown to influence obesity and metabolic syndrome(Reference Rasaei, Fatemi and Gholami10,Reference Rasaei, Daneshzad and Khadem11) . Moreover, the genetic association with BMI was elevated in individuals with a high intake of sugar-sweetened beverages. The relative risks for incident obesity per increment of ten risk alleles were more than threefold higher in the highest consumption group than in the lowest intake group(Reference Qi, Chu and Kang12). These findings underscore the need to evaluate how different dietary patterns interact with genetic predisposition.
Several studies have investigated the effect of dietary intake on the genetic association with obesity in the Korean population. Variants of COBLL1, a gene related to weight maintenance and appetite, were associated with fat intake and BMI and incidence of obesity in a prospective cohort of the Korean population(Reference Kwak and Shin13). However, it has been suggested that modifying environmental factors such as diet may exert a stronger impact on obesity than genetic variants(Reference Corella, Ortega-Azorin and Sorli14,Reference Bjornland, Langaas and Grill15) . Therefore, exploring the interaction of dietary factors and genes with a genome-wide predisposition to obesity is important.
The GRS is a useful measurement that improves the predictive value of a genetic variant by simultaneously combining multiple loci(Reference Moonesinghe, Liu and Khoury16). The relationship between the obesity-related genetic (polygenic) risk score and calorie intake has been investigated in a previous study that employed three large Korean cohorts, revealing no significant interaction(Reference Lee, Lim and Jung17). Meanwhile, the interactive association between healthy dietary patterns and BMI-GRS was non-significant in a European cohort(Reference Nettleton, Follis and Ngwa18). Food consumption patterns are widely used to capture the overall effects of complex dietary consumption rather than a single dietary intake(Reference Hu19) and may be more effective in capturing a genetic association with obesity. However, whether dietary patterns and the GRS interact to develop obesity in the Korean population remains unclear. Therefore, we explored the dietary patterns that influence the genetic risk of obesity in a Korean population using a large cohort study and a genome-wide association study (GWAS).
Methods
Study design and population
This study included participants from the Ansan and Ansung cohorts of the Korean Genome and Epidemiology Study (KoGES), a prospective study conducted by the Korea Disease Control and Prevention Agency between 2001 and 2002 to examine common chronic diseases among Koreans. The initial cohort consisted of 10 030 Korean adults aged 40–69 years. This study involved whole-genome SNP genotyping to identify the genetic and environmental factors contributing to obesity-related diseases. The inclusion criterion was participation in the baseline Ansan and Ansung cohorts. After applying specific exclusion criteria, the study sample was refined. The exclusion criteria were as follows: participants with missing dietary intake data (n 697); participants with missing height and weight information (n 4); participants with missing data on obesity measurements (e.g. waist, hip) (n 12); participants with implausible total energy intakes (< 2093 or > 20 930 kJ/d (500 or 5000 kcal/d)), which is a commonly applied criterion in large-scale nutritional epidemiology studies to remove physiologically unrealistic values(Reference Shin and Lee20,Reference Cho, Lim and Yun21) ; participants with a BMI > 50 kg/m2 (n 381); and those with incomplete genotype data (n 478). This led to a final sample of 8458 individuals; 52·5 % were female, and 47·5 % were male (see online supplementary material, Supplemental Fig. S1). The study was conducted in accordance with the KoGES guidelines (4851-302) and the Declaration of Helsinki and its later amendments. Approval was granted by the Institutional Review Board of Chung-Ang University (IRB number: 1041078-20230712-HR-190) and the National Research Institute of Health under the Centers for Disease Control and Prevention, Ministry of Health and Welfare, Republic of Korea. The participants provided their written informed consent to participate.
Genome-wide association study and genetic risk score calculation
Genomic DNA was extracted from peripheral blood leukocytes collected from the participants in the Ansan and Ansung cohorts. Genotyping was conducted using the Affymetrix Genome-Wide Human SNP Array 5·0 (Affymetrix, Inc.). The whole-genome imputed data for the cohort were obtained from the Korea Disease Control and Prevention Agency. SNP markers were filtered based on call rate, minor allele frequency and Hardy–Weinberg equilibrium, following the criteria from a previous study(Reference Cho, Go and Kim22). SNP imputation was performed using the IMPUTE software (version 1; University of Oxford)(Reference Marchini, Howie and Myers23), referencing the NCBI build 35 and dbSNP build 126, with an initial reference set consisting of 90 individuals from the Japanese in Tokyo and Chinese in Beijing populations in HapMap (release 22). SNP with a minor allele frequency < 0·01 and a missing rate > 0·05 were excluded. The SNP data from the Ansan and Ansung cohorts were then merged with 1·5 million imputed SNP for association analysis with a chosen quantitative trait. A GWAS analysing the interaction between SNP and BMI was performed using PLINK v1·90, employing a linear regression model adjusted for sex and age as covariates, analysing a total of 1 591 162 SNP(Reference Purcell, Neale and Todd-Brown24). Significant SNP were identified using a threshold of −log10 P-value > 5. Linkage disequilibrium clumping and analysis were performed with PLINK, and Haploview v4·2 was used to visualise linkage disequilibrium blocks. The SNP positions and nomenclature were annotated according to the Ensembl release 54. The GRS for each participant was calculated using the six SNP most strongly associated after clumping, following the model outlined below:
 $${\rm{GRS}} = \sum\limits_{i = 1}^n r isk\;allele\;in\;SN{P_i} \times {\beta _i}$$
Participants were divided into three groups based on their GRS distributions. Beta values represent the effect size of each SNP with increasing BMI. Therefore, participants with a low GRS are associated with a lower risk of having a higher BMI, whereas those with a high GRS are associated with a higher risk. Accordingly, the low, medium and high-genetic risk groups represent participants with low, intermediate and high GRS levels, respectively (see online supplementary material, Supplemental Table S3).
Covariates
General characteristics of the study population were collected using questionnaires and various anthropometric and clinical assessments, including height, weight and BMI (calculated as weight in kilograms divided by height in metres squared (kg/m2)). Demographic data were organised according to the two cities (Ansan and Ansung) and household income levels (categorised as monthly income in Korean won (KRW), where 1 million KRW is approximately 750 USD, into three brackets: < 1 million, 1–3 million and > 3 million KRW). Although education level was also assessed, only household income was included in the multivariable models to avoid redundancy and potential multicollinearity between socioeconomic variables. In addition, drinking status (current, former or never) and smoking status (current, former or never) were each categorised into three groups. Daily physical activity duration was categorised into the following groups: none, < 30 min, 30–60 min, 60–90 min, 90 min to 2 h, 2–3 h, 3–4 h, 4–5 h or > 5 h. Physical activity was quantified using metabolic equivalents (MET) following the International Physical Activity Questionnaire(Reference Jetté, Sidney and Blümchen25), which categorised participants into three levels: ‘low’, ‘moderate’ and ‘high’ physical activity(26). Individuals classified as having ‘high activity’ engaged in vigorous-intensity activities for at least thrice weekly, totalling at least 1500 MET-min per week, or participated in a combination of various activities for ≥ 7 d per week, achieving at least 3000 MET-min per week. The ‘moderate activity’ category included those who met any of the following conditions: vigorous-intensity activity for at least 20 min per day on ≥3 d per week, moderate-intensity activity and/or walking for at least 30 min per day on ≥ 5 d per week, or a combination of walking, moderate and vigorous activities on ≥ 5 d per week, totalling at least 600 MET-min per week. Those who did not meet any of these criteria were classified as ‘low activity’.
Dietary pattern analysis
Dietary intake was assessed using a semi-quantitative FFQ that provided data on the average consumption frequencies and portion sizes of 103 food items(Reference Ahn, Kwon and Shim27). Principal component analysis was employed to extract dietary factors, and varimax rotation was used to enhance interpretability. We retained dietary factors with eigenvalues of ≥ 1·0 based on the Kaiser criterion, supported by scree-plot inspection and the interpretability of the extracted factors within our dataset. Four factors met these criteria, and we subsequently focused on components with substantial variance contributions and loadings of ≥ 0·3 (see online supplementary material, Supplemental Table S1). Based on these criteria, we identified four distinct dietary patterns and named them according to the characteristic food groups they included. To examine the association between these dietary patterns and obesity, we divided the factor scores into tertiles (T1, T2 and T3). The nutrient intake levels representative of each dietary pattern were calculated based on these tertiles.
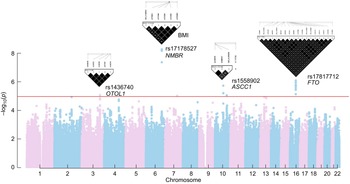
Genome-wide Manhattan plot for BMI. The –log10P values are presented using the trend test for SNP distributed across the entire genome. The red line indicates the signals with −log10P value > 5 detected in the genome-wide association study. A total of 1 590 162 SNP were used to generate the plot.

Statistical analysis
Statistical analyses were performed using SAS software (version 9.4; SAS Institute) with the threshold for statistical significance set at a P-value < 0·05. Categorical and continuous variables were compared using χ 2 tests and regression models, respectively. Multivariable-adjusted logistic regression and interaction analyses were used to calculate the OR and 95 % CI for obesity across the tertiles of each dietary factor and the three GRS groups, with adjustments for relevant covariates. Regression models were also used to assess P-values for trends.
Results
Basic characteristics of the study population
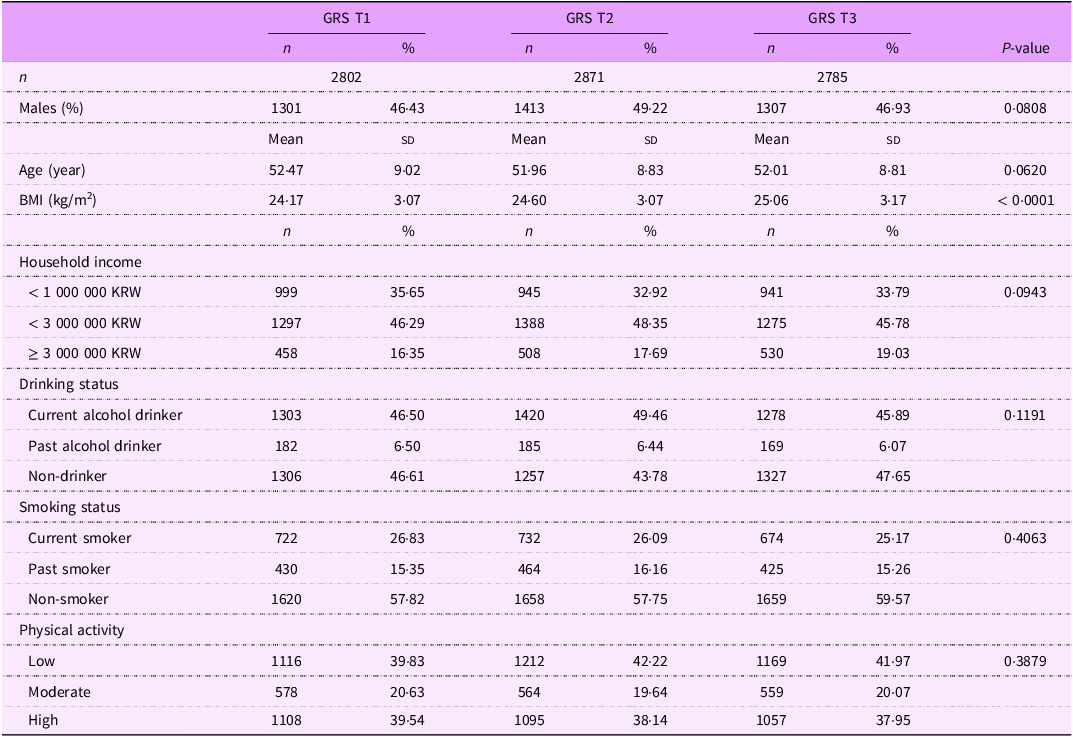
The basic characteristics of the study participants, categorised by GRS tertiles for obesity, are summarised in Table 1. The participants were divided into the following groups based on their GRS: T1 (lowest risk), T2 (moderate risk) and T3 (highest risk). Notable variations were observed in the demographic and lifestyle characteristics across these groups. The average age showed a decreasing trend from T1 to T3; however, this trend was non-significant (P = 0·0620). BMI showed a significant increase across the GRS tertiles, with the highest GRS group (T3) exhibiting a higher average BMI (25·06 (sd 3·17) kg/m2) than the lowest GRS group (T1, 24·17 (sd 3·07) kg/m2) (P < 0·0001), indicating a strong association between higher genetic risk for obesity and increased BMI. Household income distribution varied among the GRS groups but was non-significant (P = 0·0943). Drinking status, smoking status and physical activity levels also showed similar proportions of current alcohol drinkers across the groups.
Basic characteristics according to genetic risk of obesity among Korean adults from the Ansan and Ansung cohorts
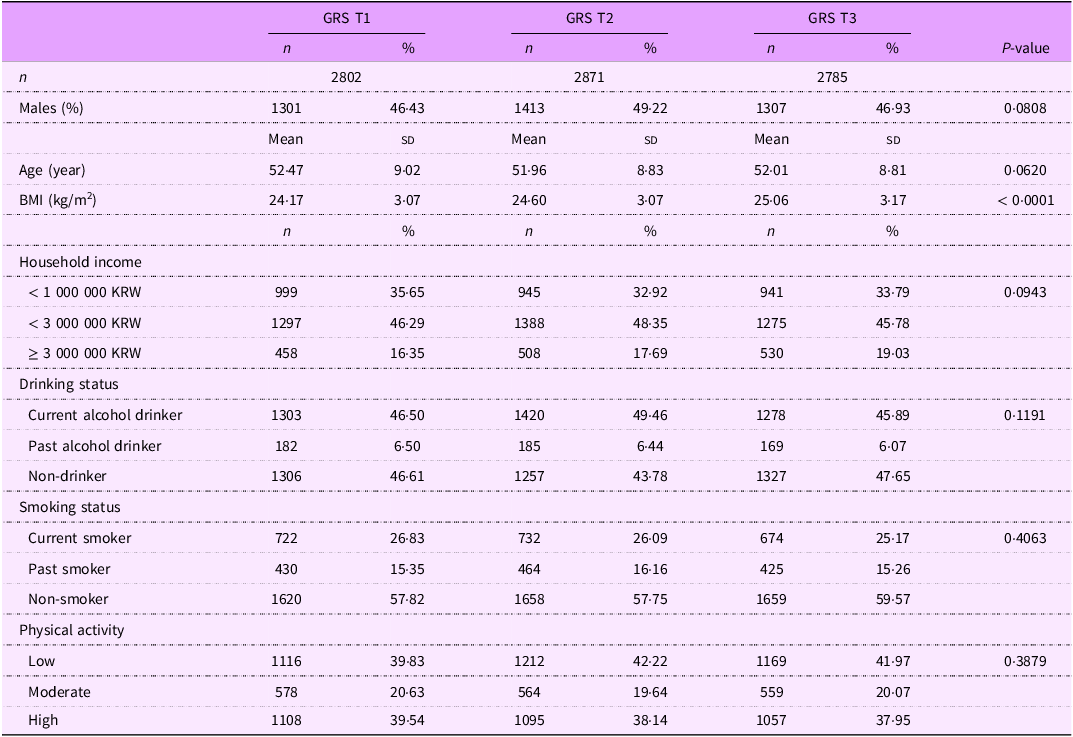
GRS, genetic risk score; KRW, Korean won.
Values are the number of participants with percentages for categorical variables and mean (sd) for continuous variables. Categorical and continuous variables were compared using χ 2 tests and regression models, respectively.
Genome-wide association study of obesity
A GWAS was conducted to identify genetic loci associated with obesity using BMI as the phenotypic trait. A total of 1 590 162 SNP were analysed across all chromosomes in the Ansan and Ansung cohorts. The number of SNP varied across chromosomes, with the highest number identified in chromosome 2 (142 070 SNP) and the lowest in chromosome 22 (17 942 SNP). The average interval between SNP across all chromosomes was approximately 1856 base pairs (bp). Chromosome 19 had the largest average interval of 3549 bp, whereas chromosome 6 had the smallest average interval of 1422 bp. The total genomic distance covered by the SNP was approximately 2·78 billion bp, with an average sd of 20 801·7 bp for SNP intervals. These results provide a detailed landscape of SNP distribution across the human genome, enabling a comprehensive association analysis for obesity (see online supplementary material, Supplemental Table S2).
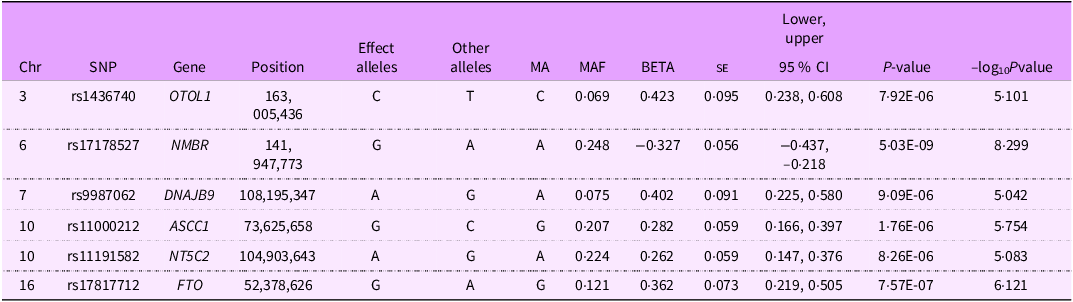
The GWAS results were visualised using Manhattan plots to assess the distribution of the observed P-values against the expected values (Fig. 1). Thirty-four SNP showed significant associations with BMI, surpassing the threshold of −log10 P-value > 5. After applying linkage disequilibrium clumping, six SNP exhibited the most robust associations with BMI and the calculated GRS for each participant (Table 2). These SNP are located on different chromosomes and are annotated with specific genes. The effect sizes (beta values) for these SNP ranged from –0·327 to 0·423, indicating positive and negative effects on BMI. For example, rs1436740 in OTOL1 demonstrated a beta value of 0·423 (95 % CI: 0·238, 0·608, P = 7·92E-06), suggesting a strong positive association with increased BMI. Conversely, rs17178527 in the NMBR gene exhibited a beta value of –0·327 (95 % CI: –0·437, –0·218, P = 5·05E-09), indicating a negative association with BMI. The results suggested that these genetic loci may play a role in regulating BMI and obesity. Several of these loci have also been previously associated with adiposity-related or metabolic traits, supporting the biological plausibility of their involvement in BMI regulation.
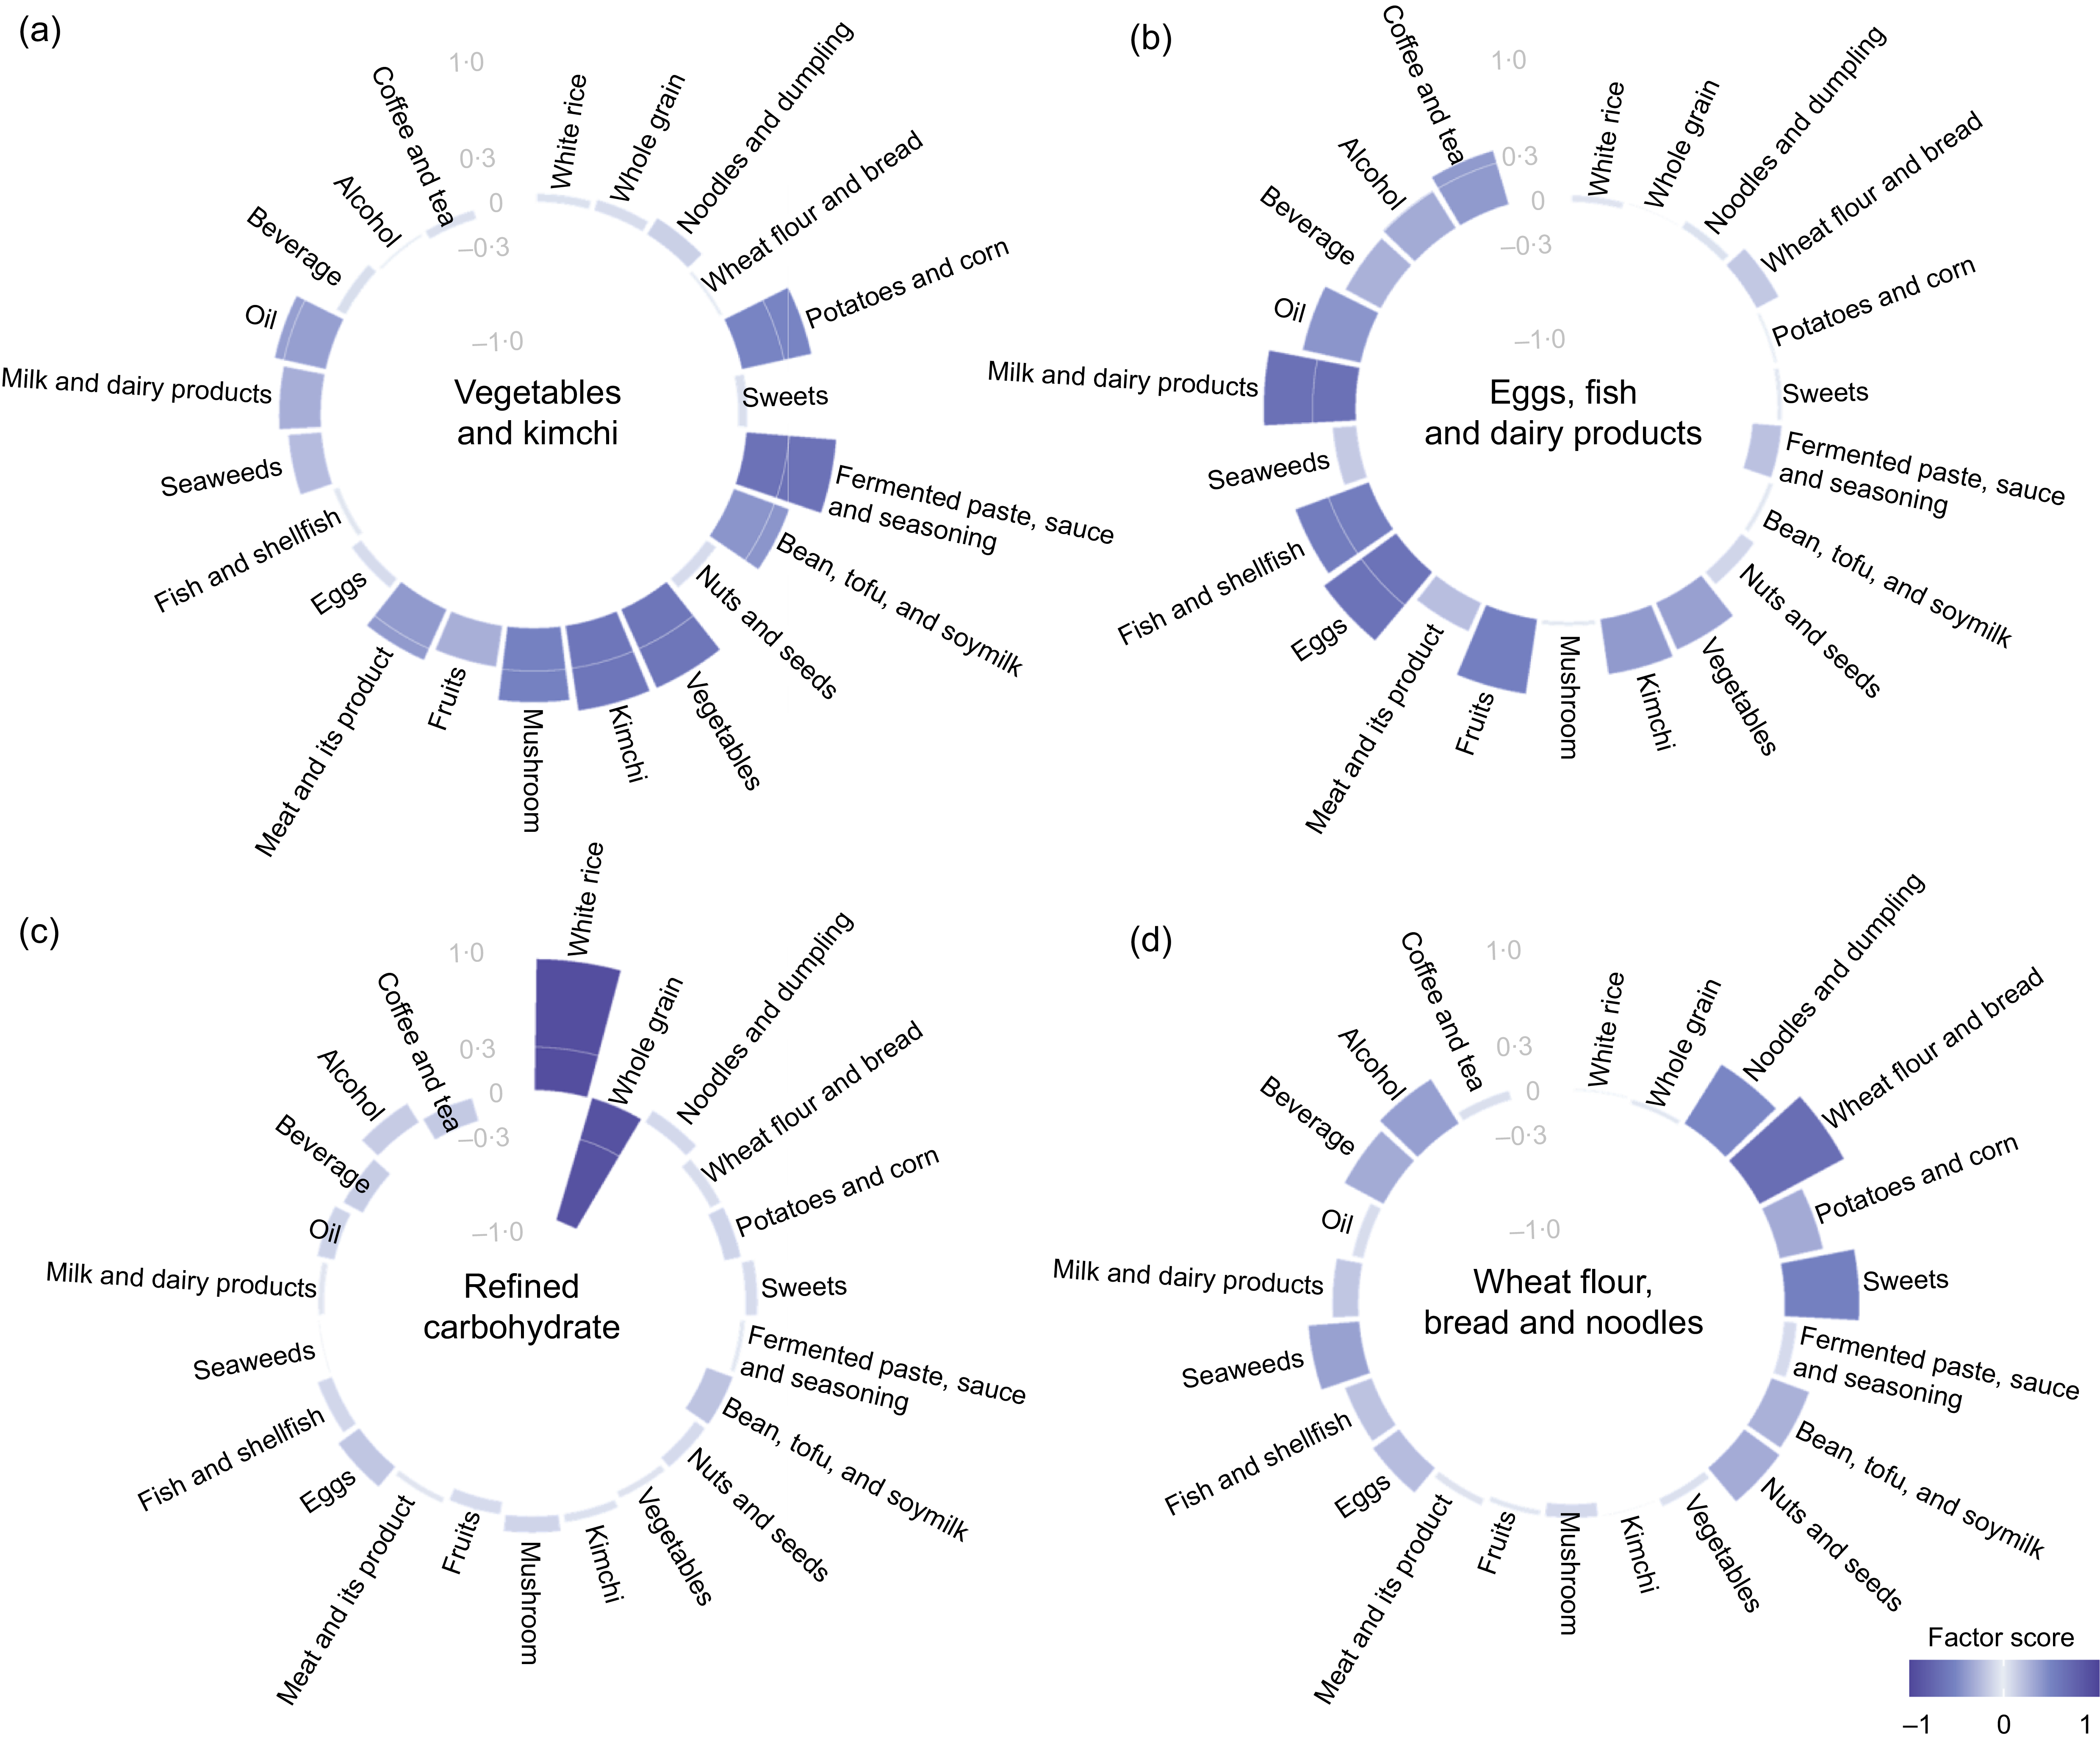
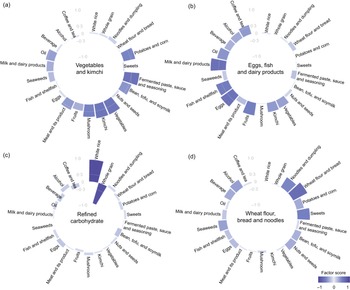
Factor loading for major dietary patterns identified according to factor analysis. (a) ‘Vegetables and kimchi’ pattern, (b) ‘Eggs, fish and dairy products’ pattern, (c) ‘Refined carbohydrate’ pattern and (d) ‘Wheat flour, bread and noodle’ pattern. The dietary patterns were named based on the top food groups with the highest factor-loading values.
Genetic characteristics of the six SNP associated with BMI among Korean adults from the Ansan and Ansung cohorts
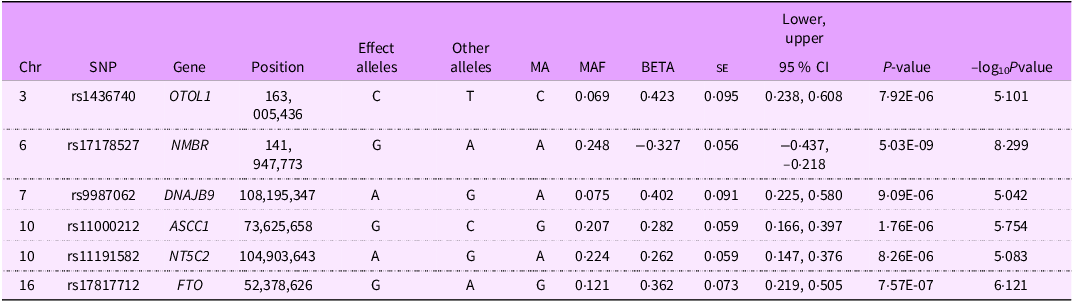
Chr, chromosome; MA, minor allele; MAF, minor allele frequency.
Dietary pattern analysis
Four major dietary patterns were identified from the factor analysis and named after foods or food groups with high factor-loading values (see online supplementary material, Supplemental Table S1 and Fig. 2). The ‘Vegetables and kimchi’ pattern was characterised by high consumption of fermented paste, sauces and seasonings, vegetables and kimchi. The ‘Eggs, fish and dairy products’ pattern was characterised by high consumption of eggs, fish and shellfish and dairy products such as milk. The ‘Refined carbohydrate’ pattern was typified by highly positive factor loadings for white rice and negative factor loadings for whole grains. The ‘Wheat flour, bread and noodles’ pattern was classified by high consumption of noodles, dumplings, wheat flour, bread and sweets.
Interactive effects of dietary patterns and genetic risk score on obesity prevalence
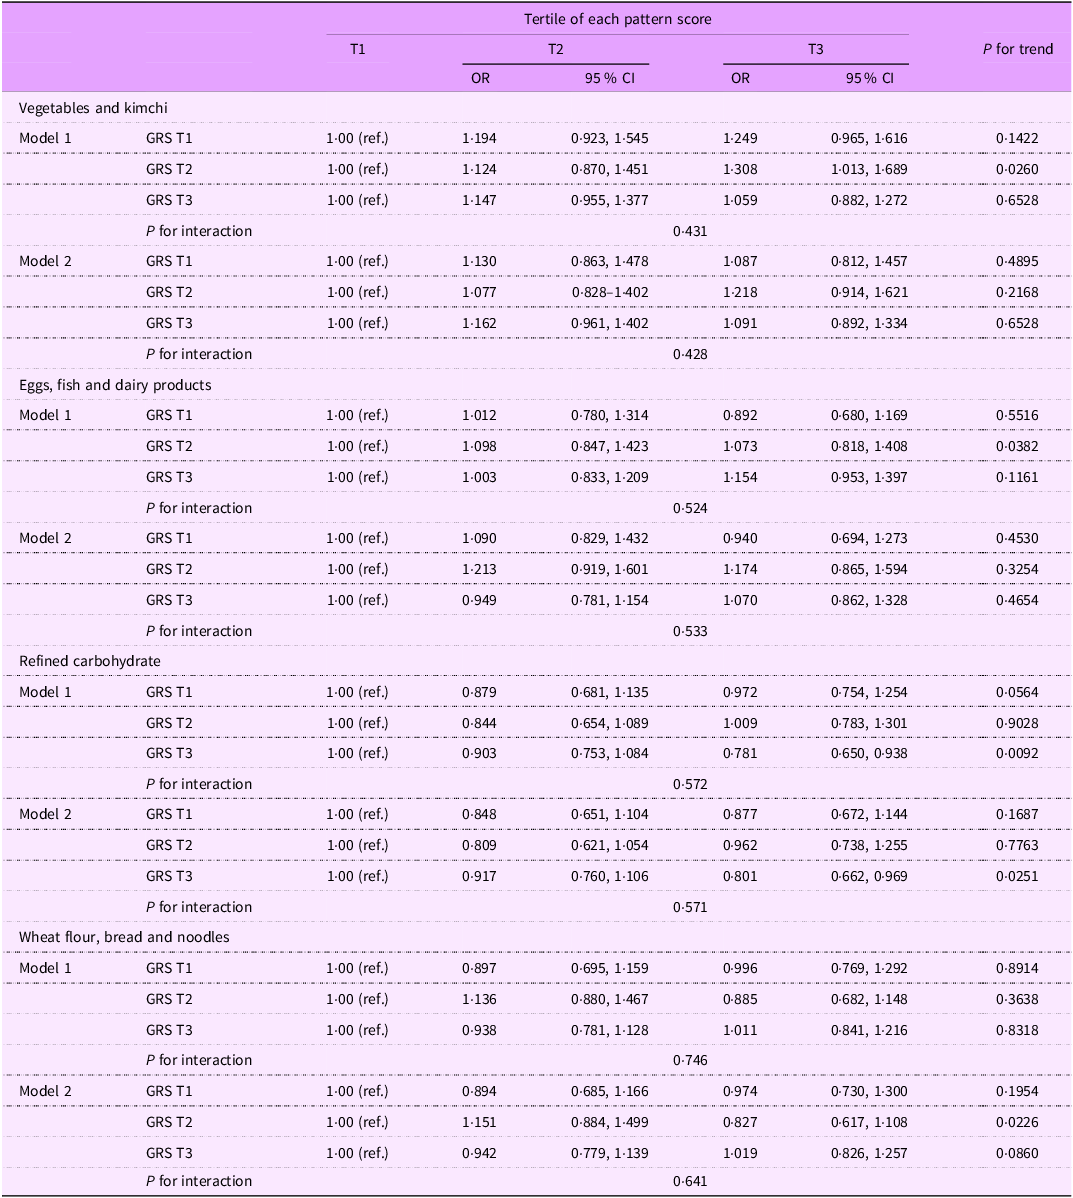
The OR and 95 % CI for obesity prevalence across the interactions of the dietary pattern tertiles and GRS levels are summarised in Table 3 (see online supplementary material, Supplemental Table S4). Obesity prevalence was assessed using dietary pattern tertiles, with the lowest tertile (T1) of each pattern at each GRS level serving as the reference. In the ‘Vegetables and kimchi’ pattern, participants in the GRS T2 group exhibited an increased OR for obesity compared with the OR of those in T1 in model 1 (P for trend = 0·0260). For the ‘Eggs, fish and dairy products’ pattern, participants in the GRS T2 group showed a marginal increase in obesity prevalence compared with the prevalence in T1 in model 1 (P for trend = 0·0382). Conversely, the ‘Refined carbohydrate’ pattern showed a significant decrease in obesity prevalence for participants in the highest tertile (T3) of the GRS T3 group in model 1 (P for trend = 0·0092). This association persisted in model 2 (P for trend = 0·0251). For the ‘Wheat flour, bread and noodles’ pattern, participants in the highest tertile (T3) of the GRS T2 group exhibited a decreased OR in model 2 (P for trend = 0·0226).
Odds ratios of obesity according to the dietary pattern score tertiles stratified by the GRS among Korean adults from the Ansan and Ansung cohorts
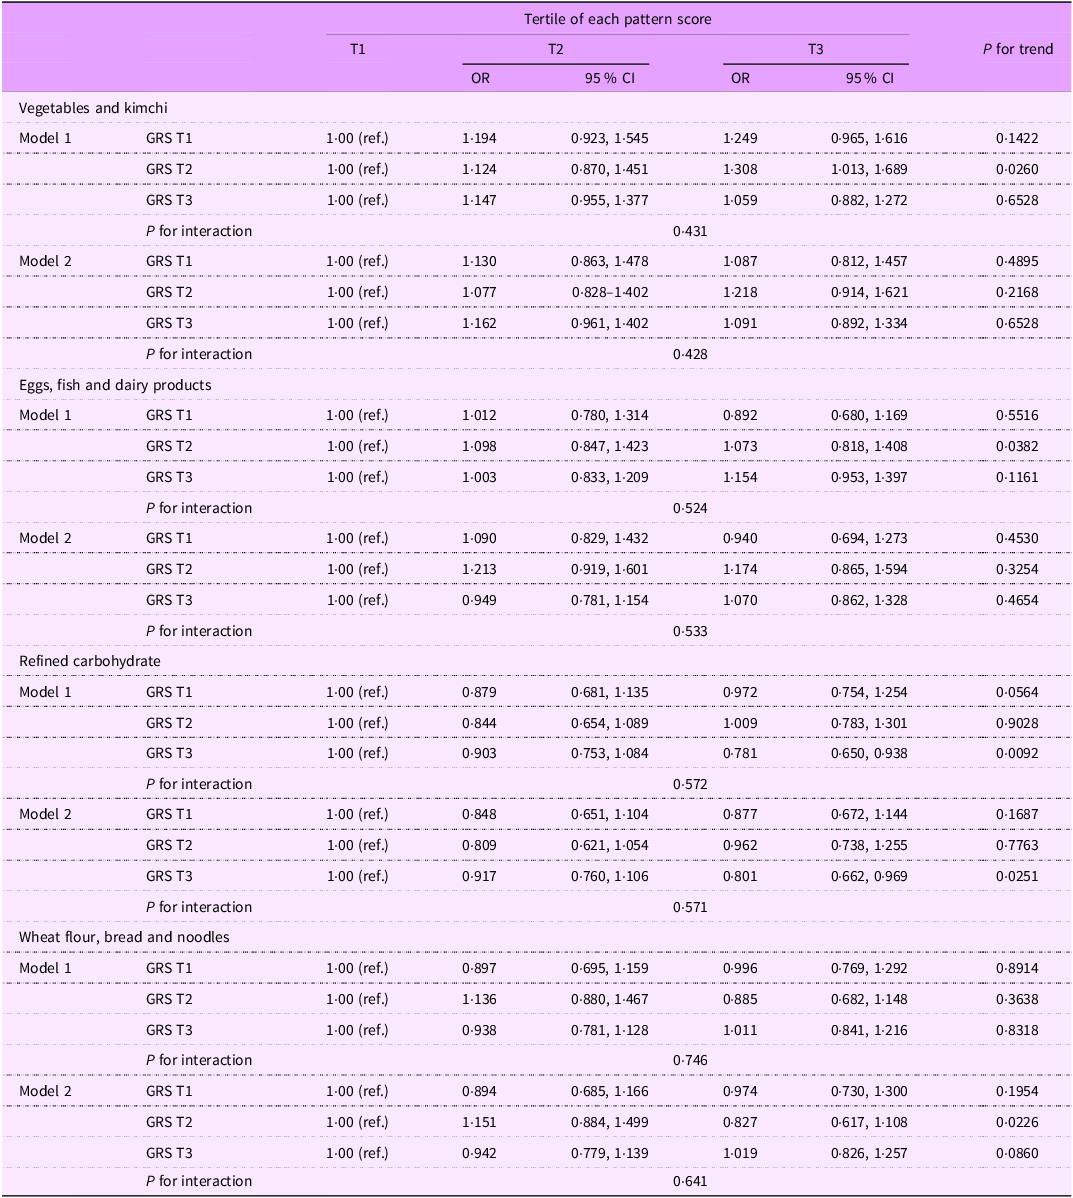
GRS, genetic risk score.
Model 1 was adjusted for sex (male and female) and age (continuous). Model 2 was adjusted for sex (male and female), age (continuous), BMI (continuous), energy intake (continuous), household income level (< 1 million, 1–3 million and > 3 million Korean won), drinking status (current, former or never), smoking status (current, former or never), daily physical activity duration (none, < 30 min, 30–60 min, 60–90 min, 90 min to 2 h, 2–3 h, 3–4 h, 4–5 h or > 5 h) and physical activity (low, moderate or high activity).
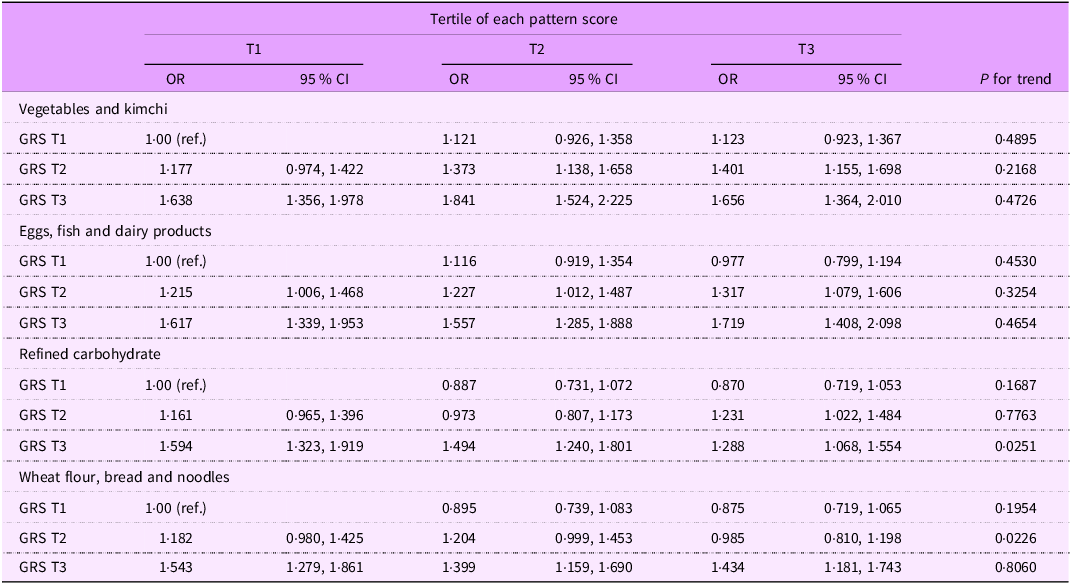
The joint effects of dietary patterns and GRS based on BMI were analysed, with low dietary pattern scores and low GRS serving as reference points. The results demonstrated varying associations between dietary patterns and obesity risk across GRS tertiles (Table 4). For the ‘Vegetables and kimchi’ dietary pattern, the lowest prevalence was observed in those with the lowest pattern scores and GRS T1 (reference group), whereas the highest prevalence of obesity was observed in individuals with GRS T3 and intermediate pattern score (OR: 1·841, 95 % CI: 1·524, 2·225, P for trend = 0·4726). In the ‘Eggs, fish and dairy products’ pattern, the lowest prevalence was observed in GRS T1 with T3 pattern scores (OR: 0·977, 95 % CI: 0·799, 1·194, P for trend = 0·4530), and the highest prevalence was noted in the GRS T3 with T3 pattern scores (OR: 1·719, 95 % CI: 1·408, 2·098, P for trend = 0·4654). In the ‘Refined carbohydrate’ dietary pattern, the lowest prevalence was observed in those with the highest pattern scores and GRS T1 group (OR: 0·870, 95 % CI: 0·719, 1·053, P for trend = 0·1687), whereas the highest prevalence was observed in the lowest pattern scores with GRS T3 (OR: 1·594, 95 % CI: 1·323, 1·919, P for trend = 0·0251). For the ‘Wheat flour, bread and noodles’ dietary pattern, individuals with GRS T1 and the highest dietary pattern scores had the lowest odds of obesity (OR: 0·875, 95 % CI: 0·719, 1·065, P for trend = 0·1954), whereas GRS T3 and high dietary pattern scores showed the highest odds of obesity (OR: 1·543, 95 % CI: 1·279, 1·861, P for trend = 0·8060).
Odds ratios of obesity according to the joint categories of each dietary pattern score and the GRS among Korean adults from the Ansan and Ansung cohorts
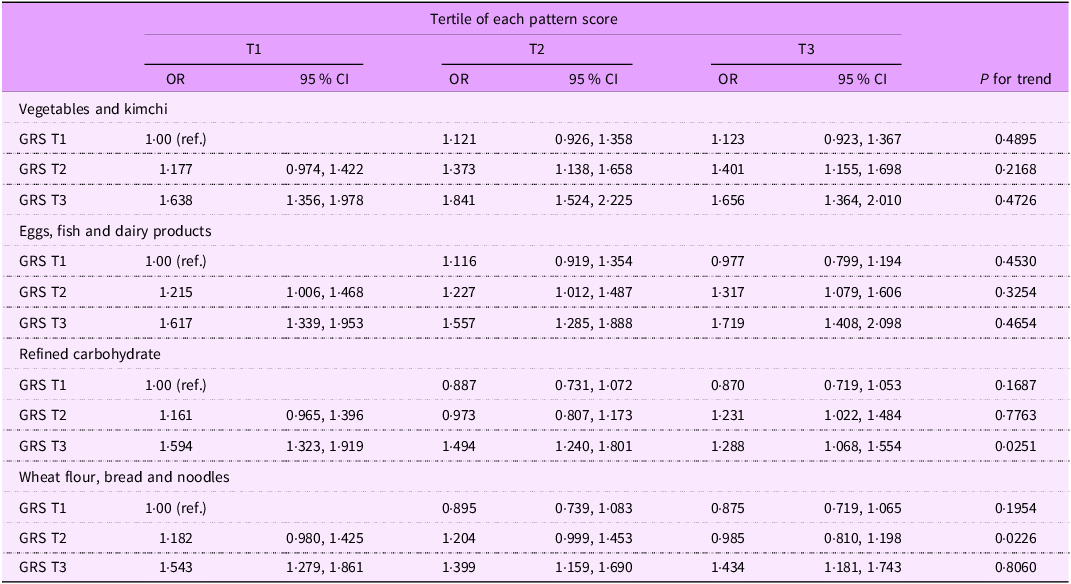
GRS, genetic risk score.
Adjusted for sex, age, BMI, energy intake, household income level, drinking status, smoking status and physical activity.
Discussion
Herein, we demonstrated that the refined carbohydrate dietary pattern in a Korean population was significantly associated with a high GRS for obesity using a large-population-based cohort and six SNP derived from a GWAS for BMI. The refined carbohydrate dietary pattern showed a significant inverse association for obesity in the highest GRS group, with no significant interactive association. Conversely, participants with the highest refined carbohydrate dietary pattern score and the highest GRS had an increased prevalence of obesity compared with the prevalence of those with the lowest dietary pattern score and GRS. Accordingly, reducing refined carbohydrate consumption may benefit individuals with greater genetic susceptibility to obesity.
Most genes with obesity-related SNP identified in the current study, including OTOL1, NMBR, DNAJB9, ASCC1, NT5C2 and FTO, have been previously associated with obesity. FTO is a well-known gene associated with obesity in several populations(Reference Frayling, Timpson and Weedon28,Reference Scuteri, Sanna and Chen29) . The association of OTOL1 and BMI, confirmed in the Korean and Japanese populations, was also replicated in Filipino women(Reference Cho, Go and Kim22,Reference Croteau-Chonka, Marvelle and Lange30) . ASCC1 SNP were strongly associated with obesity and osteoporosis in postmenopausal Korean women(Reference Cho, Jin and Eom31). In the Framingham Heart Study, NTC52 was recently identified to be associated with elevated BMI(Reference Xu, Gupta and Dinsmore32). NT5C2 was also observed to be associated with reduced visceral and subcutaneous fat in Japanese females(Reference Hotta, Kitamoto and Kitamoto33).
Although the mechanisms of the genetic variants identified in this study for the development of obesity are not clear, the genes associated with the link between obesity and BMI are expressed in the hypothalamus, hippocampus and limbic system and regulate energy expenditure, satiety and appetite(Reference Willer, Speliotes and Loos34–Reference Gerken, Girard and Tung36). The gene pool varies according to ethnicity, and Asians have a higher metabolic risk than Europeans with a similar BMI(Reference Agarwal, Lyngdoh and Khadgawat37). Therefore, identifying novel genetic variants and genome-wide scanning from various ethnicities are required. In this context, NMBR and DNAJB9 are promising new genetic factors that should be further explored to determine their effects on obesity among Asian populations.
A refined carbohydrate diet has primarily been associated with a high risk of obesity-related diseases. For example, an increased prevalence of high liver fat was observed with the intake of starch from refined grains, which decreased with fibre and starch intake from whole grains in a study of 22 973 adults in the UK(Reference Orliacq, Perez-Cornago and Parry38). In three large prospective cohort studies in the USA, a 100 g/d increase in carbohydrate intake from refined grains was associated with 0·8 kg more long-term weight gain, whereas that from whole grain, fruit and non-starchy vegetables was negatively associated with 0·4–3 kg less long-term weight gain(Reference Wan, Tobias and Dennis39). In addition, a Japanese cohort study reported that higher consumption of white rice – a major source of refined carbohydrates in Asian diets – was associated with more than 3 kg of body weight gain in 1 year, whereas consumption of brown/multi-grain rice showed no significant association(Reference Sawada, Takemi and Murayama40). These findings are consistent with our results showing that participants who were in the highest tertiles for both the refined carbohydrate dietary pattern and GRS had higher odds of obesity compared with those who were in the lowest tertiles for both variables. Thus, our results suggest that individuals with a high genetic predisposition to obesity and a high refined carbohydrate dietary pattern are susceptible to obesity.
The mechanism of the interaction between the obesity-related genetic variants identified in this study and carbohydrate intake remains unclear. Nevertheless, the mechanism underlying another genetic variant related to a carbohydrate digestive enzyme has been identified. Salivary α-amylase hydrolyses starch in the bloodstream; the difference in activity of this enzyme is partly determined by copy number variants of the salivary α-amylase gene (AMY1). In a study involving 32 054 adults from four prospective cohort studies in the USA and UK, conducted among females with higher GRS calculated using nine AMY1 SNP, higher AMY1-GRS signifying higher salivary amylase activity was related to notable central adiposity gain upon high-carbohydrate consumption(Reference Heianza, Zhou and Yuhang41).
However, the refined carbohydrate dietary pattern was negatively associated with obesity among individuals in the highest GRS group in our study. Although the refined carbohydrate dietary pattern showed an inverse association with obesity within the high GRS group, the joint analysis demonstrated that individuals with both a high GRS and a high refined carbohydrate dietary pattern score had the highest obesity risk. These findings are not contradictory, as the stratified analysis reflects the within-stratum association of dietary pattern among individuals with similar genetic risk, whereas the joint analysis evaluates the combined effect of two high-risk conditions occurring simultaneously. Thus, the joint model captures a different dimension – cumulative risk – while the stratified model highlights potential effect modification by genetic susceptibility.
Nonetheless, this inverse association is in line with several previous studies conducted in Asian populations, which have reported an inverse relationship between the refined carbohydrate dietary pattern – where white rice had the highest factor loading – and overweight or obesity(Reference Zhang, Wang and Du42). A possible explanation for this association is that the rice-based dietary pattern is typically characterised by a traditional diet accompanied by higher vegetable intake, lower consumption of processed foods and healthier lifestyle behaviours(Reference Xu, Byles and Shi43). These characteristics could influence obesity risk independently of the dietary pattern score, thus may contribute to residual confounding, which could partly explain this inverse association. Moreover, potential measurement error inherent in FFQ-based dietary assessment could have attenuated or distorted the observed associations. These factors should be considered when interpreting the unexpected inverse association found in the high GRS group. Another potential mechanism may involve rice-derived proteins, which have been suggested to stimulate lipolysis and suppress lipogenesis, thereby reducing body weight gain and adiposity(Reference Yang, Chen and Lv44).
Although data regarding the associations between the genetic variants identified in this study, dietary patterns and obesity, along with related mechanisms, remain limited, several studies have reported the interaction of these factors. FTO reportedly exerts the greatest effect on BMI(Reference Loos and Yeo45) and was found to be associated with obesity and high-carbohydrate intake(Reference Saber-Ayad, Manzoor and Radwan46). In a meta-analysis of fifty-six studies with 213 173 adults, the FTO risk allele was associated with low total energy intake and high fat and protein intake(Reference Livingstone, Celis-Morales and Lara47). Nevertheless, no significant interaction has been reported(Reference Livingstone, Brayner and Celis-Morales48).
Future studies should explore the biological mechanisms underlying the interaction between refined carbohydrate intake and obesity-related genetic variants. In particular, identifying metabolic pathways through which high-carbohydrate dietary patterns may differentially influence individuals with distinct genetic predispositions will help clarify causality. Further research is also needed to evaluate these associations using repeated dietary assessments and broader genomic profiling to account for additional variants involved in carbohydrate metabolism. Such work will contribute to establishing clinically meaningful gene–diet interactions and inform precision nutrition strategies.
In addition to the refined carbohydrate dietary pattern, other dietary patterns and genetic variants are associated with obesity. The dietary patterns of vegetables and kimchi, eggs, fish, dairy products, wheat flour, bread and noodles were associated with obesity only in the intermediate GRS level in this study. Nonetheless, a plant-based diet, such as a high intake of vegetables and fruit, can attenuate body weight increase and cardiovascular risk factors among individuals with high GRS-associated BMI(Reference Wang, Heianza and Sun7,Reference Heianza, Zhou and Sun8) . High adherence to healthy diets, including the Healthy Eating Index, Mediterranean Diet and Dietary Approach to Stop Hypertension, can mitigate genetic predisposition to obesity(Reference Sokary, Almaghrbi and Bawadi49). Conversely, positive interactions of dietary pattern with the n-6:n-3 ratio, the GRS and metabolic parameters were observed among individuals with obesity(Reference Rasaei, Fatemi and Gholami10,Reference Rasaei, Daneshzad and Khadem11) . Moreover, a dietary pattern of highly salty snacks and fast-food intake, extracted from the Iranian population with A and T alleles of APOA1 SNP, was positively associated with the risk of metabolic syndrome(Reference Hosseini-Esfahani, Mirmiran and Daneshpour50).
This study has several limitations. First, we could not examine the association of various obesity outcomes with genetic factors and dietary patterns, given that the phenotype of genetic variants was limited to only BMI. Second, although the KoGES cohort is longitudinal, our analysis relied on dietary patterns derived solely from baseline FFQ data and therefore reflects cross-sectional associations. As a result, causal inference cannot be made, and the possibility of reverse causation or residual confounding remains. Our primary objective was to examine these cross-sectional relationships, as repeated dietary assessments were not available for the present analysis. Thus, the findings should be interpreted as associative rather than causal. Third, the usual food intake was possibly underestimated, as it was assessed using a semi-quantitative FFQ. Moreover, determining dietary patterns, including the number of dietary pattern groups and food item classification and the rotation method, could be subjective.
Despite these limitations, this study has several strengths. First, it utilised a large, community-based Korean cohort with well-characterised phenotypic and genotypic data, allowing the examination of BMI-related genetic variants that have been repeatedly validated in Asian populations. Second, by investigating the interaction between the refined carbohydrate dietary pattern and the GRS, our findings provide additional evidence supporting the relevance of diet–gene interactions in obesity risk. These results underscore the potential implications for developing personalised nutrition strategies tailored to genetic susceptibility within the Korean population.
Conclusions
Collectively, our results indicate that the refined carbohydrate dietary pattern of the Korean population was substantially associated with a high GRS for obesity derived from SNP of OTOL1, NMBR, DNAJB9, ASCC1, NT5C2 and FTO, using a large-population-based cohort. Accordingly, reducing refined carbohydrate consumption may benefit individuals with greater genetic susceptibility to obesity.
Supplementary material
For supplementary material accompanying this paper, visit https://doi.org/10.1017/S136898002610202X
Data availability
Eligible researchers may access the datasets used and analysed for this study at https://www.nih.go.kr/ko/main/contents.do?menuNo=300563 (Korean) after receiving permission from the Korea Disease Control and Prevention Agency. Further details in English are available at https://www.nih.go.kr/eng/main/main.do.
Acknowledgements
The data used in this study were obtained from the KoGES (6635-302) of the Korea Disease Control and Prevention Agency, Republic of Korea.
Financial support
This research was supported by the Basic Science Research Program through the National Research Foundation of Korea, funded by the Ministry of Education (RS-2018-NR031061).
Competing interests
All authors declare that they have no conflicts of interest.
Authorship
M.J.J. conducted the data analysis. M.J.J. and S.C. were responsible for writing the first draft of the manuscript. S.C., K.L., S.S. and J.M.K. reviewed and critically revised the manuscript. S.S. and J.M.K. supervised all study procedures. The final manuscript was read and approved by all the authors.
Ethics of human subject participation
The study was conducted in accordance with the KoGES guidelines (4851-302) and the Declaration of Helsinki and its later amendments. Approval was granted by the Institutional Review Board of Chung-Ang University (IRB number: 1041078-20230712-HR-190) and the National Research Institute of Health under the Centers for Disease Control and Prevention, Ministry of Health and Welfare, Republic of Korea. The participants provided their written informed consent to participate.


 Open access

