

Caffeine or 1,3,7-trimethylxanthine exhibits a wide range of physiological effects(Reference Durrant1), in particular, it is a stimulator of the central nervous system. It is rapidly absorbed from the gastrointestinal tract and crosses the placenta. Caffeine originates in the cocoa bean, tea leaf, mate leaf, kola nut, cocoa pod and guarana seeds, and is naturally found in coffee, tea, cola, cocoa, dietary supplements and herbal products. Smaller amounts are present in products derived from cocoa and chocolate- or coffee-flavoured desserts and it is also added to soft drinks, ‘energy’ drinks, and prescription and non-prescription drugs.
A particular interest with respect to caffeine is the possible effect on development in utero. An early study in mice showed increased congenital malformations in the offspring of mice when treated with caffeine(Reference Nishimura and Nakai2). More recent epidemiological studies have led to the conclusion that caffeine intakes during pregnancy >300 mg/d carry an increased risk of both spontaneous miscarriage and low birth weight(3). However, the epidemiological studies have been contradictory, in part due to different approaches to measuring caffeine intake. A number of studies have found a relationship between relatively high caffeine consumption and low birth weight(Reference Beaulac-Baillargeon and Desrosiers4–Reference Vlajinac, Petrovic, Marinkovic, Sipetic and Adanja6), whereas others suggest that caffeine does not have an adverse effect on birth weight(Reference Barr and Streissguth7–Reference Clausson, Granath, Ekbom, Lundgren, Nordmark, Signorello and Cnattingius10).
Differences between studies may have occurred for a number of reasons. Some did not consider changes in intake during pregnancy. Timing of caffeine assessment is important since many pregnant women reduce, or discontinue, caffeine intake during pregnancy, either consciously, or due to nausea or a heightened sense of smell. Other studies only measured caffeine intakes after pregnancy(Reference Vlajinac, Petrovic, Marinkovic, Sipetic and Adanja6, Reference Santos, Victora, Huttly and Carvalhal9). In addition, many investigations often used a limited approach to assess caffeine intake. Studies have used coffee consumption as a proxy for caffeine intake, or simply counting the number of drinks and averaging caffeine content according to beverage(Reference Linn, Schoenbaum, Monson, Rosner, Stubblefield and Ryan11–Reference McDonald, Armstrong and Sloan13). To date, no study of caffeine and pregnancy has made a comprehensive analysis of all food, drinks and drugs containing caffeine, nor has any study considered in detail the variation in caffeine content of individual portion sizes and brands of these foods and drinks. Misclassification of caffeine consumption makes it more difficult to identify health effects from caffeine and reduces comparability among studies.
Even if the caffeine content of different items of food and drink can be accurately identified, there remains the problem of accurate recall of intake. Biomarkers, such as caffeine and its metabolites in body fluids, may offer an adjunct to questionnaire-based assessments of intake. However, there are substantial inter-individual variations in caffeine metabolism which would be expected to influence the correlation between measured caffeine intake and plasma concentrations. In addition, during pregnancy the half-life of caffeine is increased. Despite this caveat, plasma concentrations of the caffeine metabolite paraxanthine and, to a lesser extent, caffeine itself did distinguish between different levels of caffeine intake in women during pregnancy(Reference Klebanoff, Levine, DerSimonian, Clemens and Wilkins14). Paraxanthine has both a longer half-life in blood than caffeine and concentrations vary throughout the day. Plasma paraxanthine is less sensitive to recent intake of caffeine and may therefore be a better marker of caffeine consumption than plasma caffeine. A less invasive approach, important during pregnancy or for studying children, may be to measure caffeine in saliva. Saliva drug concentrations are frequently related to unbound drug concentrations in plasma(Reference Danhof and Breimer15, Reference Horning, Brown, Nowlin, Lertratanangkoon, Kellaway and Zion16) and caffeine intake has been correlated to both saliva caffeine and paraxanthine(Reference James, Bruce, Lader and Scott17).
The present study will inform a larger one investigating the role of caffeine in pregnancy outcome, in particular, low birth weight. The main study uses the caffeine assessment tool (CAT) at three time points to explore caffeine intake throughout pregnancy. The aim of the project reported here was to explore three different methods of assessing caffeine exposure in pregnant women during the first trimester only, using a CAT, a 3 d food and drink diary, and salivary concentrations of caffeine and paraxanthine.
Materials and methods
Subjects and samples
All pregnant women aged 18 years old or over, attending the antenatal clinic at Leeds General Infirmary (Leeds, UK) were eligible. Pregnant women younger than 18 years of age or who were receiving their maternity care elsewhere were not eligible to take part. Maternity records of women attending the clinic were checked for suitable women. Women were approached by the research assistant, informed about the study, and given an information sheet. Women who agreed to take part were given a background questionnaire, CAT, 3 d food and drink diary, and nine Salivettes® (Sarstedt Aktiengesellschaft and Co., Nümbrecht, Germany) to take home, complete and return. The study protocol was approved by the local research ethics committee and written informed consent was obtained from all subjects.
Using the CAT, the present study assessed caffeine intakes from weeks 5 to 12 of pregnancy only since this was the most appropriate time frame relative to the stage of pregnancy when most women attend the antenatal clinic for the first time, when women are called to the clinic at about 16 weeks of pregnancy. The food and drink diary was completed at the same time as the CAT although the time frames did not overlap. The diary asked about 3 d of intake at the time of completion whereas the CAT requested recall of intake during weeks 5–12 of pregnancy. While completing the food and drink diary, the women collected a total of nine saliva samples over two consecutive days. Women noted both the time of consumption of foods and drinks and of the saliva collection in the diary to ensure that the saliva measurements provided biomarkers of actual consumption for comparison with the recorded dose (food and drink diary). The saliva samples were also used to assess variation in salivary caffeine and paraxanthine concentrations at different times during the day, and between days. Each saliva sample was collected in a Salivette® (Sarstedt Aktiengesellschaft and Co.). The Salivette® consists of an outer centrifuge vessel containing a suspended insert and cotton wool swab. Women were required to keep the Salivette® swab in their mouth for 10 min to ensure adequate saliva collection. A sample interval of 90 min was chosen between collections to cause minimal disruption to normal daily activity. On the first day, each woman provided saliva samples every 90 min over a 9 h period, involving a total of seven saliva samples. To avoid the presence of caffeine in the saliva due to recent consumption (rather than following absorption), the women were asked to avoid caffeine-containing foods and drinks, listed on a sheet provided, for 1 h before collecting the first sample, and for 15 min before taking each of the following six samples. The women were also asked to rinse their mouth with tap water before collection. On the second day, the same women were asked to provide a further two saliva samples at approximately mid-morning and mid-afternoon to reflect likely time of sample collection in the larger study. Again the women were asked to avoid caffeine-containing foods and drinks for 1 h before sample collection and to rinse their mouth with tap water before the samples were taken. The women were told to refrigerate the samples until they were returned by post to the research team along with the background questionnaire, CAT and diary.
Analysis of caffeine intakes
The CAT was developed to assess caffeine intakes from all possible sources of caffeine in a FFQ style, taking into account specific brand, preparation and portion size information. Since the CAT was developed to assess caffeine intake during pregnancy, questions on consumption of caffeine-containing foods and beverages were repeated to assess intakes during different weeks of pregnancy. Brand information was collected on coffee, tea, hot chocolate, cola and energy drinks, and was categorised into types of drink, for example, instant, filter, iced, and place of consumption to remind women of beverage consumption outside the home or workplace. Further questions requested portion sizes of tea, coffee and cola, changes in intake of tea and coffee during pregnancy, methods of preparation, and intakes of foods which may affect caffeine metabolism, for example, cruciferous vegetables, grapefruit and barbecued foods(Reference Murray, Lake, Gray, Edwards, Springall, Bowey, Williamson, Boobis and Gooderham18–Reference Fontana, Lown, Paine, Fortlage, Santella, Felton, Knize, Greenberg and Watkins20). The caffeine content of foods and beverages were obtained from a UK government report by the Ministry of Agriculture, Fisheries and Food(21) and also from manufacturers and coffee-houses, providing caffeine values for twenty-nine instant coffees, nine filter coffees, three coffee-house filter coffees, a standard espresso shot and decaffeinated shot, eight instant beverage mixtures, seven espresso-based drinks, eighteen hot chocolates, twenty-five teas prepared from tea bags, seventeen teas prepared from tea leaves, one iced-tea, three instant teas, thirty-six colas, thirty-three energy drinks, eleven soft drinks and two alcoholic drinks. Each of the above beverages had a standard caffeinated and decaffeinated value assigned based on the average caffeinated and decaffeinated content of each drink. For each of the chocolate items a value was assigned based on the average caffeine content from various brands. The caffeine content of fifty-nine over-the-counter drugs was accessed from manufacturers' websites. The CAT also assesses possible confounders, for example, smoking habits, alcohol intake, use of medication and symptoms of pregnancy. The CAT is thus the most detailed and comprehensive tool to assess caffeine intake during pregnancy which is currently available. A detailed computer algorithm was developed which assigned a value for caffeine content (mg) to all caffeinated products assessed in the CAT while taking into account portion sizes, brand information and frequency of intakes. Daily caffeine intake during weeks 5–12 of pregnancy could be calculated for each participant.
The food and drink diaries were analysed manually for each woman's daily caffeine intake. All caffeine-containing foods and drinks recorded in the diaries were allocated a caffeine value depending on amount and type of food or drink consumed. A mean caffeine value was calculated for each food and beverage source and assigned to any unbranded sources recorded in the diaries.
Analysis of saliva
Caffeine and metabolites were extracted and quantified using liquid:liquid extraction and reversed-phase HPLC with UV detection using a modification of the method of Butler et al. (Reference Butler, Lang, Young, Caporaso, Vineis, Hayes, Teitel, Massengill, Lawsen and Kadlubar22). Salivettes® were thawed and saliva reclaimed by centrifugation at 756 g for 5 min at room temperature. Saliva (180 μl) was added to a 5 ml screw-cap tube containing 50 mg ammonium sulfate following which 20 μl of a stock solution of β-hydroxyethyltheophylline (20 ug/ml) was added as internal standard. The tube was shaken vigorously for 10 s using a Baxter multi tube vortex (Alpha Laboratories, Eastleigh, Hants, UK) on setting 4, to thoroughly mix the contents and precipitate any protein. This was followed by the addition of chloroform (2·0 ml) and isopropanol (0·5 ml) and the tube shaken again for 4 min on setting 4. After centrifuging for 5 min (84 g) the aqueous top layer was discarded and the organic layer transferred to a thick-walled glass tube and dried down under N2 at 45°C. The residue was reconstituted in 30 % methanol in water (200 μl), mixed vigorously for 3 s and centrifuged for 2 min (756 g) to give a final concentration of β-hydroxyethyltheophylline of 2 μg/ml. The reconstituted solution was transferred to an autosampler vial and 30 μl injected onto a Beckman Ultrasphere column (ODS; 4·6 mm × 25 cm) with a short guard column (5 cm × 0·4 cm) packed in-house with Bondapak C18/corasil (Waters, Elstree, Herts, UK). The solvent delivery system, autosampler and UV detector were manufactured by Gilson (Paris, France). UV wavelength was set at 280 nm. Solvents used for elution were 0·045 % acetic acid containing 9 % methanol (A) and 100 % methanol (B). Starting with solvent A, elution was a linear gradient over 5 min to a 2 % solution of solvent B, held at this for 10 min, over the next 5 min increased in a linear gradient to 5 % solvent B, followed by a linear increase over 5 min to 8 % B, changed to 15 % B and maintained for 15 min, raised to 75 % B and held at this for 10 min, followed by reversion to 100 % A (the starting solvent) which was maintained for 10 min to equilibrate the column before injection of the next sample. The flow rate was 1·2 ml/min and the retention time, in min, for each compound was approximately: theobromine, 10·3; 1,7-dimethyluric acid, 14·8; paraxanthine, 16·2; theophylline, 17·7; β-hydroxyethyltheophylline, 22·4; caffeine (1,3,7-trimethylxanthine), 29·5. Retention times varied slightly from day to day and were adjusted accordingly to produce optimum identification of each analyte when processing results. A single standard containing all the above compounds at the same concentration (5 μg/ml) was made up in 30 % methanol; this was run after every five samples. Two ‘in-house’ quality-control samples were also extracted and run with each batch of eighteen samples. Quality-control samples were made by spiking ‘blanked saliva’ with 5 μg/ml of each compound. The saliva, donated by volunteers, was collected in Salivettes® and ‘blanked’ by gentle mixing with charcoal (0·1 g/ml) for 24 h, centrifuged (728 g) for 10 min and the supernatant fraction filtered through a 0·20 μm filter and stored at − 20°C until spiked. When in use, quality-control material was stored at 4°C. Within-batch CV (%) were: theobromine, 2·3; 1,7-dimethyluric acid, 2·4; paraxanthine, 2·2; theophylline, 2·5; β-hydroxyethyltheophylline, 3·1; 1,3,7-trimethylxanthine, 2·7. Between-batch CV (%) were: theobromine, 2·8; 1,7-dimethyluric acid, 2·5; paraxanthine, 2·2; theophylline, 3·0; β-hydroxyethyltheophylline, 2·4; 1,3,7-trimethylxanthine, 3·8. The limit of quantification was 50 ng/ml for all compounds, calculated from standards made up in 30 % methanol with no extraction. The assay was linear between 50–10 000 ng/ml for all the above compounds.
Caffeine, other methylxanthine metabolites and ammonium sulfate were purchased from Sigma (Poole, Dorset, UK) and all extraction and eluant reagents were supplied by Rathburn Chemicals (Walkerburn, Peebleshire, UK).
Statistical analysis
Statistical analysis was carried out using SPSS (version 10.1; SPSS Inc., Chicago, IL, USA), Stata (version 8.2; StataCorp LP, College Station, TX, USA) and MlwiN (University of Bristol, Bristol, UK)(Reference Rasbash, Browne and Goldstein23). Caffeine intakes from the CAT and 3 d diary were compared. κ Statistics were carried out to test the agreement between the caffeine intakes estimated either by the CAT or the diary (split at the median), and the mean of the seven saliva caffeine and paraxanthine measures on day 1, and the mean of the two saliva caffeine and paraxanthine measures on day 2. The total 3 d diary and the individual diary days which related to the day of saliva sample collection were used for this analysis. Time of gestation (weeks) was categorised into two groups (see Table 1 for categorisation), and agreement between the CAT and 3 d diary was estimated within each group as well as for the group as a whole. A variance components model was used to investigate the variance structure of the data and estimate the intra-class correlation coefficient (ICC) of agreement taking all sources of error into account.
Table 1 Caffeine intake (mg/d) and time of caffeine assessment tool (CAT) completion
(Mean values and standard deviations)
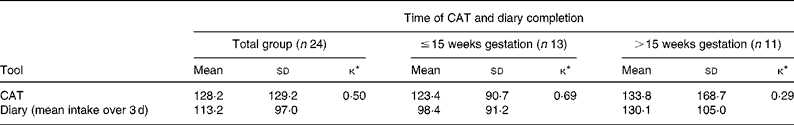
* κ Statistic comparing CAT and diary.
Results
Characteristics of women
A total of sixty-three women were recruited, but only twenty-four completed the study. The mean age of the women was 31·7 (sd 3·4) years, with the mean gestation being 16·3 (sd 6·9) weeks. According to the Office for National Statistics socio-economic classification (SEC) self-coded method(24) of calculating SEC status, the number of women classed as working in managerial and professional occupations, intermediate occupations, and as a small employer with account workers, were sixteen, five and one respectively. Two women did not fully complete the question on SEC status.
Caffeine intakes
The highest mean daily caffeine intakes calculated from the CAT and diary were among women who were of later gestation (Table 1). On average, the daily caffeine intake from the CAT at 128 (sd 129) mg/d was 15 mg more than the diary at 113 (sd 97) mg/d. This difference is small, being approximately one-fifth of a cup of instant coffee. The caffeine intakes from the CAT and the diary among the total sample (n 24) showed adequate agreement (ICC = 0·5). Ten of the women did not provide complete brand information on sources of caffeine intake in the diary despite doing so in the CAT. For these women, the mean daily caffeine intake from the CAT was 156 (sd 77) mg/d which was 27 mg/d more than the diary at 129 (sd 80) mg/d. However, for the women who did provide complete brand information in the diary, the mean daily caffeine intake from the CAT was 108 (sd 156) mg/d; this was only 6 mg/d more than caffeine intake assessed from the diary at 102 (sd 109) mg/d. It is also evident that these women had lower caffeine intakes from both the CAT and diary than those who did not provide complete brand information in the diaries. Figure 1 illustrates the agreement between mean caffeine intake (mg/d) from the CAT and diary. The level of agreement between the two methods was greater for women who were ≤ 15 weeks gestation (ICC = 0·69) compared with those between 16 and 37 weeks gestation (ICC = 0·29) (Table 1). A greater level of agreement was also apparent when women who left education earliest were considered (ICC = 0·69) compared with those who left education later (ICC = 0·20). Level of agreement between the two methods was similar for both young and old women (ICC = 0·50 and 0·46, respectively).
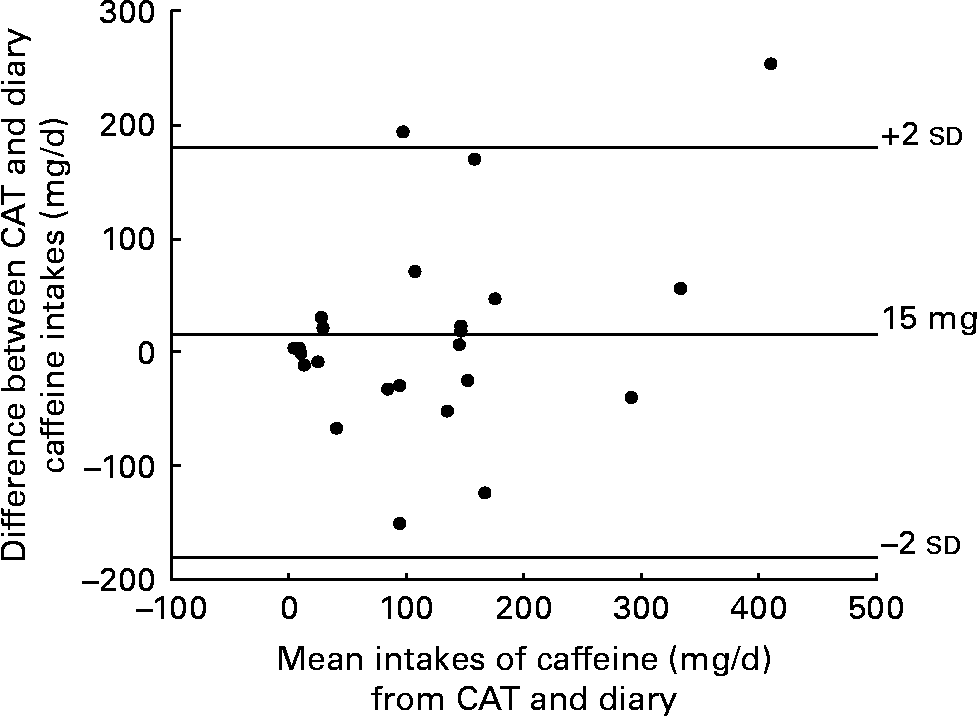
Fig. 1 Bland–Altman scatter plot of difference in caffeine intakes (mg/d) between the caffeine assessment tool (CAT) and food and drink diary.
Variability of saliva measures
All nine saliva samples were available from sixteen women. The mean saliva caffeine and paraxanthine concentrations were 454 (95 % CI 367, 561) and 198 (95 % CI 165, 237) ng/ml respectively. There was good agreement between days 1 and 2 of saliva collection for both saliva caffeine and paraxanthine (ICC = 0·66 and 0·65, respectively). Figure 2 illustrates the saliva sample concentrations and caffeine intake over the first day of saliva collection. It is evident from Fig. 2 that saliva caffeine and paraxanthine concentrations reflected each other closely for most women, for example, Fig. 2(a, b, f, j, k, u); however, this was not the case for a few of the women, for example, Fig. 2(i, p). It is also evident from Fig. 2 that salivary caffeine and paraxanthine concentrations reflected caffeine intake for some of the women, for example, Fig. 2(a, g, h, m). For some women, irrespective of level of caffeine intake, there was a sudden increase in saliva concentrations after caffeine intake, for example, Fig. 2(a, g, v). For others, however, saliva concentrations did not parallel caffeine intake, for example, Fig. 2(b, o), or had a delay in the development of peaks, for example, Fig. 2(h). Caffeine intakes were low for some women; therefore, peaks in saliva caffeine and paraxanthine concentrations were not as marked, for example, Fig. 2(i, r).
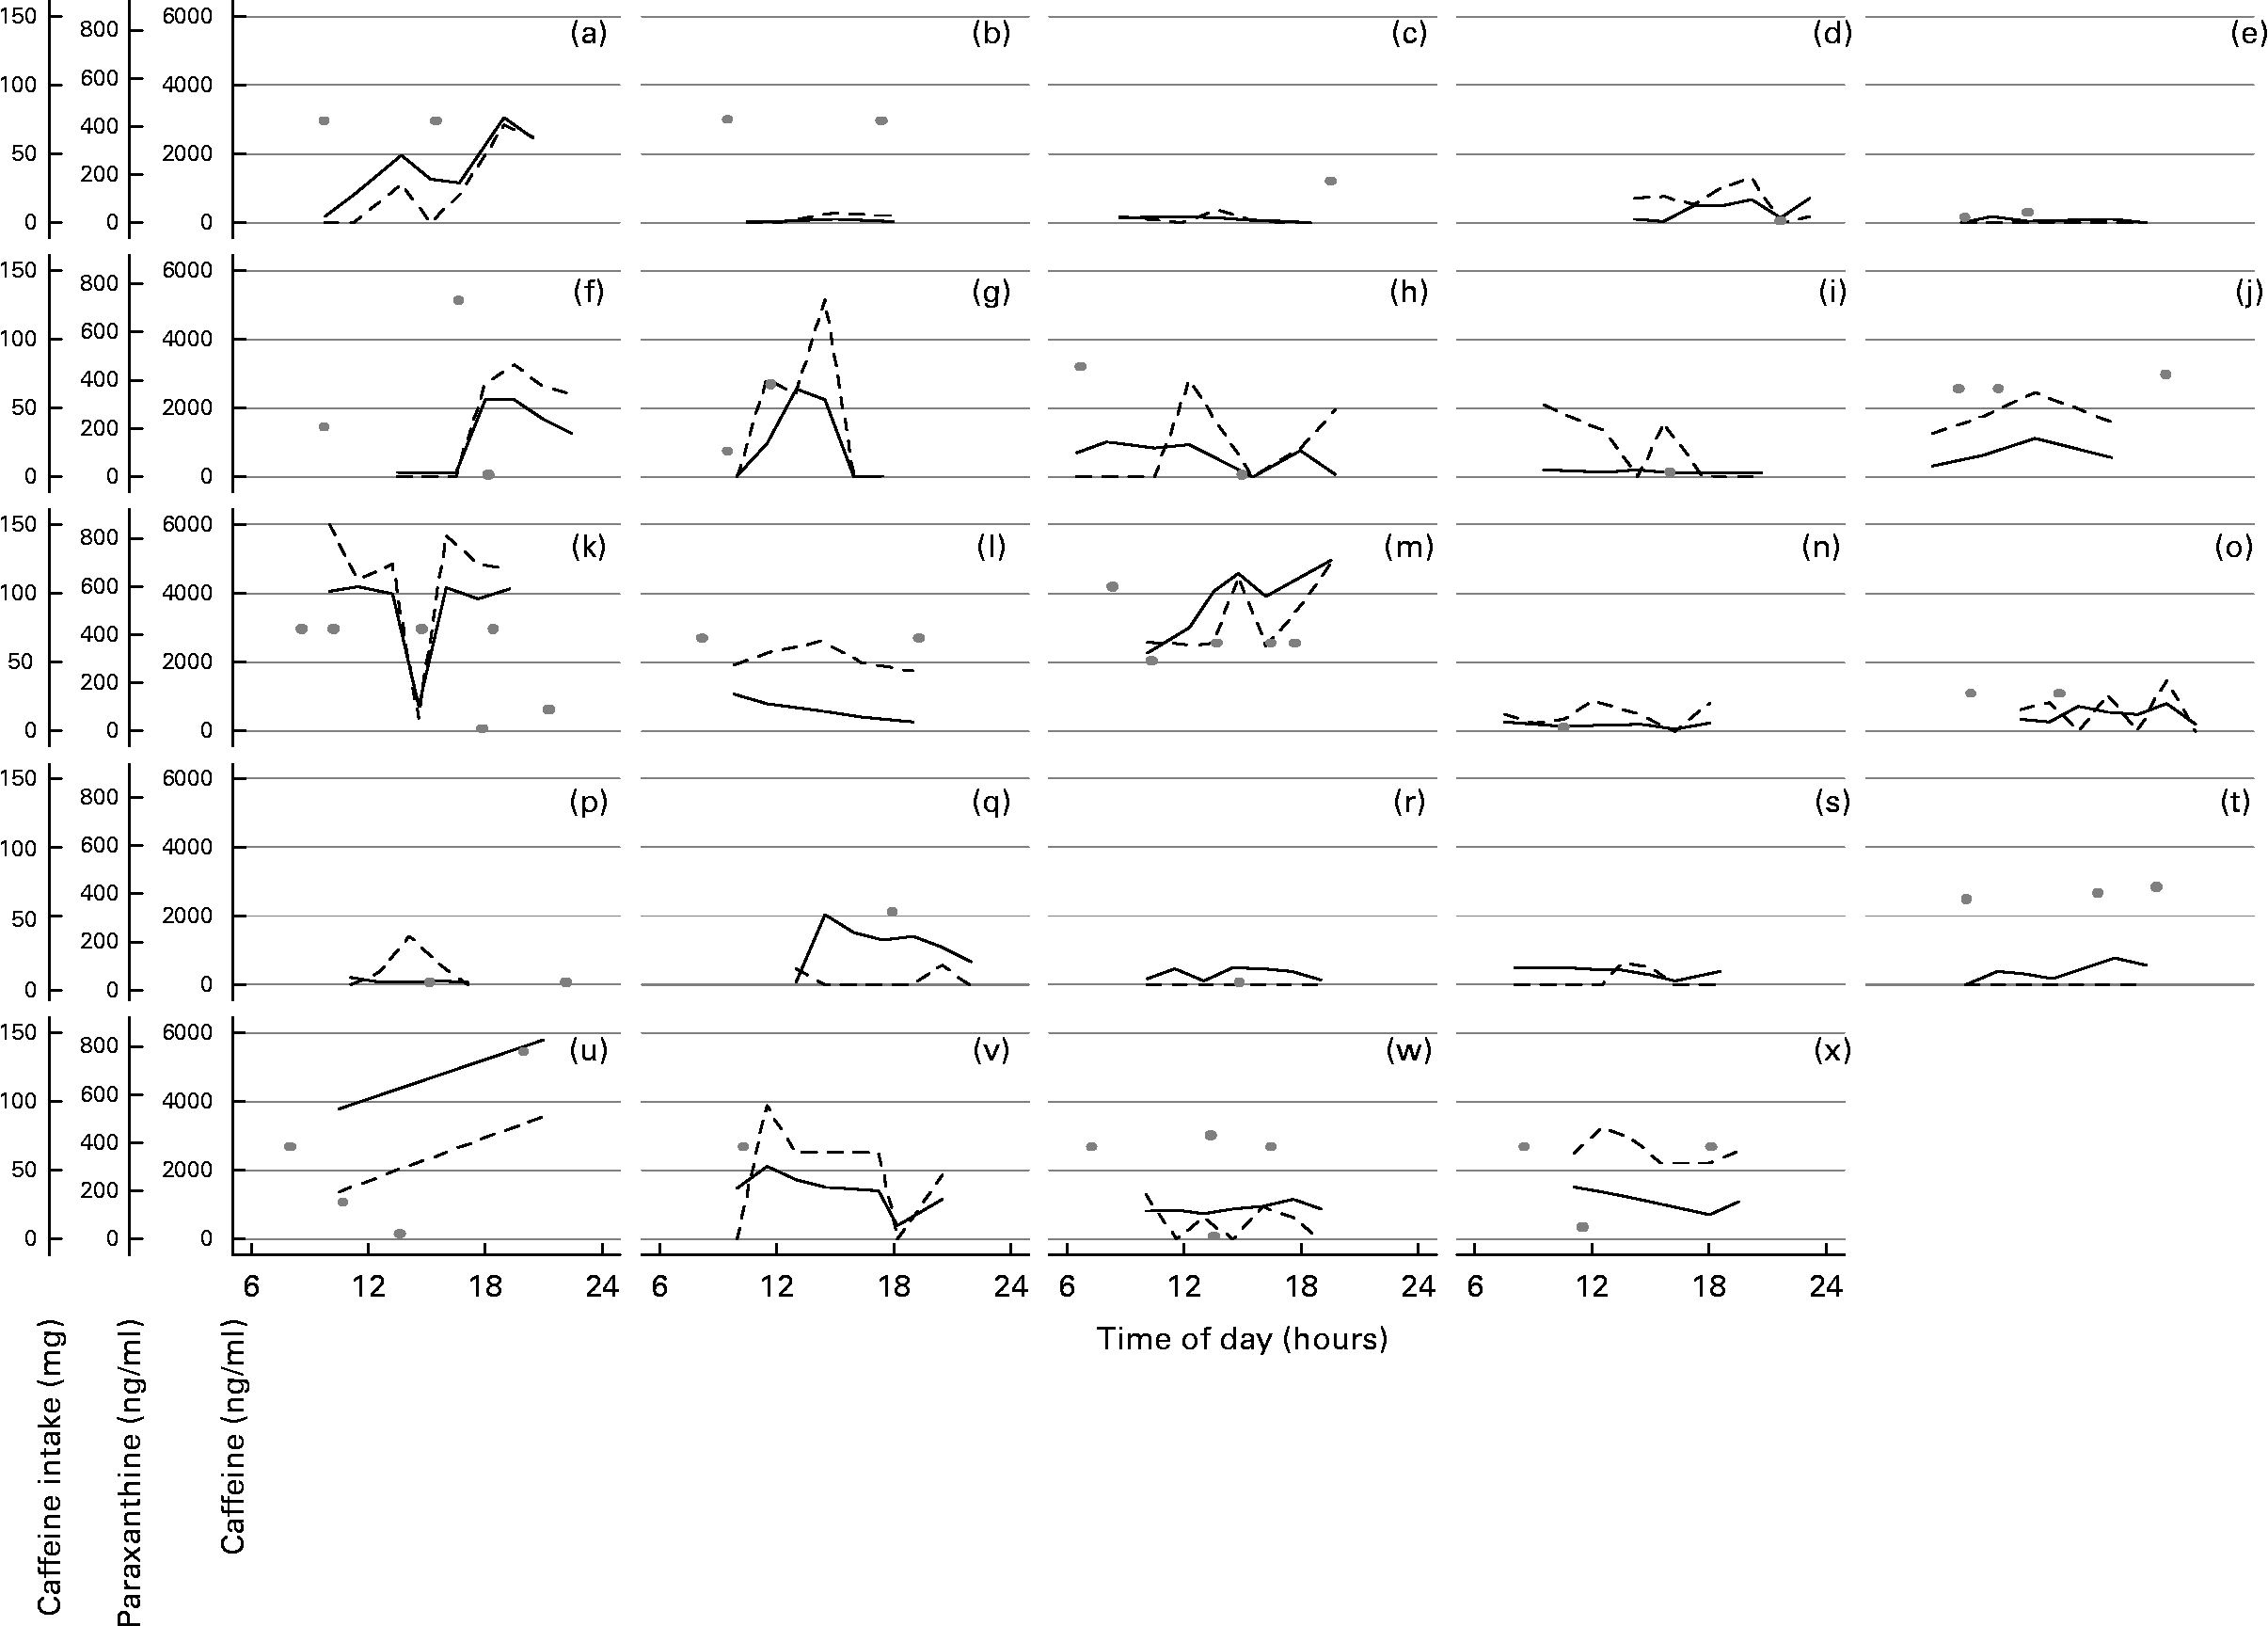
Fig. 2 Saliva measures of caffeine (ng/ml; —) and paraxanthine (ng/ml; - - -) collected on day 1 and caffeine intake (mg; ○) on the same day for each woman (a to x).
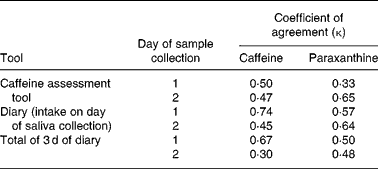
For both saliva caffeine and paraxanthine, the between-sample (i.e. within the same woman) variation was 50 and 61 % of total variation, respectively, for example, Fig. 2(k) which shows considerable variation in saliva caffeine and paraxanthine between samples. Between-women variation for salivary caffeine and paraxanthine was 39 and 38 % of total variation, respectively. Figure 2(b, k) shows how variable these concentrations are between women. Between-day variation for saliva caffeine and paraxanthine was relatively low at 11 and 0·1 % of total variation, respectively. Despite this variation, however, the CAT agreed with the saliva measures just as well as with the food and drink diary. Using the κ statistic, there was a moderate agreement between the CAT and saliva caffeine collected on both days 1 and 2 (0·50 and 0·47, respectively), with an even better agreement between the CAT and saliva paraxanthine collected on day 2 (0·65). Using the mean caffeine intake calculated over 3 d from the diary, a moderate agreement existed between the diary and saliva paraxanthine collected on both day 1 and 2 (0·50 and 0·47, respectively), with a greater agreement between the diary and saliva caffeine collected on day 1 (0·66). As expected, this agreement was even better when saliva concentrations were compared with caffeine intake from the diary on the same day of sample collection (Table 2).
Table 2 Agreement between caffeine intakes and saliva caffeine and paraxanthine measures
Discussion
Caffeine intakes
The mean caffeine intakes from both the CAT and diary were lower than intakes previously reported by pregnant women in the UK (204 mg/d for a 60 kg woman)(Reference Barone and Roberts25). However, since this previous study, a report has been published by the Food Standards Agency (FSA) advising pregnant women to limit caffeine consumption to less than 300 mg/d(3), and this may have decreased pregnant women's caffeine intakes in the UK. It is also possible that some women may have decreased or under-reported their caffeine intake as a result of taking part in the present study.
The CAT is a detailed assessment of caffeine intake which is straightforward to complete. In contrast, ten women did not provide detailed information on caffeine intake particularly relating to brand-level information in the diary even though they were instructed to do so. This may have contributed to the overall difference in estimated caffeine intakes between the CAT and the diary. There was a greater difference between caffeine intakes from the CAT and diaries from women who did not provide complete brand information compared with women who did provide this level of information in the diaries. Another contributor to difference in estimates of caffeine intakes between the two methods could be the different time periods assessed by the two tools. The diary assessed food and drink consumption over the 3 d whereas the CAT assessed recalled intakes over an 8-week period. Despite the difference in estimates, there was still an adequate agreement between the two methods.
The level of agreement between the caffeine intakes from the CAT and diary was greatest among women who were in their earliest gestational weeks. This may be because the CAT that was administered in this test assessed caffeine intake early in pregnancy (weeks 5–12). Women later in pregnancy reported higher caffeine intakes in the CAT (Table 1), although only four women were in the second half of pregnancy (over 20 weeks); nevertheless, recall bias may have been introduced as these women may have been reporting caffeine intakes similar to their current intakes rather than intakes between weeks 5 and 12 of pregnancy. This is plausible, as caffeine intake may be lower in the first trimester due to nausea or intentional avoidance.
Saliva samples
In general, salivary caffeine and paraxanthine concentrations agreed with and reflected each other closely. It is also clear that the saliva concentrations generally responded to the caffeine intake recorded. However, for some of the women, the saliva measures did not appear to increase after reported caffeine intake. This may be due to error in completing the diary, or due to differences in metabolism and clearance between women resulting in lower concentrations at the time samples were collected. Caffeine is metabolised by the cytochrome P450 family of enzymes in the liver, in particular the major enzyme being cytochrome P450 1A2 (CYP1A2)(Reference Butler, Iwasaki, Guengerich and Kadlubar26) with metabolites produced through demethylation and oxidation. Paraxanthine is a primary metabolite produced by demethylation of the N 3 position methyl group. Caffeine has a half-life of about 3–7 h unless the rate of action is affected by genetic and/or environmental factors, for example, CYP1A2 activity is decreased by female sex hormones during pregnancy or treatment with oral contraceptives(Reference Zaigler, Rietbrock, Szymanski, Dericks-Tan, Staib and Fuhr27).There is wide variation in CYP1A2 mRNA expression; up to 40-fold variation has been described(Reference Andersen, Farin and Omiecinski28, Reference Finnstrom, Thorn, Loof and Rane29). Genetic polymorphisms of the CYP1A2 gene, smoking, chargrilled foods, brassica vegetables and prescription medicines also affect the rate of caffeine metabolism(Reference Vineis, Malats, Lang, d'Errico, Caporaso, Cuzick and Boffetta30). Saliva measures were chosen in preference to blood and urine due in part to the ease of obtaining the samples and the lower invasiveness of the measure for the subjects. Plasma and saliva clearance levels of caffeine are highly correlated(Reference Carrillo, Christensen and Ramos31). Newton et al. (Reference Newton, Broughton, Lind, Morrison, Rogers and Bradbrook32) concluded that salivary caffeine levels probably reflect the unbound plasma caffeine concentration and therefore can be used to estimate the pharmacokinetic parameters of the drug. They estimated that the overall saliva:plasma concentration ratio was 0·74 (sd 0·08). Other evidence has suggested that the complex metabolism of caffeine, together with different parameters controlling the renal clearance of each metabolite, makes the use of urinary metabolic ratios an inaccurate probe in populations(Reference Notarianni, Oliver, Dobrocky, Bennett and Silverman33).
For the saliva measures, the between-sample variation was greater than the between-woman and between-day variation. This is expected, as the serum and saliva concentration of caffeine varies widely in response to recent caffeine intake. However, because of its longer half-life, paraxanthine concentrations will fluctuate less throughout the day and may be a better measure of caffeine intake. However, in the present study, the between-sample variation of saliva caffeine was lower than the between-sample variation of saliva paraxanthine. Despite this relatively large variability, Table 2 shows that, in general, both saliva measures adequately agreed with both the CAT and diary. As expected, the greatest level of agreement between the saliva measures and assessment of caffeine intake was found between seven saliva samples collected on day 1 and actual caffeine intake on that day, illustrating that a 1 d diary is a good snapshot of actual caffeine intake. Several measurements of salivary caffeine and paraxanthine over a day are far more likely to reflect intake than a single measurement. Both caffeine and paraxanthine have relatively short half-lives and concentrations in saliva (or plasma) change markedly over a day, reflecting recent consumption. Given that caffeine intake over the day is episodic, repeat measurements of salivary caffeine and paraxanthine are more likely to record this pattern of consumption than a single measurement at one time point.
A moderate, yet lower, agreement was found between the saliva measures and the more habitual intake calculated from the mean caffeine intake of the 3 d reported in the diary. Even though the CAT reflects longer-term habitual caffeine intake than the 3 d diary, the agreement between the CAT and saliva measures was only marginally less than that between the 3 d diary and saliva measures.
General comments
Despite using different methodologies, both the CAT and diary have emerged as equally good in assessing caffeine intake. However, it is the CAT that provides a practical, yet detailed, and therefore more accurate assessment of long-term habitual caffeine intake.
Only 38 % of the women recruited took part in the present study, which could be due to the demands of completing a 3 d food and drink diary and collecting nine saliva samples and monitoring caffeine intake over 2 d. It is important to consider that this sample of women may not be representative of the total pregnant population, as approximately one-third of the sample were employed in managerial and professional occupations.
As is evident from the present study, assessing long-term caffeine intake using food and drink diaries is not only impractical, but it is also likely to omit detail such as brand information. In the present study it was apparent that when such information was omitted from diaries, estimated caffeine intakes were on average 27 mg/d lower than intakes from the more detailed CAT – which is approximately equivalent to half a cup of tea. This suggests that the use of average values for sources of caffeine intake may underestimate caffeine intakes. A further source of error could be introduced by not considering strength of tea or coffee as commonly consumed. Different preparatory approaches to making tea or coffee can lead to variations in caffeine content(Reference Bracken, Triche, Grosso, Hellenbrand, Belanger and Leaderer34). We did ask women to record (in the CAT) the strength of tea and coffee they prepared and to state whether it was weak, medium or strong. We did not use this information, however, since there was limited published information available on variation in caffeine content by brand and preparation method. For instant coffee we did record and use in our analysis whether level or heaped teaspoons of dry coffee were used. Our previous experience of assessing diet has indicated that individual perceptions will vary and thus we could introduce more measurement error by using more subjective records. In addition, brewing times for cafetière-prepared coffee makes little difference to caffeine content of the brewed drink (PK Kadja, personal communication).
Repeated saliva measures may also be a useful measure of caffeine exposure. However, even if caffeine intake was accurately assessed, there exist inter-individual differences in metabolism that will influence spot saliva measurements. This may be especially relevant when assessing effects of caffeine exposure on pregnancy outcome, as caffeine metabolism decreases throughout pregnancy(Reference Aldridge, Bailey and Neims35).
A study is now being undertaken to assess the role of caffeine on pregnancy outcome, in particular low birth weight. Using the CAT, saliva measures of caffeine and metabolites, and a more detailed exploration of the inter-individual variations in caffeine metabolism, it will be possible to elucidate any links between caffeine and pregnancy outcome.
Acknowledgements
The present study was funded by the Food Standards Agency (FSA).
S. M. B. developed the project, carried out the fieldwork, undertook analysis and wrote the first draft of the paper. J. E. C. supervised the work and wrote the final draft of the paper. S. F. L. K. managed the project and commented on drafts of the paper. D. C. G. undertook some of the analysis and commented on drafts of the paper. K. L. M. W. developed some of the laboratory methods, undertook laboratory analysis and contributed to the paper. S. S. worked on the laboratory methods and undertook laboratory analysis. N. A. B. S. provided access to subjects and contributed to the design of the main study. C. P. W. supported the laboratory team and contributed to the design of the main study. A. W. M. H. developed laboratory methods, wrote some of the manuscript and supported the design of the study.
There is no conflict of interest.


