


Investigation of dietary intake is generally performed in terms of the daily intake of individual foods/food groups and nutrients(Reference Jacobs and Steffen1). However, studying dietary intake at the meal level (i.e. breakfast, lunch, dinner and snack) may be more pertinent than overall dietary intake, given that all foods are not always consumed proportionately at each meal but rather when eating, people mainly choose to combine foods in each of the meal types, resulting in meal-specific food combinations(Reference Andersson, Nydahl and Gustafsson2–Reference Murakami, Livingstone and Shinozaki4). Unfortunately, data on how different meal types differ in their contribution to the total intake of foods and nutrients are limited, both internationally(Reference Myhre, Loken and Wandel5–Reference Almoosawi, Winter and Prynne9) and specifically in the Japanese context. This kind of information would be helpful for formulating meal-based dietary guidelines and public health messages as well as for developing effective intervention strategies for healthy eating.
Mainly because of their possible contribution to a low prevalence of coronary artery disease and long life expectancy(Reference Sasaki10,Reference Ikeda, Saito and Kondo11) , much attention has focused on the characteristics of Japanese dietary habits, which are somewhat different from those in Western countries(Reference Murakami, Shinozaki and Fujiwara12). Typically, the Japanese diet includes a high consumption of refined grains, soyabean products, seaweeds, vegetables, fish and green tea and a low consumption of whole grains, nuts, processed meat and sugar-sweetened beverages(Reference Micha, Khatibzadeh and Shi13,Reference Murakami, Livingstone and Sasaki14) . At the nutrient level, Japanese diets are high in Na(Reference Powles, Fahimi and Micha15,Reference Asakura, Uechi and Sasaki16) but low in saturated fats(Reference Micha, Khatibzadeh and Shi17,Reference Murakami, Livingstone and Fujiwara18) and added sugars(Reference Murakami, Livingstone and Fujiwara18,Reference Fujiwara, Murakami and Asakura19) . Furthermore, Japanese diets are high in dietary glycaemic index and glycaemic load(Reference Murakami and Sasaki20) but low in dietary energy density(Reference Murakami, Livingstone and Okubo21).
Japanese meal patterns typically consist of a staple food (mainly rice), a main dish (mainly protein-rich foods) and a side dish (mainly vegetables)(Reference Murakami, Livingstone and Sasaki22). Furthermore, the proportion of daily energy intake (EI) consumed at breakfast, lunch, dinner and snacks is, on average, 23, 30, 40 and 8 %, respectively, in Japan(Reference Murakami, Livingstone and Sasaki23), while the ranges of corresponding values are 9–20 % (median 16 %), 16–45 % (median 25 %), 24–40 % (median 32 %) and 10–34 % (median 26 %), respectively, in the USA(Reference Kant24) and ten European countries participating in the European Prospective Investigation into Cancer and Nutrition calibration study(Reference Huseinovic, Winkvist and Slimani25). Additionally, recent analyses conducted in the UK(Reference Murakami and Livingstone26), the USA(Reference Murakami and Livingstone27), Australia(Reference Leech, Livingstone and Worsley28) and Japan(Reference Murakami, Shinozaki and Livingstone29) have shown that the associations of frequency of meals (sum of breakfast, lunch and dinner) and snacks with overall diet quality differ among populations, warranting thorough investigation on food and nutrient profiles of each meal type within a specific population.
In the present cross-sectional study, we characterised breakfast, lunch, dinner and snacks in the Japanese context, by examining how each meal contributes to intakes of foods and nutrients, as well as the nutritional quality of each meal. We also examined the associations of overall diet quality with food and nutrient intakes from each of the different meal types.
Methods
Data source and analytic sample
The present cross-sectional analysis was based on two independent data sets collected using the similar procedure but at different time periods, that is in 2003 and 2013. As details of both surveys have been provided elsewhere(Reference Asakura, Uechi and Sasaki16,Reference Murakami, Sasaki and Takahashi30–Reference Asakura, Uechi and Masayasu33) , only a brief description is given here. The 2003 survey was conducted among apparently healthy women and their cohabitating spouses in four geographically diverse areas in Japan: Osaka (urban), Okinawa (urban island), Nagano (rural inland) and Tottori (rural coastal)(Reference Murakami, Livingstone and Sasaki31,Reference Murakami, Livingstone and Fujiwara32) . Our recruitment strategy was such that each 10-year age category, namely 30–39, 40–49, 50–59 and 60–69 years, included eight women for each area (without consideration of age of men), resulting in 256 participants. The 2013 survey was conducted among apparently healthy men and women aged 20–69 years working in welfare facilities (and, in some occasions, their neighbours and acquaintances in the over 60 years) in twenty study areas consisting of twenty-three (out of forty-seven) prefectures(Reference Asakura, Uechi and Sasaki16,Reference Asakura, Uechi and Masayasu33) . In the recruitment process, each of the areas included two men and two women from each of the five 10-year age groups (20–29, 30–39, 40–49, 50–59 and 60–69 years), resulting in 400 participants. Participation of one individual per household was permitted.
In total, 642 participants (n 250 in 2003 and 392 in 2013) provided dietary data for the present analysis. In both surveys, recruitment was conducted until the planned number of participants in each of sex and age groups was enrolled. Unfortunately, the number of potential participants invited was not formally recorded, and thus, the participation rate could not be calculated. After excluding three participants with missing information on the variables of interest, the present analysis was based on 639 individuals. None of the sample was a dietitian, had an experience with dietary counselling from a medical doctor or dietitian or had history of hospitalisation for diabetes education.
Dietary assessment
Dietary data were collected by a four-non-consecutive day weighed dietary record during the winter season (February and March) in both surveys(Reference Murakami, Sasaki and Takahashi30,Reference Asakura, Uechi and Masayasu33) . Each recording period comprised three week days (Monday to Friday) and one weekend day (Saturday or Sunday) in the 2003 survey and three working days and one non-working day in the 2013 survey. Each of the recording days was (non-randomly) allocated within approximately 2 weeks by research dietitians. In the latter survey, night shift-working days and days before and after a night shift work were avoided as recording days. Each participant was issued recording sheets and a digital scale (KD-173; Tanita in 2003 and KD-812WH; Tanita in 2013). After receiving written and verbal instructions by a research dietitian, as well as an example of a completed diary sheet, each participant was requested to document and weigh all items eaten or drunk, both in and out of the home, on each of the recording days. On occasions when weighing was problematic (e.g. dining out), they were instructed to document as much information as possible, including the brand name of the food and the consumed portion size (based on typical household measures), as well as the details of leftovers.
The recording sheets for each survey day were submitted directly to the research dietitian after the survey was completed, who then reviewed the forms and, whenever necessary, sought additional information or modification of the record via telephone or in person. All the collected records were then reviewed by research dietitians at each local centre and again at the study centre. As requested in the study protocol, portion sizes estimated using household measures were converted into weights and individual food items were coded based on the Standard Tables of Food Composition in Japan(34). Estimates of intakes of fifteen selected food groups were then calculated for each individual; grouping of foods was done based on similarities in nutrient profile or culinary use of the foods, as shown elsewhere(Reference Almoosawi, Winter and Prynne9). Estimated intakes of energy and selected nutrients for each individual were calculated based on the intakes of food items and their nutrient contents. Added sugar intake, defined as sugars and syrups added to food during processing or preparation, excluding naturally occurring sugars in foods, was also calculated based on a recently compiled comprehensive composition database(Reference Fujiwara, Murakami and Asakura19).
Assessment of diet quality
As measures of diet quality, the Healthy Eating Index 2015 (HEI-2015)(Reference Krebs-Smith, Pannucci and Subar35-Reference Panizza, Shvetsov and Harmon37) and Nutrient-Rich Food Index 9.3 (NRF9.3)(Reference Drewnowski and Fulgoni38–Reference Drewnowski, Rehm and Vieux41) were calculated. The HEI-2015 is a 100-point scale to assess compliance with the 2015–2020 Dietary Guidelines for Americans(42), with a higher score indicating a better quality of overall diet. The HEI-2015 consists of nine adequacy components (total fruits, whole fruits, total vegetables, greens and beans, whole grains, dairy products, total protein foods, seafood and plant proteins, and fatty acids as the ratio of the sum of PUFA and MUFA to SFA) and four moderation components (refined grains, Na, added sugars and saturated fats). We calculated the HEI-2015 component and total scores based on energy-adjusted values of overall dietary intake, namely amount per 1000 kcal of energy or percentage of energy, except for fatty acids(Reference Murakami, Livingstone and Fujiwara32).
The NRF9.3 is a composite measure of the nutrient density of the total diet, calculated as the sum of the percentage of reference daily values for nine qualifying nutrients, namely protein, dietary fibre, vitamin A, vitamin C, vitamin D, Ca, Fe, K and Mg, minus the sum of the percentage of reference daily values for three disqualifying nutrients, namely added sugars, saturated fats and Na. Reference daily values were determined for sex and age categories, based on the Dietary Reference Intakes for Japanese, 2015(43), except for added sugars, for which the conditional recommendation advocated by the WHO (i.e. upper limit of 5 % of energy)(44) was used because of the lack of a recommended value for added sugars in Japan, as well as their low intake levels(Reference Fujiwara, Murakami and Asakura19). We calculated the NRF9.3 component and total scores based on the overall daily intake of each nutrient for each participant, which was adjusted for EI by the density method and then normalised for the sex- and age-specific Estimated Energy Requirement for a moderate level of physical activity (from the Dietary Reference Intakes for Japanese, 2015(43)) and expressed as a percentage of the reference daily values(Reference Murakami, Livingstone and Fujiwara32). Higher NRF9.3 scores indicated a better quality of the overall diet.
Rationale for the choice of these two diet quality measures primarily developed for Americans but not for Japanese was as follows. First, in our recent systematic review of Japanese studies which obtained dietary patterns using principal component analysis, we found that those food groups which contributed to dietary patterns termed healthy (fruits, vegetables, potatoes, mushrooms, seaweeds and pulses) are at least partly similar to those often observed in Western countries (fruits, vegetables including mushrooms, poultry, fish, low-fat dairy products, legumes and whole grains)(Reference Murakami, Shinozaki and Fujiwara12). Further, our recent analysis based on the Japanese National Health and Nutrition Survey supports the efficacy of these measures in assessing the overall diet quality of Japanese: a higher total score in the HEI-2015 and NRF9.3 was associated with favourable patterns of overall diet, including higher intakes of dietary fibre and key vitamins and minerals and lower intakes of saturated fats, added sugars and Na(Reference Murakami, Livingstone and Fujiwara18).
Definition of each meal type
The food diary sheet used was based on a typical Japanese eating pattern, comprising breakfast, lunch, dinner and snacks, which were prescribed in the diary(Reference Murakami, Livingstone and Sasaki31). During the diet recording, participants were asked to report the clock time when a food or beverage was consumed (both start and finish times). In this study, eating occasions were defined as any separate intake occasion with a discrete start clock time and name, except for eating occasions consisting of water only (tap and mineral water), which were excluded(Reference Leech, Worsley and Timperio45). Consequently, all items reported in an eating occasion were given the same clock time and eating occasion name in the food diary.
Each of the eating occasions was categorised into breakfast, lunch, dinner or snacks based on the section in the food diary in which it was recorded, except for the following two situations. The first is multiple entries of eating occasions (with different times) into a section of breakfast, lunch or dinner (only 10 cases). For this, the first eating occasion was considered the main meal (breakfast, lunch or dinner) and the subsequent eating occasions were considered snacks. The second is ≥2 different types of eating occasions recorded within the overlapping time period (243 cases), in which case each of the overlapping eating occasions was combined and counted as a single eating occasion. Where a participant recorded a main meal (breakfast, lunch or dinner) and a snack within the overlapping period, we considered this eating occasion a meal, unless the participant had already recorded that same meal earlier in the day, in which case this eating occasion was considered a snack. It should be noted that the definition of each meal type used is generally consistent with the previous research(Reference Myhre, Loken and Wandel5–Reference Almoosawi, Winter and Prynne9).
Assessment of other variables
Body height was measured without shoes to the nearest 0·1 cm. Body weight was measured in light clothing to the nearest 0·1 kg. BMI (kg/m2) was calculated as body weight (kg) divided by the square of body height (m), based on which, weight status was grouped into three categories of underweight (<18·5), normal weight (≥18·5 to <25·0) and overweight (≥25·0)(46). Misreporting of EI was evaluated on the basis of the ratio of EI:BMR (Goldberg’s cut-off)(Reference Black47). BMR was estimated according to an equation specifically developed for Japanese on the basis of body height and weight, age and sex(Reference Miyake, Tanaka and Ohkawara48,Reference Ganpule, Tanaka and Ishikawa-Takata49) . Assuming a physical activity level for a sedentary lifestyle (i.e. 1·55) for all participants (because of a lack of an objective measure of physical activity), underreporting, plausible reporting and overreporting were defined as having EI:BMR of <1·02, ≥1·02 to <2·35 and ≥2·35, respectively(Reference Black47).
Statistical analysis
All statistical analyses were performed using SAS statistical software (version 9.4; SAS Institute Inc.). All reported P values are two-tailed, and P values < 0·05 were considered statistically significant. For all dietary variables, mean daily values over 4 d were used in the analysis to minimise day-to-day variations in dietary intake and a value of zero was assigned for non-consumers. Descriptive statistics of diet quality scores and intakes of energy, nutrients and food groups for total diet and for each meal type are presented as mean and standard deviations. Pearson correlation coefficients among diet quality scores were calculated. Differences in diet quality scores between sex, between survey year and across categories of age (<40, 40–59 and ≥60 years), weight status and dietary reporting status were examined on the basis of independent t test or ANOVA followed by a Bonferroni’s post hoc test. For each of the dietary variables (energy, nutrients and food groups), the percentage contribution to total intake was calculated for each meal type. Associations between overall diet quality (tertile category of total scores of HEI-2015 and NRF9.3 of total diet) and intakes of energy, nutrients and food groups from each meal type were examined using the general linear model, with adjustment for sex, age group, weight status, dietary reporting status and survey year. Analyses were repeated after stratified by age (by median), sex or survey year, which provided the findings generally similar to those observed in the entire sample (data not shown). The present report, therefore, presents the results for the entire sample. Power calculations were not performed because this study is a secondary analysis of existing data with an exploratory nature.
Results
The present analysis included 639 Japanese adults with a mean age of 47·1 (sd 13·2) years and a mean BMI of 23·1 (sd 3·4) kg/m2. The percentage of participants who reported consumption of breakfast, lunch and dinner on all four dietary recording days was high (88·0, 92·3 and 96·9 %, respectively; see online supplementary material, Supplemental Table 1). In contrast, the prevalence of no consumption of each of these meals on all 4 d was very low (0·8 % for breakfast, 0·5 % for lunch and 0 % for dinner). The percentage of participants who reported consumption of at least one snack on all four dietary recording days was 59·9 %, while the prevalence of no snack consumption on all 4 d was 7·2 %. Mean clock time for the start of breakfast (n 634), lunch (n 636) and dinner (n 639) was 07.28 (sd 00.46), 12.32 (sd 00.32) and 19.25 (sd 00.56) hours, respectively. The daily snack frequency ranged from 0 to 8, with a mean of 1·8 (sd 1·3), while the daily total eating frequency ranged from 1·5 to 11, with a mean of 4·7 (sd 1·3).
Diet quality as assessed by the HEI-2015 and NRF9.3 was, on average, highest for dinner, followed, in order, by lunch, breakfast and snacks (Table 1). As theoretically expected, the quality of each meal type was positively correlated with that of the total diet (Pearson correlation: 0·29–0·65 for HEI-2015 and 0·34–0·70 for NRF9.3). Nevertheless, the correlation between the four meal types was relatively weak (Pearson correlation: 0·09–0·33 for HEI-2015 and 0·15–0·25 for NRF9.3).
Descriptive statistics of total scores of the Healthy Eating Index-2015 (HEI-2015) and Nutrient-Rich Food Index 9.3 (NRF9.3) in 639 Japanese adults aged 20–81 years
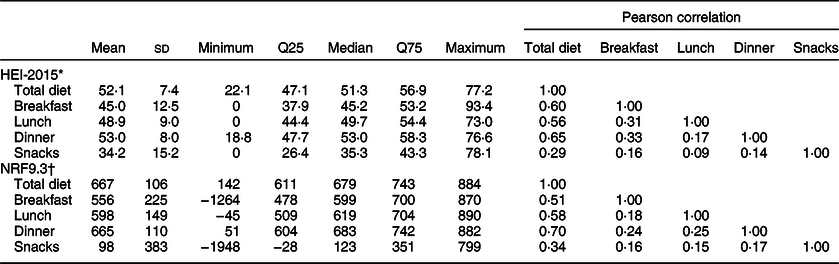
Q25, 25th percentile; Q75, 75th percentile.
* A maximum score is 100. A higher score indicates a higher diet quality.
† A maximum score is 900. A higher score indicates a higher diet quality.
Table 2 shows total scores of the HEI-2015 and NRF9.3 according to each category of basic characteristics. Compared with men, women had a higher mean value of HEI-2015 for breakfast and lunch but a lower mean value of NRF9.3 for total diet. There was a positive association of age with all diet quality variables, while there was no association for weight status. Participants identified as underreporters had lower diet quality scores than those identified as plausible reporters, overreporters or both, except for NRF9.3 for breakfast and snacks. Participants in the 2013 survey had lower diet quality scores than those in the 2003 survey, except for NRF9.3 for lunch.
Total scores of the Healthy Eating Index-2015 (HEI-2015) and Nutrient-Rich Food Index 9.3 (NRF9.3) according to each category of basic characteristics in 639 Japanese adults aged 20–81 years

* A maximum score is 100. A higher score indicates a higher diet quality.
† A maximum score is 900. A higher score indicates a higher diet quality.
‡ Based on independent t test.
§ Based on ANOVA. When the overall P from ANOVA was < 0·05, a Bonferroni’s post hoc test was performed; mean values within each variable with unlike superscript letters are significantly different (P < 0·05).
|| Underweight, normal weight and overweight were defined as participants having a BMI (in kg/m2) of <18·5, ≥18·5 to <25 and ≥25, respectively.
¶ Underreporting, plausible reporting and overreporting were defined as participants having a ratio of reported energy intake:BMR of <1·02, ≥1·02 to <2·35 and ≥2·35, respectively.
Breakfast, lunch, dinner and snacks, on average, accounted for 21, 32, 40 and 11 % of total EI, respectively (Table 3). For nutrients, the percentage contribution to total intake tended to be similar in magnitude to that for EI: 18–24 % for breakfast, except for alcohol (4 %) and Ca (29 %); 26–35 % for lunch, except for alcohol (20 %); 35–49 % for dinner, except for added sugars (27 %) and alcohol (70 %); and 4–15 % for snacks, except for added sugars (37 %). Breakfast, lunch and dinner were relatively similar in terms of percentage of energy from macronutrients, while characteristics of snacks included high intakes of saturated fats and added sugars and low intakes of protein and total fat.
Intakes of energy and nutrients from each meal and their percentage contribution to total intake in 639 Japanese adults aged 20–81 years*
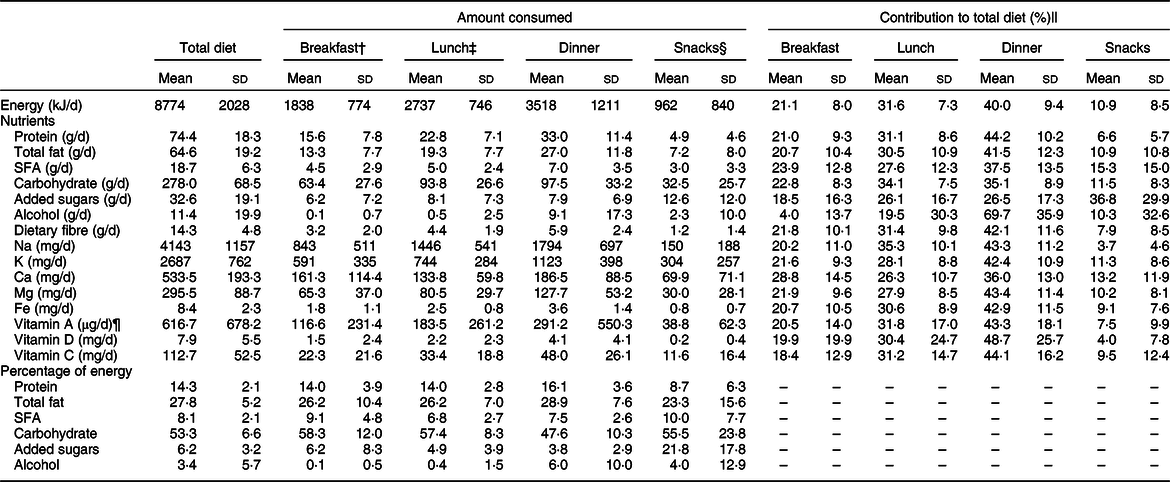
* Values are per capita intakes unless otherwise indicated.
† For the calculation of percentage of energy, n 634 after excluding five non-breakfast consumers.
‡ For the calculation of percentage of energy, n 636 after excluding three non-lunch consumers.
§ For the calculation of percentage of energy, n 593 after excluding forty-six non-snack consumers.
|| For alcohol, n 615 because there were twenty-four participants whose total alcohol intake was zero.
¶ Retinol activity equivalent.
However, intakes of many food groups were largely dependent on one meal type (Table 4). The foods mainly eaten at dinner were potatoes, pulses, total vegetables, fish, meat and alcoholic beverages (52–70 %), in contrast to noodles (58 %) at lunch and bread (71 %) and dairy products (50 %) at breakfast. The foods mainly eaten at snacks were confectioneries (79 %) and sugar-sweetened beverages (52 %). Conversely, intakes of rice and eggs were more evenly distributed across three main meals (19–41 % and 30–38 %, respectively). Additionally, intakes of fruit and non-energetic beverages were more evenly distributed across all meal types (17–30 % and 19–35 %, respectively).
Intakes of foods from each meal and their percentage contribution to total intake in 639 Japanese adults aged 20–81 years*
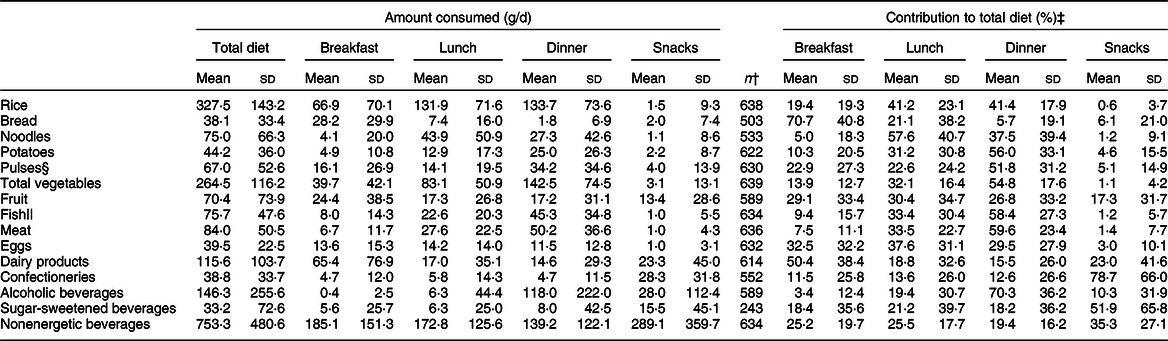
* Values are per capita intakes unless otherwise indicated.
† Number of consumers.
‡ Calculated based on consumers only.
§ Including nuts.
|| Including shellfish.
EI from breakfast (but not lunch or dinner) was positively associated with overall diet quality as assessed by total scores of HEI-2015 (Table 5) and NRF9.3 (data not shown) of total diet. Conversely, associations with overall diet quality were relatively consistent for intakes of nutrients across three main meals. A higher overall diet quality was associated with higher intakes of protein, dietary fibre, K, Ca, Mg, Fe and vitamin C from all three main meals. In terms of food groups, a higher overall diet quality was associated with higher intakes of pulses, total vegetables and fish from all three main meals (Table 6 for HEI-2015 and data not shown for NRF9.3). Additionally, a higher overall diet quality was associated with higher intakes of rice, eggs and dairy products from breakfast, potatoes from lunch, and fruit from breakfast and dinner and lower intakes of bread from breakfast and lunch, confectioneries from lunch and sugar-sweetened beverages from dinner. Associations between intakes from snacks and overall diet quality were relatively weak in magnitude, notwithstanding an inverse association between snack energy and the NRF9.3 score (data not shown).
Associations of intakes of energy and nutrients from breakfast, lunch and dinner with total scores of the Healthy Eating Index-2015 (HEI-2015) of total diet in 639 Japanese adults aged 20–81 years*

T, tertile.
* Examined using the general linear model, with adjustment for sex, age group, weight status, dietary reporting status and survey year. Median values (ranges) of total scores of the HEI-2015 of total diet for the first, second and third tertile categories were 45·7 (22·1–48·3), 51·3 (48·4–55·1) and 59·3 (55·2–77·2), respectively. A higher score indicates a higher diet quality.
† For variables expressed as percentage of energy, n 634 after excluding five non-breakfast consumers.
‡ For variables expressed as percentage of energy, n 636 after excluding three non-lunch consumers.
§ Retinol activity equivalent.
Associations of intakes of foods from breakfast, lunch and dinner with total scores of the Healthy Eating Index-2015 (HEI-2015) of total diet in 639 Japanese adults aged 20–81 years*
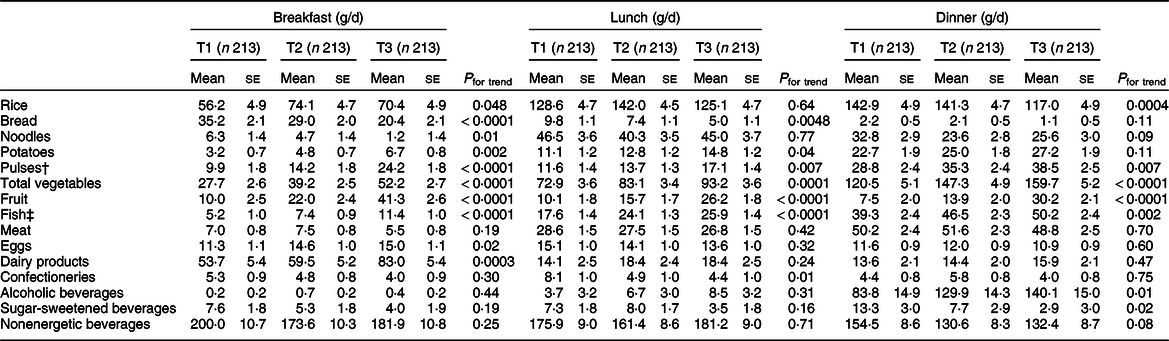
T, tertile.
* Examined using the general linear model, with adjustment for sex, age group, weight status, dietary reporting status and survey year. Median values (ranges) of total scores of the HEI-2015 of total diet for the first, second and third tertile categories were 45·7 (22·1–48·3), 51·3 (48·4–55·1) and 59·3 (55·2–77·2), respectively. A higher score indicates a higher diet quality.
† Including nuts.
‡ Including shellfish.
Discussion
In this study of Japanese adults, diet quality, which was assessed by the HEI-2015 and NRF9.3, was highest for dinner, followed by lunch, breakfast and snacks. The order was in line with the percentage contribution of each meal type to total EI and intakes of many nutrients. However, dinner was mainly characterised by the intake of potatoes, pulses, total vegetables, fish, meat and alcoholic beverages; lunch by noodles; breakfast by bread and dairy products; and snacks by confectioneries and sugar-sweetened beverages. Conversely, intakes of rice and eggs were more evenly distributed across three main meals, while intakes of fruit and non-energetic beverages were more evenly distributed across all four meal types. We further identified dietary intake patterns within each meal type associated with a higher quality of total diet. To our knowledge, this is the first study to characterise different meal types in Japanese adults, which would make an important contribution to the existing literature of meal intakes and patterns(Reference Myhre, Loken and Wandel5–Reference Almoosawi, Winter and Prynne9).
In this study, the mean percentage contribution to total EI was 21 % for breakfast, 32 % for lunch, 40 % for dinner and 11 % for snacks. This is consistent with that observed in the National Health and Nutrition Survey in Japan(Reference Murakami, Livingstone and Sasaki23), but is quite different from that in Western populations, where, generally speaking, the percentage contribution of breakfast is smaller and that of snacks is larger(Reference Kant24,Reference Huseinovic, Winkvist and Slimani25) . Thus, in relation to EI, the Japanese meal patterns may be characterised by three main meals, accompanied by small contribution from snacks in terms of both size and frequency. It has been suggested that consuming a high proportion of total EI at main meals (particularly lunch), as well as a small contribution of snacks, is an additional positive component of the Mediterranean diet, aside from the solely nutritional considerations(Reference Huseinovic, Winkvist and Slimani25,Reference Hoffman and Gerber50) . Thus, these characteristics we observed, in addition to the very low prevalence of meal skipping and the well-structured meal timing, might contribute to the health effect of Japanese diets, if any, in addition to the amount and content of food and nutrient intake. Further research on this topic is warranted.
We found that for many of the macro- and micronutrients, the percentage contribution to total intake did not vary within each meal type and tended to be similar to that for EI, implying that the nutrient density of each meal type is similar in Japanese dietary habits. This is generally consistent with findings from previous Western studies, at least for macronutrients(Reference Krok-Schoen, Jonnalagadda and Luo7–Reference Almoosawi, Winter and Prynne9). However, in contrast to our findings, evidence from several Western countries, including Canada, Denmark, France, Spain, the UK and the USA(Reference Gibney, Barr and Bellisle51), suggests that for micronutrients, the percentage contribution to total intake did vary, especially at breakfast. The exact reason is unknown, but this might be due to differences in the degree of dependence on one meal type for key foods, particularly plant-based foods. For example, a study in Norwegian adults showed that dinner accounted for 69 % (of daily intake) of vegetables (and 72 % of fish), breakfast accounted for 44 % of whole grains and snacks accounted for 51 % of fruits(Reference Myhre, Loken and Wandel5). Similar findings were observed from a national representative sample of Australian adults for non-starchy and starchy vegetables (62 and 81 % from dinner, respectively) and fruits (55 % from snacks)(Reference Sui, Raubenheimer and Rangan6). In contrast, intakes of major plant-based foods were more evenly distributed among three main meals in this study: the contribution of breakfast, lunch and dinner was, respectively, 14, 32 and 55 % for total vegetables; 29, 30 and 27 % for fruit (as well as 17 % from snacks) and 19, 41 and 41 % for rice (the major grain food). In any case, this kind of background information should be accumulated from various countries so that more effective country-specific meal-based dietary guidelines and public health messages could be developed.
We found that favourable dietary intake patterns associated with a higher diet quality of total diet were relatively consistent across three main meal types. That is, there was a positive association of overall diet quality with intakes of key nutrients and food groups to encourage from each main meal. However, one clear exception to note was rice. A higher intake of rice from breakfast was positively associated with a higher overall diet quality, but such a positive association was not observed for lunch or dinner. This may be because there are multiple options for staple foods (rice or bread) in breakfast in Japan(Reference Murakami, Livingstone and Sasaki22,Reference Murakami, Livingstone and Sasaki31) , and thus, the association with overall diet quality may be assessed mainly as a comparison of a choice of rice or bread within breakfast. For support on this, bread intake at breakfast was inversely associated with overall diet quality. On the other hand, because rice is more exclusively selected as a staple food for lunch and dinner(Reference Murakami, Livingstone and Sasaki22,Reference Murakami, Livingstone and Sasaki31) , the association with overall diet quality may be assessed mainly as a comparison of other foods accompanied by rice within lunch and dinner. These observations, as well as relatively weak correlations of diet quality among meal types, highlight the complex nature of meals as food combinations, which, in turn, suggests the importance of accumulating evidence at the meal level.
The strength of this study is the use of detailed dietary information obtained from a 4-d weighed dietary record. However, there are also several limitations. First, although sampling was conducted to consider regional differences in dietary habits, the present population is not a nationally representative sample of general Japanese, but rather volunteers, of whom some lived in the same household. In particular, our participants may be biased towards greater health consciousness. We unfortunately do not know how the present population is comparable with the general Japanese population in terms of, for example, educational level and employment because of a lack of information. Nevertheless, the mean values of the HEI-2015 in the present population were comparable with those reported from the 2012 Japanese National Health and Nutrition Survey (51·3 (sd 9·0) for men and 52·9 (sd 9·2) for women; information not available for NRF9.3)(Reference Murakami, Livingstone and Fujiwara18). Further research in a more representative sample is needed.
Second, all self-reported dietary assessment methods are subject to both random and systematic errors(Reference Livingstone and Black52), and the nature and extent of the measurement error of self-reported information on dietary intake from each meal type are largely unknown(Reference Kant24). The present results should therefore be interpreted with caution in this respect. Nevertheless, the use of the Goldberg’s cut-off (based on EI:BMR) identified only a few underreporters and overreporters (3·1 and 2·3 %, respectively), suggesting overall satisfactory reporting accuracy of dietary intake. To minimise the influence of measurement error in dietary variables, we mainly relied on the percentage contribution to total intake for interpreting our data, as well as the use of energy-adjusted values for diet quality measures(Reference Subar, Freedman and Tooze53).
Third, because the dietary data used here were collected during the winter season (February and March), any seasonal variation in dietary intake was not considered. Given that several previous studies have observed seasonal differences in intakes of at least some nutrients and food groups in Japanese adults(Reference Owaki, Takatsuka and Kawakami54–Reference Tokudome, Imaeda and Nagaya56), this might have produced some bias in assessing average dietary intake over the year. Additionally, while two independent data collected in 2003 and 2013 were combined for the main analysis after confirming that separate analyses produced similar results, this 10-year difference might be potentially significant when it comes to diet. Given that a trend analysis based on National Health and Nutrition Survey 2003–2015(Reference Murakami, Livingstone and Sasaki14) showed significant albeit small differences in food group intakes during this period, the present results should be interpreted cautiously.
Fourth, diet quality was assessed by the HEI-2015 and NRF9.3 in this Japanese study, even though both scores were primarily developed for Americans. Thus, these measures are not optimal for assessing the overall quality of Japanese diet, but rather the best available(Reference Murakami, Livingstone and Fujiwara18), as mentioned above. Finally, in view of the multiple analyses for the associations between overall diet quality and intakes from each meal type, it is possible that some of the significant findings in the present study occurred by chance.
In conclusion, in this study of Japanese adults, dinner was highest in terms of not only diet quality but also percentage contribution to total EI, followed by lunch, breakfast and snacks. For many nutrients, the percentage contribution to total intake did not vary across each meal type and was broadly in line with that for EI. For foods, on the other hand, intakes largely depended on one meal type, except for several foods, including rice, eggs, fruit and non-energetic beverages, which were more commonly consumed at various meal types. This study also provided a picture of dietary intake patterns within each meal type associated with a higher quality of total diet. These findings provide the key information on each meal type in the Japanese diet and will help inform the development of meal-based guidelines and public health messages. Future research is needed to examine whether the present findings are similarly observed in a more representative sample of Japanese as well as in other Asian populations.
Acknowledgements
Acknowledgements: The authors thank Naoko Hirota, Akiko Notsu, Ayako Miura, Hidemi Todoriki, Mitsuru Fukui and Chigusa Date for data collection. Financial support: This study was funded by a Health and Labour Sciences Research Grant (number H23-jyunkankitou (seishuu)-ippan-001) and H13 Health Sciences Research Grant (Kenkou-kagakusougoukenkyujigyou) from the Ministry of Health, Labour and Welfare, Japan. The Ministry of Health, Labour and Welfare had no role in the design, analysis or writing of this article. Conflict of interest: None. Authorship: K.M. conceptualised the study question, analysed and interpreted the data, prepared the first draft of the manuscript and had primary responsibility for the final content; N.S. contributed to the conceptualisation of the study question and data interpretation and assisted in the writing of the manuscript; M.B.E.L. contributed to the conceptualisation of the study question and provided critical input into the final draft of the manuscript; A.F. assisted in the writing of the manuscript; K.A. contributed to the design of the survey, data collection and data management. S.M. managed the study-field establishment and recruitment and contributed to data collection and S.S. directed the survey. All authors have read and agreed to the final version of the manuscript. Ethics of human subject participation: For both the 2003 survey and 2013 survey, the study purpose and protocol were explained before the study and written informed consent was obtained from each participant. Use of data from the 2003 survey and the study protocol of the 2013 survey were approved by the University of Tokyo Faculty of Medicine Ethics Committee (numbers 3421 and 10005, respectively).
Supplementary material
For supplementary material accompanying this paper visit https://doi.org/10.1017/S1368980020004310


 Open access