

Introduction
A major advantage of speaking more than one language is the ability to communicate with people that have different language backgrounds. In a bilingual's everyday life, a conversation with a colleague in one's second language English may, for instance, be followed by a chat with a friend in one's native language Dutch. For communication to be successful, bilinguals consequently need to exert control over which specific language they use in a particular context (Penfield & Roberts, Reference Penfield and Roberts1959). The control mechanisms supporting bilinguals' ability to select the contextually appropriate language and switch between their languages are heavily debated (e.g., Baus, Branzi & Costa, Reference Baus, Branzi, Costa and Schwieter2015; Bobb & Wodniecka, Reference Bobb and Wodniecka2013; Declerck & Philipp, Reference Declerck and Philipp2015; La Heij, Reference La Heij, Kroll and de Groot2005). At the same time, the ecological validity of the cued language-switching paradigm, prominently used to experimentally study bilingual language switching, is a matter of ongoing debate (Finkbeiner, Almeida, Janssen & Caramazza, Reference Finkbeiner, Almeida, Janssen and Caramazza2006; Gollan & Ferreira, Reference Gollan and Ferreira2009; Gollan, Kleinman & Wierenga, Reference Gollan, Kleinman and Wierenga2014; Kleinman & Gollan, Reference Kleinman and Gollan2016; Myers-Scotton, Reference Myers-Scotton2006; Peeters, Runnqvist, Bertrand & Grainger, Reference Peeters, Runnqvist, Bertrand and Grainger2014). The purpose of the current study is therefore twofold. First, we aim to advance our understanding of the control mechanisms involved in bilingual language production by examining behavioral and neurophysiological correlates of language switching. Second, we validate a novel research paradigm involving immersive Virtual Reality (VR) that is more similar to everyday language switching than traditional paradigms. Before turning to a description of the four experiments that were carried out, we first provide some background on bilingual language control.
In the cued language-switching paradigm, bilingual participants name pictures or digits that appear on a computer screen in their first language (L1) or second language (L2) as a function of a language cue, such as a color or a flag (see Declerck & Philipp, Reference Declerck and Philipp2015, for overview). Not surprisingly, it has been found that switching languages comes at a cost, with longer naming response times (RTs) for switch compared to non-switch trials (but see Kleinman & Gollan, Reference Kleinman and Gollan2016). More interestingly, such switch costs are often found to be asymmetrical in unbalanced bilinguals, as switching into the dominant language from the non-dominant language, counterintuitively, often takes longer than the reverse (e.g., Costa & Santesteban, Reference Costa and Santesteban2004; Costa, Santesteban & Ivanova, Reference Costa, Santesteban and Ivanova2006; Hernandez & Kohnert, Reference Hernandez and Kohnert1999; Ma, Li & Guo, Reference Ma, Li and Guo2016; Macizo, Bajo & Paolieri, Reference Macizo, Bajo and Paolieri2012; Meuter & Allport, Reference Meuter and Allport1999; Olson, Reference Olson2016; Peeters et al., Reference Peeters, Runnqvist, Bertrand and Grainger2014; Philipp, Gade & Koch, Reference Philipp, Gade and Koch2007; Reynolds, Schlöffel & Peressotti, Reference Reynolds, Schlöffel and Peressotti2016; Schwieter & Sunderman, Reference Schwieter and Sunderman2008).
The dominant interpretation of the switch cost asymmetry is provided by the Inhibitory Control Model (Green, Reference Green1998), which proposes a transient, trial-by-trial inhibitory mechanism that suppresses lexical representations from the non-target language reactively to allow for speaking in the intended language. The amount of inhibition applied is argued to be proportional to the strength of the language that needs to be suppressed, with relatively more inhibition applied to a relatively stronger language. Overcoming inhibition of the dominant L1 on an L1 trial that follows an L2 trial should therefore take longer than overcoming inhibition of the less dominant L2 on an L2 trial that follows an L1 trial. This explains the asymmetrical pattern of switch costs in unbalanced bilinguals. In line with this idea, the switch cost asymmetry is reduced for bilinguals with a relatively higher L2 proficiency (Meuter & Allport, Reference Meuter and Allport1999), and symmetrical switch costs have been observed for balanced bilinguals (Calabria, Hernández, Branzi & Costa, Reference Calabria, Hernández, Branzi and Costa2012; Costa & Santesteban, Reference Costa and Santesteban2004; Costa et al., Reference Costa, Santesteban and Ivanova2006; Meuter, Reference Meuter1994).
At the neurophysiological level, the transient inhibition of the L1 observed in unbalanced bilinguals when they intend to name a picture or digit in the non-dominant language is argued to be reflected in the amplitude of the N2 component of the event-related potential (ERP) time-locked to stimulus onset, with increased negativity for switch compared to non-switch trials only for the non-dominant language (Jackson, Swainson, Cunnington & Jackson, Reference Jackson, Swainson, Cunnington and Jackson2001; Verhoef, Roelofs & Chwilla, Reference Verhoef, Roelofs and Chwilla2009; see also Moreno, Rodríguez-Fornells & Laine, Reference Moreno, Rodríguez-Fornells and Laine2008). Thus, on the basis of the findings reviewed above, asymmetrical switch costs and the N2 component modulation have been considered as clear markers of a transient and reactive inhibitory mechanism involved in bilingual language control.
There are several reasons, however, why this straightforward view of bilingual language control is problematic. First, the switch cost asymmetry in unbalanced bilinguals has not always been replicated (Declerck, Koch & Philipp, Reference Declerck, Koch and Philipp2012; Slevc, Davey & Linck, Reference Slevc, Davey and Linck2016). Second, the switch cost asymmetry has been sensitive to changes in experimental design, procedure, and participant characteristics. Switch costs in unbalanced bilinguals have sometimes become symmetrical with more time between cue and stimulus picture (Verhoef, Roelofs & Chwilla, Reference Verhoef, Roelofs and Chwilla2009, Reference Verhoef, Roelofs and Chwilla2010, but see Costa & Santesteban, Reference Costa and Santesteban2004; Declerck, Koch & Philipp, Reference Declerck, Koch and Philipp2015; Fink & Goldrich, Reference Fink and Goldrick2015; Philipp, Gade & Koch, Reference Philipp, Gade and Koch2007), when participants are not cued to use a particular language but may switch voluntarily (Gollan & Ferreira, Reference Gollan and Ferreira2009), and when the unbalanced bilinguals who are tested in an experiment switch on a regular basis in everyday life (Christoffels, Firk & Schiller, Reference Christoffels, Firk and Schiller2007). Third, multilinguals who are highly proficient in L1 and L2 show symmetrical switch costs when switching between their L1 and a weaker L3 and when switching between their L2 and a weaker L3 (Costa & Santesteban, Reference Costa and Santesteban2004; Costa et al., Reference Costa, Santesteban and Ivanova2006; see also Martin, Strijkers, Santesteban, Escera, Hartsuiker & Costa, Reference Martin, Strijkers, Santesteban, Escera, Hartsuiker and Costa2013), but asymmetrical switch costs when switching between their L3 and an even weaker L4, and when switching between their L1 and a recently learned language (Costa et al., Reference Costa, Santesteban and Ivanova2006). Fourth, on the basis of studies measuring n-2 language repetition costs, it has been questioned whether the switch cost asymmetry should be considered a measure of reactive inhibition at all (see Declerck, Thoma, Koch & Philipp, Reference Declerck, Thoma, Koch and Philipp2015; Philipp & Koch, Reference Philipp and Koch2009). Finally, at the neurophysiological level, asymmetrical switch costs in unbalanced bilinguals have been observed in the absence of N2 effects of switching (Verhoef et al., Reference Verhoef, Roelofs and Chwilla2009). Symmetrical switch costs in unbalanced bilinguals, in turn, have been observed with an enhanced N2 for non-switch trials in a mixed block for the L1 only (Christoffels et al., Reference Christoffels, Firk and Schiller2007). All in all, these findings render the relationship between asymmetrical switch costs, the amplitude of the N2 component, and transient inhibitory mechanisms in bilingual language production far from straightforward (cf. Baus et al., Reference Baus, Branzi, Costa and Schwieter2015; Bobb & Wodniecka, Reference Bobb and Wodniecka2013; Declerck & Philipp, Reference Declerck and Philipp2015; Finkbeiner et al., Reference Finkbeiner, Almeida, Janssen and Caramazza2006; Koch, Gade, Schuch & Philipp, Reference Koch, Gade, Schuch and Philipp2010).
The possible role of inhibition in bilingual language control is not limited to putative transient inhibitory mechanisms involved in mixed language contexts. Evidence has been found in favor of sustained and proactive inhibition of the L1 in mixed language contexts (e.g., Christoffels et al., Reference Christoffels, Firk and Schiller2007). One measure of sustained control is the so-called mixing cost (Los, Reference Los1996), typically calculated by comparing naming RTs on non-switch trials in a mixed block to naming RTs in blocked naming contexts in which pictures or digits are named in a single language only within a block. In the cued language-switching paradigm, mixing costs have sometimes been larger for L1 than for L2 (Christoffels et al., Reference Christoffels, Firk and Schiller2007; Prior & Gollan, Reference Prior and Gollan2011, but see Declerck, Philipp & Koch, Reference Declerck, Philipp and Koch2013; Wang, Kuhl, Chen & Dong, Reference Wang, Kuhl, Chen and Dong2009). This suggests that in mixed language contexts, sustained inhibition may be applied to the L1, arguably to facilitate naming in the weaker L2 (Christoffels et al., Reference Christoffels, Firk and Schiller2007; Prior & Gollan, Reference Prior and Gollan2011). Supporting evidence for such sustained inhibition of the dominant language comes from the observation of reversed language dominance in mixed contexts (Christoffels et al., Reference Christoffels, Firk and Schiller2007; Costa & Santesteban, Reference Costa and Santesteban2004; Costa et al., Reference Costa, Santesteban and Ivanova2006; Gollan & Ferreira, Reference Gollan and Ferreira2009; Kleinman & Gollan, Reference Kleinman and Gollan2016; Peeters et al., Reference Peeters, Runnqvist, Bertrand and Grainger2014; Verhoef et al., Reference Verhoef, Roelofs and Chwilla2009; see Declerck & Philipp, Reference Declerck and Philipp2015, for overview). Indeed, unbalanced bilinguals have been observed to name pictures faster in their L2 compared to their L1 in mixed language blocks, which indicates that the availability of the L1 is to a certain extent adjusted in such mixed contexts for a longer period of time, presumably to allow for more efficient naming in L2 (Christoffels et al., Reference Christoffels, Firk and Schiller2007; Kroll, Bobb, Misra & Guo, Reference Kroll, Bobb, Misra and Guo2008; Peeters et al., Reference Peeters, Runnqvist, Bertrand and Grainger2014).
Besides mixing costs and reversed language dominance, also the effect of the order in which blocked L1 and L2 conditions are presented can be used as an indicator of sustained inhibition of the L1. Misra, Guo, Bobb, and Kroll (Reference Misra, Guo, Bobb and Kroll2012) had unbalanced bilinguals name pictures in two subsequent L1 blocks and in two subsequent L2 blocks, with the order of the language in which pictures had to be named counterbalanced across participants. Shorter naming RTs and a sustained positivity in the ERPs were found when the L2 blocks were the final two blocks in the experiment compared to when they were the first two blocks. No such behavioral repetition priming effect was found for the L1, and the ERPs showed enhanced negativity for late compared to early L1 blocks instead. These findings indicate that naming in L2 leads to sustained inhibition of the L1, cancelling out possible repetition priming in brain and behavior for the L1 (Misra et al., Reference Misra, Guo, Bobb and Kroll2012).
Research on mechanisms subserving bilingual language control tacitly assumes that these mechanisms also come into play in everyday switching situations. It is an open question, however, to what extent laboratory findings related to bilingual language control generalize to everyday bilingual experiences (Myers-Scotton, Reference Myers-Scotton2006; see Hartsuiker, Reference Hartsuiker and Huettig2015 for an overview of the role of linguistic and visual cues in bilingual language selection). The cued language-switching paradigm attains experimental control at the expense of creating an unnatural situation in which bilinguals name pictures in front of a computer monitor in the absence of an addressee. Increasing the ecological validity of the experimental paradigm might yield different patterns of results and lead to different conclusions about the mechanisms that actually allow for seemingly effortless switches between languages in everyday bilingual life (Gollan & Ferreira, Reference Gollan and Ferreira2009; Hartsuiker, Reference Hartsuiker and Huettig2015; Kleinman & Gollan, Reference Kleinman and Gollan2016; Myers-Scotton, Reference Myers-Scotton2006; Poulisse, Reference Poulisse1999). One step towards ecological validity has been taken in studies in which bilingual participants were allowed to voluntarily switch between languages in the absence of artificial language cues such as colors or flags (e.g., Gollan & Ferreira, Reference Gollan and Ferreira2009; Gollan et al., Reference Gollan, Kleinman and Wierenga2014). Other studies have investigated language switching in sentence production instead of word production (Declerck, Lemhöfer & Grainger, Reference Declerck, Lemhöfer and Grainger2016; Declerck & Philipp, Reference Declerck and Philipp2015b; Gullifer, Kroll & Dussias, Reference Gullifer, Kroll and Dussias2013; Tarlowski, Wodniecka & Marzecová, Reference Tarlowski, Wodniecka and Marzecová2013). However, in such studies participants are typically still talking to a computer monitor in the absence of having or perceiving any communicative intentions. In the current study, we exploit recent advances in immersive VR technology to improve the ecological validity of the cued language-switching paradigm while retaining full experimental control.
In general, VR offers unique possibilities to answer fundamental questions about the neurocognitive mechanisms supporting human language and communication in ecologically valid settings while maintaining experimental control (e.g. Blascovich & Bailenson, Reference Blascovich and Bailenson2011; Eichert, Peeters & Hagoort, in press; Fox, Arena & Bailenson, Reference Fox, Arena and Bailenson2009). Initial behavioral psycholinguistic studies using VR confirm that people speak to virtual interlocutors the way they speak to human interlocutors, and that they process speech produced by virtual agents similarly to that produced by human speakers. For instance, a study on syntactic priming found that the proportion of passive constructions people use increases as much when they are primed in a dialogue by a 3D virtual human-like partner compared to when they are primed by a human partner (Heyselaar, Hagoort & Segaert, Reference Heyselaar, Hagoort and Segaert2017). Moreover, people accommodate their pitch and their speech rate to the pitch level and the speech rate of their virtual partner (Gijssels, Staum Casasanto, Jasmin, Hagoort & Casasanto, Reference Gijssels, Staum Casasanto, Jasmin, Hagoort and Casasanto2016; Staum Casasanto, Jasmin & Casasanto, Reference Staum Casasanto, Jasmin, Casasanto, Ohlsson and Catrambone2010). These initial results indicate that findings obtained in virtual environments have the potential to generalize to everyday situations. The advantage of using virtual agents over human interlocutors (e.g., Gambi & Hartsuiker, Reference Gambi and Hartsuiker2016; Liu, Dunlap, Wu, Liang, Lu & Chen, Reference Liu, Dunlap, Wu, Liang, Lu and Chen2016) is the full experimental control over and the repeatability of the behavior of the virtual agents within and across different participants.
The present study
Four experiments were carried out to i) advance our understanding of potential transient and sustained inhibitory mechanisms involved in language switching in bilingual language production, and ii) test whether findings obtained in the traditional cued language-switching paradigm generalize to a setting that resembles language switching in everyday life between speakers of different languages. In each experiment, 24 unbalanced Dutch–English bilinguals named pictures as a function of a language cue in blocked and mixed conditions.
Experiment 1 served as a baseline experiment using the standard cued language-switching paradigm, in which the background color of the screen indicated whether pictures were to be named in L1 or L2. Experiment 2 took the cued language-switching paradigm into immersive VR, testing whether participants behave similarly in a virtual compared to a non-virtual environment, thereby serving as a baseline for the two later experiments. In Experiment 3, an ecologically more valid paradigm was introduced in which participants named pictures for two virtual agents as a function of the language background (Dutch or English) of their virtual addressee. Experiment 4 replicated this experiment combining immersive VR with recordings of the electroencephalogram (EEG).
If bilingual language control in unbalanced bilinguals is supported by transient, reactive inhibition as a function of differences in language proficiency in L1 versus L2, we should see a switch cost asymmetry with larger switch costs to the L1 than to the L2 (cf. Green, Reference Green1998; Meuter & Allport, Reference Meuter and Allport1999), possibly supported by enhanced negativity in the N2 component of the event-related potential (ERP) for L2 switch compared to L2 non-switch trials (Jackson et al., Reference Jackson, Swainson, Cunnington and Jackson2001; Verhoef et al., Reference Verhoef, Roelofs and Chwilla2009). In contrast, reversed language dominance and larger mixing costs for L1 than for L2 in both the behavioral and the ERP data would speak to sustained inhibition of the L1 in a mixed language context (Christoffels et al., Reference Christoffels, Firk and Schiller2007). At the methodological level, similar result patterns across the different instantiations of the cued language-switching paradigm applied here would confirm the ecological validity of the theoretical conclusions. Different patterns of results across the different experiments would question whether the results obtained in the standard paradigm generalize to more natural situations.
Experiment 1
Method
Participants
Twenty-four native speakers of Dutch (mean age 21.6, range 19–27 years old, one male) participated in the experiment. All participants were Dutch, studying in Nijmegen, and Dutch was their single native language. They started learning their second language (L2) English between the ages of 9 and 12 in school. They had normal or corrected-to-normal vision, no language or hearing impairments or history of neurological disease. They provided informed consent and were paid for participation.
Stimuli and design
Forty single-object high quality color images were taken from a standardized online picture database (Moreno-Martinez & Montoro, Reference Moreno-Martínez and Montoro2012). The objects depicted in the pictures came from a number of different semantic categories, such as animals, body parts, clothing, and food (see Appendix A). Objects with English–Dutch cognate names (e.g., zebra) were avoided. Each picture was presented on the screen once in an L1-block, once in an L2-block, and four times in a mixed block. This resulted in 40 trials per condition. In the L1-block participants named all pictures in their native language (Dutch). In the L2-block they named the pictures in their second language (English). In the mixed block, they named pictures either in Dutch or English depending on the background color of the screen at picture onset. In the mixed block, NamingLanguage (L1, L2) and TrialType (switch, non-switch) were within-participant factors in a 2x2 factorial design. The relation between the color (turquoise or pink) of the language cue and the language to be used (Dutch or English), and the order of presentation of the three experimental blocks were fully counterbalanced across participants. In the mixed block, each picture occurred once in every condition. There were always at least ten trials between two presentations of the same picture. Pictures were presented in a pseudorandomized order, with a maximum of five subsequent trials from the same condition. The first trial in the mixed block was not taken into account in the analysis.
Procedure
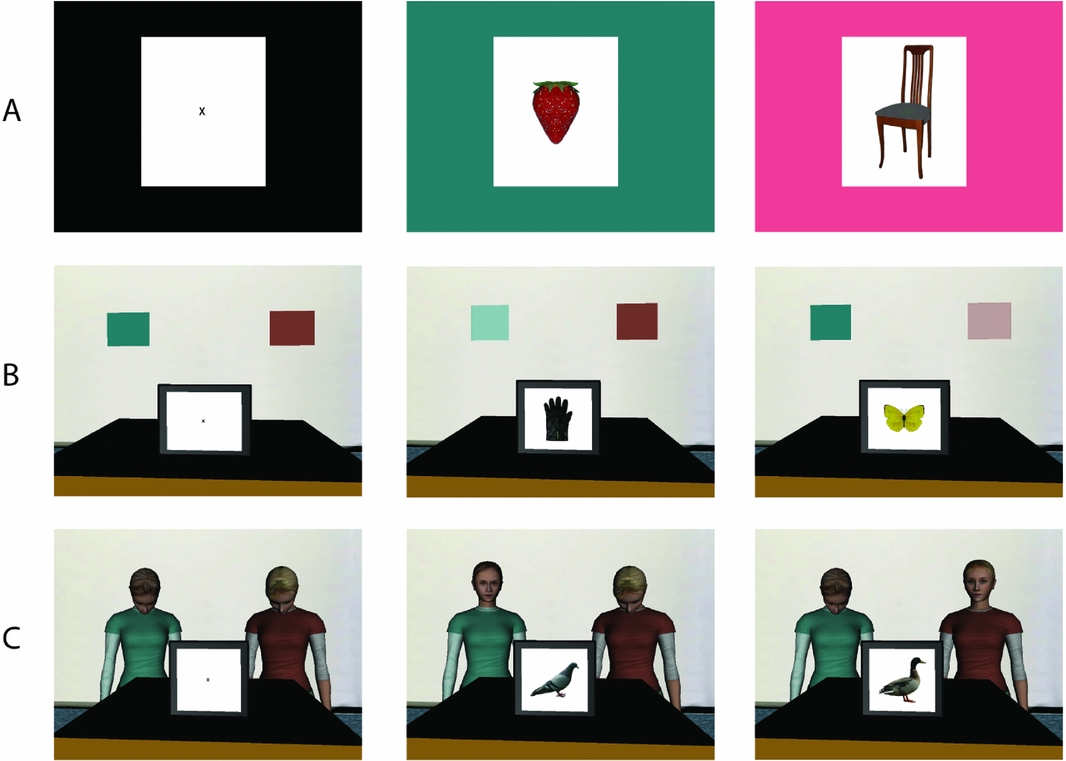
Participants were seated on a comfortable chair at 100 cm from a 24-inch computer monitor. They were instructed to name pictures in their L1 Dutch or their L2 English as a function of the background color of the screen at the moment a picture was presented (see Figure 1). They were familiarized with the pictures and their respective names in Dutch and English in a paper booklet prior to the start of the experiment. Each of the 3 experimental blocks was preceded by a practice set of 8 pictures that were not used in the experimental blocks. A trial in the experiment consisted of a fixation cross (1s) followed by the presentation of a picture (21 x 21 cm), both presented centered on the screen. At the exact moment a picture appeared on the screen, the background color of the screen changed from black to pink or turquoise, indicating the language that participants had to use to name the picture. Speech onset was detected by a wireless Sennheiser microphone. Whenever the voice key was triggered, the picture disappeared from the screen. If the voice key was triggered, the screen remained blank for 3s, after which the next trial started. If the voice key was not triggered within 3s from picture onset, the next trial started. An inter-trial interval of this length was opted for to allow for enough time to direct the virtual agents' gaze back to baseline in Experiments 3 and 4, and to allow for enough time for participants to blink between trials in Experiment 4 in which EEG was recorded.
A) In Experiment 1, a standard cued picture naming procedure was used in which the background color of the screen determined the language (L1 or L2) in which participants named a picture. Pictures were preceded by a fixation cross (left panel). Background color of the screen changed at picture onset (middle and right panels). B) In Experiment 2, participants named pictures in L1 and L2 in immersive VR as a function of the color cue that lit up at picture onset, following a fixation cross. C) In Experiments 3 and 4, participants named pictures in L1 and L2 in immersive VR as a function of the virtual agent that looked at them at picture onset. EEG was continuously recorded in Experiment 4.
Following the picture naming experiment, participants performed the English LexTALE task (Lemhöfer & Broersma, Reference Lemhöfer and Broersma2012) and filled out language background questionnaires that were used to assess their self-reported proficiency in Dutch and English (Table 1).
Participant characteristics in the four experiments. Participants performed the LexTALE lexical decision task in their L2 English, and rated their proficiency in their L1 Dutch and L2 English, in addition to the frequency with which they read in both their languages. Ratings were made on a 7-point Likert scale. Values within parentheses are standard deviations.
Behavioral analyses
Trials containing incorrect responses, false starts, or hesitations, and trials on which the microphone failed to record an RT were removed from the dataset (5.24% of all trials). R (R Core Team, 2014) and lme4 (Bates, Maechler & Bolker, Reference Bates, Maechler and Bolker2011) were used to test for possible switch costs, mixing costs, and reversed language dominance in the reaction times (RTs) using linear mixed effects regression models (Baayen, Davidson & Bates, Reference Baayen, Davidson and Bates2008; Barr, Levy, Scheepers & Tily, Reference Barr, Levy, Scheepers and Tily2013). Models were run with a maximal random effects structure (Barr et al., Reference Barr, Levy, Scheepers and Tily2013). Random slopes for interaction terms were removed from the model in case of non-convergence (see Tables for resulting models). To facilitate interpretation of the regression coefficients, NamingLanguage (-1 English; 1 Dutch), and TrialType (-1 Switch; 1 Nonswitch in the mixed block comparison, and -1 Blocked; 1 Nonswitch in the comparison of the mixed to the blocked language context) were mean-centered. Factors were interpreted as having a significant effect when the absolute t value exceeded 1.96 (Baayen et al., Reference Baayen, Davidson and Bates2008).
Results
Table 2 shows the average RTs per condition in the experiment. The mixed block comparison below tests for switch costs and reversed language dominance. The blocked language comparison compares the RTs in the L1-block to the RTs in the L2-block. The blocked versus mixed language context comparison tests for mixing costs.
Mean picture naming reaction times per condition for the four experiments. Values within parentheses are standard deviations.
Mixed block comparison
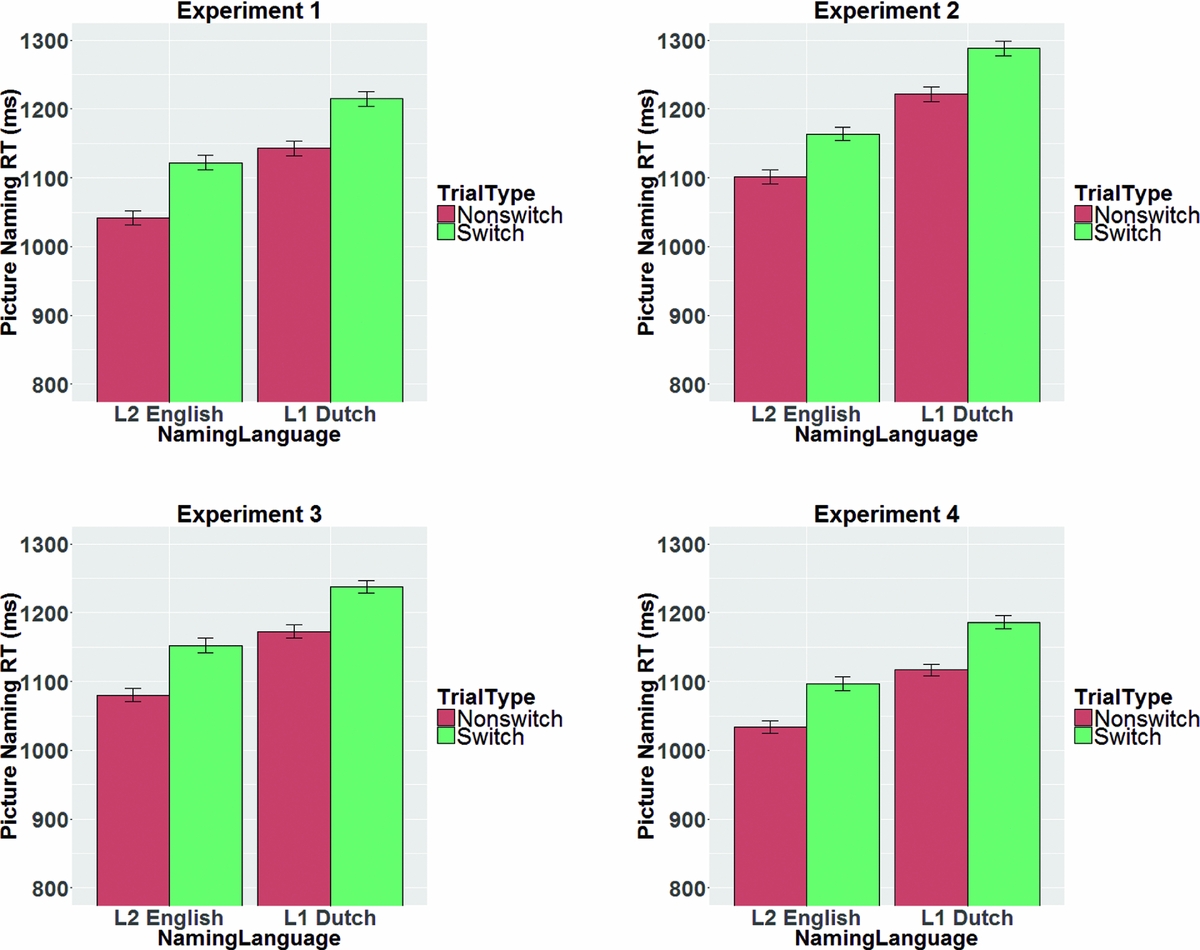
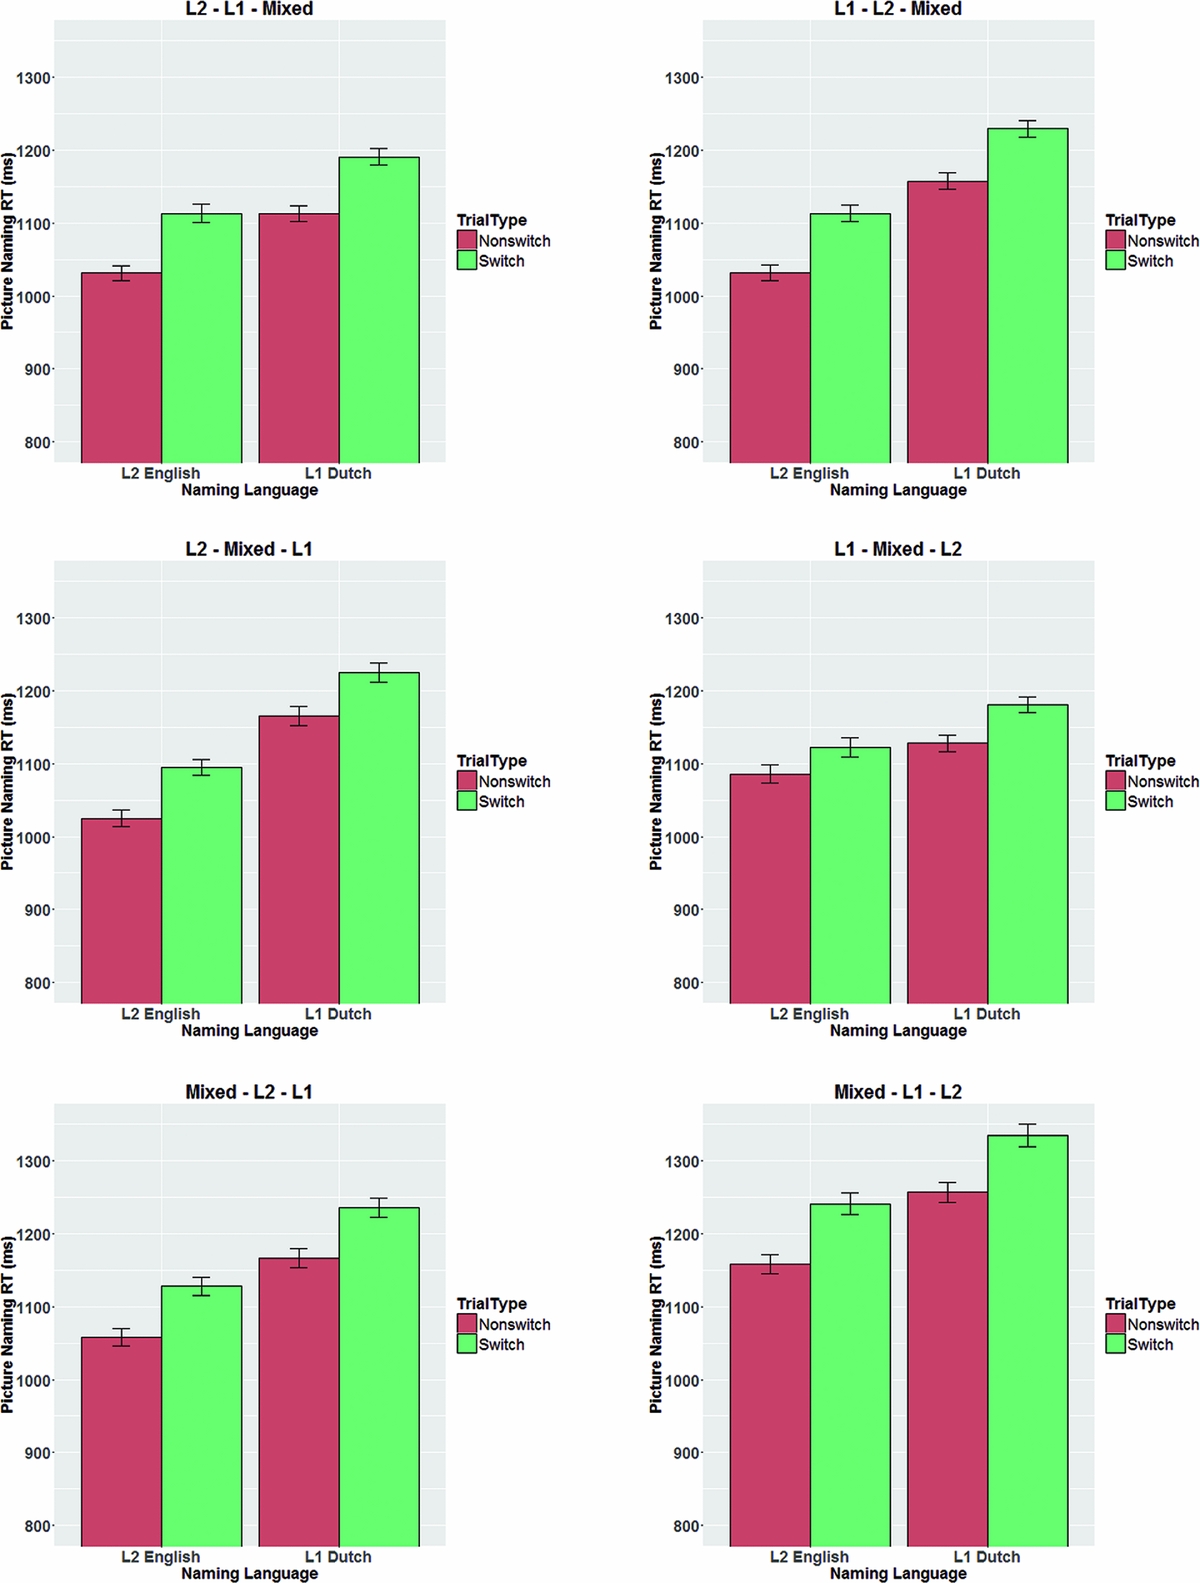
Table 3 shows the results of a linear mixed effects analysis with NamingLanguage (L1, L2), TrialType (switch, non-switch), and the interaction term (NamingLanguage * TrialType) as fixed effects, and intercepts for subjects and items as random effects. RTs were significantly shorter in L2 English (M = 1082 ms) than in L1 Dutch (M = 1179 ms). Non-switch trials (M = 1092 ms) yielded a significantly shorter RT than switch-trials (M = 1168 ms). The t-value for the interaction term (0.56) suggested no significant interaction between the NamingLanguage and TrialType. Indeed, a likelihood ratio test confirmed that the model with the interaction term did not improve model fit compared to a model without the interaction term, χ2 (9) = .990, p = .999. In sum, reversed language dominance and symmetrical switch costs were found (see Figure 2).
Outcome of the linear mixed models performed on the data from Experiment 1.
Overview of switch costs in the picture naming RTs in the mixed block for the four experiments. Error bars are standard errors of the mean.
Blocked language comparison
A comparison of RTs in the single language blocks suggested that RTs were shorter in the L2-block (M = 989 ms) than in the L1-block (M = 1023 ms), but this difference was not statistically significant (t = 1.11).
Blocked versus mixed language context comparison
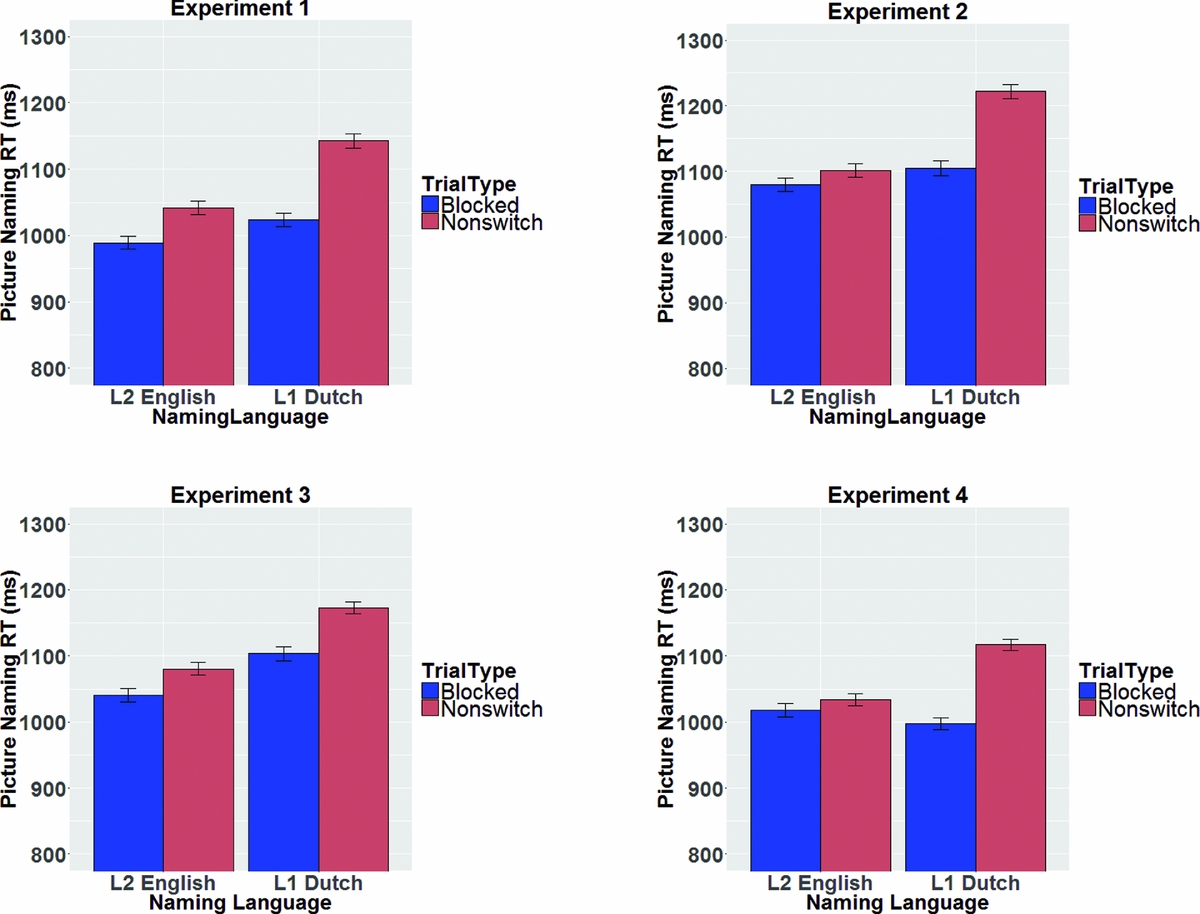
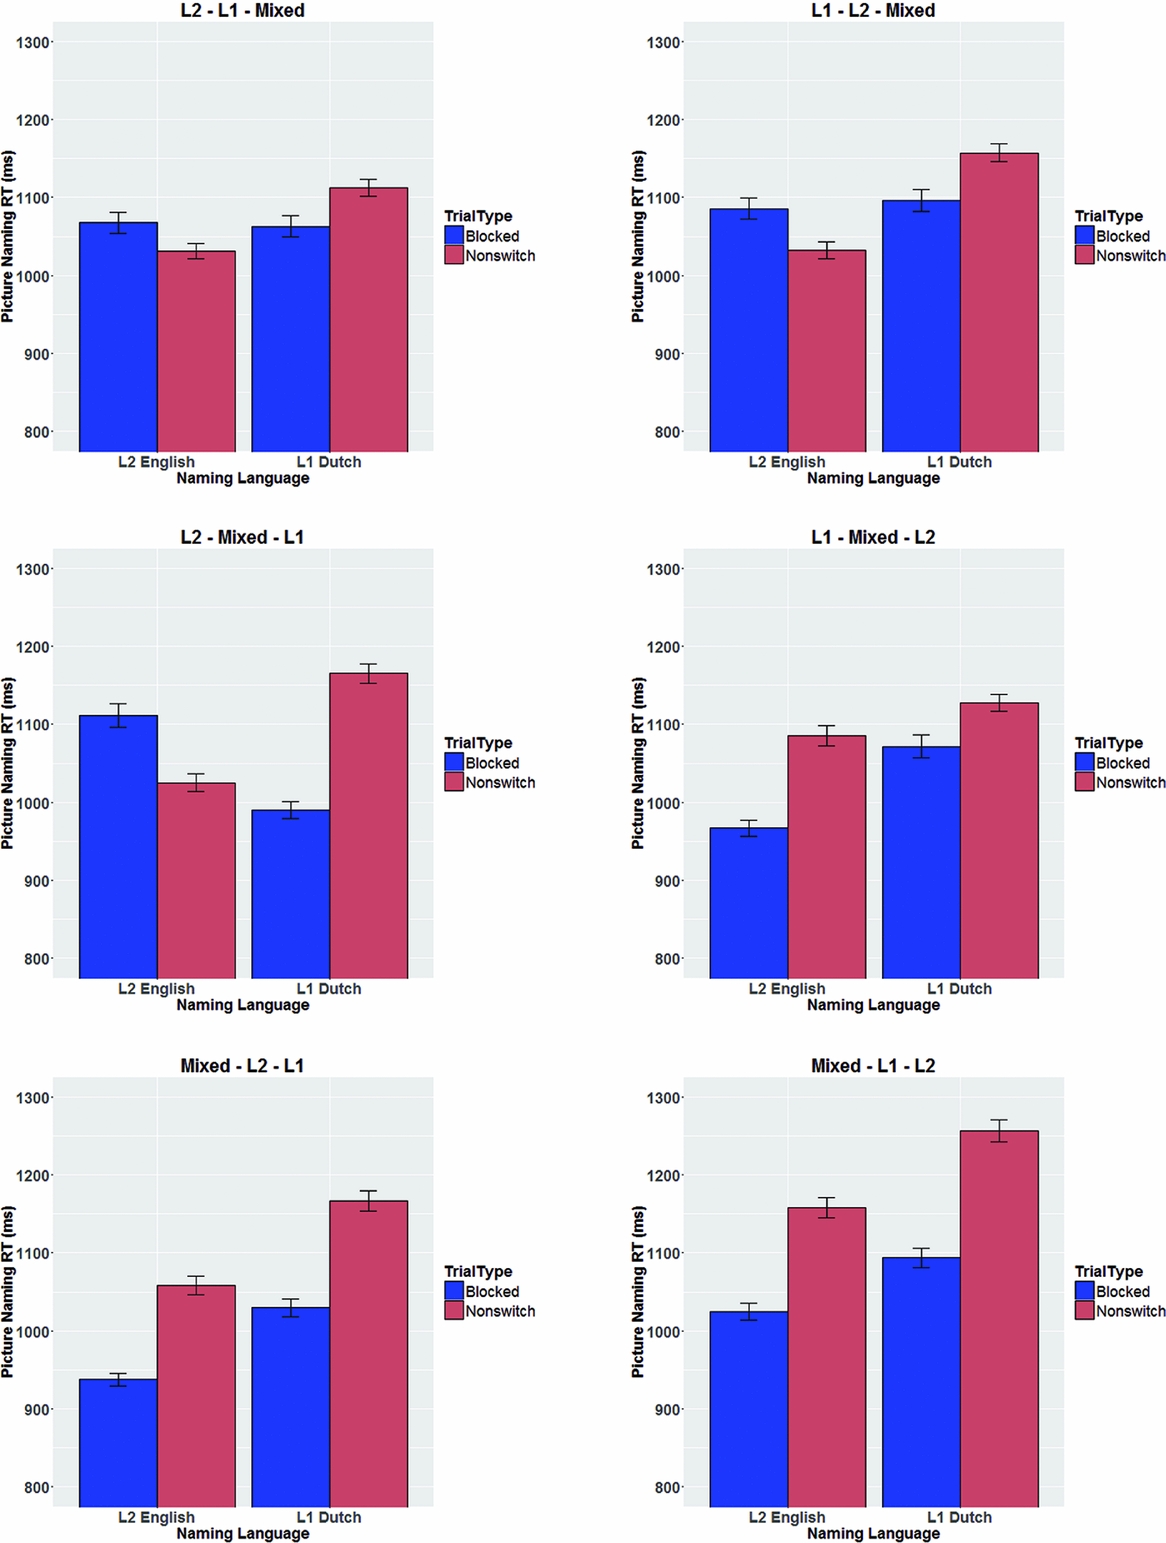
The two blocked language conditions were compared to the non-switch trials in the mixed block in a linear mixed effects analysis with NamingLanguage (L1, L2), TrialType (blocked, non-switch), and the interaction term (NamingLanguage * TrialType) as fixed effects, and intercepts for subjects and items as random effects. A significant effect of NamingLanguage reflected that RTs were significantly shorter for L2 (M = 1015 ms) compared to L1 (M = 1082 ms). A significant effect of TrialType reflected that RTs were significantly shorter in the single language blocks (M = 1006 ms) compared to the non-switch trials in the mixed block (M = 1092 ms). A significant interaction between the two factors (t = 2.27) indicated that these mixing costs were larger for L1 (M = 120 ms) compared to L2 (M = 52 ms) (see Figure 3).
Overview of mixing costs in the picture naming RTs in the four experiments. Error bars are standard errors of the mean.
Discussion
Experiment 1 tested for behavioral markers of transient and sustained inhibition in unbalanced Dutch–English bilinguals using the traditional cued language-switching paradigm. Symmetrical switch costs, reversed language dominance in a mixed language context, and asymmetrical mixing costs were observed. These findings indicate that unbalanced bilinguals apply sustained inhibition to their L1 in a mixed language context. This mild inhibition of the dominant language would allow for more efficient language production in the less dominant L2 in a mixed language context. As a consequence of the sustained inhibition of the L1, language dominance reverses (naming in the weaker L2 becomes faster than naming in the dominant L1 in the mixed block) and mixing costs become larger for the L1. Switch costs, in turn, become symmetrical in that language switching comes at a cost that is comparable for both languages. The absence of an asymmetry in switch costs argues against an important role for transient, reactive inhibition in mixed language contexts that is sensitive to the relative proficiency levels of an unbalanced bilingual's L1 and L2, and is thereby not in line with this particular aspect of the Inhibitory Control Model (Green, Reference Green1998; cf. Christoffels et al., Reference Christoffels, Firk and Schiller2007).
Experiment 2 takes bilingual language switching into immersive VR. We first tested whether the mere fact that an experiment takes place in VR changes participants' pattern of behavior in the cued language-switching paradigm. Participants therefore named pictures in their L1 and their L2 in blocked and mixed conditions in a virtual environment as a function of two virtual language cues.
Experiment 2
Method
Participants
Twenty-four new participants (mean age 21.1, range 18–26 years old, five males), matching the criteria from Experiment 1, participated in the experiment. Data from one additional participant was discarded due to an error percentage that exceeded 20%.
Apparatus, stimuli, and design
The experiment took place in a virtual environment adapted from a stock environment produced by WorldViz (“room.wrl”). Wearing a head-mounted display (HMD), participants were immersed in a virtual room that contained a table on which a virtual screen resembling a computer monitor was presented. Above the virtual screen, two colored (one turquoise, one pink) squares were shown on the wall, which functioned as language cues (see Figure 1). The experiment was programmed and run using Vizard software (WorldViz, Santa Barbara, CA). Participants wore an NVIS nVisor SX60 HMD, which presented the virtual environment at 1280 x 1024 resolution with a 60-degree monocular field of view. Eight reflective markers were mounted on the HMD and linked to a passive infrared DTrack2 motion tracking system (Advanced Realtime Tracking, Weilheim, Germany). These data were used to update the participant's viewpoint as they moved their head. The refresh rate of the HMD was 60 Hz. Images were rendered with an NVidia Quadro FX5800 graphics card. Please note that the quality of the virtual environment and the experience of immersion and presence are actually much higher than can be estimated from the static 2D-images presented in Figure 1.
Picture stimuli and design were identical to Experiment 1. Different from Experiment 1, the two language cues were placed above the virtual monitor to be in line with the position of the heads of the virtual agents in Experiments 3 and 4 (see below).
Procedure and analyses
The procedure was similar to Experiment 1, except that pictures were presented on a virtual screen and that participants were instructed to name pictures in their L1 Dutch or their L2 English as a function of the language cue that lit up at the moment a picture was presented on the virtual screen. The wireless Sennheiser microphone was attached to the HMD throughout the experiment. The analyses of the behavioral data were identical to Experiment 1. An additional analysis was carried out comparing Experiment 1 to Experiment 2, to test whether performing a similar task in a traditional lab setting versus an immersive 3D virtual environment changed the pattern of results.
Results
Trials containing incorrect responses, false starts, and hesitations, and trials on which the microphone failed to record an RT were removed from the dataset (7.20% of all trials).
Mixed block comparison
Table 4 shows the results of a linear mixed effects analysis with NamingLanguage (L1, L2), TrialType (switch, non-switch), and the interaction term (NamingLanguage * TrialType) as fixed effects, and intercepts for subjects and items as random effects. RTs were significantly shorter in L2 English (M = 1133 ms) than in L1 Dutch (M = 1254 ms). Non-switch trials (M = 1162 ms) yielded a significantly shorter RTs than switch-trials (M = 1225 ms). The t-value for the interaction term (−0.25) suggested no significant interaction between the NamingLanguage and TrialType. Indeed, a likelihood ratio test confirmed that the model with the interaction term did not improve model fit compared to a model without the interaction term, χ2 (9) = 7.81, p = .553. In sum, reversed language dominance and symmetrical switch costs were found (see Figure 2).
Outcome of the linear mixed models performed on the data from Experiment 2.
Blocked language comparison
A comparison of RTs in the single language blocks suggested that RTs were shorter in the L2-block (M = 1079 ms) than in the L1-block (M = 1105 ms), but this difference was not statistically significant (t = 0.68).
Blocked versus mixed language context comparison
The two blocked language conditions were compared to the non-switch trials in the mixed block in a linear mixed effects analysis with NamingLanguage (L1, L2), TrialType (blocked, non-switch), and the interaction term (NamingLanguage * TrialType) as fixed effects, and intercepts for subjects and items as random effects. A significant effect of NamingLanguage reflected that RTs were significantly shorter for L2 (M = 1090 ms) compared to L1 (M = 1164 ms). A significant effect of TrialType reflected that RTs were significantly shorter in the single language blocks (M = 1092 ms) compared to the non-switch trials in the mixed block (M = 1162 ms). A significant interaction between the two factors (t = 2.37) suggested that these mixing costs were larger for L1 (M = 116 ms) compared to L2 (M = 22 ms).
Comparison of Experiments 1 and 2
The data from Experiment 1 and 2 were combined into a single dataset with the additional factor Experiment (1 versus 2). In the mixed block comparison, a trend towards a main effect of Experiment (t = 1.77) was found, in line with the numerically longer RTs in Experiment 2 compared to Experiment 1 (see Figures 2 and 3). The blocked language comparison did show a significant effect of Experiment (t = 2.89), indicating longer RTs in Experiment 2 than in Experiment 1. The blocked versus mixed language context comparison also showed a significant main effect of Experiment (t = 2.56), indicating longer RTs in Experiment 2 compared to Experiment 1. In none of the analyses, a significant interaction effect of Experiment with the one or both of the other factors was observed. Hence, the pattern of results was statistically similar across the two Experiments, but overall participants were slower in Experiment 2 than in Experiment 1.
Discussion
Symmetrical switch costs, reversed language dominance in a mixed language context, and asymmetrical mixing costs were observed in Experiment 2. This pattern of results replicated the findings from Experiment 1, which indicates that participants did not behave differently in an immersive virtual environment compared to a traditional experimental situation. Thus, the behavioral markers of sustained L1 inhibition were robust across two different experimental settings. Overall, RTs were longer in Experiment 2 compared to Experiment 1. We attribute this difference to a novelty effect, as participants have more experience with tasks on computer monitors compared to tasks in immersive 3D virtual environments.
In Experiment 3 we replaced the artificial language cues by a Dutch-speaking and an English-speaking virtual addressee. Direct gaze at the participant by one of the two virtual addressees at picture onset served as a language cue indicating in which language a picture had to be named. Direct gaze was chosen as an ecologically valid language cue, because in everyday conversations it often serves as an ostensive marker that signals the intention to communicate (e.g., Csibra, Reference Csibra2010).
Experiment 3
Method
Participants
Twenty-four new participants (mean age 21.4, range 18–28 years old, nine males), matching the criteria from Experiments 1 and 2, participated in the experiment. Data from one additional participant was discarded due to an error percentage that exceeded 20%.
Apparatus, design and stimuli
Apparatus, design and stimuli were identical to Experiment 2, except for one critical difference. The two language cues were replaced by two virtual agents that were seated opposite the participant at the other side of the virtual table. The virtual agents were both adapted from a stock avatar produced by WorldViz (“casual15_f_highpoly”). The voices of the virtual agents were rendered with a 24-channel WorldViz Ambisonic Auralizer System.
Procedure and behavioral analyses
Participants were instructed by the experimenter to name pictures in either Dutch or English depending on the virtual agent that looked at them at the moment a picture appeared on the screen (see Figure 1). They were told that one virtual agent (“Lotte”) only spoke Dutch and the other virtual agent (“Evelyn”) only spoke English. Before the start of the experiment, after participants were familiarized with the pictures and the HMD was placed on their heads, the two virtual agents introduced themselves to the participant. Including lip sync and gaze at the participant, virtual agent Evelyn said “Hi, my name is Evelyn. I only speak English. Whenever I look at you, please tell me the name of the picture. Respond as quickly and accurately as possible”. Virtual agent Lotte then looked up at the participant and said the equivalent for Dutch in Dutch. The voices of the two virtual agents were recorded from a native speaker of Dutch and a native speaker of English who matched the virtual agents in age and ethnicity. Throughout the experiment, both virtual agents by default looked down. Critically, however, at the moment a picture appeared on the virtual screen, one of the virtual agents dynamically looked up and gazed at the participant, which served as a natural language cue. In the L1 block, only the Dutch virtual agent looked at the participant at picture onset. Similarly, in the L2 block only the English virtual agent looked at the participant. In the mixed block, serving as a language cue, either the Dutch or the English virtual agent looked at the participant at picture onset. The physical appearance of the virtual agents in relation to their language identity (Dutch or English), their position behind the virtual table (left vs. right), and the order of presentation of the three experimental blocks were fully counterbalanced across participants. The analyses of the behavioral data were identical to Experiments 1 and 2.
Results
Trials containing incorrect responses, false starts, and hesitations, and trials on which the microphone failed to record an RT were removed from the dataset (5.70% of all trials).
Mixed block comparison
Table 5 shows the results of a linear mixed effects analysis with NamingLanguage (L1, L2), TrialType (switch, non-switch), and the interaction term (NamingLanguage * TrialType) as fixed effects, and intercepts for subjects and items as random effects. RTs were significantly shorter in L2 English (M = 1116 ms) than in L1 Dutch (M = 1205 ms). Non-switch trials (M = 1127 ms) yielded a significantly shorter RTs than switch-trials (M = 1195 ms). The t-value for the interaction term (0.56) did not indicate a significant interaction between NamingLanguage and TrialType. Indeed, a likelihood ratio test confirmed that the model with the interaction term did not differ significantly from a model without the interaction term, χ2 (9) = 2.58, p = .979. These analyses thus revealed reversed language dominance and symmetrical switch costs (see Figures 2–3).
Outcome of the linear mixed models performed on the data from Experiment 3.
Blocked language comparison
A comparison of RTs in the single language blocks suggested that RTs were shorter in the L2-block (M = 1040 ms) than in the L1-block (M = 1103 ms), but this difference was not statistically significant (t = 1.65).
Blocked versus mixed language context comparison
The two blocked language conditions were compared to the non-switch trials in the mixed block in a linear mixed effects analysis with NamingLanguage (L1, L2), TrialType (blocked, non-switch), and the interaction term (NamingLanguage*TrialType) as fixed effects, and intercepts for subjects and items as random effects. RTs were significantly shorter in L2 (M = 1060 ms) compared to L1 (M = 1138 ms) and significantly shorter in the single language blocks (M = 1072 ms) compared to the non-switch trials in the mixed block (M = 1127 ms). The t-value for the interaction term (0.95) indicated no significant interaction between NamingLanguage and TrialType. Thus, reversed language dominance and relatively symmetrical mixing costs (M = 70 ms for L1 and M = 40 ms for L2) were found.
Discussion
Experiment 3 showed reversed language dominance in a mixed language context and symmetrical switch costs in unbalanced Dutch–English bilinguals, as in the previous two Experiments. Mixing costs were statistically symmetrical, but numerically larger for the L1 compared to the L2. These findings thus again argue in favor of a sustained inhibitory account of bilingual language control. Moreover, the similarities in the patterns of results from Experiments 1–3 confirm the ecological validity of the cued language-switching paradigm.
Experiment 4 further tested the stability of the behavioral findings obtained in Experiment 3 and aimed to shed more light on the neurophysiological correlates of the proposed sustained inhibitory mechanisms involved in bilingual language control by recording and analyzing participants' EEGs.
Experiment 4
Method
Participants
Twenty-four new right-handed (Oldfield, Reference Oldfield1971) participants (mean age 21.6, range 19–29 years old, two males), matching the criteria of Experiments 1, 2, and 3, participated in the experiment. Data from two additional participants was not analyzed due to a large number of EEG artifacts visible during the recording session. Data from one participant was excluded from the EEG analysis due to a large number of EEG artifacts that had to be removed during the pre-processing stage.
Apparatus, design and stimuli
Apparatus, design and stimuli were identical to Experiment 3.
Procedure and behavioral analyses
The only difference in experimental procedure compared to Experiment 3 was the recording of participants' EEGs. To do so, after electrode montage, the HMD was placed over the EEG-cap. The analyses of the behavioral data were identical to Experiments 1–3.
Electrophysiological recording and analysis
Throughout the experiment, the participant's EEG was recorded continuously from 59 active electrodes (Brain Products, Munich, Germany) held in place on the scalp by an elastic cap (Neuroscan, Singen, Germany). In addition to the 59 scalp sites (see Figure 4 for electrode montage), three external electrodes were attached to record participants electrooculogram (EOG), one below the left eye (to monitor for vertical eye movement/blinks), and two on the lateral canthi next to the left and right eye (to monitor for horizontal eye movements). Finally, one electrode was placed over the left mastoid bone and one over the right mastoid bone. All electrode impedances were kept below 20 KΩ. The continuous EEG was recorded with a sampling rate of 500 Hz, a low cut-off filter of 0.01 Hz and a high cut-off filter of 200 Hz. All electrode sites were referenced online to the electrode placed over the left mastoid and re-referenced offline to the average of the right and left mastoids.
Overview of the equidistant electrode montage. Numbers refer to electrode sites used in Figures 5–8 below.

Preprocessing and analyses were carried out using Fieldtrip (Oostenveld, Maris, Fries & Schoffelen, Reference Oostenveld, Fries, Maris and Schoffelen2011). The raw EEG data was low-pass filtered offline at 40 Hz. Epochs from 100 ms preceding picture onset to 700 ms after picture onset were selected. The epochs were truncated at 700 ms, because after this point the earliest speech production artifacts started to contaminate the EEG signal. The 100 ms pre-stimulus period was used as a baseline. Trials defined as errors or outliers in the behavioral analyses, and trials containing ocular or muscular artifacts were not taken into consideration in the averaging process (13.26 % of all trials).
The event-related potential data were analyzed using cluster-based permutation tests (Maris & Oostenveld, Reference Maris and Oostenveld2007) on the full epoch (0–700 ms). This non-parametric, data-driven approach has the advantage of controlling for the family-wise error rate that arises when an effect of interest is evaluated at multiple time points and electrodes (Maris & Oostenveld, Reference Maris and Oostenveld2007), leading to the multiple comparisons problem in the analysis of electrophysiological data (Maris, Reference Maris2012). To describe the cluster-based permutation approach in short, for every data point (electrode by time), a simple dependent-samples t test comparing two conditions was performed. All adjacent data points (spatial or temporal) exceeding an alpha level of .05 were grouped into clusters. For all clusters (both positive and negative), the sum of the t statistics was used in the cluster-level test statistic. A null distribution was then calculated that assumed no difference between conditions (2000 randomizations, calculating the largest cluster-level statistic for each randomization), after which the actually observed cluster-level statistics were compared against this null distribution and clusters falling in the highest or lowest 2.5% percentile were considered significant (Bonferroni corrected; a p value < .025 reflects a significant effect). The same approach was used to test for significant interactions between factors by taking the difference between two levels of each factor as input to the initial dependent-samples t tests.
Results
Behavioral results
Trials containing incorrect responses, false starts, and hesitations, and trials on which the microphone failed to record an RT were removed from the dataset (6.68% of all trials).
Mixed block comparison
Table 6 shows the results of a linear mixed effects analysis with NamingLanguage (L1, L2), TrialType (switch, non-switch), and the interaction term (NamingLanguage * TrialType) as fixed effects, and intercepts for subjects and items as random effects. RTs were significantly shorter in L2 English (M = 1065 ms) than in L1 Dutch (M = 1151 ms). Non-switch trials (M = 1076 ms) yielded significantly shorter RTs than switch-trials (M = 1142 ms). The t-value for the interaction term (−0.12) suggested no significant interaction between NamingLanguage and TrialType. Indeed, a likelihood ratio test confirmed that the model with the interaction term did not differ significantly from a model without the interaction term, χ2 (5) = .024, p = .999. Similar to Experiments 1, 2 and 3, reversed language dominance and symmetrical switch costs were found (see Figure 2).
Outcome of the linear mixed models performed on the data from Experiment 4.

Blocked language comparison
A comparison of RTs in the single language blocks suggested that RTs were shorter in the L1-block (M = 997 ms) than in the L2-block (M = 1018 ms), but this difference was not statistically significant (t = −1.00).
Blocked versus mixed language context comparison
The two blocked language conditions were compared to the non-switch trials in the mixed block in a linear mixed effects analysis with NamingLanguage (L1, L2), TrialType (blocked, non-switch), and the interaction term (NamingLanguage * TrialType) as fixed effects, and intercepts for subjects and items as random effects. No significant effect of NamingLanguage was found. A significant effect of TrialType reflected that RTs were significantly shorter in the single language blocks (M = 1008 ms) compared to the non-switch trials in the mixed block (M = 1076 ms). A significant interaction between the two factors (t = 3.27) suggested that these mixing costs were larger for L1 (120 ms) compared to L2 (16 ms).
Electrophysiological results
Mixed block comparison
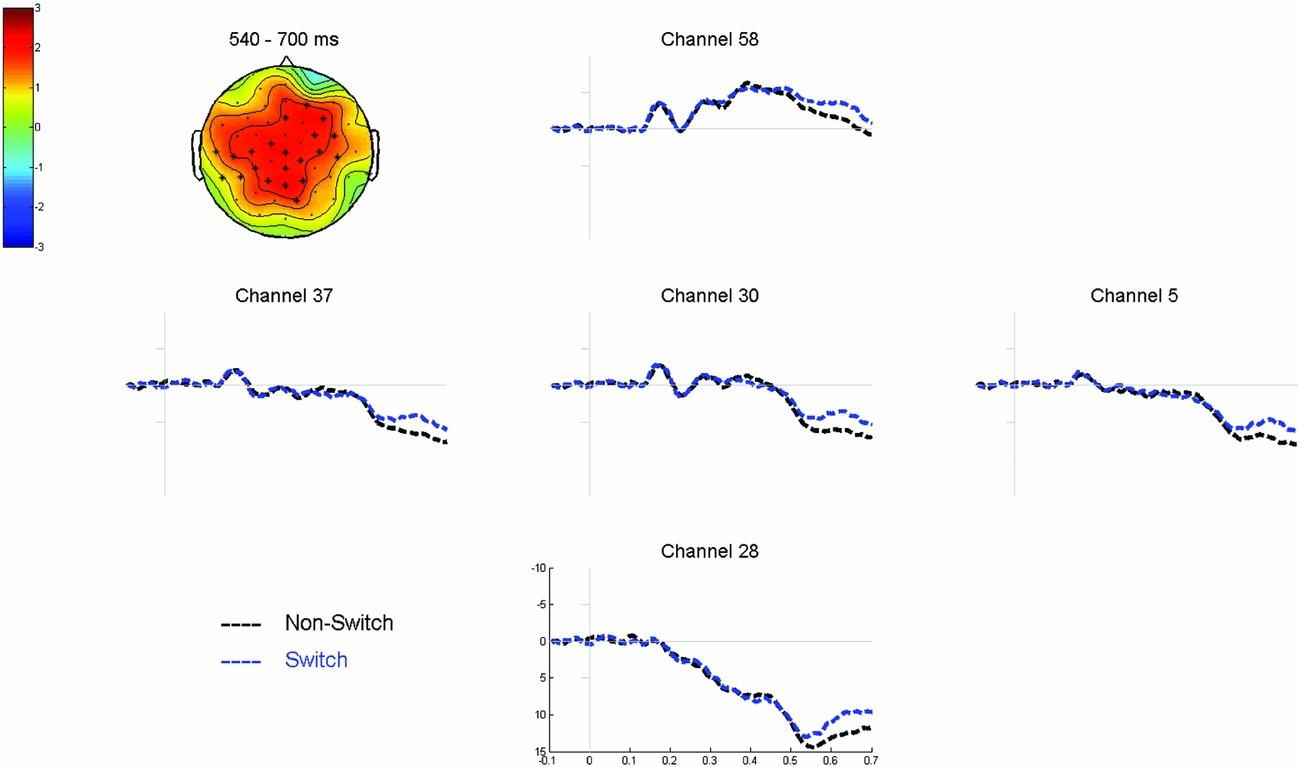
Cluster-based permutation tests over the full epoch (0–700 ms) did not reveal a significant interaction between NamingLanguage and TrialType (all p’s > .3). Therefore we collapsed the data for each independent variable and tested for main effects. Cluster-based permutation tests comparing the switch trials to the non-switch trials (collapsed over NamingLanguage) over the full epoch (0–700 ms) revealed a significant difference between the two conditions (p = .004). This difference was most pronounced between 540 ms and 700 ms after picture onset, relatively wide-spread over the scalp, and reflected a more negative wave for switch compared to non-switch trials (see Figure 5). Cluster-based permutation tests comparing L1-naming trials to L2-naming trials (collapsed over TrialType) did not reveal any significant differences (p’s > .045).
Grand average waveforms time-locked to picture onset comparing non-switch to switch trials in the mixed block. The topographic plot shows that the corresponding voltage difference between the two conditions was most pronounced between 540 and 700 ms after picture onset in the electrodes highlighted in the plot.
Blocked language comparison
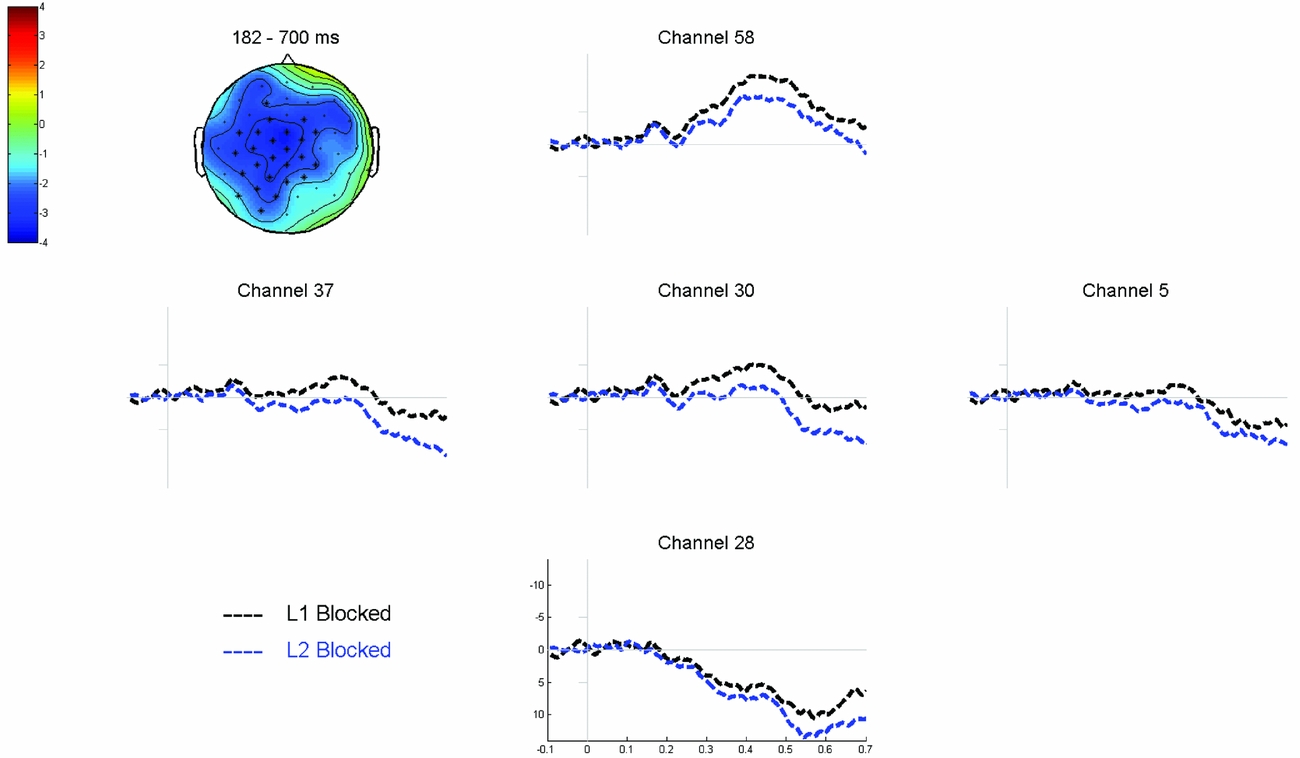
Cluster-based permutation tests comparing the two single language blocks over the full epoch (0–700 ms) revealed a significant difference (p = .002) between the two conditions. This difference, reflecting a more negative waveform for L1 blocked naming compared to L2 blocked naming, was most pronounced between 182 ms and 700 ms after stimulus onset and relatively wide-spread over the scalp (see Figure 6).
Grand average waveforms time-locked to picture onset comparing L1 blocked to L2 blocked trials. The topographic plot shows the corresponding voltage difference between the two conditions, which was most pronounced between 182 and 700 ms after picture onset in the electrodes highlighted in the plot.
Blocked versus mixed language context comparison
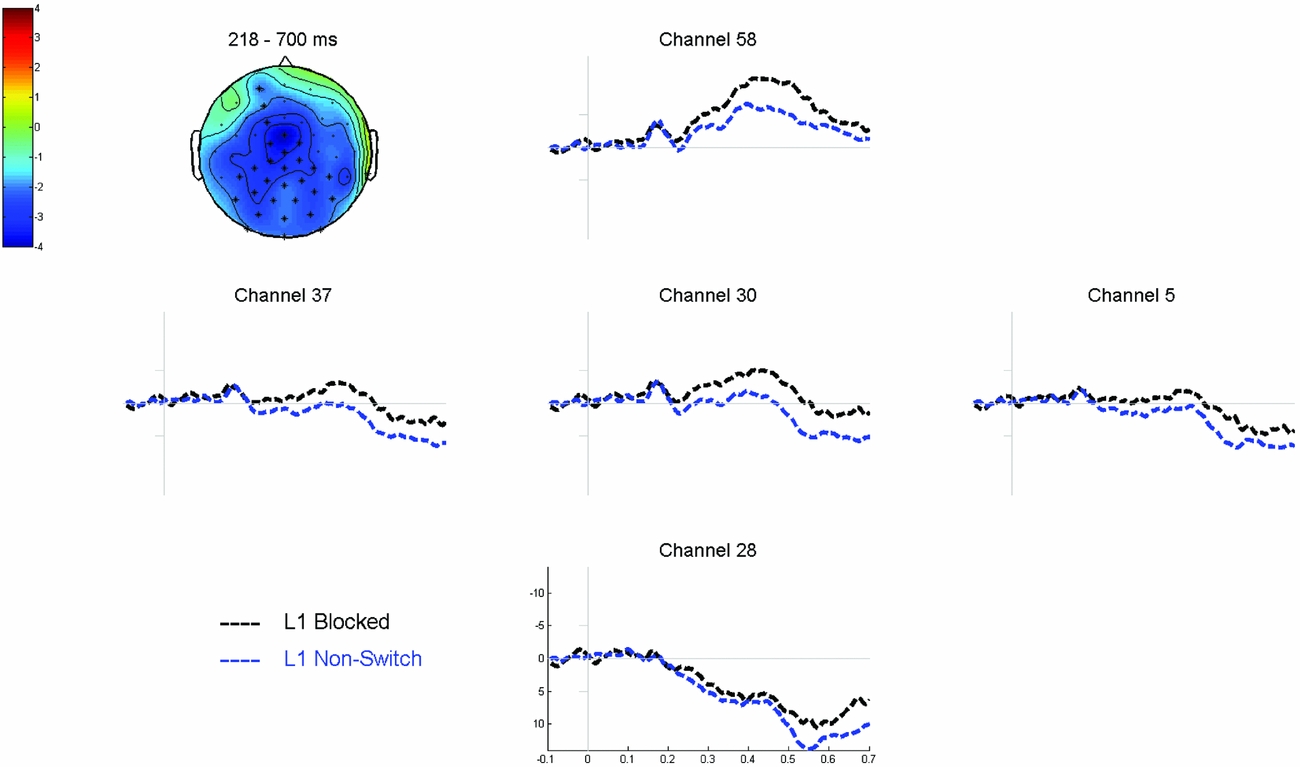
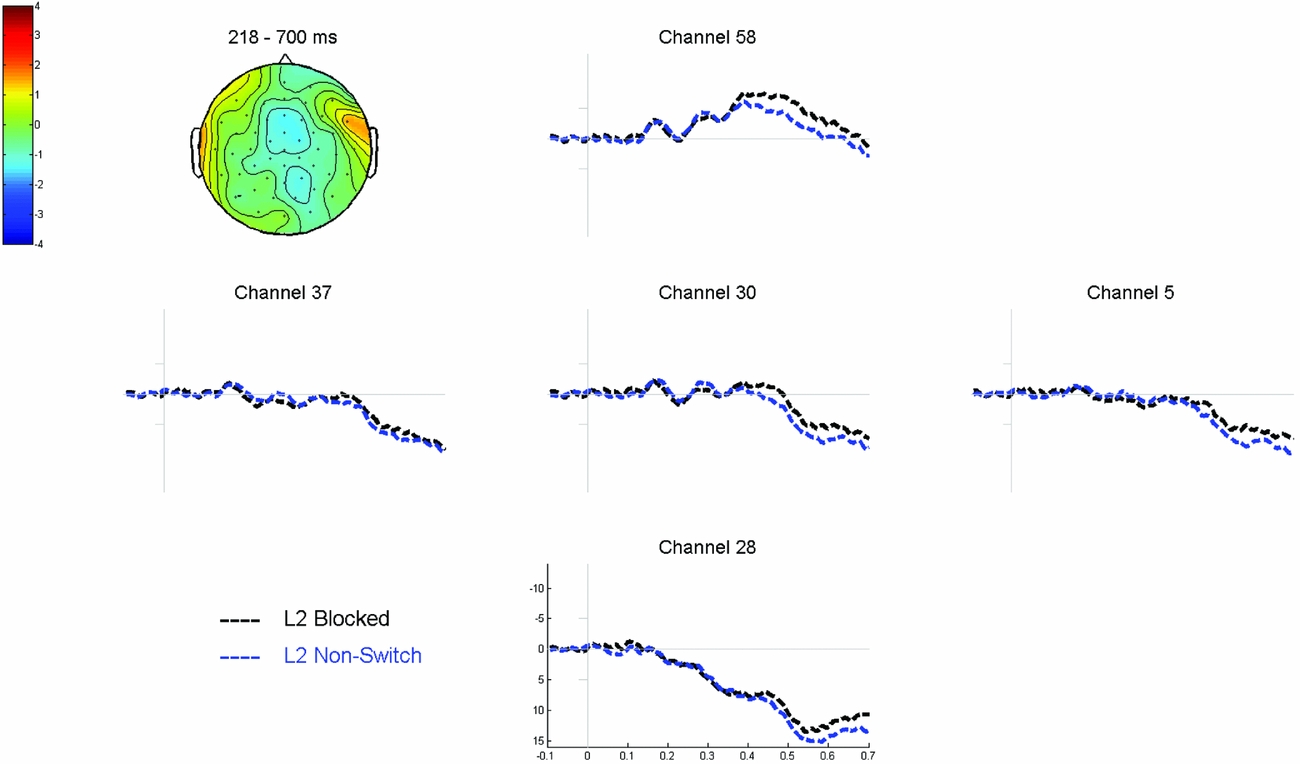
Cluster based permutation tests revealed a significant interaction (p = .008) between NamingLanguage (L1 vs. L2) and TrialType (blocked vs. non-switch), which was most pronounced between 184 and 476 ms after stimulus onset. Cluster-based permutation tests comparing the blocked L1 trials to the non-switch L1 trials revealed a significant difference between the two conditions (p = .001). This difference was most pronounced between 218 ms and 700 ms after picture onset, relatively wide-spread over the scalp with a centro-parietal maximum, and reflected a more negative wave for blocked L1 trials compared to non-switch L1 trials (see Figure 7). The same analysis for the L2 trials did not reveal any significant differences (all p’s > .05). Hence the interaction reflects that the effect of TrialType was larger for the L1 comparison (Figure 7) than for the L2 comparison (Figure 8), specifically between 218 and 476 ms after stimulus onset. No significant difference was found in the comparison of the L1 non-switch trials to the L2 non-switch trials.
Grand average waveforms time-locked to picture onset comparing L1 blocked to L1 non-switch trials. The topographic plot shows the corresponding voltage difference between the two conditions, which was most pronounced between 218 and 700 ms after picture onset in the electrodes highlighted in the plot.
Grand average waveforms time-locked to picture onset comparing L2 blocked to L2 non-switch trials. The topographic plot shows the corresponding voltage difference between the two conditions between 218 and 700 ms after picture onset, for comparison with Figure 7.
Discussion
Behaviorally, Experiment 4 confirmed the results from the earlier three Experiments in showing symmetrical switch costs, reversed language dominance in a mixed language context, and larger mixing costs for L1 compared to L2. The switch cost symmetry was confirmed by analysis of the ERP data in which a late effect of switching was found that was symmetrical across the two languages. The ERP comparison of non-switch to blocked naming trials confirmed the asymmetry in behavioral mixing costs by showing a sustained positive effect for L1 in the absence of an effect for L2. We will further discuss these findings in the General Discussion.
At a methodological level, Experiment 4 confirmed that the behavioral markers of sustained L1 inhibition are robust across three different implementations of the cued language-switching paradigm. Furthermore, the Experiment showed the feasibility of combining an immersive VR paradigm using a HMD with continuous EEG recordings.
Finally, the behavioral data from the 96 participants that took part in the four Experiments were combined into a single dataset to test i) whether the observed effects were indeed similar across the four Experiments, ii) whether the order in which blocks were presented influenced switch costs and mixing costs, and iii) whether symmetrical switch costs and asymmetrical mixing costs replicated in the error rate patterns.
Overall behavioral analyses across the four Experiments
Experiment
Linear mixed effects analyses were performed including Experiment as a four-level fixed factor. First, these analyses confirmed that the symmetrical switch costs, reversed language dominance, and asymmetrical mixing costs were also observed across this larger dataset (see Table 7). Second, it was found that the Experiment factor did not interact with any of the other fixed factors. This indicates that the reported effects were statistically similar across the four Experiments (Table 7).
Outcome of the linear mixed models performed on the data from the four Experiments together.
Order of blocks
Inspection of Figure 9 suggests that the symmetrical switch cost pattern was stable across the 6 different orders in which the 3 experimental blocks were presented (N = 16 per order). This was confirmed by linear mixed effects analyses that included Order as a fixed factor. No significant interaction between Order and the other fixed factors was observed (see Table 8).
No differences in switch cost patterns were found as a function of the order in which the three experimental blocks were presented. Error bars are standard errors of the mean.
Outcome of the linear mixed models including Order as a predictor.

A different pattern emerged for the mixing costs (see Figure 10). The analyses showed a significant interaction between NamingLanguage, TrialType, and Order (Table 8). Follow-up analyses on the 6 orders separately revealed significant interactions between NamingLanguage and TrialType for the 3 orders in which the L2-block preceded the mixed block, but no such interaction for the 3 orders in which the mixed block preceded the L2-block. Hence, as can be seen in Figure 10, participants had shorter RTs in L2 in the block that came later in the experiment, which reflects repetition priming for L2. For L1 there was no such repetition priming effect, as participants in all 6 orders were faster in the L1-block compared to the L1 non-switch trials (see Table 9).
Mixing costs as a function of the order in which the three experimental blocks were presented. Mixing costs were asymmetrical whenever the L2 block preceded the mixed block but symmetrical when the mixed block preceded the L2 block. Error bars are standard errors of the mean.
Follow-up analyses testing for mixing costs for the six different orders.
Error rate analyses
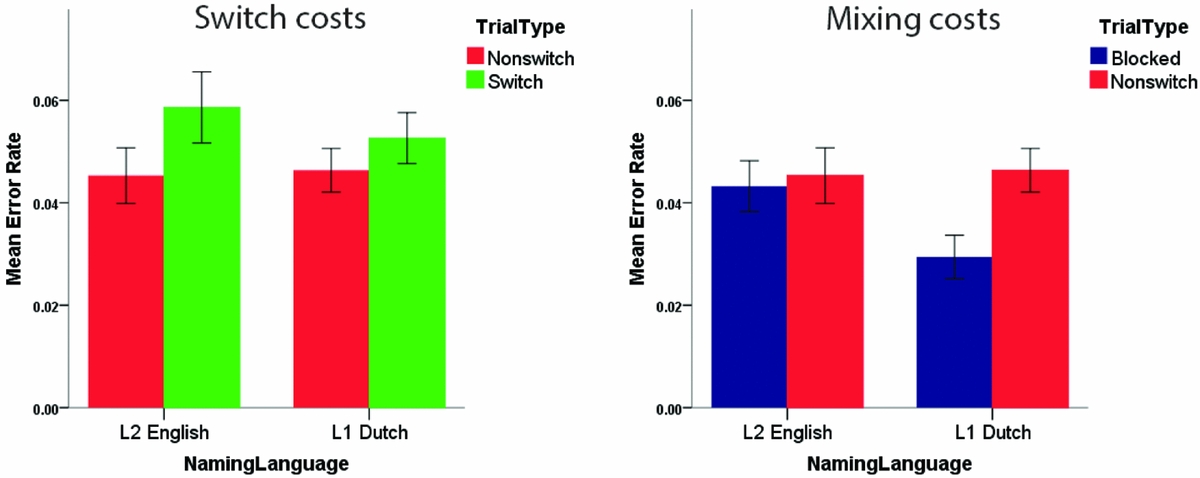
A repeated measures ANOVA on the error rate data with factors TrialType, NamingLanguage, and Experiment revealed a significant main effect of TrialType, F (1,92) = 10.66, p = .002. This effect reflected that across the four Experiments, switch trials (M = .056) yielded more errors than non-switch trials (M = .046). No other significant main or interaction effects were observed in this analysis (all p's > .19). A similar analysis testing for mixing costs observed a significant interaction effect between TrialType and NamingLanguage, F (1,92) = 4.45, p = .038. No three-way interaction between these two factors and Experiment was observed (p = .573). Follow-up analyses revealed a significant main effect of TrialType for L1 Dutch (p = .003), but no such effect for L2 English (p = .625). Thus, similar to the RT results, the error rate analyses showed symmetrical switch costs and asymmetrical mixing costs (i.e., significant mixing costs for L1 Dutch, but not for L2 English – see Figure 11).
Error rate analyses revealed symmetrical switch costs and asymmetrical mixing costs. Error bars are standard errors of the mean.
General Discussion
Four bilingual language production experiments were carried out to i) advance our understanding of potential transient and sustained inhibitory mechanisms involved in language switching in bilingual language production, and ii) test whether findings obtained in the traditional cued language-switching paradigm generalize to a setting that resembles bilingual language switching between addressees with different language backgrounds in everyday life a bit better than traditional cued language-switching paradigms.
At the behavioral level, we consistently observed symmetrical switch costs, reversed language dominance in a mixed language context, and asymmetrical mixing costs. These findings are not in line with theoretical accounts that predict a switch cost asymmetry in unbalanced bilinguals in the cued-language switching paradigm (e.g., Costa & Santesteban, Reference Costa and Santesteban2004; Finkbeiner et al., Reference Finkbeiner, Almeida, Janssen and Caramazza2006; Green, Reference Green1998; Meuter & Allport, Reference Meuter and Allport1999). As such, the current data provide no evidence for the use of a transient inhibitory mechanism that suppresses lexical representations from the non-target language reactively to allow for speaking in the intended language as a function of the proficiency difference between an unbalanced bilingual's two languages. At the neural level, such a transient, reactive inhibitory mechanism has been linked to asymmetrical modulations in the N2 component of the ERP (Jackson et al., Reference Jackson, Swainson, Cunnington and Jackson2001; Verhoef et al., Reference Verhoef, Roelofs and Chwilla2009). The current study did not observe such a modulation of the N2 component. Conversely, the symmetry in behavioral switch costs was further confirmed by a neurophysiological marker of language switching that was symmetrical across the two languages. This centro-parietal positivity for nonswitch versus switch trials is similar to the target-locked centro-parietal positivity in task switching studies more broadly (see Karayanidis & Jamadar, Reference Karayanidis, Jamadar, Grange and Houghton2014). Its relatively late onset in the current study is consistent with the fact that we did not include a preparation interval between cue and target. The critical finding here is that this centro-parietal electrophysiological switch cost was not modulated by the direction of the language switch, i.e., it was symmetrical.
The present findings indicate that our bilingual participants rather applied sustained inhibition to their dominant, native language in contexts in which both their languages were used for production. This led to reversed language dominance (i.e., pictures were named faster in L2 than in L1 in a mixed context) and to a disproportionally large cost of language mixing for the L1 compared to the L2 (i.e., asymmetrical mixing costs were observed). The behavioral mixing cost pattern was confirmed by a sustained positive effect for L1 (mixed versus blocked) in the absence of such an effect for L2 (mixed versus blocked) in the ERPs. This mixing-positivity is commonly observed in studies of task switching that compare mixed to blocked conditions outside of the language domain (see Karayanidis & Jamadar, Reference Karayanidis, Jamadar, Grange and Houghton2014). The critical finding in the present study is the asymmetry of the language mixing effect. The positivity arguably reflects higher processing costs for L1 in the mixed compared to the blocked context, as a consequence of the sustained inhibition applied to the dominant L1 in the mixed context to allow for more efficient L2 naming (cf. Christoffels et al., Reference Christoffels, Firk and Schiller2007). Although beyond the scope of the current study, the overlap in critical ERP effects of language switching/mixing and task switching/mixing in general (Karayanidis & Jamadar, Reference Karayanidis, Jamadar, Grange and Houghton2014) suggests the involvement of more general executive control mechanisms in both our language task and non-linguistic switching/mixing tasks (see also Abutalebi & Green, Reference Abutalebi and Green2008; De Bruin, Roelofs, Dijkstra & FitzPatrick, Reference De Bruin, Roelofs, Dijkstra and FitzPatrick2014; Luk, Green, Abutalebi & Grady, Reference Luk, Green, Abutalebi and Grady2012; Ma et al., Reference Ma, Li and Guo2016).
The asymmetry in behavioral mixing costs was driven by the increased naming RTs in L1 naming in the mixed block, not by shorter naming RTs in the pure L1-block compared to the pure L2-block. Intuitively it is surprising that no differences in naming RTs were observed when comparing blocked naming in L1 to blocked naming in L2, because our participants were unbalanced bilinguals for which one might expect shorter naming RTs for L1 compared to L2 in blocked contexts. We note, however, that participants were familiarized with all pictures and their corresponding names in L1 and L2 prior to the experiments, such that the experiment as a whole may be considered to take place in a mixed language setting. Although no RT differences between the two pure language blocks were observed, the sustained positivity in the ERPs nevertheless suggests higher processing costs for L2 compared to L1 in pure language contexts to achieve this balanced behavioral pattern (cf. Christoffels et al., Reference Christoffels, Firk and Schiller2007).
Reversed language dominance and asymmetrical mixing costs are common markers of sustained L1 inhibition (e.g., Baus et al., Reference Baus, Branzi, Costa and Schwieter2015; Bobb & Wodniecka, Reference Bobb and Wodniecka2013; Christoffels et al., Reference Christoffels, Firk and Schiller2007). Recent work suggests that also an effect of the order in which experimental blocks are presented can be taken as an indicator of sustained inhibition (Misra et al., Reference Misra, Guo, Bobb and Kroll2012). Combining data from the large number of participants that took part in our four Experiments allowed us to carry out an additional analysis into the effect of the order of blocks on naming RTs. We observed consistent repetition priming for the L2, in that participants named pictures in L2 faster in the block (blocked L2 or mixed) that came later in the experiment. For L1, however, participants were always slower in the mixed block compared to the L1 blocked condition. In line with the other behavioral findings, this indicates that possible repetition priming for the dominant L1 was cancelled out by sustained inhibition applied to the L1 in a mixed context.
Early experimental studies investigating bilingual language production suggested different control mechanisms in unbalanced versus balanced bilinguals. Whereas asymmetrical switch costs in unbalanced bilinguals were interpreted in line with transient inhibitory mechanisms (e.g., Meuter & Allport, Reference Meuter and Allport1999), symmetrical switch costs in highly proficient, balanced bilinguals would indicate the absence of such a reactive, transient mechanism when bilinguals master two languages to a similar extent (Costa & Santesteban, Reference Costa and Santesteban2004). It is problematic for this proposed distinction between balanced and unbalanced bilinguals that the switch costs asymmetry in unbalanced bilinguals is not always replicated (e.g., Christoffels et al., Reference Christoffels, Firk and Schiller2007; Declerck et al., Reference Declerck, Koch and Philipp2012; Gollan & Ferreira, Reference Gollan and Ferreira2009; Slevc et al., Reference Slevc, Davey and Linck2016). The current study confirms that the switch cost symmetry is not restricted to balanced bilinguals, by consistently showing, across different instantiations of the cued language-switching paradigm, a symmetrical switch cost pattern in clearly unbalanced bilinguals. Compared to participants in studies observing a switch costs asymmetry in unbalanced bilinguals, our Dutch–English bilinguals had a relatively high proficiency in their L2. An important part of their student life involves the use of L2 English as they take classes at university in English and they read books and articles in English in an environment in which they speak L1 Dutch with their friends and relatives. Common daily experience in switching languages, in addition to a high overall L2 proficiency, may have trained our participants to apply sustained inhibition to their native language in mixed settings to facilitate language production in their L2 (cf. Christoffels et al., Reference Christoffels, Firk and Schiller2007).
The observation of symmetrical switch costs in the present study is also in line with recent work finding that switch costs are more asymmetrical at a short response-cue interval (RCI) than at longer RCIs (Ma et al., Reference Ma, Li and Guo2016). The RCI in the current experiments was on purpose fairly long, in order for the virtual agents in Experiments 3 and 4 to move their heads back to the starting position in a natural way. This leaves time for any potential reactive inhibition to dissipate (Ma et al., Reference Ma, Li and Guo2016). We note that in terms of ecological validity, a somewhat longer RCI may resemble the switching between different interlocutors better than a short RCI, as switching from one addressee to another usually takes some time.
Although the current study did not find evidence in favor of a transient, trial-by-trial inhibitory mechanism that was sensitive to the difference in proficiency between the two languages of our unbalanced bilinguals, this does not necessarily imply that bilinguals do not apply such a mechanism in specific contexts. The mere presence of switch costs has been taken as evidence in favor of some form of transient language control (Declerck & Philipp, Reference Declerck and Philipp2015b; Ma et al., Reference Ma, Li and Guo2016; Koch et al., Reference Koch, Gade, Schuch and Philipp2010). Moreover, a previous study reported effects on a marker of transient inhibition (i.e., asymmetrical switch costs) and effects on a marker of sustained L1 inhibition (i.e., reversed language dominance) in a sample of French–English unbalanced bilinguals in the same experiment (Peeters et al., Reference Peeters, Runnqvist, Bertrand and Grainger2014). This suggests a dynamic interplay between reactive and proactive language control in unbalanced bilinguals (Ma et al., Reference Ma, Li and Guo2016). Language membership information arguably plays an important role in allowing for (mild) inhibition of a language, whether transient or sustained, at a global level (see Hoversten, Brothers, Swaab & Traxler, Reference Hoversten, Brothers, Swaab and Traxler2015). If we assume that both transient and sustained inhibitory mechanisms function via language membership information (Grainger, Midgley & Holcomb, Reference Grainger, Midgley, Holcomb, Kail and Hickmann2010; Peeters et al., Reference Peeters, Runnqvist, Bertrand and Grainger2014), it is possible that one mechanism is applied so strongly that it dominates the other. In the current study, relatively strong proactive, sustained inhibition of the dominant language may have taken away contextual needs and available processing resources for trial-by-trial, reactive inhibition of the L1 to occur. Future studies are needed to further reveal which factors influence the balance between transient and sustained inhibitory control processes.
The current study also tested the ecological validity of the traditional paradigm used to experimentally study bilingual language switching (cued language-switching), as this has been a matter of ongoing debate in recent years (e.g., Finkbeiner et al., Reference Finkbeiner, Almeida, Janssen and Caramazza2006; Gollan & Ferreira, Reference Gollan and Ferreira2009; Gollan et al., Reference Gollan, Kleinman and Wierenga2014; Kleinman & Gollan, Reference Kleinman and Gollan2016; Myers-Scotton, Reference Myers-Scotton2006; Peeters et al., Reference Peeters, Runnqvist, Bertrand and Grainger2014). Naming pictures that appear on a computer screen obviously does not resemble the language switches that bilinguals make in everyday life. Unbalanced bilinguals may switch languages in a conversation with a bilingual interlocutor for several reasons. Lexical access problems (e.g., tip-of-the-tongue states) in a given language may be tackled by producing the word in the other language. Some culture-specific concepts may be expressed more adequately in one specific language, thereby leading to a language switch. Moreover a shift of topic may induce a language switch, as when one is used to talking about a particular topic in a given language. It is this type of language switches in everyday life that the work on voluntary language switching (e.g., Gollan & Ferreira, Reference Gollan and Ferreira2009) may best generalize to.
The current study, in contrast, focused on situations where bilinguals switch as a function of an external cue, as when one switches languages in everyday life when talking to one monolingual in language A before encountering another monolingual that one talks to in language B. We turned to immersive VR technology to enhance the communicative and intentional value of bilingual language production that is common in such situations while maintaining full experimental control. The fact that we observed a similar pattern of results across different paradigms that had different degrees of resemblance to everyday situations confirms the ecological validity of the cued language-switching paradigm (cf. Peeters et al., Reference Peeters, Runnqvist, Bertrand and Grainger2014). Instead of using pictures in a virtual environment, future studies may increase the naturalness of the bilingual interaction by having the participant refer to standardized 3D-objects (Peeters, in press) in interaction with virtual addressees in rich and communicative scenarios.
Surprisingly, the use of immersive VR in the language sciences has remained virtually non-existent, but the first results are promising. The small number of initial behavioral psycholinguistic studies using VR found that people communicate with virtual agents similarly to how they communicate with human agents (Gijssels et al., Reference Gijssels, Staum Casasanto, Jasmin, Hagoort and Casasanto2016; Heyselaar et al., Reference Heyselaar, Hagoort and Segaert2017; Staum Casasanto et al., Reference Staum Casasanto, Jasmin, Casasanto, Ohlsson and Catrambone2010). The current study confirms that VR technology can be used in a fruitful fashion to test established findings in more naturalistic settings. Additional evidence that similar cognitive and neural mechanisms underlie communication with human versus virtual interlocutors comes from a recent EEG study. When virtual agents in a rich visual environment referred to an object using an incorrect label in speech, a robust and wide-spread N400 effect was found compared to a condition in which they correctly referred to the object (Tromp, Peeters, Meyer & Hagoort, Reference Tromp, Peeters, Meyer and Hagoort2017). This effect was very similar to the N400 effect induced by similar mismatches in traditional non-virtual, 2D approaches using speech and static pictures of a human agent referring to an object (Peeters, Hagoort & Özyürek, Reference Peeters, Hagoort and Özyürek2015). Thus, both behavioral and neurophysiological initial findings indicate that VR may be considered a valid and key method in leading to future theoretical advances in cognitive science as a whole and psycholinguistics more specifically.
In sum, at a theoretical level we observed behavioral and neurophysiological support for the claim that unbalanced bilinguals apply sustained inhibition to their native language in a mixed language context. At a methodological level, we tested and validated a novel language-switching paradigm that replicated results observed using the traditional paradigm. These findings pave the way for the study of bilingual language control in richer, interactive settings in which ecological validity and experimental control go hand in hand.
Appendix A: Picture names used in the four Experiments
L1 picture names. aardappel, aardbei, aubergine, been, berg, bijl, boom, broek, busje, duif, eend, fabriek, geweer, golven, gum, handschoen, kerk, ketting, kip, liniaal, mier, neushoorn, oog, paard, perzik, petje, pijl, pop, potlood, rokje, schep, slang, spijker, stoel, vlieg, vliegtuig, vlinder, vuurtoren, wolk, wortel.
L2 picture names. ant, arrow, axe, butterfly, cap, carrot, chair, chicken, church, cloud, doll, duck, eggplant, eraser, eye, factory, fly, glove, gun, horse, leg, lighthouse, mountain, nail, necklace, peach, pencil, pigeon, plane, potato, rhino, ruler, shovel, skirt, snake, strawberry, tree, trousers, van, waves.


