


Introduction
The Pacific plate moves relative to the North American plate at ∼52 mm/yr along the San Andreas Fault (SAF) (Minster and Jordan, Reference Minster and Jordan1978; Argus et al., Reference Argus, Gordon, Heflin, Ma, Eanes, Willis, Peltier and Owen2010). Geological and geodetic estimates indicate that ∼35–40 mm/yr of this slip is accommodated on the San Jacinto and San Andreas fault zones, with the remainder distributed across secondary faults within the hinterland of the North American plate (Sieh and Jahns, Reference Sieh and Jahns1984; Weldon and Sieh, Reference Weldon and Sieh1985; Bennett et al., Reference Bennett, Rodi and Reilinger1996, Reference Bennett, Friedrich and Furlong2004; Guns et al., Reference Guns, Bennett, Spinier and McGill2020). Until ∼1.5–1.2 Ma, the SAF accommodated the majority of the slip in Southern California; however, development of the restraining bend created a structural barrier that inhibited uninterrupted slip through the San Gorgonio Pass (SGP) (Matti and Morton, Reference Matti, Morton, Powell, Weldon and Matti1993). The San Jacinto Fault (SJF) began to evolve during this period, providing an alternative route to bypass this “structural knot” on the SAF (Matti and Morton, Reference Matti, Morton, Powell, Weldon and Matti1993; Bennett et al., Reference Bennett, Friedrich and Furlong2004; Heermance and Yule, Reference Heermance and Yule2017). The SJF has since accommodated ∼12–15 mm/yr of slip for at least ∼700 ka, with the majority of the remaining slip accommodated by the SAF (Blisniuk et al., Reference Blisniuk, Oskin, Mériaux, Rockwell, Finkel and Ryerson2013).
The SAF in Southern California has a complex tectonic framework with spatially variable slip distributed across several faults. In the southeast of Indio (Fig. 1), the SAF appears as a single strand. To the northwest, in the Indio Hills, it splays into multiple strands (Koehl et al., Reference Koehl, Bergh and Sylvester2022). This pattern continues in the northwestern Coachella Valley, where the multistranded SAF bends northwestward toward the SGP (Fig. 1). The resulting structural complexity partitions slip across multiple dextral strands and produces a marked reduction in observed slip rates within the SGP (Gold et al., Reference Gold, Behr, Rood, Sharp, Rockwell, Kendrick and Salin2015; Heermance and Yule, Reference Heermance and Yule2017; Beyer et al., Reference Beyer, Cooke and Marshall2018). Studies show that the SGP functions as an “earthquake gate,” modulating the propagation of dextral slip during large earthquake events on the southern SAF (Sieh et al., Reference Sieh, Stuiver and Brillinger1989; Scharer and Yule, Reference Scharer and Yule2020). Evaluating how slip is accommodated in future rupture scenarios and the role of individual strands requires a detailed reconstruction of their Late Pleistocene–Holocene activity.
Hillshade map of the southern San Andreas Fault system depicting the major fault strands. The inset illustrates relative motion between the Pacific and North American plates. This motion is accommodated on the San Andreas Fault (SAF), San Jacinto Fault, and Elsinore Fault, which together form the principal plate boundary fault system at this latitude. The restraining bend on the SAF produces a multistranded tectonic architecture. Slip through this region is partitioned between the northern (green) and southern (yellow) strands; this two-strand nomenclature follows Beyer et al. (Reference Beyer, Cooke and Marshall2018) and reflects a geographic grouping with respect to the San Gorgonio Pass rather than neotectonic slip histories. The study area is located near the base of southeastern San Bernardino Mountains, where Mission Creek exits its bedrock canyon, and is outlined by a red box.

Slip through the SGP region
The SAF zone in the SGP region is partitioned into multiple dextral strands that cumulatively have contributed to the late Cenozoic SAF slip history (Matti and Morton, Reference Matti, Morton, Powell, Weldon and Matti1993; Kendrick et al., Reference Kendrick, Matti and Mahan2015). For simplicity, we group these multiple faults into northern and southern sets (Fig. 1; also see Beyer et al., Reference Beyer, Cooke and Marshall2018). The northern set includes the Mission Creek, Mill Creek, and Galena Peak faults, and the southern set includes the San Bernardino SAF, Banning, Garnet Hill, and the SGP thrust system. This categorization represents a geographic grouping with respect to the SGP; it does not represent the neotectonic slip histories of individual strands. This region is critical, because it remains uncertain whether throughgoing ruptures can traverse it and, if so, which strands—northern, southern, or both—might host them (Yule et al., Reference Yule, Matti, Kendrick and Heermance2021).
As evidence of recent tectonic inactivity on the northern strands, researchers cite the general absence of youthful tectonic geomorphic features in Late Quaternary–Holocene deposits overlying these strands. This pattern is observed at Raywood Flat, the base of the Little San Bernardino Mountains, and at the mouth of the Mission Creek drainage where its exits the bedrock canyon in the southeastern San Bernardino Mountains (Allen, Reference Allen1957; Matti and Morton, Reference Matti, Morton, Powell, Weldon and Matti1993; Yule and Sieh, Reference Yule and Sieh2003; Treiman et al., Reference Treiman, Real, Wilson, Silva, Pridmore, McCrink, Loyd, Reichle and Jones2008; Kendrick et al., Reference Kendrick, Matti and Mahan2015, Reference Kendrick, Matti and Barth2022; Yule et al., Reference Yule, Matti, Kendrick and Heermance2021; Figs. 1 and 2). By contrast, alluvium and fan deposits overlying the southern strands exhibit clear surface expressions of youthful tectonic offsets, suggesting recent slip on these strands (e.g., Kendrick et al., Reference Kendrick, Matti and Mahan2015; Heermance and Yule, Reference Heermance and Yule2017; Heermance et al., Reference Heermance, Matti and Kendrick2023). Several studies have quantified slip rates on the southern fault strands: for example, along the Banning strand, Gold et al. (Reference Gold, Behr, Rood, Sharp, Rockwell, Kendrick and Salin2015) estimated a slip rate of ∼4–5 mm/yr. At Indio Hills, Blisniuk et al. (Reference Blisniuk, Scharer, Sharp, Burgmann, Amos and Rymer2021) estimated slightly lower rates of 1.5–3.5 mm/yr. In the San Gorgonio Pass fault zone, Heermance and Yule (Reference Heermance and Yule2017) reported a rate of ∼6 mm/yr. Considering a slip rate of 14–17 mm/yr on the singular strand of the SAF at Biskra Palms (Behr et al., Reference Behr, Rood, Fletcher, Guzman, Finkel, Hanks and Hudnut2010; Fig. 1), the Banning strand at this site accounts for ∼25–35% of the total slip on the southern SAF, and the San Gorgonio Pass fault zone accounts for ∼27%. If the northern strands contribute no slip, and the southern strands have <∼5 mm/yr of slip, a critical question arises: where is the remaining slip accommodated?
Recent studies along the Mission Creek fault strand (MCF) show evidence for continued activity during the Late Pleistocene and Holocene (Fosdick and Blisniuk, Reference Fosdick and Blisniuk2018; Balco et al., Reference Balco, Blisniuk and Hidy2019; Blisniuk et al., Reference Blisniuk, Scharer, Sharp, Burgmann, Amos and Rymer2021; Waco, Reference Waco2021). Southeast of Indio, at Pushawalla (Fig. 1), the MCF has accommodated ∼20 mm/yr of slip since the Late Pleistocene (Blisniuk et al., Reference Blisniuk, Scharer, Sharp, Burgmann, Amos and Rymer2021); however, its activity northwest of Indio remains debated. Several studies suggest slip rerouting into the SGP, Eastern California Shear Zone, and SJF (Cooke and Dair, Reference Cooke and Dair2011; Gold et al., Reference Gold, Behr, Rood, Sharp, Rockwell, Kendrick and Salin2015; Heermance and Yule, Reference Heermance and Yule2017), with the remaining slip accommodated as off-fault deformation in the San Gorgonio Pass Stepover and San Jacinto Mountains (McGill et al., Reference McGill, Owen, Weldon and Kendrick2013; Herbert et al., Reference Herbert, Cooke and Marshall2014; Beyer et al., Reference Beyer, Cooke and Marshall2018; Guns et al., Reference Guns, Bennett, Spinier and McGill2020) (Fig. 1). The MCF is critical to predicting possible fault rupture scenarios, because interpretations differ regarding its role in Holocene and modern earthquake propagation. For example, some investigators interpret the MCF as “inactive” (Matti and Morton, Reference Matti, Morton, Powell, Weldon and Matti1993; Kendrick et al., Reference Kendrick, Matti and Mahan2015, Reference Kendrick, Matti and Barth2022; Yule et al., Reference Yule, Matti, Kendrick and Heermance2021; Matti et al., Reference Matti, Kendrick and Powell2023), and the SAF ShakeOut Earthquake Scenario proposal for Southern California (Jones et al., Reference Jones, Bernknopf, Cox, Goltz, Hudnut, Mileti and Perry2008; Perry et al., Reference Perry, Cox, Jones, Bernknopf, Goltz, Hudnut and Mileti2008; Treiman et al., Reference Treiman, Real, Wilson, Silva, Pridmore, McCrink, Loyd, Reichle and Jones2008) avoids rupture on the MCF, citing absence of youthful tectonic geomorphic signatures, and views the Banning and Garnet Hill strands of the SAF as likely candidates for future earthquake ruptures.
Northwest of Desert Hot Springs, where the Mission Creek drainage exits its bedrock canyon in the southeastern San Bernardino Mountains (hereafter referred to as “Mission Creek valley”) (Figs. 1 and 2), the MCF is concealed beneath alluvium deposits. Whether it hosted slip here during the Late Pleistocene or Holocene is debated. Yule et al. (Reference Yule, Matti, Kendrick and Heermance2021) argued for an inactive MCF at this site, citing the absence of youthful tectonic geomorphic features in the overlying alluvium deposits. They inferred depositional age of >18–3 ka for alluvium in the Mission Creek valley (see fig.4 in Yule et al., Reference Yule, Matti, Kendrick and Heermance2021; Fig. 2), based on the Early Holocene 10Be surface exposure ages for coeval terraces located 4 km downstream (Owen et al., Reference Owen, Clemmens, Finkel and Gray2014). However, these alluvial deposits were not directly dated by geochronological methods in Yule et al. (Reference Yule, Matti, Kendrick and Heermance2021). If the ages proposed by Yule et al. (Reference Yule, Matti, Kendrick and Heermance2021) are accurate, this would be evidence for an inactive MCF at this site for at least the age of these valley deposits, which are unfaulted. To the west of the Mission Creek, Fosdick and Blisniuk (Reference Fosdick and Blisniuk2018) identified two channels incised into the San Gorgonio Overlook fan complex (Fig. 2B) that are displaced right laterally along the MCF. Previous studies attributed these offset streams to dextral slip on the MCF >100 ka ago (Kendrick et al., Reference Kendrick, Matti and Mahan2015; Matti et al., Reference Matti, Kendrick, Yule and Heermance2019; Yule et al., Reference Yule, Matti, Kendrick and Heermance2019). However, the alluvium adjacent to these channels was not directly dated, and the ∼100 ka age was inferred based on Late Pleistocene slip history of the Mill Creek and Pinto Mountain fault (Kendrick et al., Reference Kendrick, Matti and Mahan2015; Fig. 1).
(A) Geologic map of the study area (Waco, Reference Waco2021) showing geologic and geomorphic units and faults. The red rectangle indicates the boundary of the study area. (B) Enlargement of A showing the locations of samples collected in this and previous investigations. Two red rectangles demarcate the sampling sites, which include: (1) alluvium from the Mission Creek valley, including deposits adjacent to the active channel and a perched alluvial deposit ∼600 m to the west (Figure 3), and (2) alluvium from the offset channel site (Figure 4). Sample location sources: Owen et al., Reference Owen, Clemmens, Finkel and Gray2014; Kendrick et al., Reference Kendrick, Matti and Mahan2015; Fosdick and Blisniuk, Reference Fosdick and Blisniuk2018; Ataee, Reference Ataee2019; Balco et al., Reference Balco, Blisniuk and Hidy2019.

In this study, we determine depositional ages for alluvium deposits at these two sites using single-grain post-infrared infrared (pIRIR)-stimulated luminescence dating of K-feldspars to provide a temporal constraint on the conflicting observations of Yule et al. (Reference Yule, Matti, Kendrick and Heermance2021) and Fosdick and Blisniuk (Reference Fosdick and Blisniuk2018). First, we estimate the depositional ages of apparently unfaulted alluvium within the Mission Creek valley (Figs. 2B and 3A). Because these sediments have remained unruptured since deposition, their oldest age should represent the minimum time elapsed since the last surface-rupturing earthquake was hosted on the MCF at this site. Second, we estimate the burial ages of alluvium adjacent to the offset channels in the west of the Mission Creek, to help constrain the time since they started accumulating offset and, consequently, the slip rate along the MCF during the Late Pleistocene–Holocene. Finally, we discuss these new depositional ages and their implications for seismic hazard in Southern California.
Geologic setting
We describe the geologic setting of the study site following the nomenclature of Waco (Reference Waco2021). The Mission Creek exits the San Bernardino Mountains and drains southeastward toward the Salton Trough. Northwest of Desert Hot Springs and between the Little San Bernardino and San Bernardino Mountains (Fig. 1), the MCF transitions to a left restraining bend geometry, causing it to split into three fault splays (northern, middle, and southern MCF) that traverse the Mission Creek drainage (Fosdick and Blisniuk, Reference Fosdick and Blisniuk2018; Waco, Reference Waco2021; Fig. 3A). The MCF remains largely concealed beneath the alluvium but can be traced on either side of the Mission Creek valley in bedrock exposures, where fault gouge and brecciated material are observed (Fig. 3A). The Mission Creek drainage hosts multiple generations of alluvial fan complexes that overlie the basement metamorphic rock complex. These fan deposits were sourced from Mission Creek as well as multiple small drainages exiting the little San Bernardino Mountains in the southeast (Fosdick and Blisniuk, Reference Fosdick and Blisniuk2018). The drainage then dissected these deposits, and repeated cycles of aggradation and incision during Early Pleistocene–Holocene produced multiple generations of abandoned fan surfaces (Owen et al., Reference Owen, Clemmens, Finkel and Gray2014; Waco, Reference Waco2021).
Major geologic units in the Mission Creek drainage include the Cretaceous San Gorgonio igneous–metamorphic complex (SGg), the Miocene Coachella fanglomerate formation (Mcl), Middle to Early Pleistocene deformed gravels of Whitewater (Qd), and Middle Pleistocene–Holocene Cabezon fanglomerate deposits (Qc) that overlie Qd (Fig. 2A and B). Multiple cycles of aggradation and incision have produced four generations of Middle Pleistocene–Holocene terraces: from oldest to youngest—Q1, Q2, Q3 and Q4; and their alphabetic subdivisions (from oldest to youngest)—Q4a, Q4b, and so on (Fig. 2A). Additionally, two generations of Late Pleistocene terraces—Qt1 and Qt2—are positioned adjacent to the dry tributary (Fig. 2A). In the following subsections, we describe the geologic and geomorphic context for each of our sampling sites in more detail.
Mission Creek valley
Alluvial deposits sourced from the Mission Creek
Terrace Q4b is observed on the eastern and western banks of the Mission Creek. It stands ∼2 m above the active channel (Fig. 3A). Within the Mission Creek channel belt, we observe modern alluvium “Qal” that is actively reworked by the Mission Creek. The three MCF splays traversing the Mission Creek valley are concealed beneath the alluvium, which lacks evidence for recent earthquake rupture.
(A) Depositional ages of geologic units sampled in the Mission Creek Valley, including a perched alluvial deposit (UTA0088) located ∼600 m west of the Mission Creek at ∼900 m elevation. This ∼13-m-tall alluvial deposit, inset into unit Qc (Cabezon fanglomerate), yields a depositional age of 28.4 ± 2.7 ka, consistent with the mean abandonment age of Q1b (26 ± 10 ka) reported by Owen et al. (Reference Owen, Clemmens, Finkel and Gray2014) (see Figure 2B). The camera icon with diverging line segments indicates the panorama field of view across the southeastward extending San Gorgonio Overlook fan in B. The black rectangle outlines the ∼13-m-tall deposit sampled at station UTA0088. (C) Close-up of the perched alluvial deposit during sampling. Middle Pleistocene–Holocene terraces from oldest to youngest: Q1, Q2, Q3 and Q4; and their alphabetic subdivisions (from oldest to youngest): Q4a, Q4b, etc.

Alluvial deposits sourced from locally derived debris fans
Flanking the Mission Creek channel are Late Pleistocene–Holocene debris fan deposits (Qdf) derived locally from hillslopes (Fig. 3A). These descend into the trunk channel and locally mask sections of terrace Q4b. Qdf deposits lack a soil profile and appear youthful. We also observe scattered Q4a deposits along a small tributary on the western bank of the Mission Creek (Fig. 3A). Q4a stands ∼10 m above the Mission Creek and is morphostratigraphically older than Q4b. It likely formed through repeated aggradation and incision as the tributary migrated southward across the debris fan surface. We find no evidence of recent fault rupture in alluvial fills exposed adjacent to the Mission Creek or the unnamed small tributary to its west.
Perched alluvial deposit inset into Qc
West of Mission Creek valley lies the “San Gorgonio overlook” fan complex (Fig. 2B), comprising Qd at the base, overlain by alluvial deposits of unit Qc, and capped by Q1b, which forms the uppermost surface of the fan and stands ∼150 m above the Mission Creek channel (Fig. 2B). Previous studies have classified Quaternary deposits in the Mission Creek area in different ways. Allen (Reference Allen1957) originally mapped two Pleistocene units: (1) north-dipping strata of his “Deformed gravels of Whitewater River” (Qd of our report) overlain with angular discordance by (2) unconsolidated strata he assigned to the Cabezon fanglomerate (Qc) of the SGP region. Of interest, Allen’s figure 2 indicates that the upper Cabezon in the Mission Creek area possibly is correlative with the “Heights fanglomerate” of western SGP, and hence is largely younger than the type Cabezon. Subsequent workers (Matti et al., Reference Matti, Morton and Cox1992; Matti and Morton, Reference Matti, Morton, Powell, Weldon and Matti1993; Owen et al., Reference Owen, Clemmens, Finkel and Gray2014; Kendrick et al., Reference Kendrick, Matti and Mahan2015, Reference Kendrick, Matti and Barth2022) also concluded that the Mission Creek deposits largely are younger than the type Cabezon and assigned them to a “nested alluvial complex.” In contrast, Fosdick and Blisniuk (Reference Fosdick and Blisniuk2018; Balco et al., Reference Balco, Blisniuk and Hidy2019; Blisniuk et al., Reference Blisniuk, Scharer, Sharp, Burgmann, Amos and Rymer2021; Waco, Reference Waco2021) followed Allen’s (Reference Allen1957) original usage and assigned deposits overlying the angular unconformity to the Cabezon fanglomerate. We follow this usage in our report. Qc deposits extending southeast from this complex include a ∼13-m-tall inset alluvium package (Fig. 3B and C). It sits ∼100 m above the Mission Creek and is interpreted as a cut-and-fill sequence deposited following abandonment of surface Q1b.
Offset channels situated atop San Gorgonio Overlook fan
Northwest of Mission Creek valley, we observe two channels draining the crystalline bedrock (SGg) sequence in the southeastern San Bernardino Mountains (Fig. 4A). As these channels cross the southern strand of the MCF, they are displaced right-laterally along a shutter ridge (Zielke and Arrowsmith, Reference Zielke and Arrowsmith2012). These channels accumulate offset along the shutter ridges before turning south toward the San Gorgonio Overlook fan, where they incise into surface Q1b (Fig. 4A).
(A) Google Earth image showing two channels draining the crystalline bedrock complex (SGg) north of the Mill Creek strand (MCF). Upon crossing the MCF, the channels are displaced right-laterally, following which they turn southward and incise into surface Q1b, which caps the San Gorgonio overlook fan complex. (B) LIDAR DEM of the site showing major geomorphic features adjacent to the offset channels, including sample station locations and their ages. MCF strand is dotted where it does not displace the mapped geomorphic unit. Channel 1 records an offset of 50 ± 3 m (blue arrow) along the shutter ridge (Fosdick and Blisniuk, Reference Fosdick and Blisniuk2018; see also Supplementary Figure. S1). Two black rectangles delineate the longitudinal reaches of channels 1 and 2 shown as topographic roughness maps in C and D, respectively. Bluish colors represent low roughness (relatively flat areas), whereas reddish colors indicate high roughness (steeper terrain). (E and F) Field photographs of deposits sampled at stations UTA0486 and UTA0488, respectively. The younger deposits underlying the shutter ridge (UTA0486) are light brown, suggesting lower oxidation, whereas older deposits sampled beneath Q1b (UTA0488) are dark brown to orange, typical of more oxidized, older deposits.

Channel 1 records a horizontal offset of 50 ± 3 m (Fosdick and Blisniuk, Reference Fosdick and Blisniuk2018; see Supplementary Material). Upstream of the offset, we identify two generations of alluvial terraces adjacent to channel 1 (Fig. 4B). Downstream, the channel steepens because the stream can incise more readily into Q1b than into the upstream bedrock (SGg). This increase in downstream steepness is also evident on the terrain roughness map (Fig. 4C), which quantifies elevation variability within a 3 m radius. Steepening narrows the channel, reducing accommodation space for aggradation and therefore diminishing terrace preservation. We observe debris-flow deposits downstream of channel 1 offset (Fig. 4B). Channel 2 is likewise displaced right-laterally along the MCF; however, unlike channel 1, it maintains drainage continuity because erosion keeps pace with fault displacement (Cowgill, Reference Cowgill2007), and it therefore shows less horizontal offset (Fig. 4B). The downstream reach of channel 2 is much wider than the upstream reach, likely due to more pronounced lateral incision. As a result, we could not reliably reconstruct the pre-offset thalweg orientation and do not report an offset for channel 2 (see Supplementary Material). Both the upstream and downstream reaches of channel 2 host debris-flow deposits. The offset restoration was carried out using the semi-automated Lateral Displacement Calculator (LaDiCaoz) program in MATLAB (Zielke and Arrowsmith, Reference Zielke and Arrowsmith2012). The Supplementary Material section discusses the methodology for offset restoration and presents the estimated offsets in Supplementary Figures S1 and S2.
The shutter ridge is associated with continued lateral movement of reworked sediment of Q1b from surface-rupturing earthquakes on the MCF and is therefore younger than surface Q1b. Field observations of deposits underlying the shutter ridge and Q1b support this interpretation. Beneath the shutter ridge across channel 1, deposits display a light brown color and show minimal oxidation of clasts and sediments (Fig. 4E). By contrast, deposits underlying Q1b adjacent to channel 2 are slightly darker—brown to orangish—indicating a more mature texture typical of older, more oxidized deposits (Fig. 4F). This accords with previous observations for Q1b, where the underlying deposits show stronger soil development, boulders on the tread appear intensely weathered, and the surface is mantled by grusified clasts that impart a grayish-yellow to dark-brown color, characteristic of an older surface (McFadden, Reference McFadden1982; Matti and Morton, Reference Matti, Morton, Powell, Weldon and Matti1993; Owen et al. Reference Owen, Clemmens, Finkel and Gray2014).
Methods
Sample context
We collected 12 sedimentary samples for luminescence dating analysis across different geologic units in the Mission Creek valley (Tables 1 and 2). UTA0084 and UTA0085 were obtained from modern alluvium (Qal) within the Mission Creek channel belt. UTA0084 represents a sandbar, while UTA0085 was taken from a low terrace (∼0.6 m above the active channel) (Fig. 3A, Supplementary Fig. S3). On the western bank of Mission Creek, we collected seven samples: UTA0086 and UTA0483 from Q4b (Supplementary Fig. S4); UTA0479, UTA0480, and UTA0482 from Q4a (Supplementary Fig. S5); and UTA0481 and UTA0087 from Qdf (Fig. 3A, Supplementary Fig. S6). On the eastern bank, we obtained two additional samples: UTA0477 from Q4b (Fig. S4) and UTA0478 from Qdf (Fig. 3A, Supplementary Fig. S6). UTA0088 was collected from a sediment package inset into Qc (Fig. 3B and C).
We collected eight samples from alluvium adjacent to the two offset channels situated atop San Gorgonio Overlook fan (Fig. 4, Table 2). UTA0089 (Supplementary Fig. S7) and UTA0091 (Supplementary Fig. S8) were obtained adjacent to channel 1 from terraces located upstream of the offset, while UTA0092 was collected from a terrace abandoned along the fault trace (Fig. 4B, Supplementary Fig. S8). UTA0486 was sampled from deposits underlying the shutter ridge across channel 1 (Fig. 4B and E). Downstream of the offset, UTA0487 was collected from debris-flow deposits (Fig. 4B, Supplementary Fig. S9). These deposits represent different periods of sediment mobilization within the channel and cannot be directly correlated with any upstream terrace deposits. Similarly, debris-flow deposits in channel 2 were sampled upstream (UTA0489; Supplementary Fig. S10) and downstream (UTA0490; Supplementary Fig. S11) of the fault trace (Fig. 4B). We could not sample the shutter ridge adjacent to channel 2 due to the lack of a suitable spot for digging a pit. UTA0488 was collected from deposits underlying surface Q1b adjacent to channel 2 (Fig. 4B and F).
Sample collection and preparation
Samples were collected using metal tubes and then sealed to preserve their moisture content and protect them from light exposure. Samples were prepared under dim, amber lighting conditions at the University of Texas at Arlington luminescence laboratory. We removed approximately 2 cm of sediment from the ends of the tubes, assuming these outer ends were partly exposed to sunlight during collection. This portion of sediment was used for gravimetric water content measurement. The remaining sediment in the tube was wet sieved to extract sand grains within the 200–250 μm size range. Four samples (UTA0088, UTA0089, UTA0091, and UTA0092) were treated with H₂O₂ to eliminate organic material and with concentrated HCl to dissolve carbonate minerals. We additionally screened younger material by treating a bulk mixture of dry ends from UTA0084, UTA0085, UTA0086, UTA0480, and UTA0482 (representing modern–Holocene terraces) with H2O2 and HCl; no reaction was observed, so the remaining samples were not chemically pretreated. Next, the grains were suspended in a dispersant to remove clay particles. Magnetic separation was performed on the deflocculated samples using a bar magnet. Following this, a heavy liquid separation was conducted with lithium meta-tungstate to isolate K-feldspar grains with a density less than 2.565 g/cm3 (Rhodes, Reference Rhodes2015). Finally, these grains were rinsed with distilled water, dried, and packed for luminescence measurements.
To determine the in situ gamma dose rate for the samples, a calibrated EG&G ORTEC MicroNOMAD portable NaI gamma spectrometer was utilized. Additionally, we sent subsamples for inductively coupled plasma mass spectrometry and atomic emission spectroscopy analysis at SGS Canada to quantify the elemental concentrations of radioactive elements like K, U, Th, and Rb in the sediment samples (see Table 1).
Sample location and dosimetry values.

Measurement protocol
To determine the time since sediment grains were last exposed to sunlight, single-grain luminescence measurements were performed using a DA-20-TL/OSL Risø automated luminescence reader. Single-grain dating measures the luminescence signal of individual sediment grains rather than averaging the signal across an aliquot containing many grains (Galbraith et al., Reference Galbraith, Roberts, Laslett, Yoshida and Olley1999). In high-energy depositional environments such as the study area, where debris flows and rapid sediment transport processes dominate, many grains are unlikely to have undergone complete solar bleaching before burial, so it is critically important to resolve the subpopulation of grains that were fully bleached before deposition. The measurements followed a post-infrared infrared stimulated luminescence (pIRIR) protocol (Buylaert et al., Reference Buylaert, Murray, Thomsen and Jain2009). Following a preheat of 250°C for 10 s, grains were stimulated for 3 s each, with the first stimulation at 50°C and the second at 225°C. After the test dose measurement, samples were subjected to a hot bleach with the infrared diodes at 290°C for 60 s. This protocol has proven successful in similar contexts in Southern California (Rhodes, Reference Rhodes2015). The number of single grains measured per sample ranged from 200 to 600, depending on the proportion of grains with acceptable ages (Table 2). To determine the depositional ages and associated errors, we utilized the DRAC online calculator (Durcan et al., Reference Durcan, King and Duller2015). Fading correction was applied using the R Luminescence package (Kreutzer et al., Reference Kreutzer, Schmidt, Fuchs, Dietze, Fischer and Fuchs2012) using the measured g-value of 2.09 ± 0.53% signal loss per decade following the procedure described in Huntley and Lamothe (Reference Huntley and Lamothe2001).
Sample equivalent dose and age values.

a Equivalent doses for all samples were estimated using the three-component minimum age model (MAM-3), assuming an overdispersion (OD) of 15%, except for samples UTA0486 and UTA0488 (*), for which the finite mixture model (FMM) was applied.
b Samples were corrected for anomalous fading using a measured g-value of 2.09 ± 0.53 % loss per decade (t C = 1263 s), except for sample UTA0088, which did not fade on measured timescales.
Results
Luminescence ages
Alluvium from the Mission Creek valley yielded depositional ages that were younger than previously assumed ages of >18–3 ka (Kendrick et al., Reference Kendrick, Matti and Mahan2015; Yule et al., Reference Yule, Matti, Kendrick and Heermance2021; Table 2). Samples from the modern sandbar (UTA0084) and modern terrace (UTA0085) (Fig. 3) yielded ages of 0.7 ± 0.1 ka and 0.5 ± 0.1 ka, respectively. On the western bank of the Mission Creek, samples UTA0086 and UTA0483, both representing deposits from terrace Q4b, yielded depositional ages of 1.2 ± 0.2 ka and 0.8 ± 0.1 ka, respectively (Fig. 3A). The same terrace sampled on the eastern bank (UTA0477) recorded a younger age of 0.5 ± 0.1 ka (Fig. 3A). Three samples collected from terrace Q4a along the western bank yielded burial ages of 0.7 ± 0.1 ka (UTA0479), 0.9 ± 0.2 ka (UTA0480), and 0.6 ± 0.1 ka (UTA0482) (Fig. 3A). Debris fan deposits (Qdf), sampled on both flanks of the Mission Creek, yielded burial ages of 0.7 ± 0.1 ka (UTA0087), 0.5 ± 0.1 ka (UTA0478), and 0.6 ± 0.1 (UTA0481) (Fig. 3A). The perched alluvial deposit (UTA0088) yielded a depositional age of 28.4 ± 2.7 ka, coincident with the mean abandonment age of 26.1 ± 10.2 ka estimated by Owen et al. (Reference Owen, Clemmens, Finkel and Gray2014) for boulders on the upland relict surface Q1b (referred as Fm 1b in Owen et al., Reference Owen, Clemmens, Finkel and Gray2014; Fig. 2B).
At the offset channel site situated atop San Gorgonio Overlook fan, along channel 1, we identified two generations of terraces upstream of the MCF trace (Fig. 4B). Two samples from the younger terrace yielded depositional ages of 0.9 ± 0.3 ka (UTA0089) and 0.9 ± 0.2 ka (UTA0092), whilst the older terrace (UTA0091) yielded a depositional age of 2.0 ± 0.5 ka—twice that of the younger terrace deposits (Fig. 4B). Downstream of the MCF trace, UTA0487 yielded a depositional age of 0.3 ± 0.1 ka for debris-flow channel deposits (Fig. 4B). Similarly, along channel 2, UTA0489 and UTA0490 (representing debris-flow deposits), collected upstream and downstream of the offset, yielded depositional ages of 0.2 ± 0.1 ka and 0.5 ± 0.1 ka, respectively (Fig. 4B). The shutter ridge at channel 1 yielded a depositional age of 14.2 ± 1.0 ka (UTA0486) (Fig. 4B). Surface Q1b adjacent to channel 2 yielded a depositional age of 136 ± 10 ka (UTA0488; Fig. 4B). We used a finite mixture model (FMM) to analyze dose values for samples UTA0486 and UTA0488, because these samples exhibited bimodal dose distributions, potentially indicating mixing between younger and older grain populations post-deposition (see Supplementary Material, Supplementary Fig. S12). All other ages in this study were estimated using a minimum age model with three components (Galbraith et al., Reference Galbraith, Roberts, Laslett, Yoshida and Olley1999).
Sunlight bleaching test
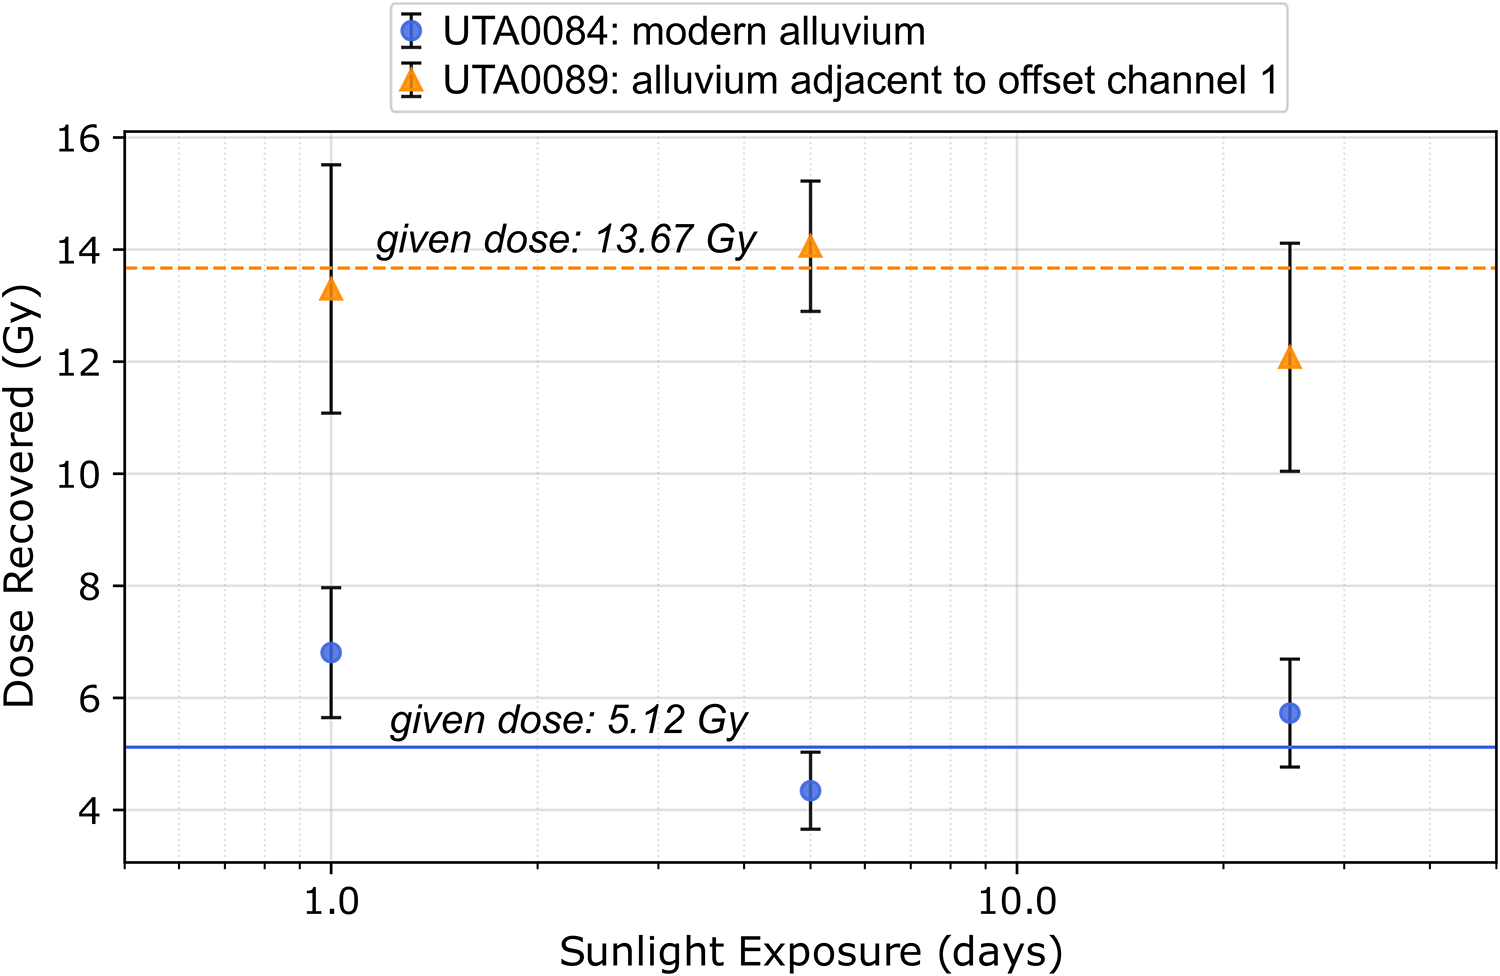
A dose-recovery test was conducted to determine the duration of sunlight exposure required to completely bleach the pIRIR signal, using two samples: UTA0084 (Fig. 3A), representing a modern sandbar; and UTA0089 (Fig. 4B), representing an alluvial terrace north of the MCF. These samples were chosen because they reside in different catchments representing distinct geomorphic systems and source lithologies. The time needed for feldspar grains to bleach under natural sunlight exposure in these two settings directly affects our depositional age estimates; incomplete bleaching would lead to age overestimation due to inherited luminescence signal. For example, UTA0084 yielded a depositional age of ∼0.7 ka, yet—as a modern sample—it should be no more than a few tens of years old, indicating substantial inherited dose.
To perform the bleaching test, we divided the unbleached K-feldspar grains for each sample into three transparent plastic bags and exposed them to sunlight for 1, 5, and 25 days (Table 3). We then prepared two aliquots per exposure duration for each sample, administered a known dose on the luminescence reader, and estimated equivalent doses using the pIRIR protocol. If sunlight fully removed the natural signal, the measured equivalent dose should match the given dose; if not, it had been overestimated.
Sunlight bleaching test.

UTA0084 received a dose of 5.12 Gy, and after one full day of sunlight exposure, returned 6.8 ± 1.2 Gy, 33% higher than the given dose. With increased exposure durations of 5 and 25 days, the recovered doses were close to the given dose (Fig. 5, Table 3). Similarly, UTA0089 received a dose of 13.67 Gy and, after one day of exposure, it returned 13.3 ± 2.2 Gy, essentially matching the given dose (Fig. 5, Table 3). These results highlight site-specific variability in feldspar bleaching efficiency, with grains in the Mission Creek valley requiring prolonged sunlight exposure to fully remove inherited luminescence from prior burial.
Results from sunlight bleaching tests on samples UTA0084 (modern sandbar) and UTA0089 (alluvium from an older terrace adjacent to channel 1). The x-axis (sunlight exposure) is logarithmic. UTA0084 was given a dose of 5.12 Gy and exposed to sunlight for 1, 5, and 25 days; after each exposure, the recovered dose was measured. After 1 day, UTA0084 retained a residual dose of 1.7 ± 1.2 Gy, equivalent to a residual age of 0.3 ± 0.2 ka (assuming a dose rate of ∼5 Gy/ka). With increasing exposure duration, the residual dose decreased as the recovered dose approached the given dose. UTA0089 received a dose of 13.67 Gy and was exposed to sunlight for the same durations. A marked reduction in residual dose occurred after 1 day, with little additional change at longer exposures.

Discussion
Recent resurfacing in the Mission Creek valley
The alluvium in the Mission Creek valley is young: its mean depositional age of 0.7 ± 0.2 ka (Fig. 6), makes it indistinguishable from modern alluvium (UTA0084 and UTA0085; Fig. 3A), which yields depositional ages of ∼0.4–0.8 ka (Fig. 6). Bleaching test results show that grains require several days of sunlight exposure to fully bleach and likely have inherited doses. For example: despite one full day of sunlight exposure, a residual signal of 1.7 ± 1.2 Gy was observed in the modern sample (UTA0084, Fig. 5), corresponding to a residual age of 0.3 ± 0.2 ka (Fig. 6). Subtracting this residual age from the average depositional age of valley alluvium would give a true depositional age of ∼0.4 ka (Fig. 6), making the Mission Creek valley alluvium even younger. The incomplete bleaching of the modern alluvium likely reflects (1) short transport distances (sediments are sourced from bedrocks in the southeastern San Bernardino Mountains) (Jain et al., Reference Jain, Murray and Botter‐Jensen2004; Fig. 1); (2) contribution of partially bleached grains from the hillslopes adjacent to the Mission Creek; (3) inadequate sediment mixing given the short transportation distance, which means grains have not gone through multiple cycles of burial and remobilization (Jain et al., Reference Jain, Murray and Botter‐Jensen2004; McGuire and Rhodes, Reference Rhodes2015); and (4) transport during high-energy flash floods, which are common in the arid environments of the American Southwest (Rittenour, Reference Rittenour2008)—such events can generate high turbidity in streams, limiting sunlight penetration and inhibiting effective bleaching of suspended feldspar grains (Stokes et al., Reference Stokes, Bray and Blum2001; Jain et al., Reference Jain, Murray and Botter‐Jensen2004; McGuire and Rhodes, Reference Rhodes2015). Collectively, the young depositional ages and poor bleaching point to frequent sediment mobilization during the Holocene, which promotes active resurfacing that can obscure surficial signatures of tectonic offset in the valley alluvium.
Comparison of surface abandonment ages from cosmogenic 1⁰Be exposure dating (Owen et al., Reference Owen, Clemmens, Finkel and Gray2014) and single-grain pIRIR luminescence ages (Argueta, M.O., unpublished data; this study) across geologic units adjacent to Mission Creek. The y-axis is logarithmic (ages in ka); the x-axis lists the sample groups used for comparison. A solid black line at 30 ka marks a cluster comprising ages from Q1b and Q2b (Owen et al., Reference Owen, Clemmens, Finkel and Gray2014; Argueta, M.O., unpublished data), the perched alluvium (UTA0088), and finite mixture model (FMM) ages from five samples (Table 4) in this study, interpreted as a potential catchment-wide reworking event. The turquoise gradient depicts the approximate temporal span of this event. In the lower right of the plot, the dark blue bar shows the mean depositional age and 1σ bounds (0.7 ± 0.2 ka) for alluvial units sampled in the Mission Creek valley (Q4a, Q4b, Qal, Qdf). Light green bar shows the mean residual age and 1σ bounds for modern alluvium (0.3 ± 0.2 ka; UTA0084) estimated from sunlight bleaching tests.

Episodic sediment reworking in the Mission Creek drainage
A comparison of single-grain luminescence depositional ages (this study; Argueta, M.O., unpublished data) and in situ cosmogenic 10Be surface abandonment ages (Owen et al., Reference Owen, Clemmens, Finkel and Gray2014) across terraces adjacent to Mission Creek indicate a catchment-wide reworking event at ∼30 ka (Fig. 6). The mean abandonment age of 26.1 ± 10.2 ka for surface Q1b (Owen et al., Reference Owen, Clemmens, Finkel and Gray2014; Fig. 2B) is consistent with the depositional age of 28.4 ± 2.7 ka of the perched alluvial deposit (UTA0088; Fig 3A). Owen et al. (Reference Owen, Clemmens, Finkel and Gray2014) explained these young ages for Q1b—presumed to predate Marine Isotope Stage (MIS) 4 (i.e., >200–70 ka)— by suggesting that these boulders were recently exposed at the surface in response to a major sediment remobilization event (see Owen et al., Reference Owen, Clemmens, Finkel and Gray2014, p. 124). They also noted that these boulders looked slightly more weathered than others dated elsewhere on the surface. Although this alternative is plausible, the agreement between our depositional age at station UTA0088 and the mean abandonment age of Q1b supports the former explanation. A feasible interpretation is that a local stream, adjusting to a falling base level, deposited the alluvium as a cut-and-fill package while Q1b was abandoned. We do not argue that Mission Creek occupied this surface when these deposits were inset into Qc; rather, these sediments could have reworked during a debris flow or flash flood event. The presence of debris-flow deposits only a few hundred years old in the offset channels (Fig. 4B) further supports the inference that precipitation-controlled flash floods and debris flows are active in the study area.
Surface Q2b, which began aggrading 106–95 ka ago (Kendrick et al., Reference Kendrick, Matti and Mahan2015) and was subsequently abandoned 89–57 ka ago (Owen et al., Reference Owen, Clemmens, Finkel and Gray2014; Ataee, Reference Ataee2019; Fig. 2A) also records the ∼30 ka reworking event. One researcher (Argueta, M.O., unpublished data) dated the alluvial fill underlying Q2b at different depths and identified three distinct single-grain FMM age populations: the youngest age peak of ∼27 ka from grains at a depth of 0.36 m, and older peaks of ∼31 ka and ∼68 ka from grains at 0.4 m depth. The younger population overlaps with the ∼30 ka event and may have been introduced into Q2b during this period of sediment reworking. The age–depth profile from Argueta et al.’s unpublished study shows that the mobilization of upper few centimeters of the alluvial fill underlying these surfaces is enough to resurface these units and is successfully captured in the near-surface luminescence ages. This depth-dependent age structure may also explain why deposits from terrace Q4a, which is morphostratigraphically older than Q4b, yielded a younger burial age (Fig. 3A). Q4a sediments were collected from ∼0.35–0.45 m depth; sampling deeper material may have captured the older grain population, yielding an age closer to the true depositional age. Similarly, FMM ages for five other samples (UTA0479, UTA0481, UTA0483, UTA0486, and UTA0488) that were obtained at a depth of ∼0.35–0.45 m comprise a significant proportion of grains recording the ∼30 ka reworking signal (Fig. 6, Table 4).
Finite mixture model (FMM) ages for Mission Creek samples analyzed in this study.a

a Abbreviations: n, number of accepted grains per sample; no. comp, the number of components used in the FMM; BIC, the Bayesian information criterion; P1, P2, P3, etc., grain proportions for each component; and De1, De2, etc., dose values corresponding to the respective grain proportions. An asterisk (*) represents the preferred equivalent dose for FMM age calculation. A plus sign (+) represents the preferred equivalent dose for age calculation for samples UTA0486 and UTA0488.
This catchment-wide reworking signal likely corresponds to a period of rapid alluvial fan aggradation during the transition from the wetter conditions of MIS 4 (71–57 ka) to the climatically unstable, drier MIS 3 (57–29 ka) (Lisiecki and Raymo, Reference Lisiecki and Raymo2005; Owen et al., Reference Owen, Clemmens, Finkel and Gray2014). This aggradation period overlaps with depositional ages of ∼45–30 ka for alluvial fans at Biskra Palms (Woerd et al., Reference Woerd, Klinger, Sieh, Tapponnier, Ryerson and Mériaux2006; Behr et al., Reference Behr, Rood, Fletcher, Guzman, Finkel, Hanks and Hudnut2010; Fletcher et al., Reference Fletcher, Sharp, Kendrick, Behr, Hudnut and Hanks2010; Fig. 1), located southeast of the study site. Sediment in the system is likely mobilized by flash floods during intervals of intense precipitation associated with millennial-scale stadial–interstadial transitions, as demonstrated for other regions in Southern California (D’Arcy et al., Reference D’Arcy, Whittaker and Roda‐Boluda2016; Brooke et al., Reference Brooke, Whittaker, Armitage, D’Arcy and Watkins2018; Goehring et al., Reference Goehring, Brown, Moon and Blisniuk2021).
Slip rate along MCF
Using luminescence ages from alluvium sampled adjacent to offset channels, we explore fast and slow slip scenarios for the MCF. However, poor geochronological constraints and the absence of coeval, across-fault terraces adjacent to these channels preclude us from deriving a finite, robust slip rate for the MCF strand. Along channel 1, we observed two generations of terraces: UTA0089 on the western bank (0.9 ± 0.3 ka) and UTA0092 parallel to the MCF strand (0.9 ± 0.2 ka) represent the younger generation, whereas UTA0091 (2.0 ± 0.5 ka) on the eastern bank represents the older generation (Fig. 4B). UTA0089 comprises unprotected alluvium deposited as the channel was displaced right-laterally along the MCF. As channel 1 accumulated offset, it eroded its western bank (UTA0089), and deposited younger alluvium, while the older alluvium on the eastern bank (UTA0091) remained protected from lateral incision (Cowgill, Reference Cowgill2007). If the upstream terraces were deposited before rupture on the MCF, then UTA0091 on the eastern bank would best reflect the pre-displacement flow direction of channel 1, having been shielded from post-displacement lateral erosion. Using the depositional age of UTA0091, we estimate a maximum Holocene slip rate of 25.6 ± 6.5 mm/yr for a right-lateral offset of 50 ± 3 m along channel 1 (Supplementary Material, Supplementary Fig. S1). This is consistent with previous high slip rate estimates along the MCF: Fosdick and Blisniuk (Reference Fosdick and Blisniuk2018) inferred a slip of 20–30 mm/yr since the Late Pleistocene from a 2.4–2.5 km offset of Qt2 terrace deposits (Fig. 2B); Balco et al. (Reference Balco, Blisniuk and Hidy2019) reported a minimum slip of 16 ± 3 mm/yr since 260 ka from cosmogenic 36Cl and 10Be isotopes; and at Pushawalla Canyon, Blisniuk et al. (Reference Blisniuk, Scharer, Sharp, Burgmann, Amos and Rymer2021) estimated a Holocene slip of 20–24 mm/yr from U-series and cosmogenic 10Be surface exposure ages of offset alluvial fan surfaces (Fig. 1). Alternatively, because we do not observe age-equivalent terrace deposits that are displaced across the fault trace, it is plausible that Holocene terrace deposits were emplaced later within the channels, after the shutter ridge had formed.
We can also estimate a minimum slip rate using the age of deposits underlying the shutter ridge at station UTA0486. Shutter ridges are syntectonic features formed in response to continued later movement due to surface ruptures along the MCF (Fig. 4B). Using the depositional age of 14.2 ± 1.0 ka for the shutter ridge at UTA0486, we estimate a minimum slip rate of >3.5 ± 0.3 mm/yr.
Implications for seismic hazard
In Southern California, landscapes evolve rapidly under the influence of high fluvial activity, which has further intensified during the Holocene (Saha et al., Reference Saha, Moon, Brown, Rhodes, Scharer, McPhillips, McGill and Castillo2021 and references therein). As a result, the long-term preservation of earthquake-related landforms is rare (e.g., Zielke et al., Reference Zielke, Klinger and Arrowsmith2015). The ages of alluvium overlying the MCF trace do not require Holocene activity at this site, but neither do they rule it out, contrary to previous inferences (Kendrick et al., Reference Kendrick, Matti and Mahan2015, Reference Kendrick, Matti and Barth2022; Yule et al., Reference Yule, Matti, Kendrick and Heermance2021). Paleoseismic and geomorphic studies along the southern SAF show that large surface-rupturing earthquakes (Mw > 5.5) recur approximately every 100 years (Sieh and Jahns, Reference Sieh and Jahns1984; Grant and Sieh, Reference Grant and Sieh1994; Akciz et al., Reference Akçiz, Ludwig, Arrowsmith and Zielke2010; Zielke et al., Reference Zielke, Ramón Arrowsmith, Ludwig and Akçiz2010), which is comparable to the age resolution of the apparently unruptured Mission Creek valley alluvium, particularly given the magnitude of residual doses in the modern depositional context. Therefore, the lack of rupture signatures in the modern alluvium may simply reflect the youthfulness of these deposits and should not be construed as evidence of fault inactivity on millennial timescales.
Rupture propagation through a multistranded fault system—including multiple regional faults and splays—is complex and often unpredictable (e.g., Rockwell and Klinger, Reference Rockwell and Klinger2013; Scharer and Yule, Reference Scharer and Yule2020). This complexity applies to the MCF strand, where recent field investigations have documented geomorphic evidence of active deformation along regional faults southwest of our study area (Waco, Reference Waco2021). Further investigation across these regional structures is needed to fully evaluate the potential for the MCF to accommodate slip in future seismic events.
Conclusions
Field observations and depositional ages of alluvial units in the Mission Creek valley provide no positive evidence for Holocene activity on the MCF, yet the absence of offset signatures at this site should not be inferred as evidence of inactivity for the past several thousand years. The mean depositional age of 0.7 ± 0.2 ka for valley alluvium, together with a residual apparent age of 0.3 ± 0.2 ka in modern alluvium, contradicts previous estimates of >18–3 ka for these deposits (Yule et al., Reference Yule, Matti, Kendrick and Heermance2021). An ∼30 ka reworking event is evident across several alluvial units adjacent to Mission Creek. The broad spatial consistency of this signal suggests that sediment reworking in the region may be governed primarily by regional climatic controls; however, further work is required to link the alluvial fan depositional ages with the climatostratigraphic record. Using the depositional ages of the older terrace adjacent to channel 1 and the corresponding shutter ridge, we estimate maximum and minimum slip rates of 25.6 ± 6.5 mm/yr and >3.5 ± 0.3 mm/yr, respectively. The absence of coeval across fault deposits along channels 1 and 2, however, prevents a robust slip rate constraint for the MCF. Additional investigation is required to constrain Holocene slip at this site. Collectively, the young alluvium ages and evidence for sediment reworking indicate frequent resurfacing on timescales of hundreds of years, which inhibits the long-term preservation of surface-rupturing earthquakes. Therefore, the lack of geomorphic evidence for displacement at this site should not be construed as proof of multimillennial MCF inactivity.
Supplementary material
The supplementary material for this article can be found at https://doi.org/10.1017/qua.2026.10080.
Acknowledgments
We thank J. Matti and S. Mahan for their constructive reviews that helped us improve an earlier version of this article. We also thank Jeffrey Warber, Alexa Nguyen, Sophia White, and Joshua Lee for help collecting samples and Cindy Lou Skipper for help with sample preparation.
Funding
This research was supported by the Statewide California Earthquake Centre (Contribution No. 22097). SCEC is funded by NSF Cooperative Agreement EAR-2225216 & USGS Cooperative Agreement G24AC00072-00.


 Open access