1. Introduction
There are only a few occupied inland stations in Antarctica, and the coverage of meteorological observations is very poor. Recently, automatic weather stations (AWSs) have been utilized in this area. The first United States AYVS program was carried out by A. Paterson of Stanford Research Institute (e.g. Reference Renard and SaliansRenard and Salians, 1977) and the program was continued by the University of Wisconsin team (Stearns and Savage, 1979; Weidner, 1987). Australian AWSs were established by Reference Allison and MorrissyAllison and Morrissy (1983). in the Wilkes Land area in East Antarctica, the Australian National Antarctic Research Lxpedition (ANARE) and the United Stales Antarctic Research Program (USARP) built two AWS data nets and succeeded in gathering data in the sector from 100° to 140° E, extending from sea level to above 3000 m altitude (Reference Wendler and PoggiWendler and Poggi, 1980; Reference Allison, Wendler and RadokAllison and others, 1993).
Around Dome Fuji in Dronning Maud Land, East Antarctica, there were no AWSs. The Japanese Antarctic-Research Expeditions (JAREs) have undertaken a Deep Ice Coring Project at Dome Fuji since 1992. Ice-core drilling down to 2500 m depth was carried out in 1996. As part of the project, an AWS research program was started in 1993 in order to investigate the accumulation circumstance for the ice-core analysis. in 1993, JARE-34 set up AWS units at.three sites along a traverse route from Syowa station to Dome Fuji station, the highest point in Dronning Maud Land, and JARE-35 maintained these instruments. in 1995, JARE-36, the first wintering-over party at Dome Fuji station, added AWS units at the other three sites. in this paper, we describe the results of observations at the six sites in 1995.
2. Observation Sites
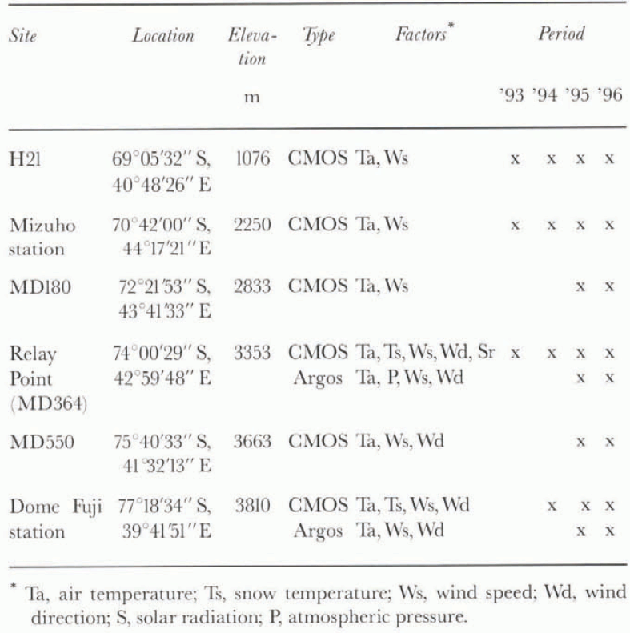
As shown in Figure 1, six observation sites (H21, Mizuho station, MD180, Relay Point, MD550 and Dome Fuji station) were set up along a traverse route from the coast near Syowa station to Dome Fuji station. These locations are summarized in Table 1 with types of AWS, observation fac tors and observation period. AWS units at three sites, Mizuho station, Relay Point and Dome Fuji station, started recording in 1993 (Enomoto and others, 1995), and the others in 1995 (Kameda and others, 1997a).
H21 site (1026 m a.s.1.) is located in the coastal region, 60 km from the coast, where air temperature and wind speed are strongly influenced by coastal cyclonic activities. Three sites, Mizuho station (2250 m a.S. 1.; closed in 1985), MD180 site (2833ma.s.l.) and Relay Point (MD364; 3353 m a.s.1.), are located on the ice-sheet slope, where katabatic winds prevail. MD180 is located in a glazed surface region, while the other two are in a sastrugi surface region. M D 550 (3663 m a.S. 1.) is located on relatively fiat terrain, just beyond the influence of katabatic winds, judging from snow-surface features (Reference Furukawa, Kamiyama and MaenoFurukawa and others, 1996) and surface snow properties (Shiraiwa and others, 1996). Dome Fuji station (3810ma.s.l..) is on the top of a dome in cast Dron-ning Maud Land, where surface hoar grows frequently on the surface (Kameda and others, 1997b) and depth hoar is well developed in the lower layers.

Fig. 1. Location of A WS units in 1995 in east Dronning Maud Laud, Antarctica, installed by Japanese Antarctic Research Expeditions, Wind direction diagrams at Dome Fuji station, Relay Point and Mizuho station are shown. Data of Mizuho station arefrom 1982.
At Dome Fuji station, the Japan Meteorological Agency (JMA) has recorded observations including air temperature, wind speed, wind direction and atmospheric pressure since February 1995.
3. Instrumentation
Two types of AWS units were employed: one is a data-logger system which stores data in complementary metal-oxide semiconductor (CMOS) memories, and the other is an Argos system which transmits data to the U.S. National Oceanic and Atmospheric Administration (NOAA) series satellites using an Argos Data Collection System on board.
“KADEC series” CMOS data loggers (by Kona System Co. Ltd, Japan) with extra lithium batteries were used, functioning down to -82°C in a low-temperature test. This type of data logger was initially used at Asuka Camp in 1985 byJARE-26 (Reference Endoh, Wakahama, Kawaguchi, Sano and KikuchiEndoh and others, 1987) and has been extensively used since 1993 byJARE-34 (Enomoto and others, 1995) andJARE-35 (Enomoto and others, 1996).
Data loggers were set in thermal insulation boxes (50 cm X 40cm X 30 cm) and were buried in snow at about 50 cm depth. Data were taken from the data loggers once a year, when the expedition visited the sites. At MD550, a windmill generator (Windcharger 910, Marlec Engineering Co. Ltd, U.K.) was used to power data-logger heaters. At Dome Fuji station, large batteries (60 Ah X 4) were used to supply power to the data-logger system.
Table 1. List of CMOS- and Argos-AWS sites along the Ira-verse route between Syowa and Dome Fuji stations
The anemometers (AG-860, Makino Applied Instruments Inc., Japan) did not function on some occasions, due to icing, especially at H21 and Mizuho station, and at temperatures below -60° C at Dome Fuji station and MD550. Platinum sensors in shelters were used for air-temperature measurement with 0.1 °C accuracy: Since the shelters were not ventilated, the air temperature tended to rise in summer owing to heating by solar radiation at low wind speed. Therefore, temperature data when wind speed was below 1.2 m s −1 in summer (November-February) were discarded.
Argos-AWS units have been in operation at Relay Point and Dome Fuji station since February 1995. The measured parameters are air temperature, atmospheric pressure, wind speed and wind direction. These units were originally designed by Stanford University (A. Paterson'S group) and have been maintained and improved by the University of Wisconsin-Madison (C. R. Stearns'group); they are widely-used by the U.S. Antarctic Program (Reference Bromwich and StearnsBromwich and Stearns, 1993).
For Argos-AWS, air temperature is measured with a platinum resistance thermometer (Weed Instrument Co.); atmospheric pressure with a digiquartz pressure transducer system (Parascicntilic InC. model 215); and wind speed and direction with a liendix aerovane. The data are recorded at 10 min intervals and are transmitted to the NOAA series satellite. If this is within sight of the Argos-AWS unit, the transmissions are received and stored by the Argos data collection system. The collected data are stored in an anonymous lile transfer protocol server at the Space Science and Engineering Center of the University of Wisconsin Madison (Stearns and others, 1993).
4. Results
Air temperature
Figure 2 shows air temperature in 1995 at the six observation sites. The temperatures decrease with altitude. The minimum temperature at Dome Fuji station, which

Fig. 2. Air temperature at six sites obtained by CMOS-A WS in l995.
occurred on 18 August, was recorded as -80.1°C by CMOS-AWS, 81.9°C by Argos-AWS and -78.9°C by the J M A. The differences may be due to the topography around Dome Fuji station, where a strong inversion layer develops and air temperature changes with sensor height and subtle surface relief. TheJMA, which started measurements at Dome Fuji station in February 1995, uses an aspirated system for air-temperature measurement, while AWSs use natural ventilation.
A remarkable feature was the temperature rise in winter, which occurred at all sites almost simultaneously. This feature was also seen in 1993, but not in 1994 or 1996.
Wind speed
Figure 3 shows wind-speed data at each site. Data logging was sometimes interrupted by several problems including icing due to heavily drifting snow, grease hardening due to low temperatures, data-logger troubles, etc.
At H21, wind speed becomes large when low-pressure disturbance encroaches from the coast. At Mizuho station and MD180 the wind speed was consistently >10 m s −1 as a result of katabatic flow. At Relay Point the effect of katabatic wind was smaller than at the former two sites. At MD550, wind speed was sometimes negligible, which suggests that this site is outside the katabatic wind region. At Dome Fuji station, wind speed was small, rarely larger than 10 m s and annual mean wind speed was 5.9 m S−1.

Fig. 3. Wind speed at six sites obtained by CMOS-AWS in 1995. Data at Relay Point are byArgos-A WS; data at Mizuho station arefrom 1994.
Wind direction
Figure 1 shows wind-direction diagrams at Dome Fuji station and Relay Point (Argos-AWS data) and Mizuho station (previous data). At Mizuho station the east wind blows considerably more than 50% of the time. At Relay Point, the southeast wind blows 40% of the time. Based on these wind-direction features, these two sites are located in the katabatic wind area. At Dome Fuji station, there is no strong prevailing wind, although east winds are slightly the most common.
Solar radiation
Figure 4 shows solar radiation at Relay Point in 1994-95, measured by type H201 solar radiation sensor (Eiko Seiki Co. Ltd). The sun appeared on 2 August, was above the horizon for 24 hours between 29 October and 9 February, and disappeared on 18 May. in summer there was almost no cloud al Relay Point. The maximum radiation value was 0.956 kW m−2. It is possible that the sensor surface was occasionally covered with frost and that the observed values were increased by scattered radiation due to the frost.
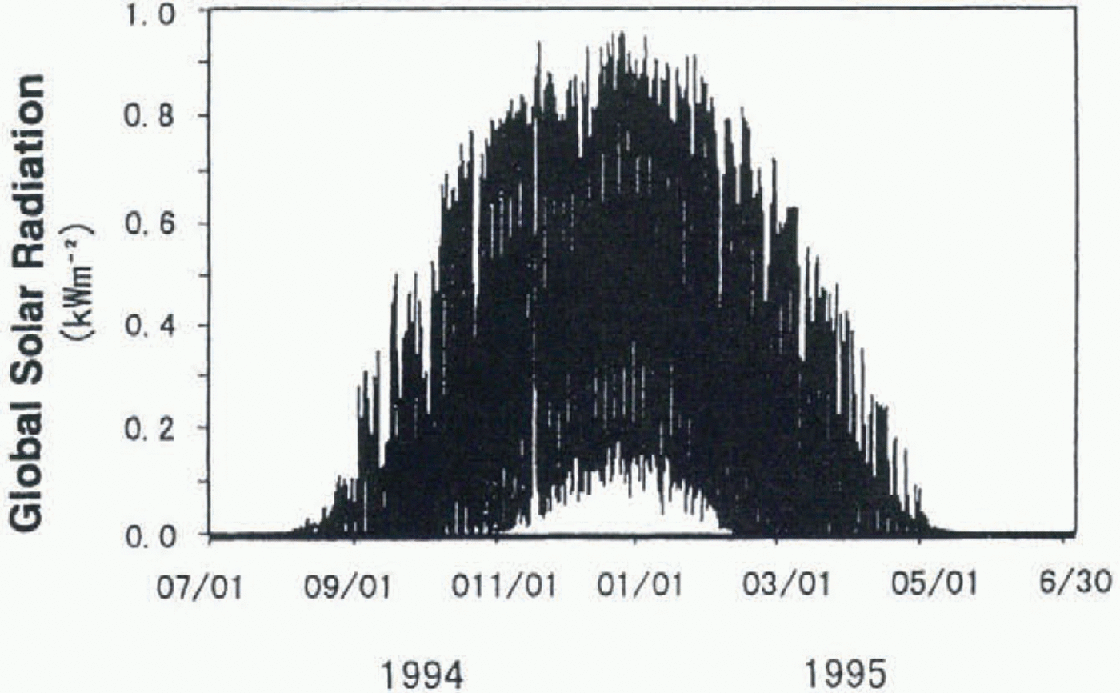
Fig. 4. Global solar radiation ai Relay Point from 1994 to 1995by CMOS-AWS.
Atmospheric pressure
Atmospheric pressure recorded at Relay Point by Argos-AWS and at Dome Fuji station by the JMA is shown in Figure 5. The seasonal trend of atmospheric pressure at both sites shows an oscillation with a period of 0.5 year and an amplitude of about 15hPa. The pressure was high in July and December and low in May and September. A similar semi-annual oscillation of pressure has been observed by Reference Radok, Allison and WendlerRadok and others (1996) in the sector including Casey, Du-mont d'Urvillc and Dome C in Wilkes Land, though the winter pressure increase was less remarkable in the inland area than at Dome Fuji station. Radok and others explained that the pressure peaks occur when air surrounding the ice sheet is heated and able to spread out over the ice. According to their explanation, the high pressure injuly around Dome Fuji station is linked to an apparently anomalous event with high temperature injuly as described later.

Fig. 5. Atmospheric pressure at Relay Point by Argos-AWS and at Dome Fuji station by JAI A observation. Thin lines are hourly data, and thick lines are 10 day means.
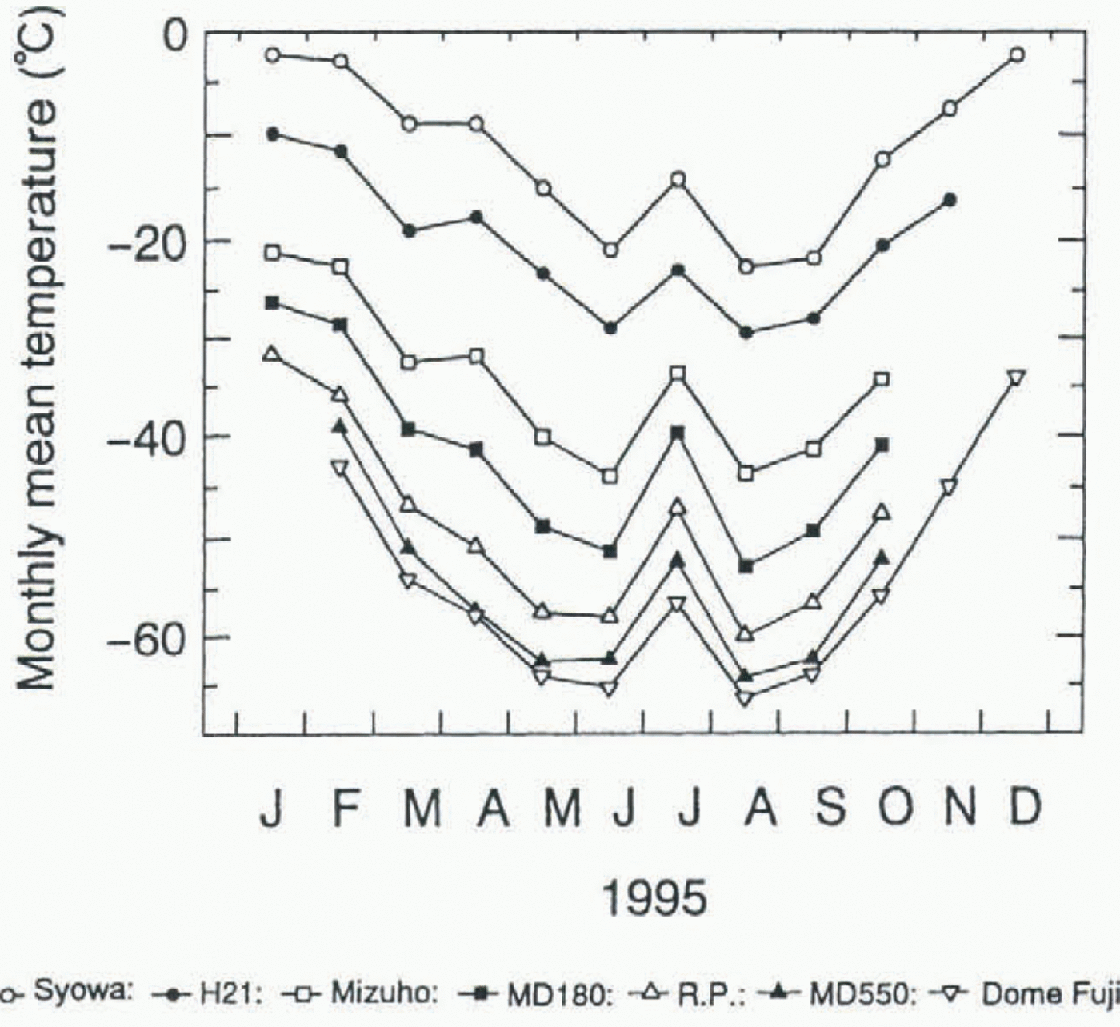
Fig. 6. Monthly mean temperatures at seven observation sites in 1995 in east Dronning Maud Land.
5. Discussion
Temperature rise in winter
Figure 6 shows monthly mean air temperatures in 1995 at the six sites and Syowa station. July temperatures are systematically higher than June and August temperatures because of high values in the middle and at the end of July (see Fig. 2). The difference between July temperatures and the mean of the June and August temperatures was largest at MD180, midway between Syowa and Dome Fuji stations. Thejuly temperature rise was also seen in 1993 and 1994 in the observations at Relay Point. The phenomenon of the winter temperature having no distinct minimum is known as a “coreless” winter for the Arctic (Reference Von MiddendorfVon Middendorf, 1899) and for the Antarctic (Reference Meinardus, Koppen and GeigerMeinardus, 1938).
Figure 7 shows hourly temperatures at the six sites from July to mid-August. Short-term temperature-maxima events are marked as PI, P2, etC. The temperature at Dome Fuji station increased by 17°C in 2 days starting on 8 July (event PI), and 24°C in 1 day on 27 July (event P8). The time delays in appearance of the same temperature maxima at different AWS sites are recognized in Figure 8. The time delay patterns are classified into two groups. in one, the temperature maximum appeared earlier at Mizuho station than at inland sites (events PI, P2, P3, P4 and P8). in the other, the temperature maximum at Dome Fuji station preceded that at coastal sites (events P6, P9 and Pll). in all cases the maximum propagated in less than 24 hours. Some temperature maxima did not propagate from H21 (events P7 and P10). The variation of time delay at H21 seems to differ from the others, perhaps because the H21 location is not aligned with the other sites, as shown in Figure 1.
The typical atmospheric pressure distributions for the two patterns are shown in Figure 8. They come from an objective analysis by the JMA global circulation model (GCM)based on meteorological data from Antarctic stations and drifting buoys in the Antarctic Ocean. On 8 July, when event PI occurred, the center of a low pressure of < 960hPa was at about 65° S, 60° E, off east Enderby Land. According to the Antarctic composite satellite images provided by the Antarctic Meteorology Research Center
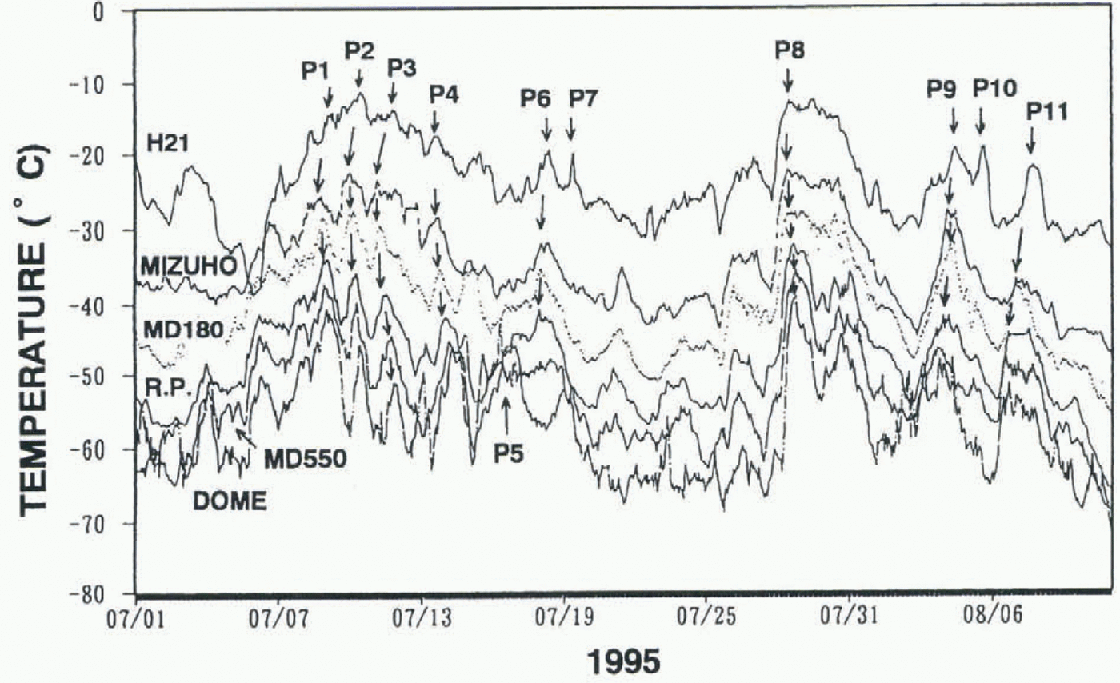
Fig. 7. Hourly air temperatures at six sites, 1 July-JO August 1995. The events of short-term temperature maxima are marked as P1,P2, etc.
(AMRC) of the University of Wisconsin, this disturbance penetrated inland from the coast between east Enderby Land and the Amery Ice Shelf on that day. Mizuho station was the closest site to the low-pressure center, which explains why the temperature rise at Mizuho station preceded that at the other sites. On the other hand, on 3 August, when event P9 occurred, the center of a low pressure of less than 968 hPa was located at 65° S, 90° E, off Mirny station in Wilkes Land. Satellite images show that the disturbance penetrated inland from the coast of west Wilkes Land. in this case, Dome Fuji Station was closest to the low-pressure center, and the disturbance would be expected to reach Dome Fuji station before the other sites.

Fig. 8. Atmospheric pressure distribution at sea level on 8 July and 3 August 1995. Arrows are disturbance movement derived from satellite images.
Figure 9 shows the meteorological conditions at Dome Fuji station recorded by thcJMA. On 8 July, when the temperature rise at Mizuho station preceded that at other sites, wind speed became large and pressure decreased, while wind direction did not change substantially. The temperature rise is thought to have been caused by inversion-layer disappearance as a result of the disturbance from the east. The temperature rise on 28 July (event P8), when wind speed was more than 15 m S−1, can be explained in the same way. However, the temperature rise on 3 August, marked as event P9 in Figure 7, cannot be explained by low-pressure disturbance. The pressure on this day was the highest of the year, wind speed was small and the wind changed direction from northeast to east, to south, to southwest, to south, to east and to northeast. The temperature rise during this period is believed to have been a result of atmospheric advection from the south, where a warm air mass was formed presumably due to subsidence of the atmosphere.

Fig. 9. Atmospheric pressure, wind speed and wind direction at Dome Fuji station, 1 July-10 August 1995.
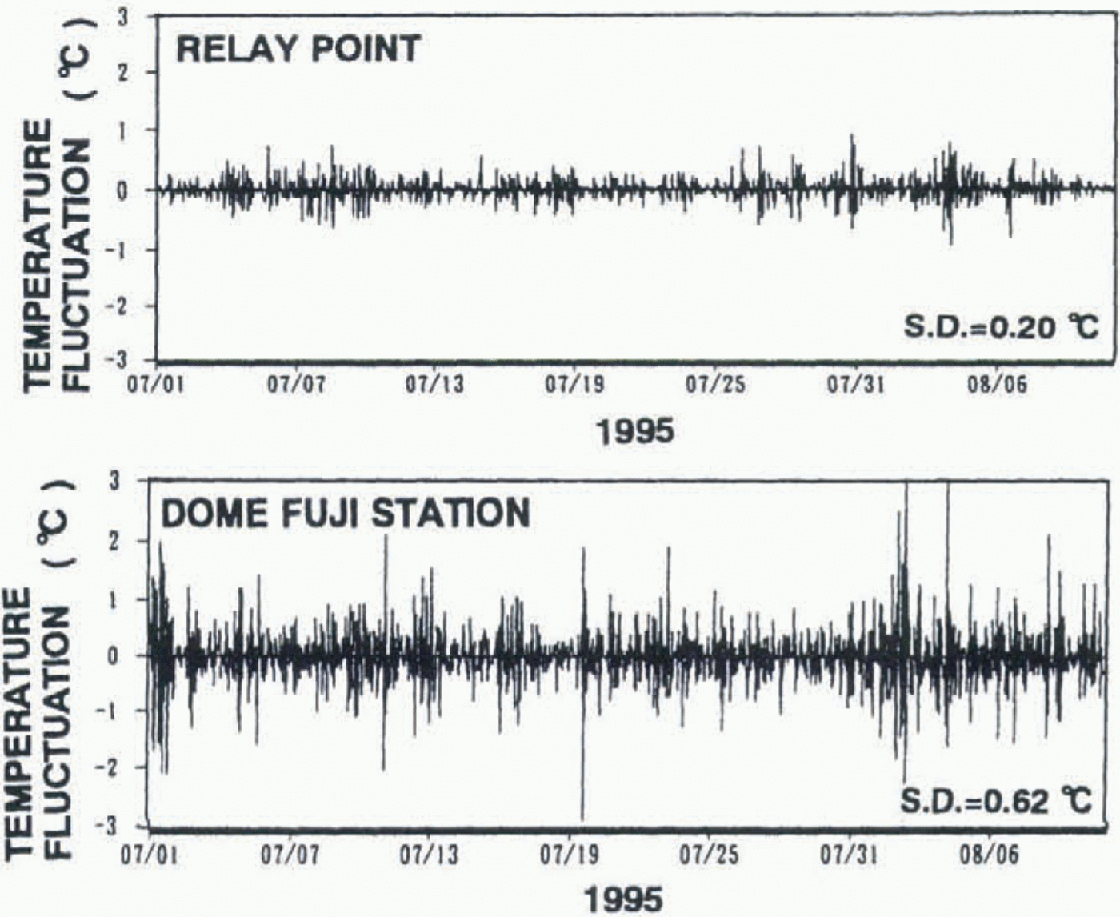
Fig. 10. Temperature fluctuations at Dome Fuji station and Relay Point. Data are hourly temperatures minus 3 hour running means. S.D. is standard deviation of thefluctuation.
When the temperature maxima related to low-pressure disturbance occurred, they were usually accompanied by an increase of snow accumulation at Dome Fuji station. Hence, most of the precipitation was caused by water vapor brought by the disturbances coming from the coast between the Amcry Ice Shelf and Enderby Land.
Temperature fluctuation at Dome Fuji station As shown in Figure 7, air temperature at Dome Fuji station fluctuated with greater amplitude than at the other sites. The temperature fluctuations shown in Figure 10 were calculated using a high-pass niter (hourly data minus the 3 hour running mean). The standard deviations of the fluctuations at all sites in winter and summer are shown in Figure 11.The standard deviation at Dome Fuji station in winter was about 0.6°C, which is double or triple that at the other sites. This large temperature fluctuation in winter at the top of the ice sheet is an interesting phenomenon, the reason for which is not clear. However, we suggest that it could be the result of the gravity wave with a short period of oscillations in a strong inversion layer which develops in winter.
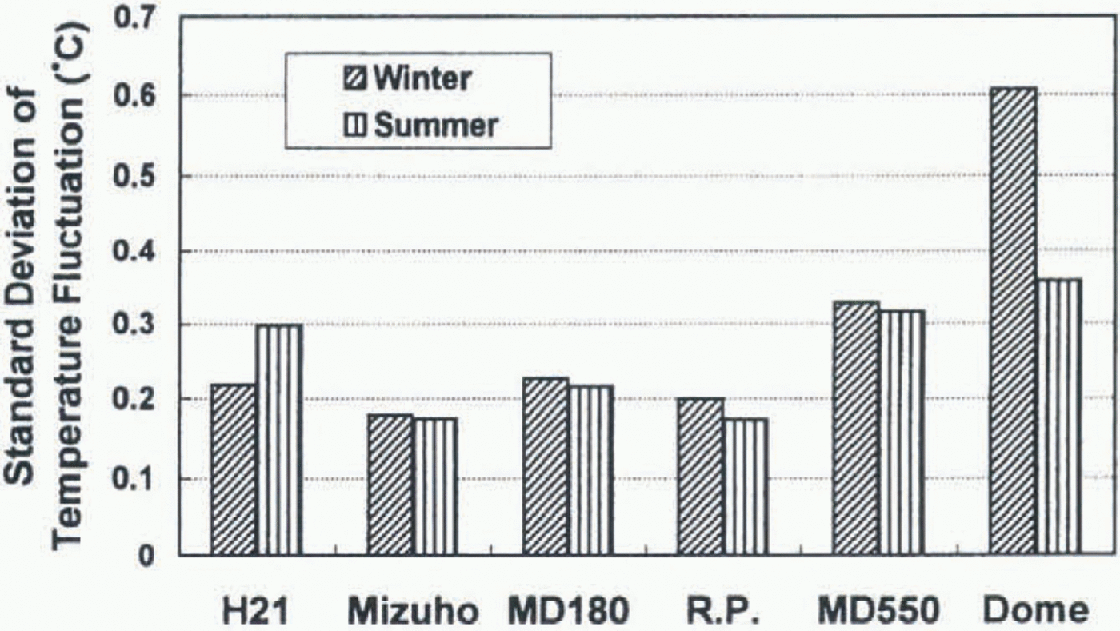
Fig. 11. Standard deviation of temperature fluctuation at six sites in winter (1 July-10 August) and summer (1-31 December) in 1995.

Fig. 12. Temperature f annual mean, maximum and minimum in 1995) as a function of elevation.
Lapse rate of temperature
Figure 12 shows annual mean, maximum and minimum temperatures at each site for 1995 as a function of surface elevation. Roughly, the lapse rate of annual mean temperature was 0.78°C (100 m)−2 at elevations of 0-1000 m (Syowa station-H21), 1.09°C (100 m)−1 at 1000-2000 m (H21-Mizuho), 1.26°C (100m) −1 at 2000-3000m (Mizu-ho-Relay Point) and 1.58°C (100 m)−1 for elevations greater than 3000 m (Relay Point-Dome Fuji station).
Reference SatowSatow (1978) calculated annual mean lapse rates in east Dronning Maud Land using 10 m snow-temperature data. He found that the annual mean lapse rate was 1.3°C (100 m)−1 at 1000 3000 m, and 2.0°C (100 m)−1 at 3000-3600 m. Our data show a similar tendency, though the lapse rates are smaller than Satow'S results.
Figure 13 presents variations of monthly mean lapse rate between all neighboring sites. The lapse rates in summer (January and February) below MD550 (solid lines) are almost equal to the adiabatic lapse rate. However, in the other seasons they are larger than the adiabatic lapse rate. in addition, in winter they increase with elevation and this tendency is largest in April. This means there should be other causes of cooling, which would be a result of strong radiative cooling in the inland area. Therefore, the lapse rate becomes large in April when the polar night begins and radiative cooling is most effective.
The lapse rates between MD550 and Dome Fuji station (broken line I fluctuate from 0.37 to 2.93°C (100 m)−1. Both sites are located outside the inlluence of katabatic wind (Furukawa and others, 1996; Shiraiwa and others, 1996), and the altitude différence is only 150 m, while the distance between the two sites is 180km. Hence, the lapse rate between these sites is easily changed by dillcrences of weather, radiation conditions and other meteorological factors.
Concluding Remarks
Along a traverse route from Syowa station to Dome Fuji station, meteorological data were obtained by CMOS-AWS and Argos-AWS systems from 1993 to 1996 at six sites: H21 (1076ma.s.l.), Mizuho station (2250m), MD180 (2833m),
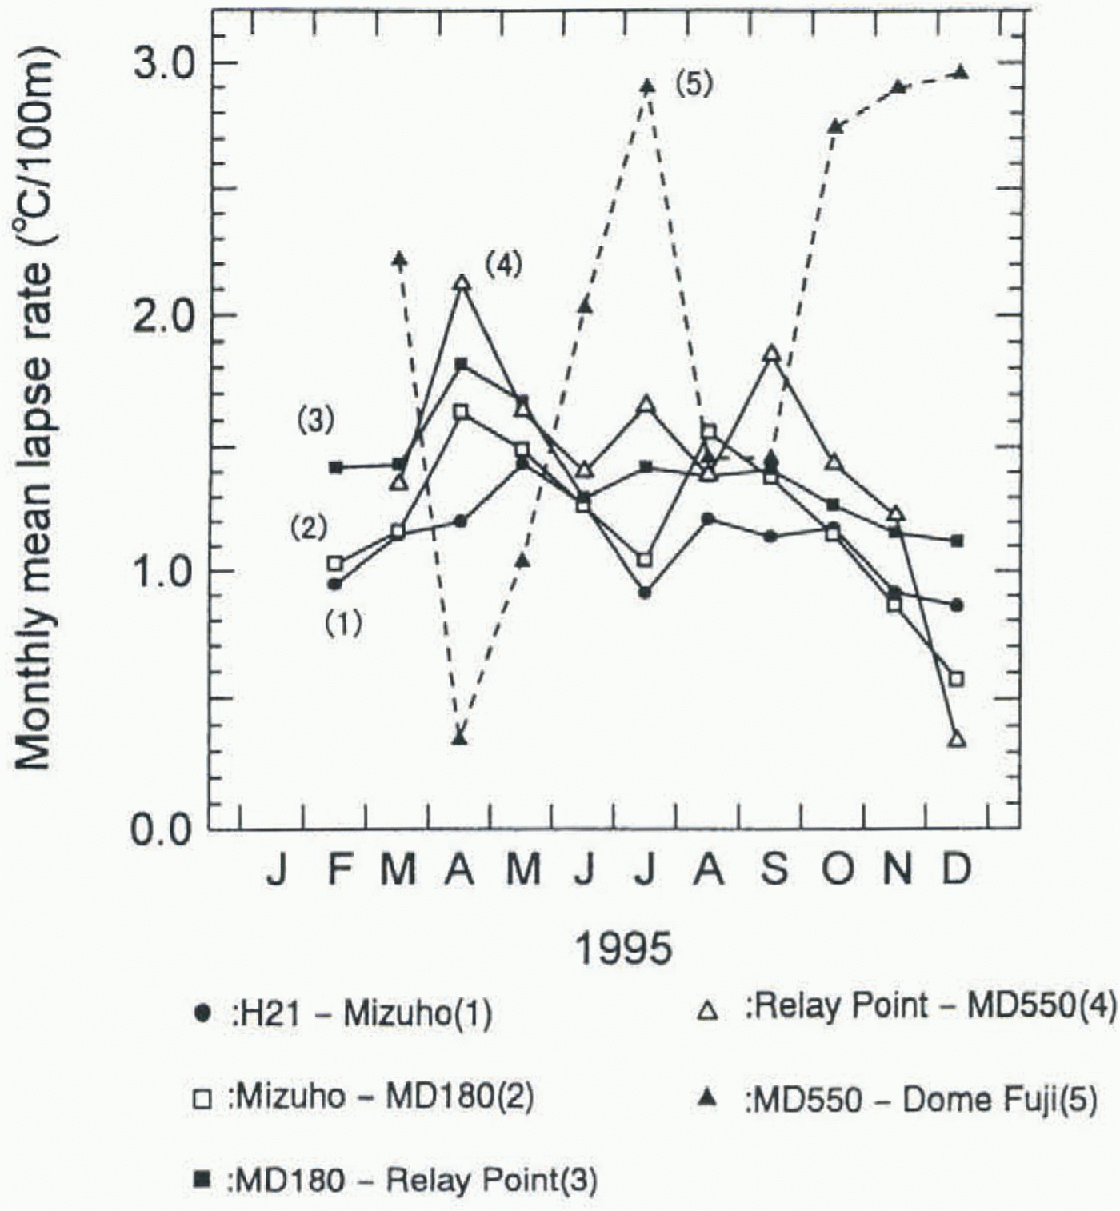
Fig. 13. Monthly mean lapse rates at neighboring sites. Data from H21 to AID550 sites are shown with solid lines, and data between AID550 and Dome Fuji station are shown with a dashed line.
Relay Point (3353 m), MD550 (3663 m) and Dome Fuji station (3810 m).
Prom wind-speed data, we conclude that sites from H21 to Relay Point are in the katabatic wind zone, while MD550 and Dome Fuji station are outside it Air temperature sometimes increased rapidly in winter. The hourly temperature data of AWSs show that there were two patterns of time delay of temperature maxima. One was that the temperature rise at Mizuho station preceded that at other stations, and the other was that the temperature rise at Dome Fuji station preceded the others. The former occurred when a disturbance came from the coast between east Enderby Land and the Amery Ice Shelf and strong winds destroyed the stable inversion layer. The latter occurred when the low-pressure center was near the coast of west Wilkes Land. in this case, the temperature rise was caused by advection of warm air mass, because wind speed was small, wind direction changed substantially and pressure was high at Dome Fuji station.
The seasonal trends of atmospheric pressure at Dome Fuji station and Relay Point show an oscillation with a period of 0.5 year and amplitude of about 15 hPa. The pressure was high injuly and December, and was accompanied by a temperature increase.
The fluctuations of hourly temperature in winter at Dome Fuji station with standard deviation of about 0.6°C were approximately double or triple those at the other sites.
The lapse rate of annual mean temperature was 0.78 c (100 m) −1 at elevations of 0-1000 m, i.09°C (100 m) −1 at 1000-2000 m, 1.26°C (100 m) −1 at 2000-3000 m and 1.58°C (100 m) −1 for elevations greater than 3000 m. The lapse rate of monthly mean temperature between all neighboring sites was close to the adiabatic lapse rate in summer but exceeded it in other seasons. When the polar night begins in April, the lapse rates are large and tend to increase with altitude.
Acknowledgements
We would like to express our sincere thanks to all members ofJARE-34 to -37 who extended generous support in the íïeldwork for the installation of the AWS. We thank the JMA for providing the results of objective analysis by the JMA GCM. We also thank K. Jacka and I. Allison of the Antarctic CRC, who offered much information about AWS observations which helped to improve this paper. The Argos-AWS program in the U.S. is funded by the National Science Foundation's office of Polar Programs. Antarctic composite satellite images were provided by the AMRC. The instrument improvement was partly supported by a grant-in-aid for scientific research from the Ministry of Education, Science and Culture, Japanese Government (No. 07304037). Tins paper is a contribution from the Deep Ice Coring Program at Dome Fuji station, East Antarctica.


