

1. Introduction
An accurate description of meltwater movement through snow cover is essential to improve the forecasting of disasters resulting from wet snow. Most water transportation processes in natural snow cover occur under unsaturated conditions because water usually drains from the snowpack before saturation is reached. Therefore, it is important to determine the unsaturated hydraulic conductivity, K, based on the snow characteristics. However, directly measuring K of snow is very difficult and only a few attempts have ever been made for a limited set of snow samples (Reference Sugie and NaruseSugie and Naruse, 2000; S. Yamaguchi and A. Sato, unpublished information). Consequently, fundamental questions regarding how to model K of snow remain unanswered.
The water retention curve (WRC) shows the relationship between the volumetric water content, θ v, and matric potential, ψ, or suction, h, and is a fundamental part of the hydraulic properties in porous media (Reference Klute and KluteKlute, 1986). In soil physics, K is commonly modelled based on WRC measurements (e.g. Reference MualemMualem, 1976). Several studies have reported measured WRCs of snow (e.g. Reference ColbeckColbeck, 1974, Reference Colbeck1975; Reference Wankiewicz, Colbeck and RayWankiewicz, 1979), which may be useful for modifying soil physics models to establish a model for K of snow, but only if the hydraulic properties of snow behave similarly to those of soil. Reference Yamaguchi, Katsushima, Sato and KumakuraYamaguchi and others (2010) measured the WRCs of snow with the same density but various grain sizes using a gravity drainage column. They found many similarities between the WRCs of snow and sand, on the basis of which they applied widely used soil physics models to analyse the characteristics of the WRC of snow. Using these results, they suggested that the WRC of snow can be described as a function of grain size using soil physics models. Moreover, based on their results, Reference Hirashima, Yamaguchi, Sato and LehningHirashima and others (2010) introduced a new scheme for calculating water movement through snow cover under unsaturated conditions in the numerical snow-cover model, Snowpack, developed by the WSL Institute for Snow and Avalanche Research SLF, Davos, Switzerland (Reference Bartelt and LehningBartelt and Lehning, 2002; Reference Lehning, Bartelt, Brown, Fierz and SatyawaliLehning and others, 2002a,Reference Lehning, Bartelt, Brown and Fierzb). They succeeded in reproducing the appearance and disappearance of layers with a high water content in seasonal snow. Although these studies contributed to our understanding of the mechanism of water movement in snow and improved the modelling of water movement through snowpack, Reference Yamaguchi, Katsushima, Sato and KumakuraYamaguchi and others (2010) examined only one grain type and one bulk dry density (550kgm–3), which was high relative to that of natural wet snow. To improve understanding of the dependence of snow’s hydraulic properties on its physical characteristics, we examined the WRCs for different bulk dry densities and grain properties. Based on our findings, we discuss the possibility of modelling the WRC of snow as a function of grain size, bulk density and grain type.
2. Methods
2.1. Properties of snow samples
We used two types of snow sample: screened refrozen melt forms kept in a cold room at –20˚C for 1 year (S-sample hereafter) and natural snows obtained in the field at the Snow and Ice Research Center, National Research Institute for Earth Science and Disaster Prevention, Japan (N-sample hereafter). The S-samples had high grain-size uniformity because they were fragmented and screened through several fine-meshed sieves with progressively smaller meshes. The N-sample experiments were conducted on the same day that each snow sample was obtained. To determine the grain size, at least 500 individual grains in each sample were photographed through a microscope, and the area of each grain was determined using the ImageJ software developed at the US National Institutes of Health. Then each equivalent grain diameter, which was defined as the diameter of a circle with the same area, was calculated. In this study, the representative grain size for each sample was assumed to be the average diameter, d, in the sample (Table 1). Table 1 also presents the uniformity coefficients (UCs), which are a measure of the relative dispersion. Values of UC close to 1 indicate a high level of uniformity. The S-samples had small UCs, whereas the N-samples had large UCs, reflecting a marked difference in uniformity of grain size between the Sand N-samples.
Table 1. Sample information. Snow type is according to the International Classification for Seasonal Snow on the Ground (Reference FierzFierz and others, 2009)
Snow for each S-sample was packed into a sample column that consisted of several acrylic rings (20mm high, 50mm in diameter) taped securely together. The bulk density, which is determined by the volume of the sample column and the weight of snow added, was controlled by tamping the snow sample. The S-sample density was high relative to that of the normal seasonal snow density because of repacking. The bulk density of N-samples packed into a sample column without tamping was the same as under natural conditions. To examine the influence of density change, we also performed experiments using N-samples that were tamped to increase the density. If a snow sample was wet, the water content was measured using part of the sample prior to performing the experiment, and the bulk dry density was calculated from the measured bulk density. The dry bulk densities of all the samples are also listed in Table 1.
2.2. Measurement of water retention curve of snow
The WRC of snow was measured using a gravity drainage column method (Reference Yamaguchi, Katsushima, Sato and KumakuraYamaguchi and others, 2010). First, the column holding the sample was submerged in water with ice at 0˚C in an insulated box until the snow was saturated (30min in this study). The water was then removed from the insulated box using a pump until a defined water-table level was reached, and the column was allowed to settle until a steady state was reached at 0˚C (60min in this study). Finally, the volumetric water content, θ v, for each acrylic ring and the corresponding suction value, h, which was defined as the central height of each ring from the final water-table level, were measured to obtain the WRC.
3. Experimental Results and Discussion
3.1. Influence of grain size and bulk dry density on the WRC of snow
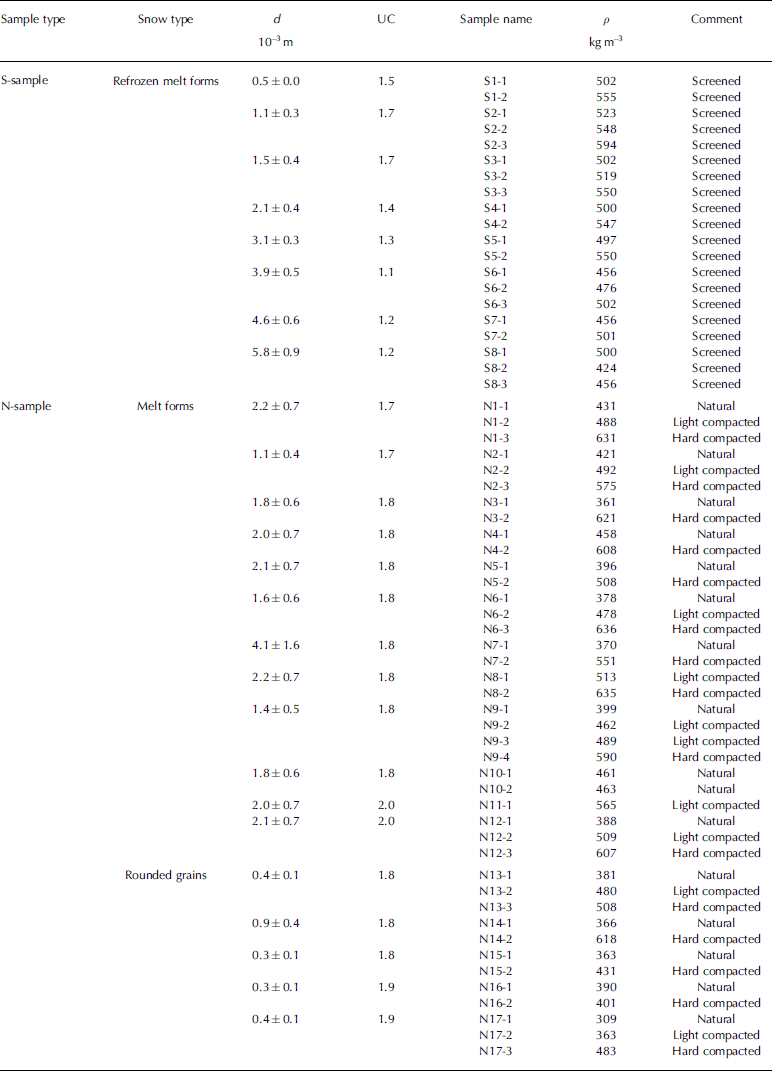
Figure 1a shows the WRCs and the relationship between the volumetric water content, θ v, and suction, h, for S1-2 (black circles) and S4-2 (white triangles). The figure also gives the plotted data number (DN). The two S-samples had similar dry bulk densities (S1-2=555kgm–3, S4-2=547kgm–3) but different grain sizes (S1-2=0.5mm, S4-2=2.1mm) (Table 1). The shapes of the WRCs differed markedly for the two samples. We used a soil physical model to analyse the measured WRCs. Yamaguchi and others (2010) applied two widely used soil physics models, the Brooks and Corey model (BC model; Reference Brooks and CoreyBrooks and Corey, 1964) and the Van Genuchten model (VG model; Reference Van GenuchtenVan Genuchten, 1980), to determine the shape of the WRC of snow. Based on a comparison of the results of the models, they concluded that the VG model reconstructed the distribution of the measured WRC of snow better than the BC model did, although both models were in good agreement with the experimental WRC for snow. Therefore, we adopted the VG model to analyse the measured WRCs of snow in this study.
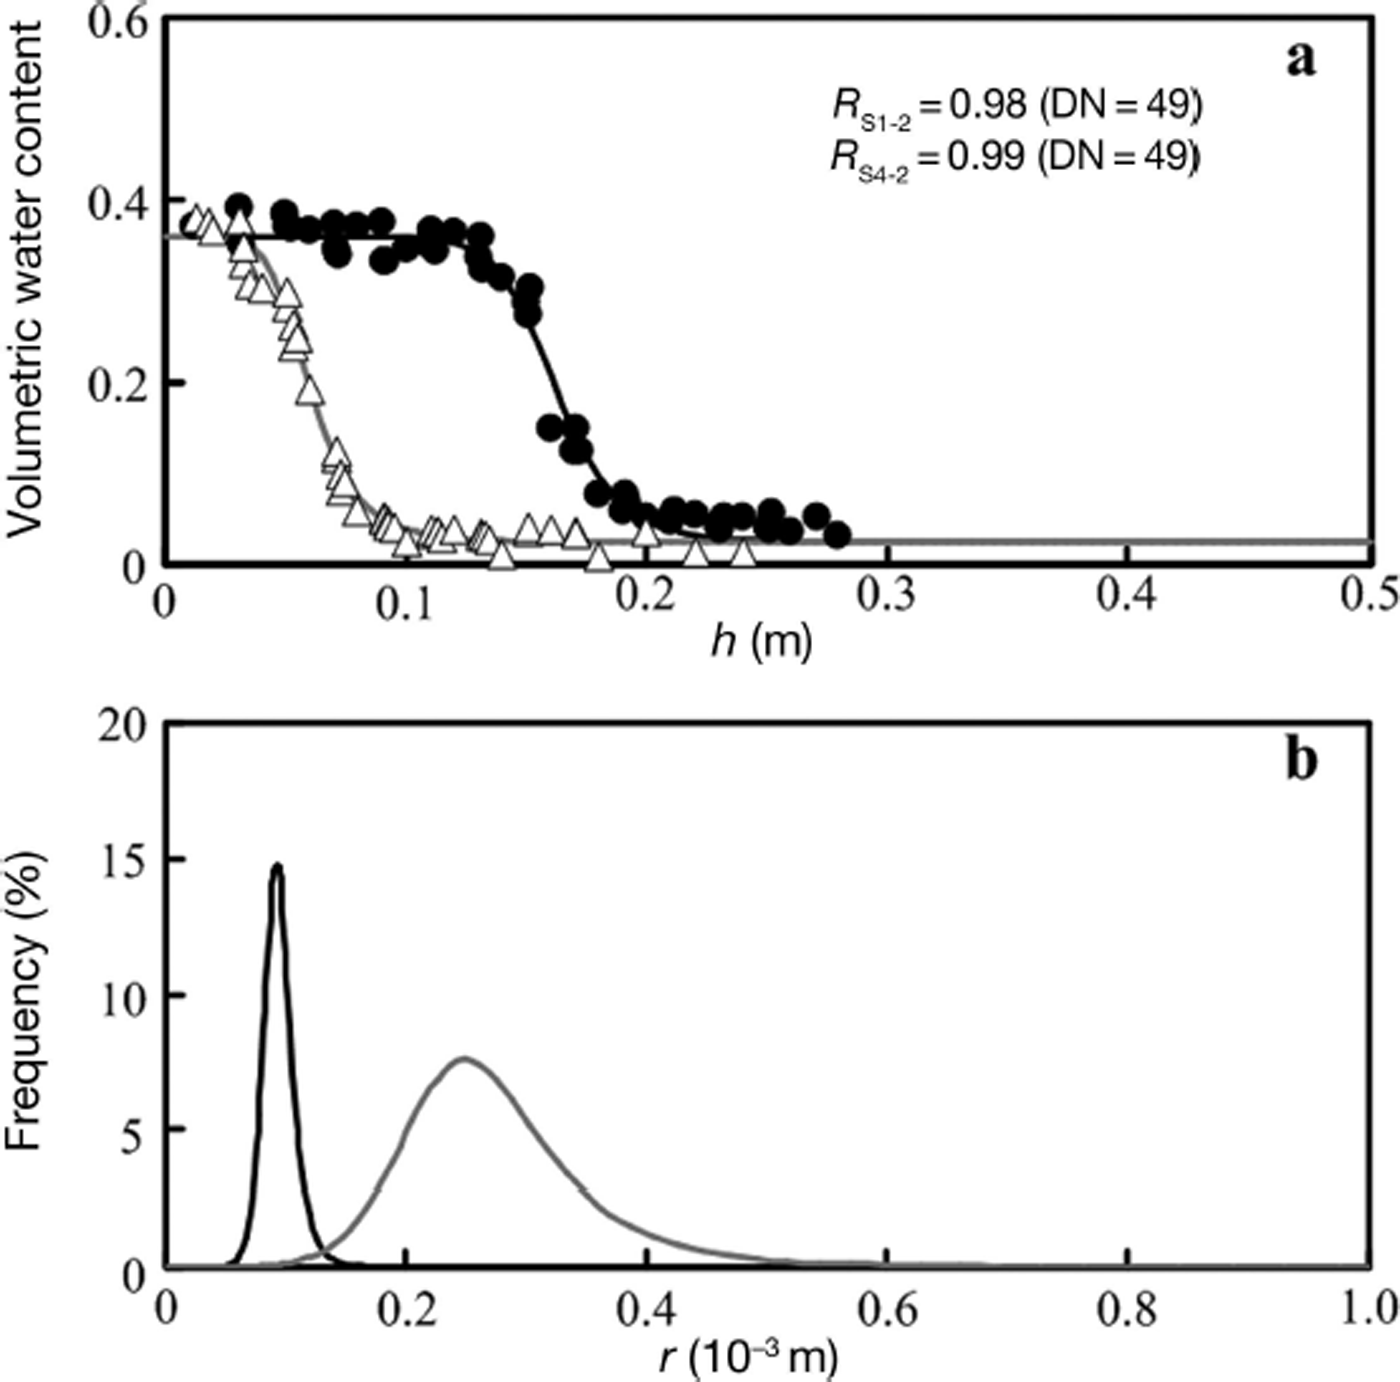
Fig. 1. Experimental and simulation results for samples with the same density but different grain sizes. (a) Experimental results with the modelled water retention curves. Black circles: measured results for S1-2 (d=0.5mm, ρ=555kgm–3). Black line: VG model simulation for S1-2. White triangles: measured results for S4-2 (d=2.1mm, ρ=547kgm–3). Grey line: VG model simulation for S4-2. (b) Frequency of the capillary tube plotted against all capillary tubes calculated from the VG model simulation. Black line: simulation for S1-2. Grey line: simulation for S4-2. DN is plotted data number.
The VG model is as follows:
where S
e is the effective saturation water content, h is suction, θv
is the volumetric water content, and ![]() and
and ![]() are the residual and saturated volumetric water content, respectively; these parameters determine the relationship between θv
and S
e, whereas α, n and m are parameters that affect the shape of the WRC. Although several formulas for the relationship between n and m have been suggested (Reference Van GenuchtenVan Genuchten, 1980; Reference Van Genuchten and NielsenVan Genuchten and Nielsen, 1985), we adopted the standard relationship m=1–(1/n). To fit the VG models to the measurements, we must determine the parameters
are the residual and saturated volumetric water content, respectively; these parameters determine the relationship between θv
and S
e, whereas α, n and m are parameters that affect the shape of the WRC. Although several formulas for the relationship between n and m have been suggested (Reference Van GenuchtenVan Genuchten, 1980; Reference Van Genuchten and NielsenVan Genuchten and Nielsen, 1985), we adopted the standard relationship m=1–(1/n). To fit the VG models to the measurements, we must determine the parameters ![]() ,
, ![]() , α and n. In this study, we adopted θr
v
=0.02 and θs
v
=10% less than the porosity for all samples based on Reference Yamaguchi, Katsushima, Sato and KumakuraYamaguchi and others (2010). Finally, parameters α and n of the VG models were determined by applying the models to the experimental results using the Retention Curve (RETC) software (Reference Van Genuchten, Leij and YatesVan Genuchten and others, 1991). The results of the VG model simulation were in good agreement with the experimental results (Figs 1a and 2a), indicating that the VG model is suitable for describing the WRC of snow.
, α and n. In this study, we adopted θr
v
=0.02 and θs
v
=10% less than the porosity for all samples based on Reference Yamaguchi, Katsushima, Sato and KumakuraYamaguchi and others (2010). Finally, parameters α and n of the VG models were determined by applying the models to the experimental results using the Retention Curve (RETC) software (Reference Van Genuchten, Leij and YatesVan Genuchten and others, 1991). The results of the VG model simulation were in good agreement with the experimental results (Figs 1a and 2a), indicating that the VG model is suitable for describing the WRC of snow.
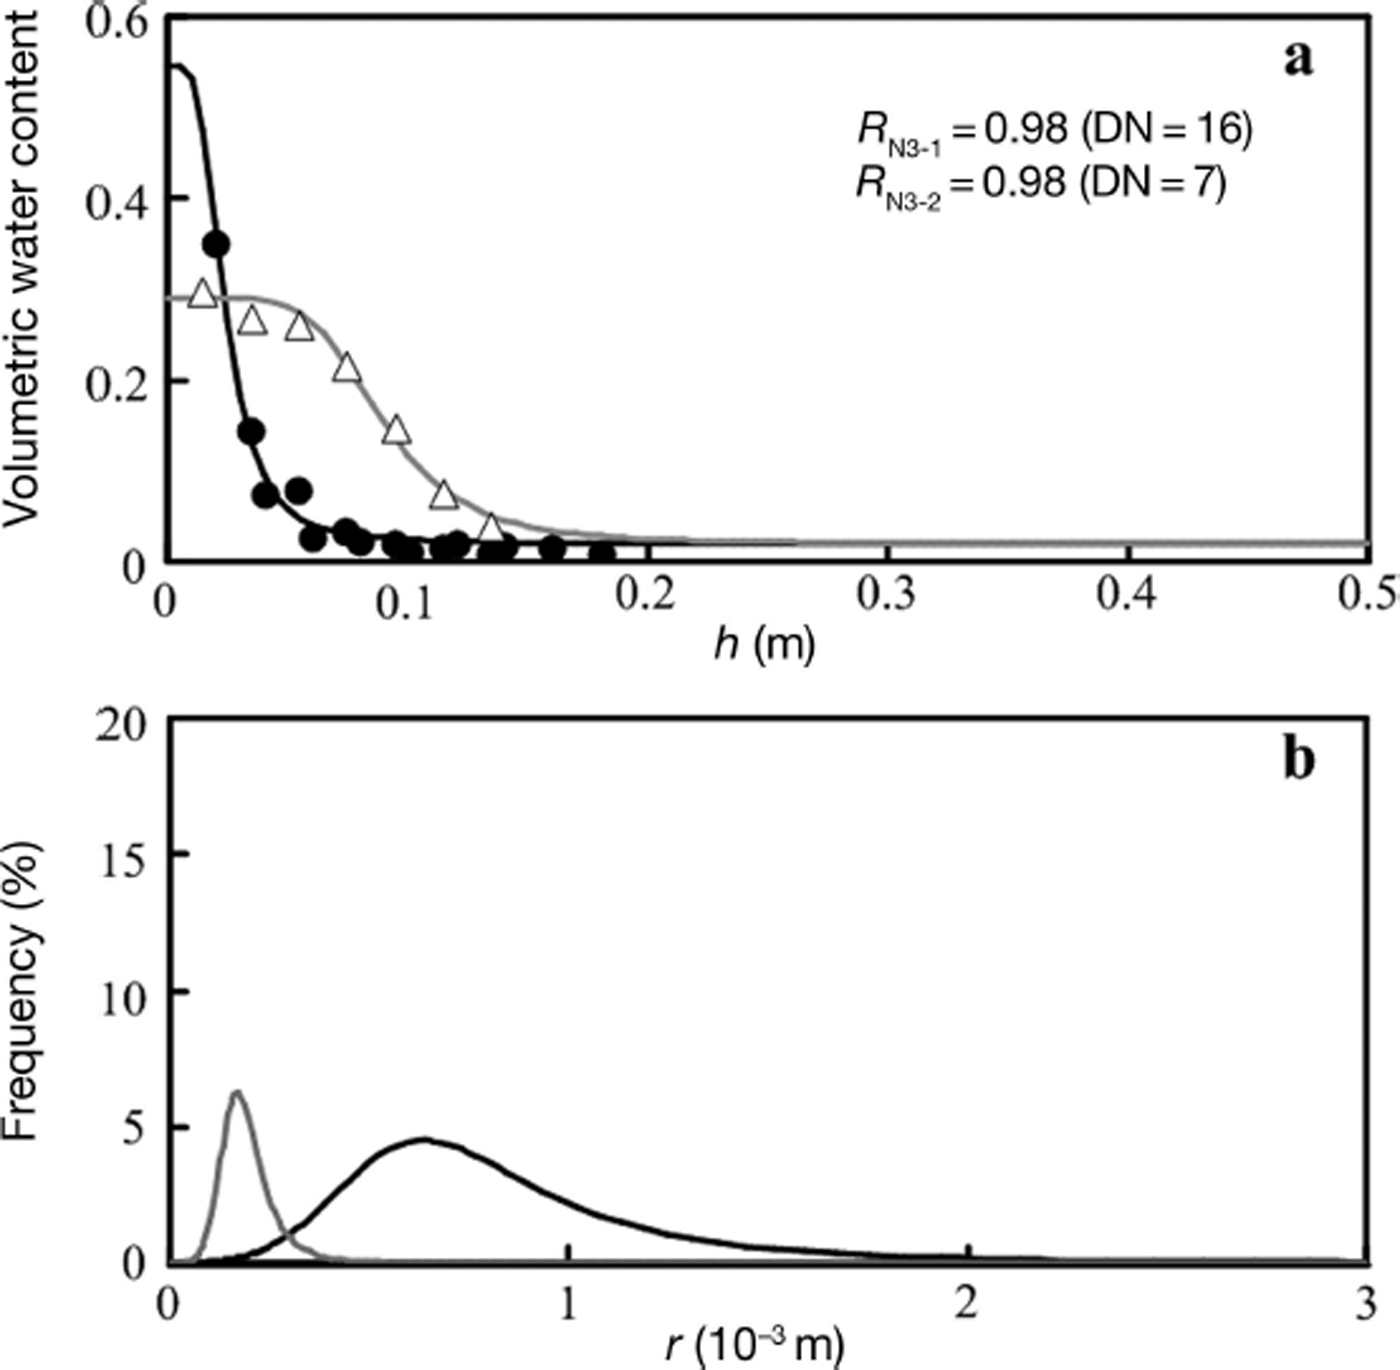
Fig. 2. Experimental and simulation results for samples with the same grain size but different densities. (a) Experimental results with the modelled water retention curves. Black circles: measured results for N3-1 (d=1.8mm, ρ=361kgm–3). Black line: VG model simulation for N3-1. White triangles: measured results for N3-2 (d=1.8mm, ρ=621kgm–3). Grey line: VG model simulation for N3-2. (b) Frequency of the capillary tube plotted against all capillary tubes calculated from the VG model simulation. Black line: simulation for N3-1. Grey line: simulation for N3-2. DN is plotted data number.
The WRC of a porous medium can be conceptualized using the capillary bundle model, in which pores are treated as a bundle of capillary tubes of varying sizes. Although this model differs in several ways from water flow in real media, it contains many of the properties of a real medium and may be used to understand the relationship between the WRC and the geometry of porous media (Reference Jury and HortonJury and Horton, 2004). Thus, we attempted to explain the difference between the WRC of two samples using the capillary bundle model theory. Because S e becomes 0 with the minimum capillary tube radius r min = 0 and becomes 1 with the maximum capillary tube radius r max, the probability density function of the contribution of each capillary tube, r, to the WRC, p(r), is defined as the differentiation of S e by r as follows:
The relationship between capillary tube radius, r, and suction, h, is described by the Laplace equation
Here is the surface tension of water (0.0073Jm–2) and β is the contact angle between water and ice particles (0˚C). Introducing Eqns (1) and (3) into Eqn (2), p(r) for the VG model is defined as (Reference MualemMualem, 1976; Reference KosugiKosugi, 1996; Reference Sakai and TorideSakai and Toride, 2009)
Finally, the ratio of capillary tubes with a diameter of r to all capillary tubes, F(r), is
Figure 1b shows F(r) calculated from the VG model simulations. The position of the peak of tube (pore) radius r for S1-2 (0.09mm) is smaller than that for S4-2 (0.25mm), and these values are approximately one order of magnitude smaller than the respective values of mean grain diameter d. Comparing the shapes of both F(r) distributions, the concentration ratio of r for S1-2 is narrower than that for S4-2, although both samples have the same bulk dry density. These calculated results imply that an increase in grain size causes an increase in pore size and a decrease in the uniformity of pore size.
Figure 2a shows the measured WRCs of the N-samples (N3-1 and N3-2) with the VG model simulations. Both N-samples originated in the same snow layer (melt forms and d=1.8mm), but their densities were different because N3-2 was tamped to obtain higher density. The bulk dry densities, ρ, of samples N3-1 and N3-2 were 361 and 621kgm–3, respectively (Table 1). The WRCs for the two samples differed markedly, although the grain size was the same. Figure 2b shows the F(r) calculated from each VG model simulation. The r peak of N3-1 (0.63mm) is larger than that of N3-2 (0.17mm). Their values are smaller than d (1.8mm), but the position of the r peak of N3-2 is approximately one order of magnitude smaller than d, which is the same trend as for S1-2 and S4-2, whereas that of N3-1 is only one-third smaller than d. These differences should be due to the bulk dry density difference: N3-1 is less dense than S1-2 and S4-2, whereas N3-2 is similar to S1-2 and S4-2. Therefore, the relationship between the position of r and d depends strongly on the sample bulk dry density. Comparing the shapes of F(r), the concentration ratio of r for N3-1 is wider than that for N3-2. This difference may result from the fact that large pores are most easily crushed as density increases with compaction.
3.2. Description of WRC of snow using grain size and bulk dry density
Having discussed that the WRC of snow changed with its grain size, d, and dry bulk density, ρ, we now consider the possibility of describing the WRC of snow using d and ρ. Reference Coléou and LesaffreColéou and Lesaffre (1998) introduced the parameter d/ρ to model the air-entry suction, h air, of snow, which is the point at which air enters a sample. Similar to their idea, we introduced a parameter ρ/d and examined its relationships to the parameters in the VG model. We adopted the inverse function compared to that of Reference Coléou and LesaffreColéou and Lesaffre (1998) because α in the VG model is related to the inverse of h air. To discuss the relationship between the parameters in the VG model and ρ/d, we examined the results for the S-samples with uniform grain size because some of the N-samples had various grain sizes (low uniformity) and a lower correlation coefficient for experimental measurements vs the fitted values of the VG model. Figure 3a and b show the relationships between the parameters α and n of the VG model and ρ/d (DN=20). Both α and n depend strongly on the value of ρ/d: α increases quickly as ρ/d decreases, whereas n increases with ρ/d. The VG model parameters have the following relationships to ρ/d with high correlation coefficients, R:
Fig. 3. Dependence of the parameters in the VG model on ρ/d for the S-samples. (a) α in the VG model. (b) n in the VG model. DN is plotted data number.
Having shown the good relationship between the parameters of the VG model and ρ/d, we consider the physical meaning of ρ/d. Assuming that the snow sample is composed of ice crystals with grain size d, ρ is described as
Here V 0 is the sample unit volume, N is the total number of ice crystals in the unit volume and ρ i is the density of ice. Introducing ρ/d into Eqn (8) gives
The right-hand side term in Eqn (9) is the total area of all ice crystal surfaces in the unit volume, i.e. the total surface area of all tubes (pores) in the unit volume. Therefore, ρ/d is nearly equivalent to the specific surface area of a unit volume of snow (SSAv). Because the specific surface area is thought to be an important physical property of snow (e.g. Reference Arakawa, Izumi, Kawashima and KawamuraArakawa and others, 2009), we investigated the use of another definition of specific surface area to describe the parameters α and n of the VG model; namely, we applied the total surface area per unit weight (SSAw) and made estimates using measured d and ρ i (SSAw=6/(dρ i)). The relationship between the parameters (α and n) and SSAw showed functions similar to those of Eqns (6) and (7), but their correlation coefficients, R, were lower than those of ρ/d (R=0.94 for α and R=0.89 for n). Moreover, SSAw is considered to have the greatest influence over d but not over ρ, which also controls the form of the WRC of snow (Fig. 2a). Based on these results, we considered that ρ/d, which is related to SSAv, is better than SSAw when describing the parameters in the VG model. We thus used ρ/d in ensuing analyses of samples of different densities.
Next, we examined the relationships between the parameters for the WRC of natural snow having a non-uniform grain size and ρ/d. Figure 4a and b present the relationships of the parameters α and n of the VG model for natural snow and ρ/d with the regression curves described using Eqns (6) and (7). Figure 4a shows a relationship similar to that of the S-samples between α and ρ/d, i.e. α increases as ρ/d decreases. A function similar to that of Eqn (6) (power function of ρ/d) was applied to describe α for all data for the N-samples (DN=41). A high correlation between α and the power function of ρ/d was obtained (R=0.72), although its coefficient and multiplier were different from those of Eqn (6). Analysis of each grain type showed that the melt forms had a high correlation coefficient (R=0.82 with DN=29), whereas the rounded grains had a low correlation coefficient (R=0.48 with DN=12). Therefore, the high correlation between α for all data of N-samples and ρ/d reflects the good relationship between the melt-form α values and ρ/d. In Figure 4b, the relationship between n and ρ/d differs for each grain type. For the melt forms, n shows a dependence on ρ/d that is similar to that of the S-samples (n increases as ρ/d increases) and has a high correlation coefficient (R=0.61) when a function similar to that of Eqn (7) (1 + power function of ρ/d) was applied in describing its relationship with ρ/d. On the other hand, n values for rounded grains appear to be independent of ρ/d and no correlation between n and ρ/d was observed (R = 0.04). These results suggest that the WRC of the melt forms in the snow-cover model can be modelled using d and ρ based on functions similar to those of Eqns (6) and (7), whereas we need to introduce another formula and/or a new parameter to describe the WRC of the rounded grains.
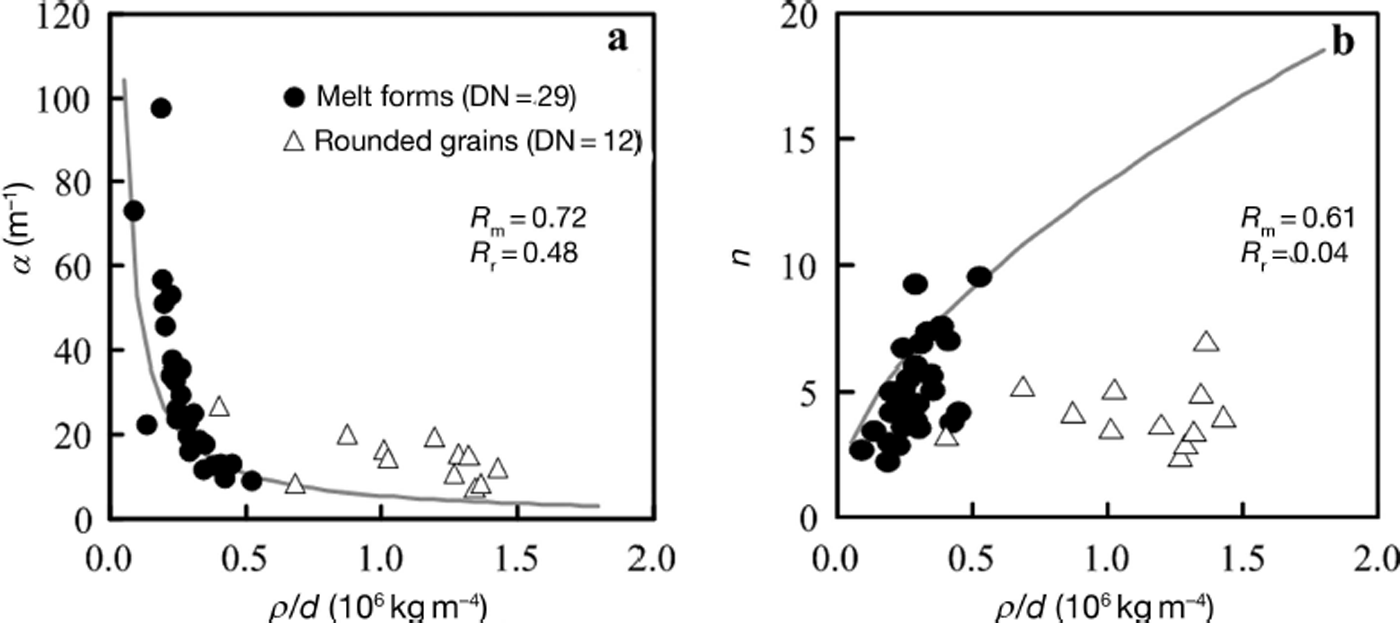
Fig. 4. Dependence of the parameters in the VG model on ρ/d for the N-samples. (a) α in the VG model. (b) n in the VG model. Black circles: results for melt forms. White triangles: rounded grains. Grey lines; regression curves calculated using Eqns (6) and (7). DN is plotted data number. R m is correlation coefficient of melt forms. R r is correlation coefficient of rounded grains.
We examined why the relationship between the two parameters and ρ/d depended on grain type. As shown in Table 1, the ranges of bulk dry density variation of melt forms and rounded grains in the N-samples are almost the same (300–600kgm–3), whereas the grain sizes, d, of rounded grains are obviously smaller than those of the melt forms (d of rounded grains: 0.5–1.0mm; d of melt forms: 1.0–4.0mm). Therefore, non-uniform grain size probably has a more important influence on pore-size uniformity for rounded grains than for melt forms because rounded grains have a small d. A decrease in pore-size uniformity should affect the values of α and n via the change in distribution of capillary tube diameter related to the shape of WRC (see Section 3.1). In fact, despite their non-uniform grain size, the melt forms of the N-samples show a dependence of α and n on ρ/d that is similar to that of the S-samples, which have a uniform grain size (Table 1). Another reason may be the effect of grain shape. The melt forms tended to be very round and sphere-like, whereas the rounded grains were of various shapes (e.g. elliptical). These differences may affect the parameterization results because we considered each grain to be a sphere. Moreover, there were many connections among grains, and cluster structures were locally present in the N-samples. These complicated structures could cause a mismatch between the real representative size of structures and mean grain diameter as determined by measurement of individual grains.
4. Conclusions
The dependence of WRCs on characteristics of snow (grain size, bulk dry density and grain type) was examined using various snow samples. The analyses using the VG model gave the following results:
1. The distribution of pore size depended strongly on the sample grain size, d, and bulk dry density, ρ. The position of the peak pore size decreased when d became smaller (ρ became larger), and the concentration ratio of pore size increased when d became smaller (ρ became larger).
2. The WRC of melt forms can be described as a function of ρ/d, whereas rounded non-uniform grains did not show a good relation with ρ/d. Therefore, we should consider not only d and ρ but also grain type when modelling the WRC of snow.
In this study, using simple ideas based on soil physics, we have shown the possibility of modelling the WRC of snow using its characteristics, but we have not yet established a model. To introduce the influence of grain type in the model, it is necessary to translate grain type into physical parameters. It may be useful to introduce the idea of ‘sphericity’, which is used in numerical snow-cover models (Reference Brun, Martin, Simon, Gendre and ColéouBrun and others, 1989, Reference Brun, David, Sudul and Brunot1992; Reference Lehning, Bartelt, Brown, Fierz and SatyawaliLehning and others, 2002a). The eventual establishment of a final model describing realistic water movement through snow cover and illustrating the dependence of hydraulic properties such as WRC and K on snow characteristics will require future experiments that incorporate the true porosity structure of real snow.
Acknowledgements
We gratefully acknowledge the comments of Y. Ishii and Y. Kodama of Hokkaido University and thank the members of the Snow and Ice Research Center, National Research Institute for Earth Science and Disaster Prevention, for helpful discussions. Helpful comments and suggestions from two anonymous reviewers and the scientific editor, B. Turnbull, are greatly appreciated. We also thank S. Nakatsubo of Hokkaido University for providing the experimental system used in this study. We are grateful to N. Tsuchida, who helped to analyse the distributions of the snow sample grain sizes.


