The ultimate aim of WHO, UNICEF, the World Bank as well as country-based institutions is to eradicate child malnutrition in all its forms( 1 ). However, although there is some promising progress in some countries, child undernutrition continues to be the most challenging and complex agenda globally, particularly in developing countries( Reference Black, Victora and Walker 2 ). Undernutrition can be characterized by stunting, wasting and underweight. In 2017, 151 million children under 5 years of age were stunted and 51 million were wasted globally( 1 ). Children under 5 years old are the most vulnerable group to be affected by undernutrition( Reference Bryce, Coitinho and Darnton-Hill 3 ). Previous studies reported that child undernutrition is the outcome of various factors including, but not limited to, insufficient food intake, micronutrient deficiencies, infectious disease, and other sociodemographic and economic factors( Reference Black, Victora and Walker 2 , Reference Mshida, Kassim and Mpolya 4 ).
Undernutrition generally impairs growth and development of children. Children who grow in settings with insufficient material and social resources are unlikely to achieve their full growth and development potential( Reference Black, Victora and Walker 2 , Reference Perkins, Kim and Krishna 5 ). The effects of nutritional insult as well as other social and economic burdens in early childhood do not stop there. Consequences could range from increased susceptibility to infection, cognitive deficit and poor economic productivity to increased risk of death( Reference Scharf, Rogawski and Murray-Kolb 6 , Reference McGovern, Krishna and Aguayo 7 ).
Undernutrition is highly prevalent in Africa, particularly in sub-Saharan Africa, and is a major cause of childhood deaths from pneumonia, malaria, measles and diarrhoea( Reference Akombi, Agho and Merom 8 , Reference Caulfield, de Onis and Blossner 9 ). In Ethiopia, child undernutrition continues to be a public health problem although some improvements have been reported recently( Reference Statistical Agency 10 , Reference Abdulahi, Shab-Bidar and Rezaei 11 ). Recent reports indicated that the prevalence of stunting decreased from 58 % in 2000 to 36–38 % in 2016, the prevalence of underweight decreased from 40 to 24 % in the same time period but the prevalence of wasting worsened from 6 to 10 %( 1 , Reference Statistical Agency 10 ). The Ethiopian Government has allocated huge resources in the last couple of decades aiming at improving the poor nutritional status of children in the country and, in fact, significant changes have been observed. However, the rates are still unacceptably high by any standard. This calls for the need to understand the key predictors as a first step to devise strategies in reducing this most pressing public health problem. Most economics literature presupposes that the underlying determinant factor for improved nutrition is economic growth( Reference Vollmer, Harttgen and Subramanyam 12 , Reference Ali, Saha and Nguyen 13 ). Studies from different parts of Ethiopia associate the high rate of undernutrition with both individual and household factors including, but not limited to, family size, maternal age, maternal education, food insecurity, breast-feeding patterns, area of residence, and other socio-economic and demographic factors( Reference Alemu, Ahmed and Yalew 14 – Reference Abebe, Zelalem Anlay and Biadgo 16 ). Most of these findings were based on analyses made using children under 5 years as one group. However, nutritional status and growth patterns are different at different ages as a result of changes in care practices, feeding patterns, immunity, physical activity, income level and other related factors. To the best of our knowledge, no national-level study has been conducted so far based on separate analyses of undernutrition in two age groups of children in Ethiopia. The present study therefore examines the differential effects of three sets of predictors (household, maternal and child variables) on the nutritional status of younger (0–24 months) and older age groups (25–59 months).
Data source and methodology
Study context
Ethiopia is the second most populous country of Africa, next to Nigeria, with an annual population growth rate of about 2·6 %. Over the last few decades, Ethiopia’s economy has grown at an annual rate of approximately 10 % but nearly a third of its population still lives below the poverty line( Reference Statistical Agency 10 ). Administratively, Ethiopia is a Federal Democratic Republic with nine autonomous Regional States, each divided into zones, districts and sub-districts/kebeles. Agriculture has been the main driver for the fast-growing Ethiopian economy and is also responsible for 85 % of total employment( 17 ). Despite a remarkable decline in the last few years, child undernutrition has long been a major public health concern( Reference Statistical Agency 10 ).
Data sources
We used the Ethiopian Demographic and Health Survey (DHS) for 2016. The 2016 survey is the fourth nationally representative sample survey carried out by the Central Statistical Agency under the guidance of the Ministry of Health. DHS are cross-sectional data sets containing comparable household and individual information about sociodemographic characteristics and health indicators including child health and nutrition. A total of 9696 cases were used for the current analysis, a size of 4199 for children aged 0–24 months and 5497 for those aged 25–59 months. All children under age 5 years of age who were eligible for height and weight measurements were eligible for the DHS data collection.
Ethics statement
The DHS follow well-defined standard protocols, data collection tools and procedures. Permission to use the data for the purposes of the present study was granted by ORC Macro International (USA) and the Central Statistics Authority (Ethiopia).
Variables and measures
Child malnutrition was measured using height-for-age Z-score (HAZ), weight-for-age Z-score (WAZ) and weight-for-height Z-score (WHZ) based on a standard cut-off points proposed by the WHO( 18 ). Children were categorized into stunted (HAZ<−2), underweight (WAZ<−2) and wasted (WHZ<−2).
We used nineteen explanatory variables for stunting, wasting and underweight which were categorized into three broad sets of factors, namely child characteristics (six variables), maternal factors (six variables) and sociodemographic variables (seven variables). The variables were selected based on review of previous literature and model-fitting criteria. Information on parental education was measured as the reported number of years of maternal/paternal education and then allocated within conventional educational categories (e.g. no education, primary, secondary and post-secondary education). Household wealth was used as a proxy for household income and was estimated in the DHS with an asset-based index that combines information about ownership of consumer goods, housing quality, and water and sanitation facilities( Reference Rustine and Rojas 19 ). The entire sample of children under 5 years was ranked into successive quintiles from the first quintile (Q1=the poorest households) to the fifth quintile (Q5=the richest households)( Reference Rustine and Rojas 19 ). Antenatal care was measured based on the WHO standard definition which recommends pregnant women to have at least four antenatal visits for a safe delivery( 20 ). Mothers’ BMI was computed using height and weight; BMI values of 18·5–24·9 kg/m2 were defined as normal and BMI<18·5 kg/m2 was defined as underweight (mild, moderate and severe included). BMI=25·0–29·9 kg/m2 and BMI≥30·0 kg/m2 were defined as overweight and obese, respectively. The remaining explanatory variables were measured dichotomously using the table in the data.
Statistical analysis
We analysed the data using the statistical software package IBM SPSS Statistics version 23. All analyses were weighted for the sampling probabilities. Descriptive analysis was used to examine the characteristics of the study sample. Multivariate logistic regression analyses were used to examine the associations between the explanatory variables listed above and the three outcome variables. Thus, three separate regression models were fitted using stepwise selection for each of the two age groups (0–24 months and 25–59 months). The inclusion of the explanatory variables in the regression analysis was partly guided by previous research and model-fitting procedures. Multicollinearity among the explanatory variables was checked using the variance inflation factor and those variables with variance inflation factor greater than 2·5 were removed. The Hosmer–Lemeshow test was used to check the model fit. OR of being undernourished were calculated with 95 % CI for each factor in the logistic regression model. Statistical significance was declared if the P value was less than 0·05.
Results
Characteristics of study participants
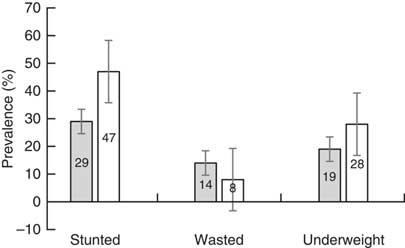
Table 1 shows that nearly 51 % of the younger age group were girls and 52 % of the older age group were boys. About the same percentage (42 and 43 %) of children in both age groups had average size at birth. Of the children, 39 % of the younger and 36 % of the older age group received a zinc tablet, and 41 % of the younger and 48 % of the older group received a vitamin A supplement in the six months preceding the survey. Diarrhoeal medical treatment was given to 52 % of the younger and 44 % of the older age group. Nearly 74 % of the younger and 53 % of the older age group had anaemia. The majority of the children in both groups ever had vaccination and were breast-feeding at the time of the interview. The mothers reported that 16·1 % of the younger children and 15·3 % of the older children were given no food other than breast milk in the first three days after delivery, and a nearly equal percentage of the children drank from a bottle with a nipple the day before the interview (Table 1). The children’s prevalence of stunting, wasting and underweight is presented in Fig. 1. Of the children, both groups combined, 16 % were severely stunted, 8 % were severely wasted and 3 % were severely underweight.
Health, nutrition and demographic characteristics of children aged 0–24 months and 25–59 months. Demographic and Health Survey data, Ethiopia, 2016 (n 9696)

† Zinc tablet given any time since started diarrhoea.
‡ Diarrhoea medical treatment given any time when child has diarrhoea.
§ ‘In the first three days after delivery, was the child given anything to drink other than breast milk?’
║ Currently breast-feeding refers to a 24 h period (yesterday and last night).
Prevalence of stunting, wasting and underweight, with their 95 % confidence intervals represented by vertical bars, in children aged 0–24 months (![]() ) and 25–59 months (
) and 25–59 months (![]() ). Demographic and Health Survey data, Ethiopia, 2016 (n 9696)
). Demographic and Health Survey data, Ethiopia, 2016 (n 9696)

As shown in Table 2, there were no substantial differences in most socio-economic and demographic characteristics between the two groups. The majority of respondents in both groups were rural inhabitants. The mean age of mothers was 28 (sd 6·4) years in the younger group and 30 (sd 6·4) years in the older group of children. Most of the mothers experienced at least one teenage pregnancy as they gave their first birth before age 19 years. Of the mothers of the younger and older children, respectively 60 and 67 % had no formal education. More than half of the mothers were in the poorer and poorest wealth categories. About 24 % of the mothers were underweight (BMI<18·5 kg/m2), 7·5 % were overweight (BMI≥25·0 kg/m2) and 2·2 % were obese (BMI≥30·0 kg/m2). The majority of the women delivered their most recent birth at home, and a significant proportion of them had antenatal care during pregnancy. Prevalence of anaemia among the women was 35 %. Most households did not have access to a piped water source in or around their homestead (Table 2).
Health, demographic and socio-economic characteristics of mothers by age group of children. Demographic and Health Survey data, Ethiopia, 2016 (n 9696)

Predictors of childhood undernutrition in Ethiopia
Child factors
As shown in Table 3, child’s sex, birth size, anaemia, receiving multiple micronutrient powder, drinking from a bottle and source of drinking-water were associated with at least one of the three forms of childhood undernutrition. In the younger age group, the likelihood of stunting was lower for female children by 26 % (OR=0·74; 95 % CI 0·63, 0·87). Female children also had lower likelihood of being wasted by 20 % (OR=0·80; 95 % CI 0·65, 0·99) and underweight by 29 % (OR=0·71; 95 % CI 0·59, 0·85). Consuming multiple micronutrients at a younger age was associated with a decrease in the odds of being stunted by 49 % (OR=0·51; 95 % CI 0·27, 0·93), wasting by 38 % (OR=0·62; 95 % CI 0·42, 0·92) and underweight by 12 % (OR=0·88; 95 % CI 0·75, 1·03). Anaemic children were 1·54 (95 % CI 1·19, 2·00) times more likely to be wasted and 1·30 (95 % CI 1·05, 1·61) times more likely to be underweight. The likelihood of stunting, wasting and underweight was 1·71 (95 % CI 1·37, 2·12), 2·13 (95 % CI 1·61, 2·81) and 2·28 (95 % CI 1·79, 2·91) times greater for low-birth-weight children than for children with normal birth weight. Children who drank from a bottle were 1·64 (95 % CI 1·10, 2·50) times more likely to be stunted and 1·55 (95 % CI 1·17, 2·01) times more likely to be underweight. Children living in households with a piped source of drinking-water were less likely to be stunted (OR=0·46; 95 % CI 0·22, 0·76), wasted (OR=0·39; 95 % CI 0·20, 0·57) or underweight (OR=0·84; 95 % CI 0·77, 1·01) in the younger age group and less likely to be underweight (OR=0·49; 95 % CI 0·35, 0·67) in the older age group.
Correlates of undernutrition among children aged 0–24 months and 25–59 months: child factors. Demographic and Health Survey data, Ethiopia, 2016 (n 9696)
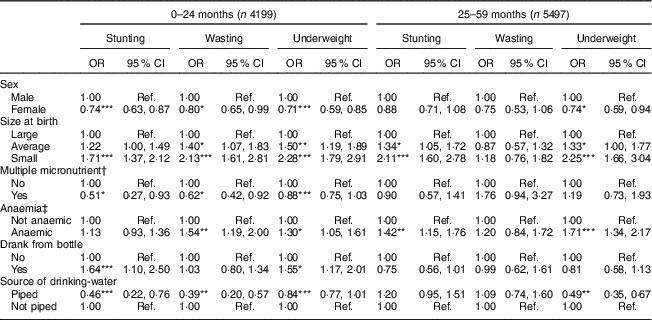
Ref., reference category.
*P<0·05, **P<0·01, ***P<0·001.
† Multiple micronutrient refers to intake of multiple micronutrient powder in the last 7 d.
‡ Not anaemic, Hb≥11 g/dl; anaemic, Hb<11 g/dl.
In the older age group, female children were less likely to be underweight than male children. Anaemic children were 1·42 (95 % CI 1·15, 1·76) times more likely to be stunted and 1·71 (95 % CI 1·34, 2·17) times more likely to be underweight. Children with low and average perceived birth weight, compared with those having large birth weight, were more likely to be stunted and underweight. The odds of underweight were lower by 51 % for children living in households having a piped drinking-water source (OR=0·49; 95 % CI 0·35, 0·67; Table 3).
Maternal health and nutrition factors
As shown in Table 4, maternal BMI, stature, source of drinking-water and antenatal care were significantly associated with at least one of the three forms of childhood undernutrition. In the younger group of children, the odds of stunting, wasting and underweight were lower for those whose mothers had higher BMI (≥25·0 kg/m2) by 75 % (OR=0·25; 95 % CI 0·11, 0·55), 80 % (OR=0·20; 95 % CI 0·04, 0·96) and 95 % (OR=0·05; 95 % CI 0·01, 0·41), respectively, compared with children whose mothers had lower BMI (BMI<18·5 kg/m2). Among the younger children, the odds of stunting and wasting were higher by 2·21 (95 % CI 1·52, 3·16) and 1·81 times (95 % CI 1·16, 2·81), respectively, for those with short-stature mothers compared with children whose mothers had normal stature. The odds of stunting and underweight were lower by 32 and 43 %, respectively, for children living in households with improved water sources (piped). Maternal antenatal care was another important predictor of stunting, where the likelihood of stunting decreased by 37 % for the children of mothers who received at least four antenatal clinic visits during their last pregnancy. Among the older group of children, maternal BMI, stature and household source of drinking-water were significantly associated with at least one form of childhood undernutrition. Children of mothers with high and normal BMI, and those living in households with a piped source of drinking-water were less likely to become stunted and underweight (Table 4).
Correlates of undernutrition among children aged 0–24 months and 25–59 months: maternal health and nutrition factors. Demographic and Health Survey data, Ethiopia, 2016 (n 9696)

Ref., reference category.
*P<0·05, **P<0·01, ***P<0·001.
† Iron supplement refers to iron supplement during pregnancy.
‡ Not anaemic, Hb≥12 g/dl; anaemic, Hb<12 g/dl.
Household socio-economic and demographic factors
The analysis results in Table 5 show that maternal age, area of residence, wealth index, maternal education, parity and mother’s work were significantly associated with at least one of the three forms of childhood undernutrition. In the regression model for the younger group of children, the odds of stunting were 1·59 times higher (95 % CI 1·17, 2·16) for those with older mothers compared with children with younger mothers. Children living in rural areas were 34 % less likely to become wasted (OR=0·66; 95 % CI 0·47, 0·92). Similarly, the odds were lower for children living in wealthier households and/or having an educated mother. The odds of stunting and underweight were lower by 62 % (OR=0·38; 95 % CI 0·21, 0·69) and 58 % (OR=0·42; 95 % CI 0·22, 0·83), respectively, for children with mothers having a higher education level. Children of mothers with primary and secondary education were also less likely to be wasted and underweight compared with children whose mothers had no education. Children having working mothers were 1·24 times more likely to be stunted and 1·19 times more likely to be underweight. The likelihood of wasting was 1·33 times greater (95 % CI 1·03, 1·71) for children living with a larger number of siblings. We observed nearly similar patterns of predictors in the older age group of children except for a few variables. Maternal age was significantly associated with childhood wasting and underweight, and maternal age at first birth was associated with childhood stunting. Contrary to the results for the younger age group, those older children living in rural areas were 1·35 times more likely to be stunted and 1·69 times more likely to be wasted than their urban counterparts. The odds of stunting were higher for children of mothers with no education, children living in impoverished households and children having working mothers. Children living with a large number of siblings were 1·67 times more likely to be wasted compared with those living with a smaller number of siblings (95 % CI 1·17, 2·38; Table 5).
Correlates of undernutrition among children aged 0–24 months and 25–59 months: household socio-economic and demographic factors. Demographic and Health Survey data, Ethiopia, 2016 (n 9696)

Ref., reference category.
*P<0·05, **P<0·01, ***P<0·001.
Discussion
The present study demonstrated the prevalence and key predictors of malnutrition (stunting, wasting and underweight) among children under 5 years of age in Ethiopia based on nationally representative data for the year 2016. Our analysis revealed that prevalence of undernutrition among both older and younger age groups of children was unacceptably high by any standard. The figures are much higher compared with other comparable recent studies in sub-Saharan Africa. For instance, a study in Kenya reported that prevalence of stunting, wasting and underweight was 30, 8 and 13 %, respectively( Reference Gewa and Yandell 21 ). While there was encouraging progress in reducing the prevalence of stunting over the past 5 years from 44 % in 2011 to 38 % in 2016, there was little change in the prevalence of underweight and in fact the country experienced a slight increase (1 %) in the prevalence of wasting( Reference Statistical Agency 10 ).
The current analysis showed a wide range of socio-economic and demographic factors explaining the fairly high levels of undernutrition among both the younger and older children in Ethiopia. It appeared that the predictors and/or risk factors followed a similar pattern across the two age groups. However, child factors had higher leverage in the younger group across the three forms of undernutrition compared with their effects on the outcome variables in the older children.
Our results showed that female children were less likely to be stunted, wasted or underweight across both age groups, which is in accordance with other studies conducted in Africa( Reference Gewa and Yandell 21 , Reference Rakotomanana, Gates and Hildebrand 22 ). There is no ample evidence on sex differentials in nutritional status but some argue that males are more vulnerable to environmental stress than females in their early life, and this in itself could increase incidence of morbidity and mortality even in later life( Reference Wells 23 ). Others argue that the genetic difference between the two sexes favours female children to grow and survive better than males( Reference Decaro, Decaro and Worthman 24 ). Moreover, the role of oestrogen and insulin-like growth factor (IGF-I) in human growth would probably be worth investigation( Reference Nilsson, Weise and Landman 25 , Reference Lofqvist, Andersson and Gelander 26 ). From the cultural point of view, older females in most developing societies have the habit of staying at home while males usually engage in energy-requiring outdoor physical activities. In a few studies, it has been reported that caregiving practices to female and male children are different and it was assumed that this could be a factor contributing to the differences in nutritional status of the two sexes( Reference Gewa and Yandell 21 , Reference Begin, Frongillo and Delisle 27 ).
Child birth weight was associated with the three forms of undernutrition in both age groups. Those with average and small birth weight were at higher odds of becoming undernourished. Several studies from low- and middle-income countries have reported that birth weight and length are positively associated with better growth( Reference Sachdev, Fall and Osmond 28 , Reference Adair 29 ). Unless the condition is reversed by catch-up growth, it will continue to affect the growth, immunity and even cognitive development of the individual, even at adult age( Reference Newsome, Shiell and Fall 30 – Reference Gigante, Nazmi and Lima 32 ). However, getting successful compensatory growth requires an improved living condition including good nutrition, good care practices and conducive environment. Children born in India and brought up in Sweden through adoption have shown significant catch-up growth as a result of improved living conditions( Reference Martorell, Khan and Schroeder 33 – 35 ). Intervention studies evidenced that nutrition interventions during pregnancy and early childhood improved the nutritional status of children as well as adults( Reference Martorell, Khan and Schroeder 33 , Reference Bhutta, Ahmed and Black 36 , Reference Chaudhary, Govil and Lala 37 ).
The present study showed the important role of anaemia on the nutritional status of children in Ethiopia. It is noted that the majority of the children were anaemic, particularly those in the young age group. Anaemia is characterized by a decline in the number of red blood cells, resulting in insufficient carrying capacity to meet physiological needs( 38 ). Iron deficiency is the most common cause globally, but anaemia can also be caused by other nutritional deficiencies such as vitamin B12, folate and vitamin A, as well as by inflammation and parasitic infection( 38 ). In infants and young children, anaemia may lead to delayed growth and has long-term effects on neurodevelopment and behaviour( Reference Lozoff 39 , Reference Shafir, Angulo-Barroso and Calatroni 40 ). Evidence has shown that iron-deficiency anaemia alters growth by hindering energy metabolism and myelination( Reference Soliman, De Sanctis and Kalra 41 ). Treatment of iron-deficiency anaemia with oral iron supplements showed a significant increase in weight velocity and decreased rate of stunting( Reference Aukett, Parks and Scott 42 – Reference Queiroz, Assis and Pinheiro 44 ). Other studies confirmed that correction of anaemia is associated with decreased incidence of diarrhoea, fever and respiratory tract infection( Reference Angeles, Schultink and Matulessi 43 , Reference Chwang, Soemantri and Pollitt 45 ).
In our analysis, drinking from a bottle and utilizing water from an unprotected source were associated with stunting, wasting and underweight among the young age group. Similar results have been reported from Tanzania( Reference Chirande, Charwe and Mbwana 46 ). In places where hygiene and sanitation are poor, children are highly exposed to parasitic and bacterial infection followed by severe diarrhoea. Diarrhoea can have a detrimental impact on child growth( Reference Richard, Black and Gilman 47 ). In Ethiopia, unhygienic bottle-feeding practices and unsafe sources of drinking-water have been commonly reported causes of diarrhoea( Reference Eshete 48 , Reference Haile and Biadgilign 49 ). Our analysis showed that 16 % of the children from both groups have drank from a bottle the day prior to the data collection.
Receiving micronutrient powder resulted in lower odds of stunting, wasting and underweight in the younger children aged 0–24 months. It was reported that growth hormone is highly regulated by nutrition( Reference Denny-Brown, Stanley and Grinspoon 50 ) and some studies showed that micronutrient intake improves early growth particularly in preterm infants( Reference Sjöström, Szymlek-Gay and Öhlund 51 , Reference Stoltz Sjostrom, Ohlund and Ahlsson 52 ). It has been suggested that supplementation with multiple micronutrients rather than a single nutrient is more effective for catch-up growth in preterm and term infants( Reference Cho, Kim and Yang 53 ). On the other hand, micronutrient deficiencies can alter growth( Reference Rivera, Hotz and Gonzalez-Cossio 54 ). Despite lack of a clear definition of individual micronutrients included in the multiple micronutrients in the current data, analyses show that some micronutrient deficiencies such as zinc, iron and vitamin A are associated with stunting, wasting and underweight( Reference Rivera, Hotz and Gonzalez-Cossio 54 , 55 ). For this reason, the WHO has recommended all severely malnourished infants and children should receive adequate vitamins and minerals( 56 ).
Maternal nutritional status was significantly associated with at least one form of undernutrition across the two child age groups. Having normal or high maternal BMI was associated with lower odds of stunting, wasting and underweight. This is consistent with findings from other parts of the world such as Brazil, Madagascar, Kenya and others( Reference Gewa and Yandell 21 , Reference Rakotomanana, Gates and Hildebrand 22 , Reference Felisbino-Mendes, Villamor and Velasquez-Melendez 57 ). This association could be explained by environmental and genetic factors. In developing countries, maternal BMI could be a proxy for food security status and overall well-being of households. In a poor environment where food availability is limited, nutritional status of household members could be affected in a similar way. Various studies have confirmed that maternal BMI is a major predictor of children’s BMI and also has an intergenerational effect on the nutritional status of children( Reference Lourenco, Villamor and Augusto 58 – Reference Schack-Nielsen, Michaelsen and Gamborg 60 ).
The effect of maternal genetic influence on the offspring’s nutritional status in the first 1000 days, particularly in determining children’s height, is substantial. Poor maternal nutrition, health care and other environmental conditions could cause detrimental effects in children from an early age as well as in adulthood( Reference Young and Nguyen 61 ). In fact, it has been noted that maternal nutritional status in her own childhood could affect her offspring’s body weight, linear growth as well as cognitive function( Reference Addo, Stein and Fall 62 – Reference Veena, Gale and Krishnaveni 64 ). Interestingly, in our analysis, children of mothers with short stature were more likely to be short and underweight but not wasted in both age groups. Maternal anaemia was not associated with any form of child undernutrition. However, attending maternal antenatal care was associated with lower odds of stunting.
Our findings showed that older mothers were more likely to have stunted children for the younger age group and less likely to have wasted and underweight children for the older age group. However, in a prospective study it was reported that children of older mothers have advantages in nutritional status over children of younger mothers( Reference Fall, Sachdev and Osmond 65 ). Children residing in rural areas were less likely to be wasted at younger age and more likely to be stunted and wasted at later age. In rural areas, mothers work at home which gives them chance to exclusively breast-feed their newborn baby, with breast milk being sufficient to meet the nutritional needs of the child during the first six months. Not only a nutritional need, breast milk protects the infant against infection and chronic diseases( Reference Gertosio, Meazza and Pagani 66 , Reference Binns, Lee and Low 67 ). As the child starts to grow, however, meeting her/his increased nutritional needs requires money and knowledge for increased availability of foods and access to health care. Our analysis indicated that children residing in rich households and/or having educated mothers were less likely to be affected by any form of undernutrition. Other studies done in other countries reported similar results( Reference Gewa and Yandell 21 ). Having more persons in a household was positively associated with stunting and wasting across the age groups. In a resource-limited area, it is not surprising that the scarce amount of food available will not be enough to maintain healthy nutritional status of rapidly growing children and having an increased number of household members makes it worse.
Strengths and limitations
The current study is helpful in increasing our understanding of child malnutrition in Ethiopia. The findings could prove useful on a national scale in assessing progress in the fight against child malnutrition and serve as an important resource for the planning, targeting, monitoring and evaluating future health promotion programmes. The present study also has some methodological limitations. Because the data were collected from mothers, most of whom had no education, some omission, under-reporting or improper reporting of important exposure variables (such as her age, age of the child) might have affected the analysis results. Also, the cross-sectional nature of the DHS data significantly limits analysis of causality between the explanatory and outcome variables presented.
Conclusion and policy implications
In conclusion, our analysis demonstrated high prevalence of stunting, wasting and underweight in children under 5 years old in Ethiopia. This was worsened by a large proportion of the young children being anaemic. The study identified multiple set of factors (including child, maternal and household socio-economic and demographic factors) as key predictors of childhood undernutrition in Ethiopia. Child- and maternal-related factors appeared to have relatively higher weight in all the three forms of undernutrition in the younger age group compared with the older one. This could be due to a carryover effect of pregnancy that was reflected at the early stage of life and could continue to later age depending on measures taken to achieve catch-up growth. The positive and negative outcomes of this period are highly dependent not only on the child but also on the mother’s health and nutritional status. Based on the evidence presented above, the present study thus underscores the importance of taking various cost-effective preventive measures during the first 1000 days as this is the most critical period for child health and survival. The current study also recommends promotion of maternal education, improving mothers’ economic status (especially through gainful employment opportunities), access to maternal–child health services, promoting increased food access to all family members, and improving intrahousehold food distribution and eating habits.
Acknowledgements
Acknowledgements: The authors acknowledge ORC Macro for making the DHS data available. Financial support: This research received no specific grant from any funding agency in the public, commercial or not-for-profit sectors. Conflict of interest: None. Authorship: Both T.G. and N.R. were responsible for data analysis and writing this paper. Ethics of human subject participation: Not applicable.