


Introduction
It has been hypothesised that an increase in subglacial eruptions and their consequent jökulhlaups (glacial outburst floods) could result from a deglaciation-driven glacio-isostatic response of the Earth's mantle (Pagli and Sigmundsson, Reference Pagli and Sigmundsson2008; Carrivick and others, Reference Carrivick2009). If correct, this process would increase the already high potential for volcano–ice interactions within Iceland, given that over 60% of Icelandic ice masses overlie active volcanic zones (Björnsson, Reference Björnsson2002). Understanding the response of the landscape following deposition from large outburst floods is a vital step for assessing future jökulhlaup routing and the identification of jökulhlaup hazard potential (Cassidy and others, Reference Cassidy2003; Duller and others, Reference Duller, Mountney, Russell and Cassidy2008). Burial of glacier ice, and deposition of jökulhlaup-transported ice (from ice blocks to sediment–ice slurries), occurs frequently during jökulhaups (Fay, Reference Fay2002a,Reference Fay2002b; Burke and others, Reference Burke, Woodward and Russell2010). The meltout of buried ice masses, following jökulhlaup deposition, can lead to widespread surface lowering and the formation of kettle holes (Maizels, Reference Maizels1992).
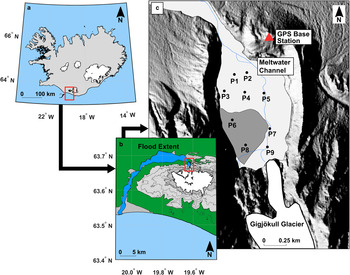
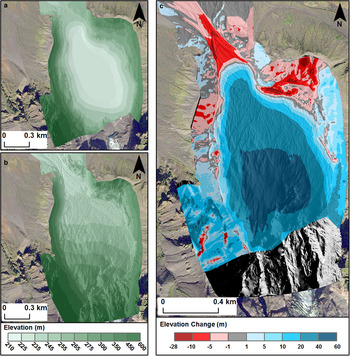
The 2010 eruption of Eyjafjallajökull (14 April to 22 May) generated numerous jökulhlaups that inundated the Gígjökull proglacial basin (Fig. 1), infilling it with large volumes of sediment and ice (Magnússon and others, Reference Magnússon2012). The two highest magnitude floods occurred during 14–16 April, with peak discharges of up to 2700 m3 s−1 and a combined volume of flood water totalling 57 × 106 m3 (Magnússon and others, Reference Magnússon2012). Over 140 smaller jökulhlaups were recorded during the rest of the eruption, with discharges between 10 and 226 m3 s−1 and water volumes up to 3 × 10⁶ m3 (Dunning and others, Reference Dunning2013). Following the eruption and jökulhlaups, the Gígjökull basin was characterised by a ~60 m-thick sequence of coarse fluvioglacial sediment and flood-transported glacier ice, underlying a steeply-sloping progradational fan surface (Fig. 2) (Dunning and others, Reference Dunning2013). Initial estimates indicated a total deposited sediment volume of $\sim \!\! 17 \times 10^{6}\, {\rm m}^{3}$ , although the partitioning between sediment and ice within the deposit is uncertain (Dunning and others, Reference Dunning2013). Field observations at the time of deposition indicate a composition of up to 80% ice for deposits associated with the jökulhlaup on the 15 April 2010.
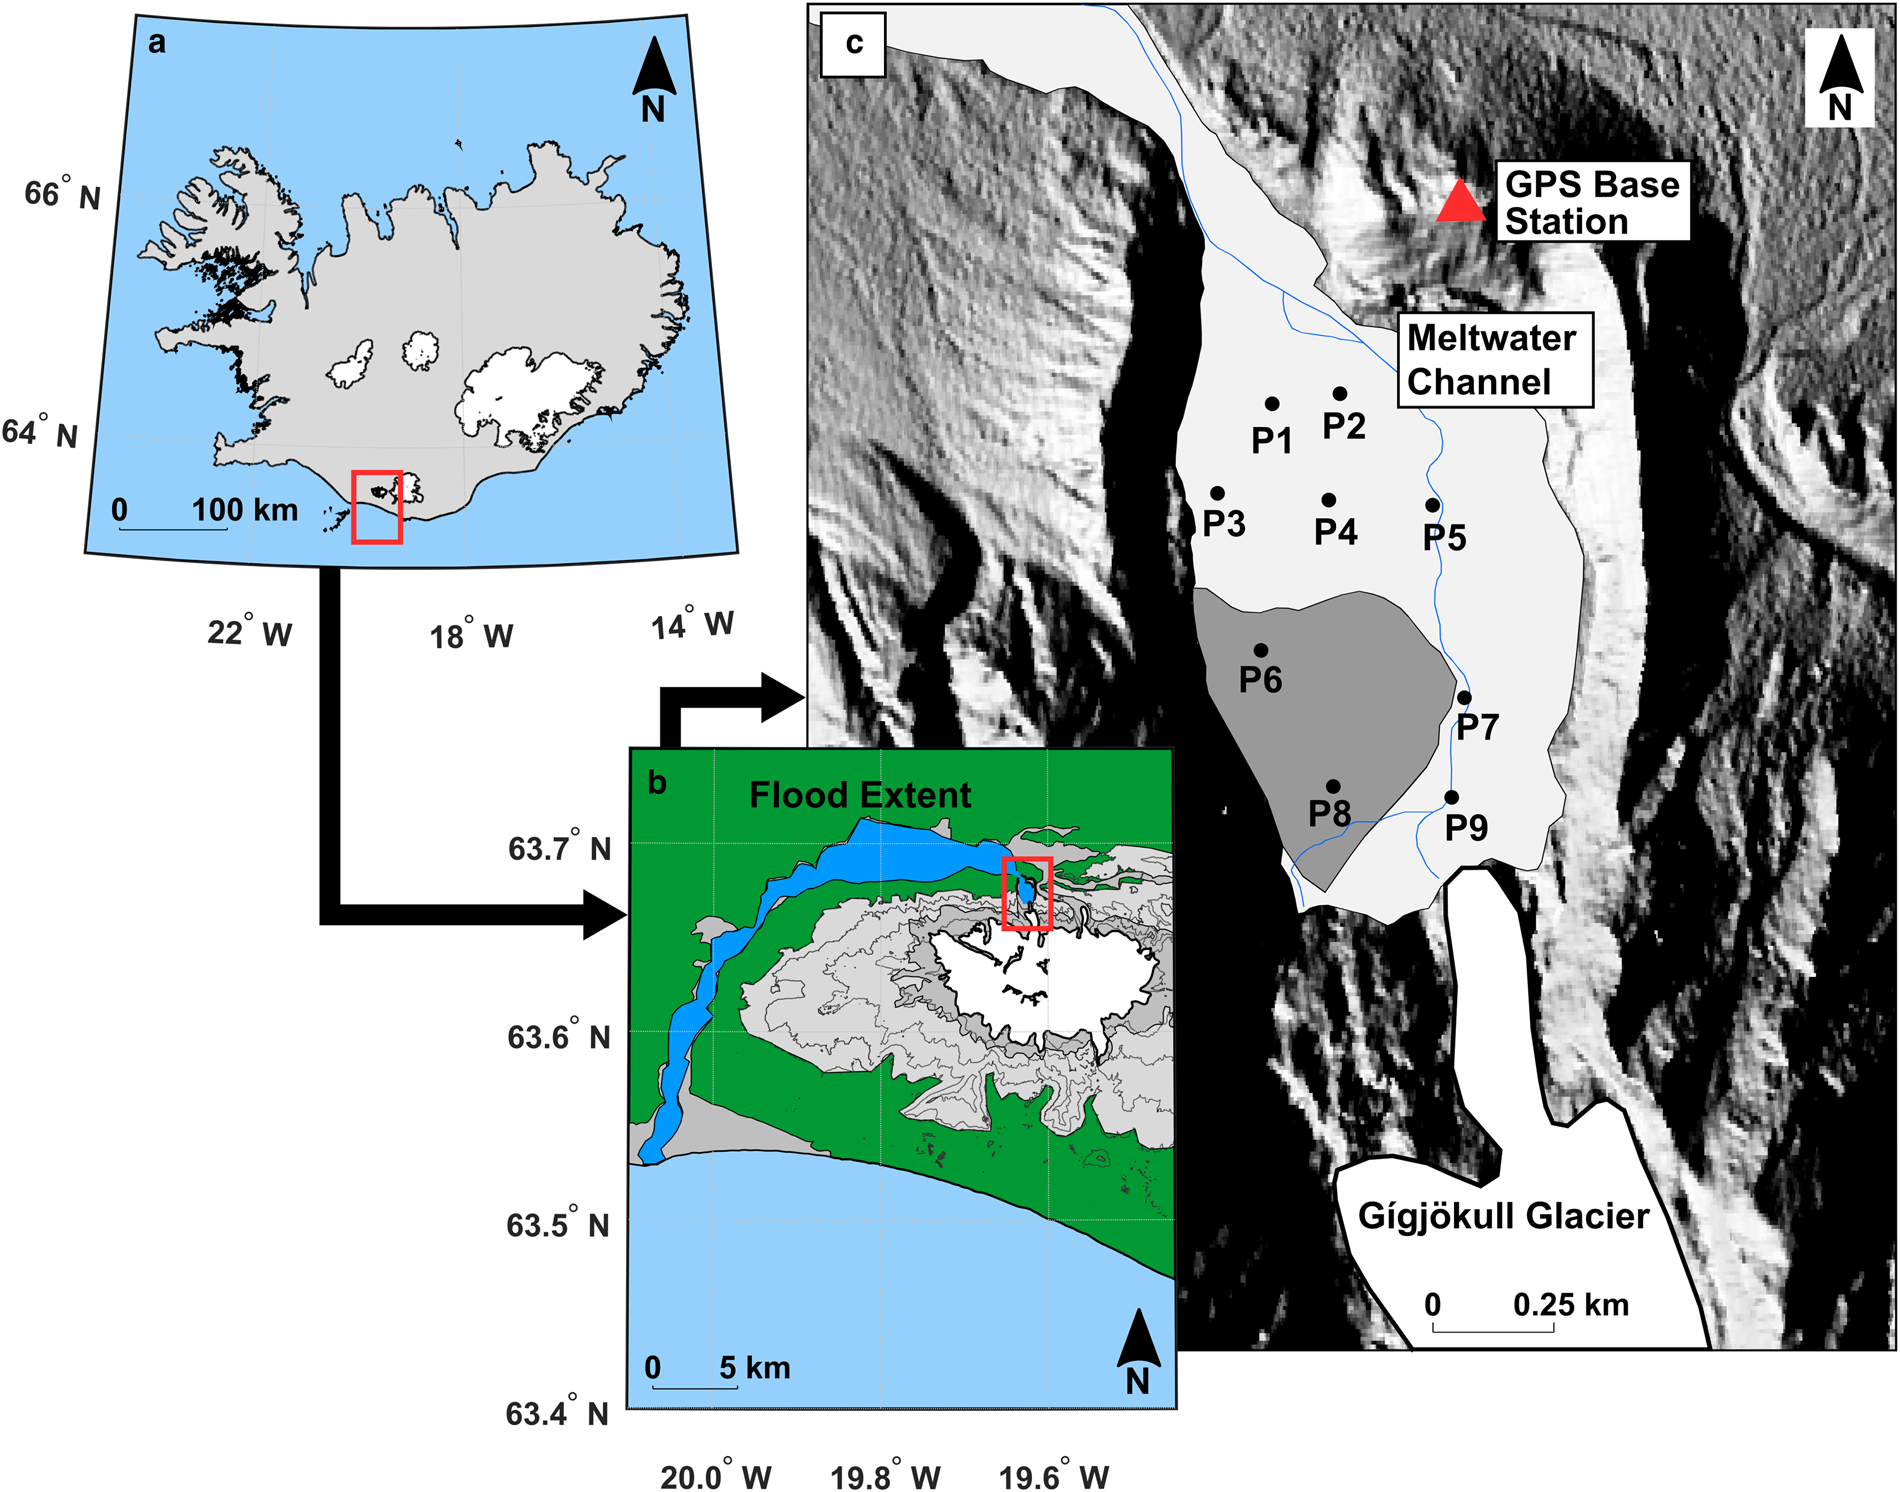
Location map of the Gígjökull basin, Iceland. (a) Map of Iceland showing the largest ice caps. Location of the Eyjafjallajökull ice cap highlighted by the red box. (b) Eyjafjallajökull ice cap and the Markarfljót fluvial system. Blue polygon shows the extent of the 2010 jökulhlaups from source to sea. Location of the Gígjökull basin highlighted by red box (extent of Figs 2 and 5). (c) The Gígjökull basin. Ice-proximal fan shown by dark grey polygon. P1–P9 represent point elevation measurement locations.
Terrestrial Laser Scanner (TLS) derived DEM(s) collected by Dunning and others (Reference Dunning2013) of the Gígjökull basin underlain by a hillshade of the TLS data (elevation with reference to the WGS84 ellipsoid). Background image from DigitalGlobe via Google Earth (Imagery Date: 05/09/13). (a) Pre-jökulhlaup DEM collected in March 2010. (b) Post-jökulhlaup DEM collected in July 2010. (c) Surface elevation change from March 2010 to July 2010. Modified from Figure 3 in Dunning and others (Reference Dunning2013).
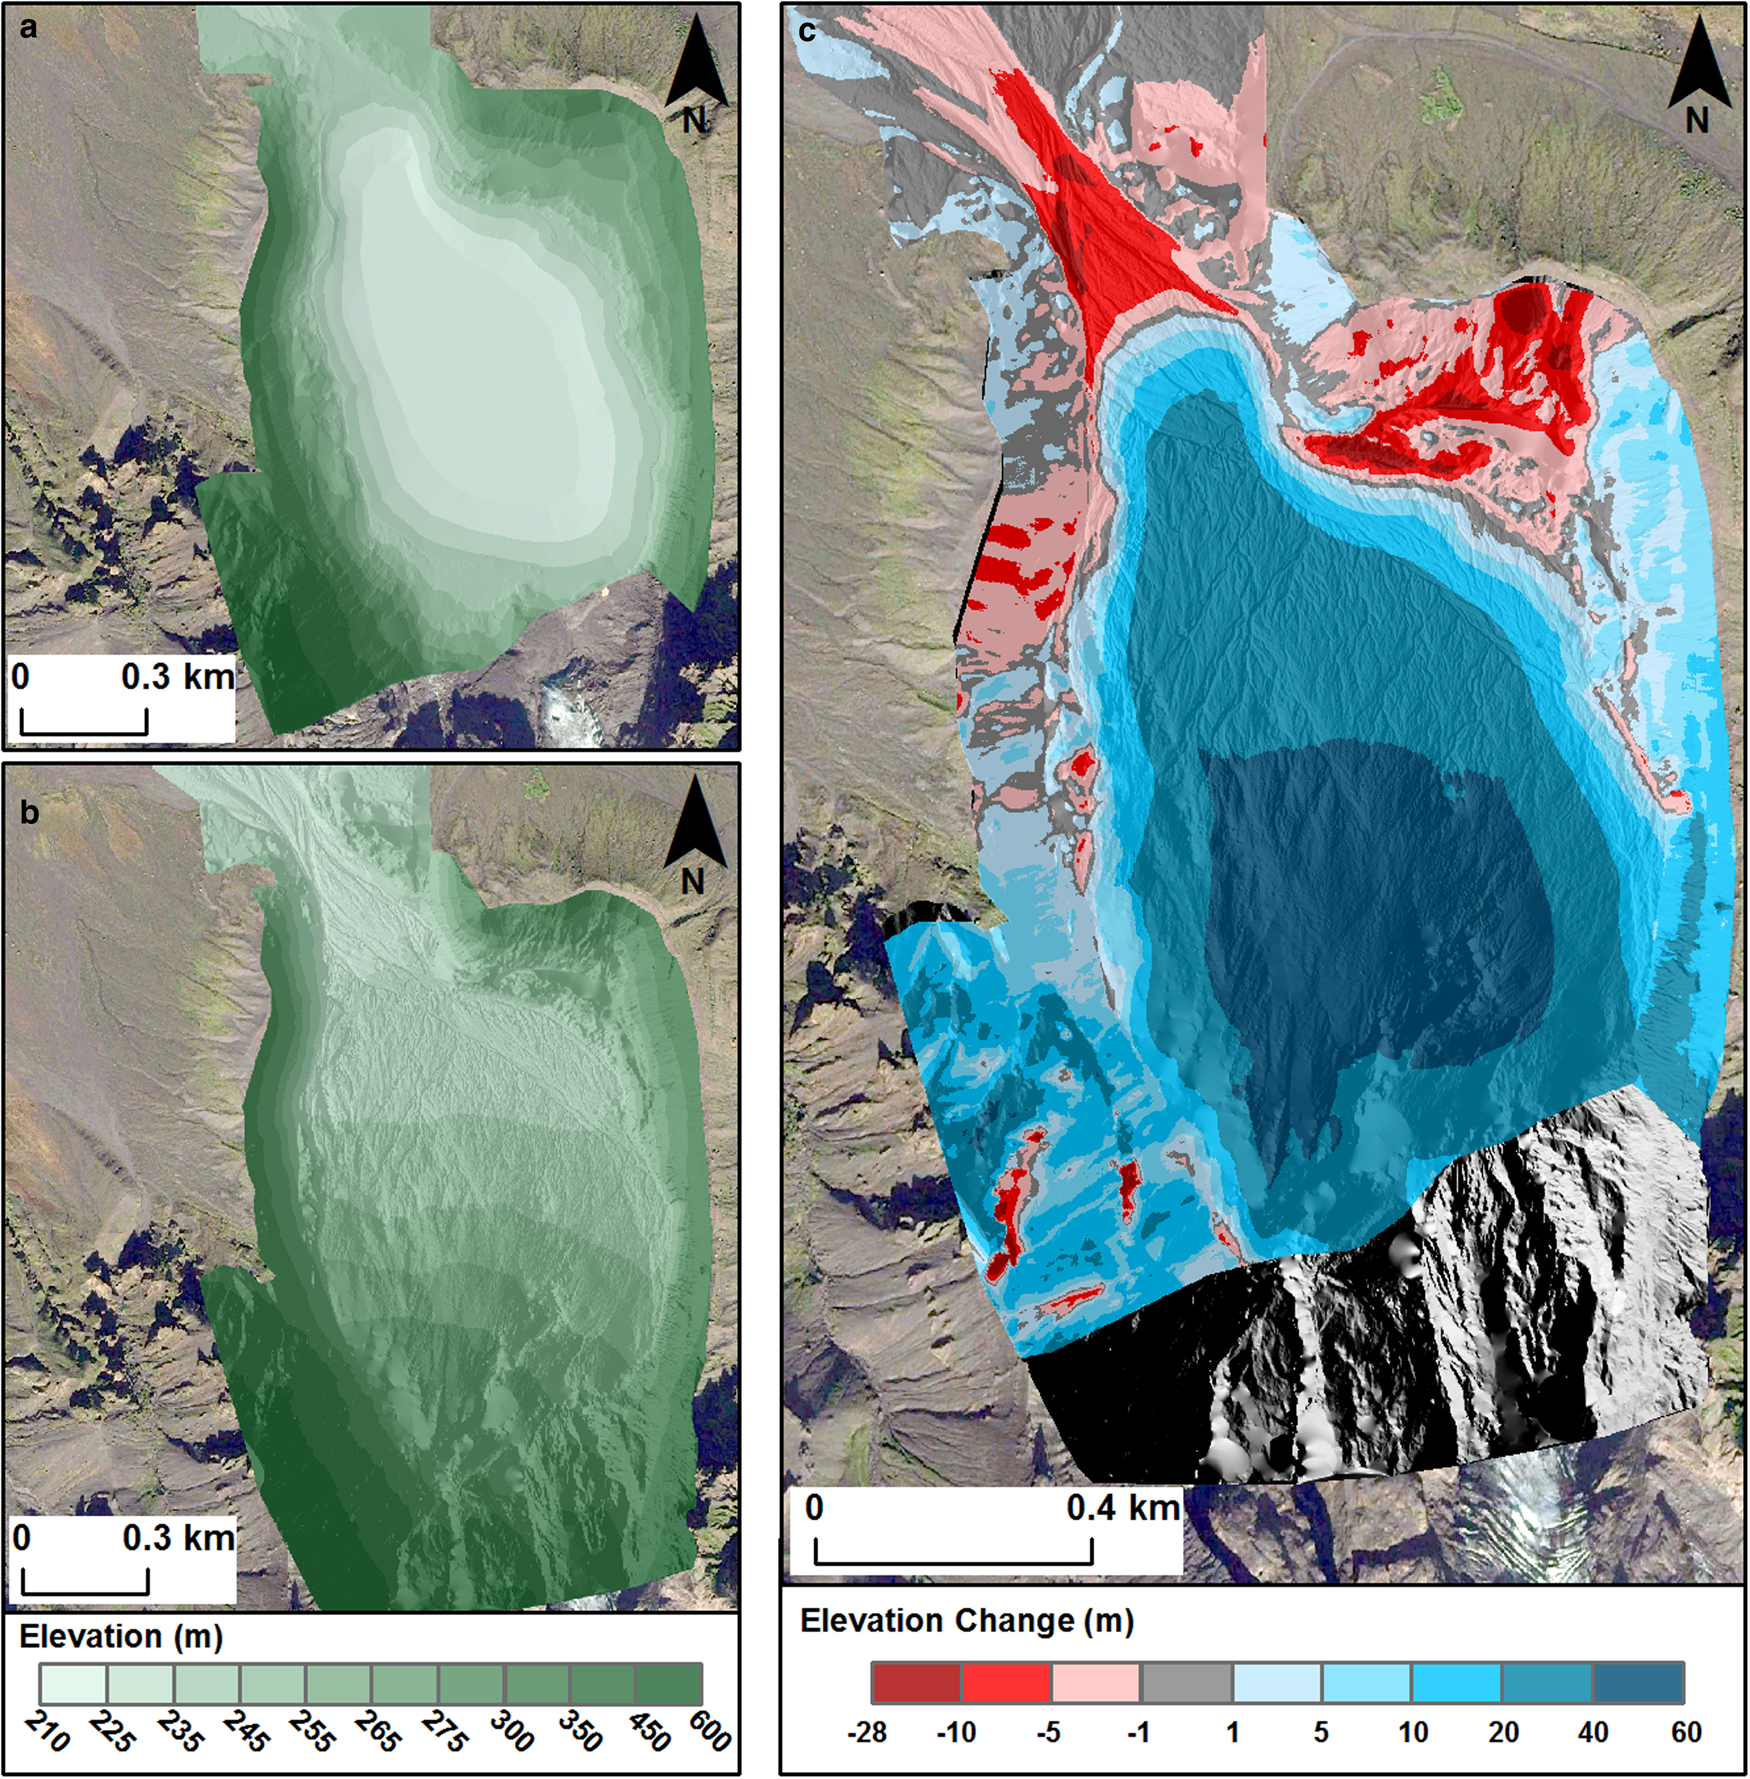
The post-eruption morphology and surface sedimentology of the proximal Gígjökull basin were predominantly the result of the lower discharge jökulhlaups during the later stages of the event (Dunning and others, Reference Dunning2013). This is in contrast to the common understanding of volcanogenic jökulhlaups, with geomorphic and sedimentological signatures formerly attributed to peak sediment flux coincident with peak discharge from a single hydrograph, and little to no deposition during the waning stages (Maizels, Reference Maizels1997; Russell and others, Reference Russell2010). These later smaller jökulhlaups were only responsible for ~15% of the basin infill, but were a dominant mechanism for the present-day surface morphology of the proximal part of the Gígjökull basin and most of the near-surface sedimentology (Dunning and others, Reference Dunning2013).
Aims
In this study, we investigate the role of geomorphic processes, including jökulhlaup transported ice, buried glacier ice and fluvial incision, in the post-depositional modification of jökulhlaup deposits. Dunning and others (Reference Dunning2013) investigated the immediate post-eruption evolution of the deposits, but that analysis was temporally limited to March–July 2010. Here we extend that analysis to determine the evolution of the Gígjökull basin over a 6-year period from 2010 to 2016. The active observations and robust constraints on the physical properties of the 2010 floods provide a unique opportunity to inform our understanding of the subsequent deposits and their evolution. We undertake the first systematic survey of post-depositional modification of recently emplaced jökulhlaup deposits, using repeated field surveys (e.g. TLS and dGPS) and remotely sensed datasets (e.g. ArcticDEM) to characterise surface elevation change over a 6-year period (2010–2016).
Study area
Located in south central Iceland (Fig. 1a), the Eyjafjallajökull ice cap covers an area of 67 km2 and like many Icelandic glaciers has decreased in size, in this case by 0.3–0.5% each year (Sigurðsson and others, Reference Sigurðsson, Williams and Víkingsson2017). Ice thickness varies from 100 m on the slopes, to ~200 m on the summit caldera of the Eyjafjallajökull stratovolcano (Sturkell and others, Reference Sturkell2010; Magnússon and others, Reference Magnússon2012). Gígjökull is the largest outlet from the Eyjafjallajökull ice cap (Sturkell and others, Reference Sturkell2010) (Fig. 1c). Prior to the eruption of Eyjafjallajökull, Gígjökull terminated in the 20–30 m deep Gígjökulslón proglacial lake, surrounded by a bedrock and moraine ridge complex up to 70 m in height (Spedding, Reference Spedding2000; Kirkbride and Dugmore, Reference Kirkbride and Dugmore2008; Magnússon and others, Reference Magnússon2012). The Gígjökull proglacial basin is a glacial overdeepening formed during periods of advanced terminus position of Gígjökull (Spedding, Reference Spedding2000). The basin is positioned on the eastern end of the Markarfljót sandur, and is a tributary valley of the Markarfljót braided river system (Snorrason and others, Reference Snorrason2012).
Methods
Differential GPS (dGPS) survey
Extensive dGPS surveys of the Gígjökull basin were conducted during 19–21 June 2015 and 22 September to 1 October 2016 using Leica Viva GS14 Global Navigation Satellite Systems (GNSS). Two systems were deployed in the basin, utilising one as a base station and the other as a rover unit for collecting point data. The survey was conducted in Real Time Kinematic (RTK) mode allowing for horizontal accuracies up to 1 cm and vertical accuracies of up to 10 cm. Due to the high number of data points collected in 2016 (~4000) it was possible to create a digital elevation model (DEM) through interpolation processes (Arun, Reference Arun2013). The topo2raster tool (Arun, Reference Arun2013) was used to convert the data points to a DEM. A low-pass filter was then applied to the DEM, combined with a resampling function to create a raster with 5 × 5 m cell size. This smoothed the surface, removing any residual artefacts produced by the interpolation process. Data were then combined with the 2010 TLS-derived DEM information (Dunning and others, Reference Dunning2013) and dGPS data from June 2015 to determine surface elevation change since the 2010 jökulhlaups. Furthermore, we present the results from nine data points (using a combination of dGPS, ArcticDEM and TLS data) that are spatially and temporally representative of the geomorphic processes that influence surface elevation change within the Gígjökull basin.
ArcticDEM
The ArcticDEM dataset (Porter and others, Reference Porter2018) enables quantification of the spatial and temporal evolution of Arctic glacial and proglacial systems. We analysed 2 × 2 m strip ArcticDEM data (2010–2016), derived from stereoscopic processing of DigitalGlobe's Worldview-1, Worldview-2 and Worldview-3 imagery (Noh and Howat, Reference Noh and Howat2015; Porter and others, Reference Porter2018). Initial geolocation of the ArcticDEMs may have systematic vertical and horizontal offsets of 3–5 m due to errors in the sensor model. A single control point from a dGPS survey can rectify these offsets, however (Dai and Howat, Reference Dai and Howat2017). We used our dGPS base station elevation measurements (Fig. 1c) to correct for the systematic vertical offsets in the ArcticDEM datasets, as we can assume little or no surface elevation change at the base station location over the period of investigation. DEM differencing and volumetric calculations were performed on corrected and clipped DEMs to quantify geomorphic change of the Gígjökull deposits. DEMs with reduced spatial coverage due to cloud cover were removed from the analysis.
Terrestrial laser scanning
Dunning and others (Reference Dunning2013) provide a detailed description of the acquisition and processing of the terrestrial laser scanner (TLS) derived DEMs acquired in 2010. In summary, surveys were conducted both pre- (March 2010) and post-eruption (July 2010) using multiple scans collected using a Riegl Z620i TLS with a nominal 2 km range. The resultant data were aligned, then post-processed into DEMs with a 1 m spatial resolution, ensuring a high signal-to-noise ratio at the scales of interest (Dunning and others, Reference Dunning2013).
Ground-penetrating radar
We deployed an Utsi Groundvue 7 (GV7) low-frequency ground-penetrating radar (GPR) system (Francke and Utsi, Reference Francke and Utsi2009) at Gígjökull to collect large-scale sub-surface architectural profiles of jökulhlaup sediments (22 September to 1 October 2016). The GV7 system has a centre frequency of 40 MHz with an emitted bandwidth of 10–80 MHz (Francke and Utsi, Reference Francke and Utsi2009; Ross and others, Reference Ross, Sole, Livingstone, Igneczi and Morlighem2018). Further technical specifications of the GV7 are described by Ross and others (Reference Ross, Sole, Livingstone, Igneczi and Morlighem2018). Over 40 km of radar lines were collected with multiple cross-sections collected perpendicular to jökulhlaup flow direction with a line spacing of ~50 m. Key proximal-distal ‘tie’-lines were also collected parallel to flow direction. Topographic information required for elevation correction during the processing of the resultant radargrams was gathered through a dGPS survey conducted coincident with the GPR survey. A velocity of 0.14 m ns−1 was used for the Gígjökull basin deposits, based upon a wide-angle reflection and refraction survey (WARR) (Harrison, Reference Harrison2018). Our recorded velocity value corresponds well with velocity values associated with unsaturated sands and gravels (Reynolds, Reference Reynolds2011). Reflexw (http://www.sandmeier-geo.de/reflexw.html) geophysical processing and interpretation suite was used to process the radargrams. Processed radargrams were then imported into OpendTect (https://www.opendtect.org/) seismic interpretation software for 3D visualisation.
Results
Qualitative assessment of geomorphic change
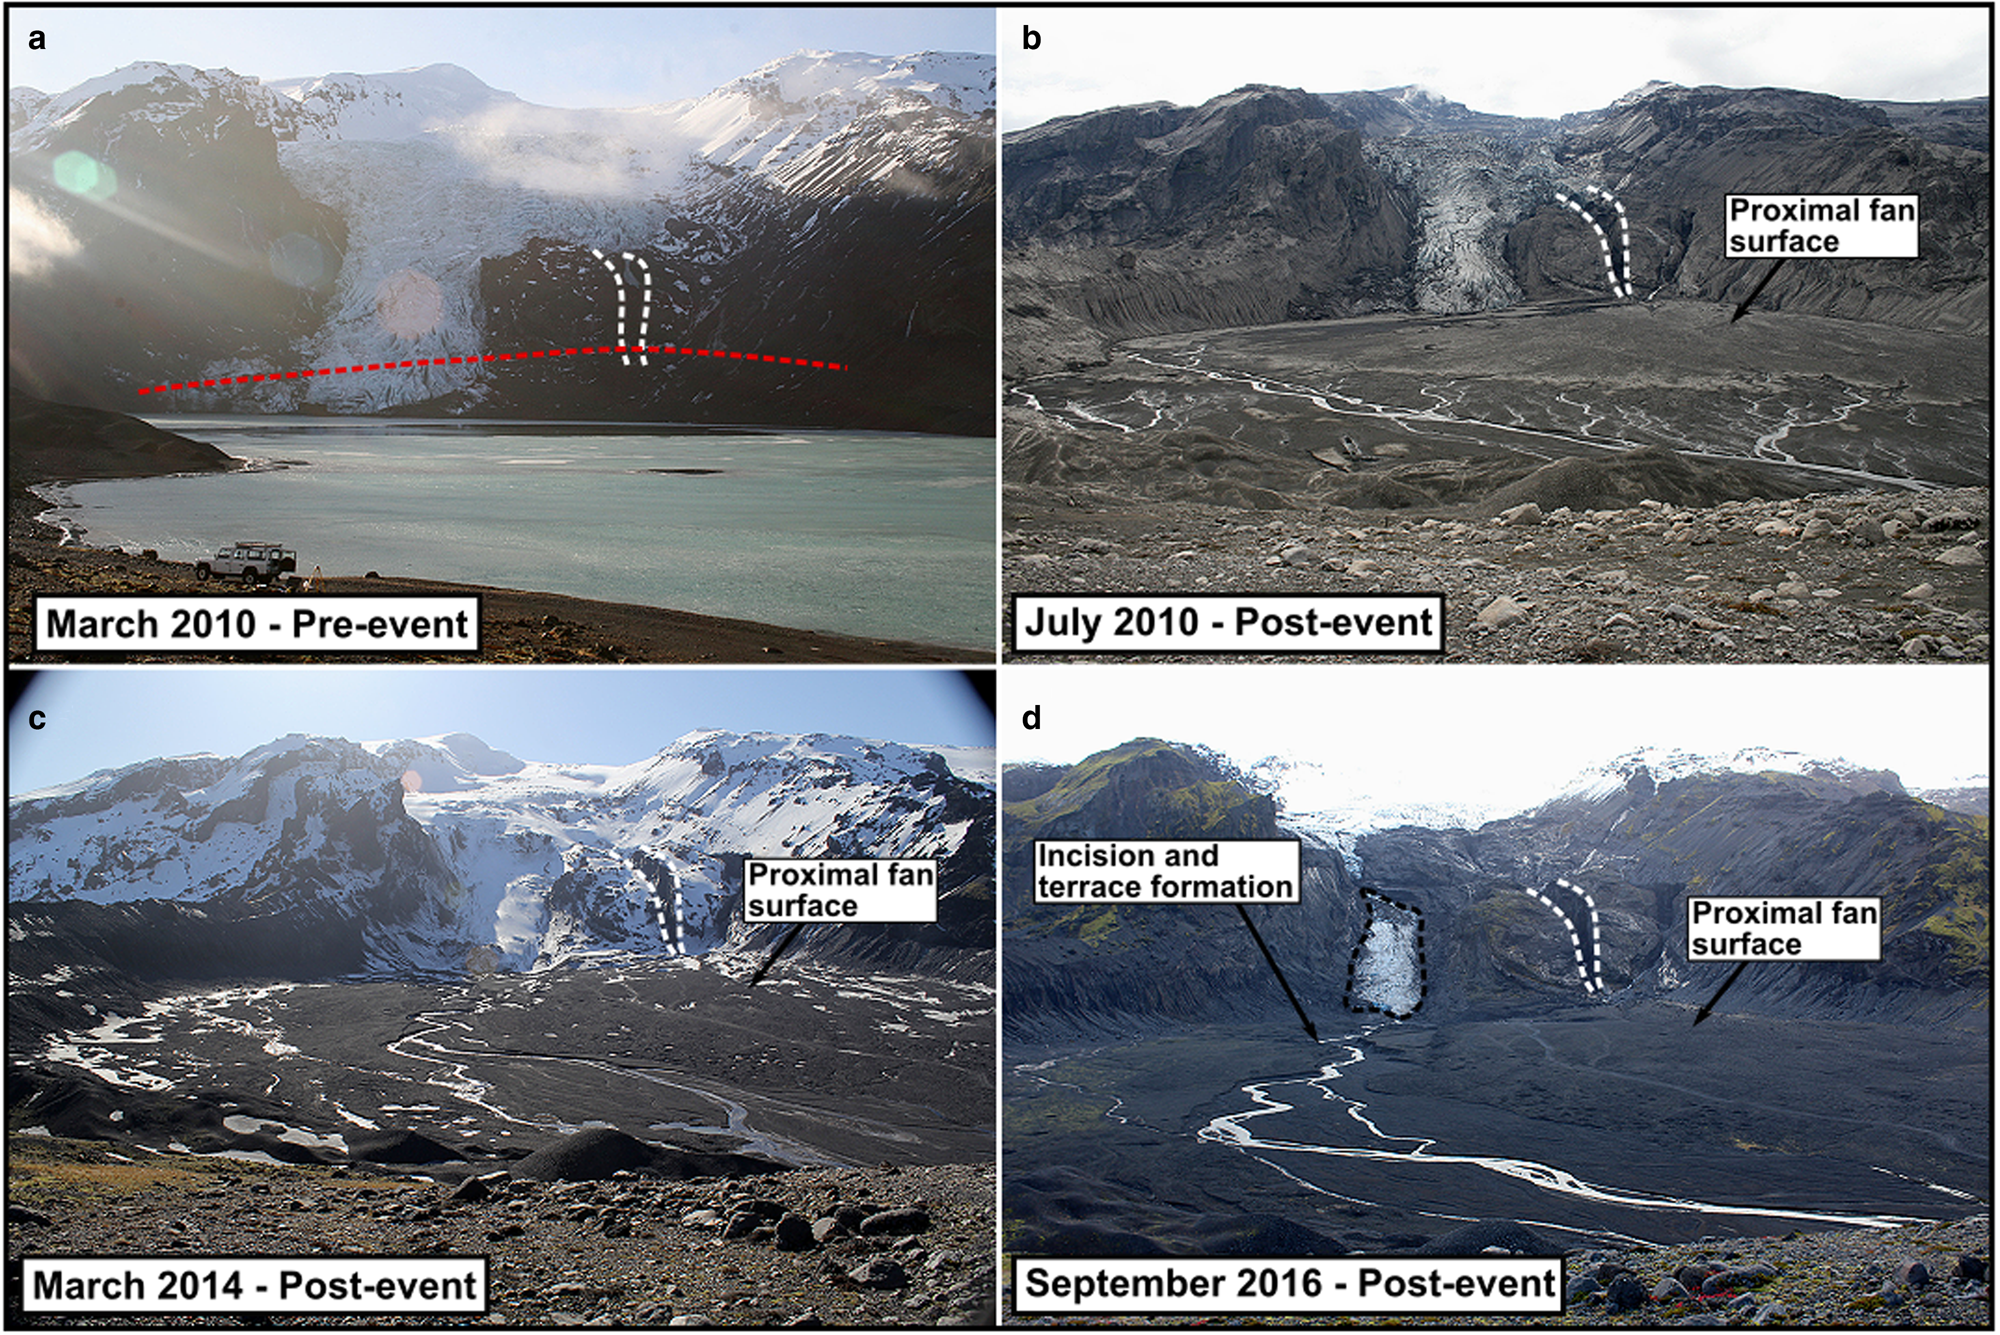
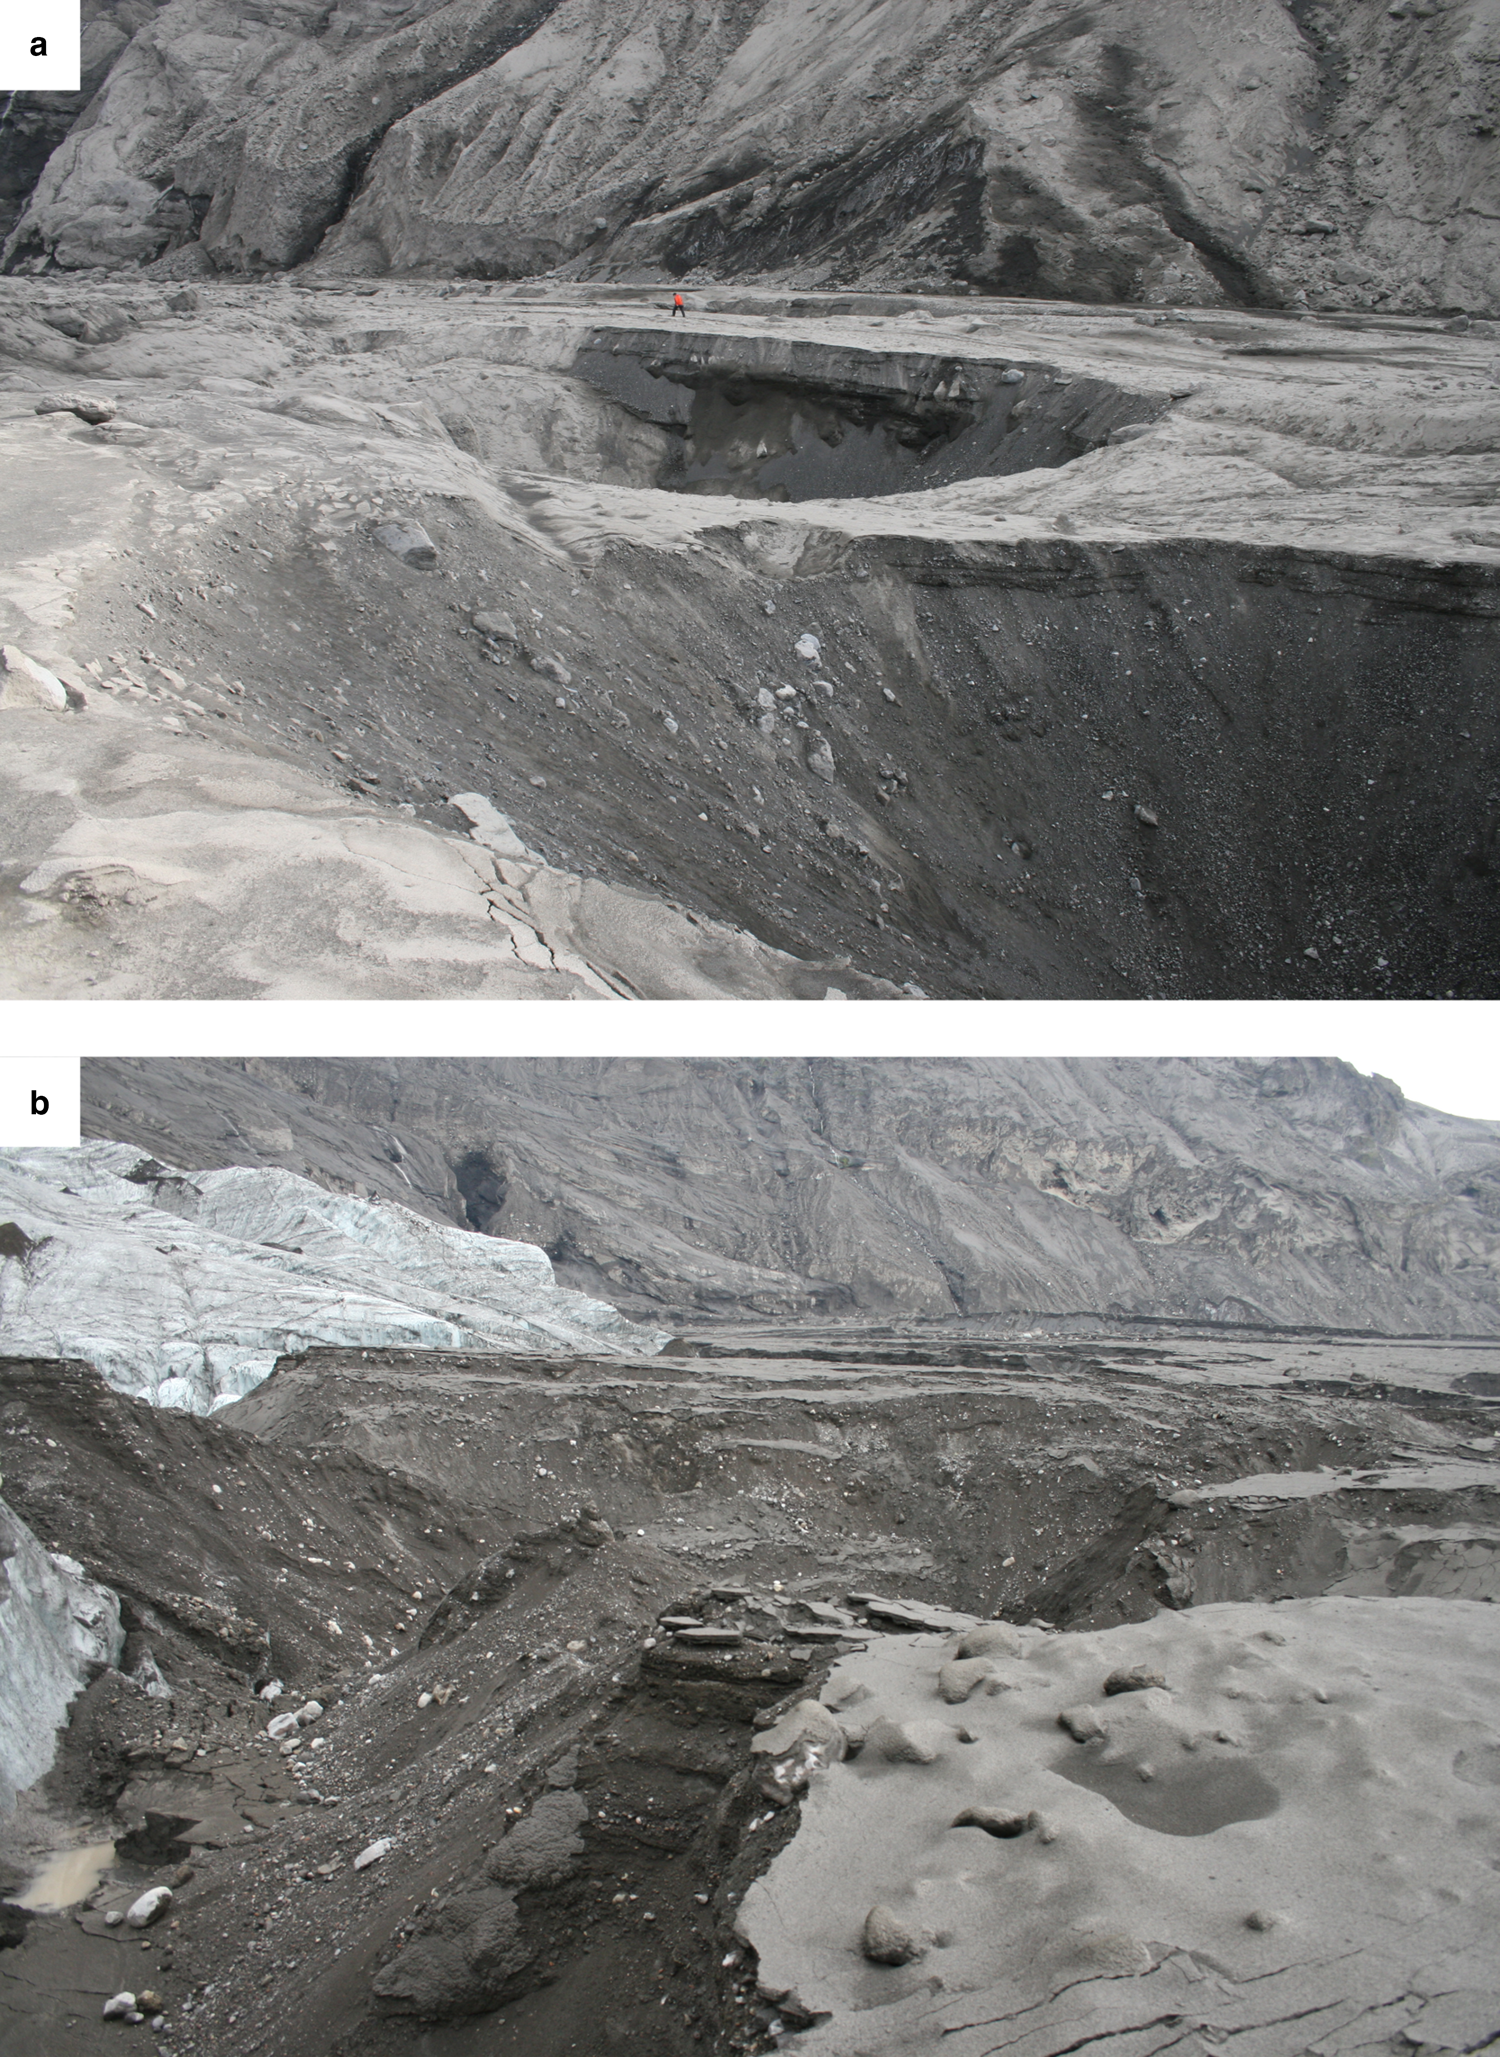
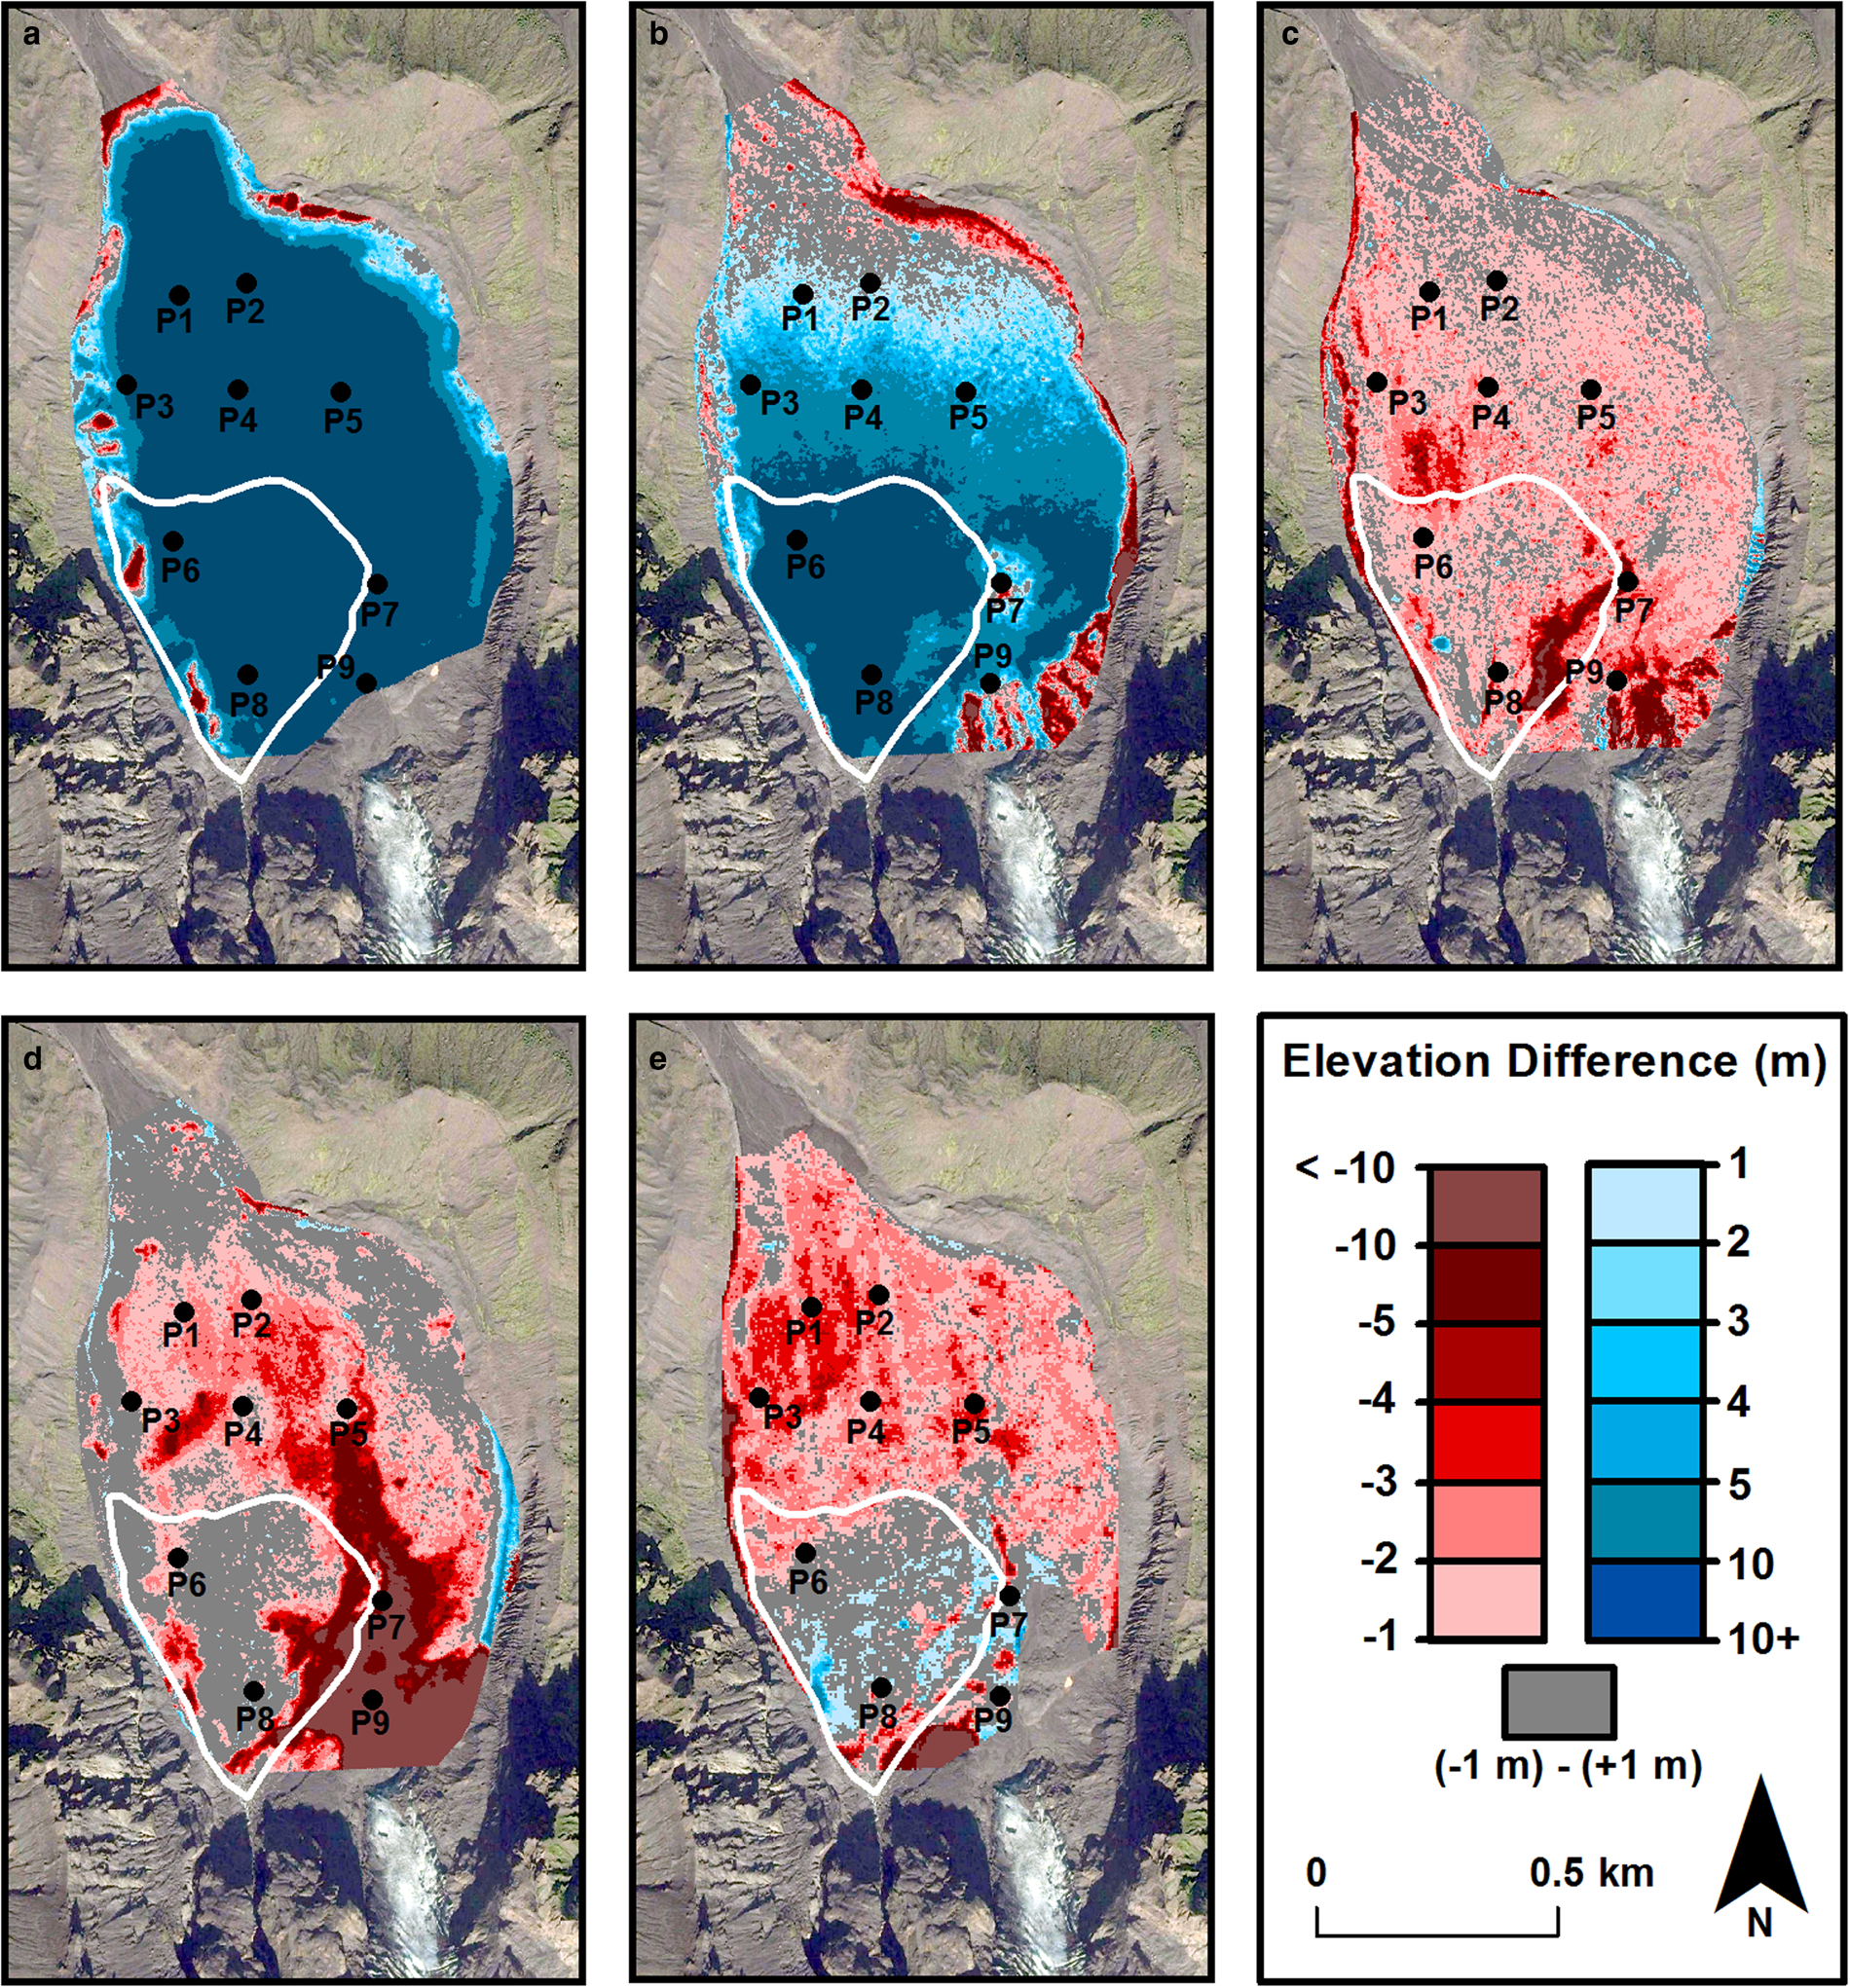
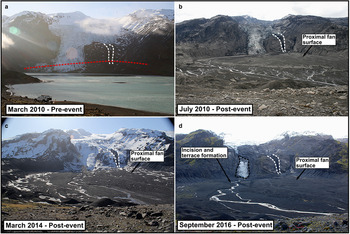
The Gígjökull basin has experienced considerable geomorphological change as a result of the 2010 volcanogenic jökulhlaups (Fig. 3). During the study period (2010–2016), Gígjökull has receded and experienced ice mass loss (Figs 3a–d). The imagery shows increased exposure of the steep bedrock glacier bed and proglacial foreland at the glacier margins, illustrating the thinning of the glacier and the retreat of the terminus position. This vertical change is most pronounced between March 2010 and September 2016 (Figs 3a and d). Analysis of ArcticDEM datasets from 17 April 2010 to 30 November 2015 reveals that the glacier surface had lowered by up to 54 m and its margin has receded by roughly 150 m. The former glacier tongue has detached from the current main tongue of Gígjökull, leaving a lobe of stagnant ice on the slopes of Eyjafjallajökull (Fig. 3d). The extensive ice-proximal fan created during the smaller jökulhlaups (Dunning and others, Reference Dunning2013) underwent significant geomorphological change after jökulhlaup-related deposition on 16 May 2010. In July 2010, the fan was characterised by a smooth surface with an almost uniform gradient (Fig. 3b). The jökulhlaup deposits that formed the fan also led to the burial of the eastern portion of the glacier snout. The subsequent meltout of the buried glacier tongue produced large kettle holes in the most proximal parts of the Gígjökull basin (Fig. 4). By 2014, surface depressions were visible and the surface of the proximal fan displayed a pitted texture. The snow cover on the March 2014 photograph is useful in this instance as it emphasises depressions on the surface of the jökulhlaup deposits (Fig. 3c). Field observations reveal that these surface depressions are kettle holes likely to be the result of the meltout of buried ice blocks (Fig. 4). The proglacial stream, which flows across the basin from the glacier terminus and bedrock gorges to the Gígjökull moraines, also significantly incised the 2010 jökulhlaup deposits producing a series of well-defined terraces after May 2010 leading to the incision of the proximal fan.
Photo set showing the evolution of the Gígjökull basin from the pre-eruption landscape to the present day morphology. White dashed lines indicate jökulhlaup incised gorge (a–d). Red dashed line in (a) indicates jökulhaup infill as of July 2010. Black dashed line in (d) shows the extent of the disconnected portion of Gígjökull outlet glacier. Photographs taken by Andrew J. Russell.
(a) Development of large kettle holes by July 2010. Person in red jacket for scale. (b) Meltout of glacier snout buried by jökulhlaup deposits. Photographs taken by Andrew J. Russell.
Quantitative assessment of surface elevation change of the Gígjökull deposits
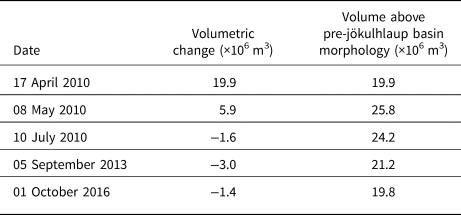
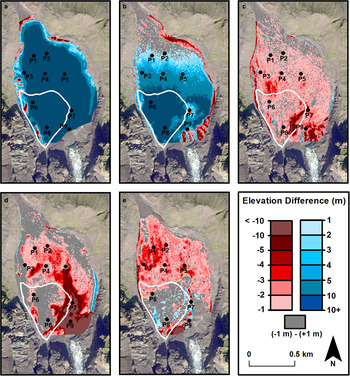
Jökulhlaup deposits within the Gígjökull basin experienced net surface lowering following the eruption from May 2010 to October 2016 (Fig. 5). A basin-wide surface lowering of the deposits, with an average of −1.75 m, is identifiable between May and July 2010. This is most likely a combination of sediment compaction and dewatering following the end of the jökulhlaups (Fig. 5c). Following this initial basin-wide change, surface lowering (May 2010 to September 2013) is focused in areas proximal to the post-jökulhlaup proglacial meltwater channel and the terminus of Gígjökull, with lowering of up to ~20 m (Figs 5c and d). This lowering is predominately attributable to the meltout of glacier ice along the buried glacier margin in the eastern and central ice-proximal locations (Fig. 4), as well as meltwater channel incision, glacier terminus retreat and localised kettle hole development. After September 2013, however, elevation change of the basin surface is no longer dominated by incision of the proglacial meltwater system and erosion of the jökulhlaup sediments in ice-proximal parts of the basin. The proximal fan displays areas of very limited elevation change (e.g. between −1 m and 1 m) during the period between 2013 and 2016. There are even small isolated areas of increased elevation, which are attributed to shadows in imagery used to produce ArcticDEM strips (Noh and Howat, Reference Noh and Howat2015). By contrast, surface lowering in the more ice-distal locations of the basin occurs in a more widespread and uniform fashion (Figs 5d and e), with lowering ranging between 2 and 5 m during the periods of July 2010 to September 2013 (Fig. 5d), and September 2013 to October 2016 (Fig. 5e). Volume estimates calculated from the DEMs for the study period (i.e. March 2010 to October 2016) indicate that $\sim \!\!26 \times 10^{6} \, {\rm m}^3$ of sediment and ice were deposited into the Gígjökull basin by the 2010 jökulhlaups (Table 1). This value is ~1.5 times greater than that initially calculated by Dunning and others (Reference Dunning2013). The volume of deposit remaining in the basin as of 1 October 2016 is calculated to be 19.8 × 10⁶ m3, implying a volumetric loss of 6.0 × 10⁶ m3 since emplacement of the jökulhlaup deposits.
DEMs of difference from comparison of TLS, ArcticDEM and dGPS datasets. White line indicates the extent of the ice-proximal fan as of September 2016. Background image from DigitalGlobe via Google Earth (Imagery Date: 05/09/13). P1–P9 represent point elevation measurement locations. During jökulhlaups: (a) 11 March – 17 April 2010; (b) 17 April – 08 May 2010. Following jökulhlaup deposition: (c) 08 May – 10 July 2010; (d) 10 July 2010 – 05 September 2013; (e) 05 September 2013 – 01 October 2016.
Volumetric change of jökulhlaup deposits within the Gígjökull basin
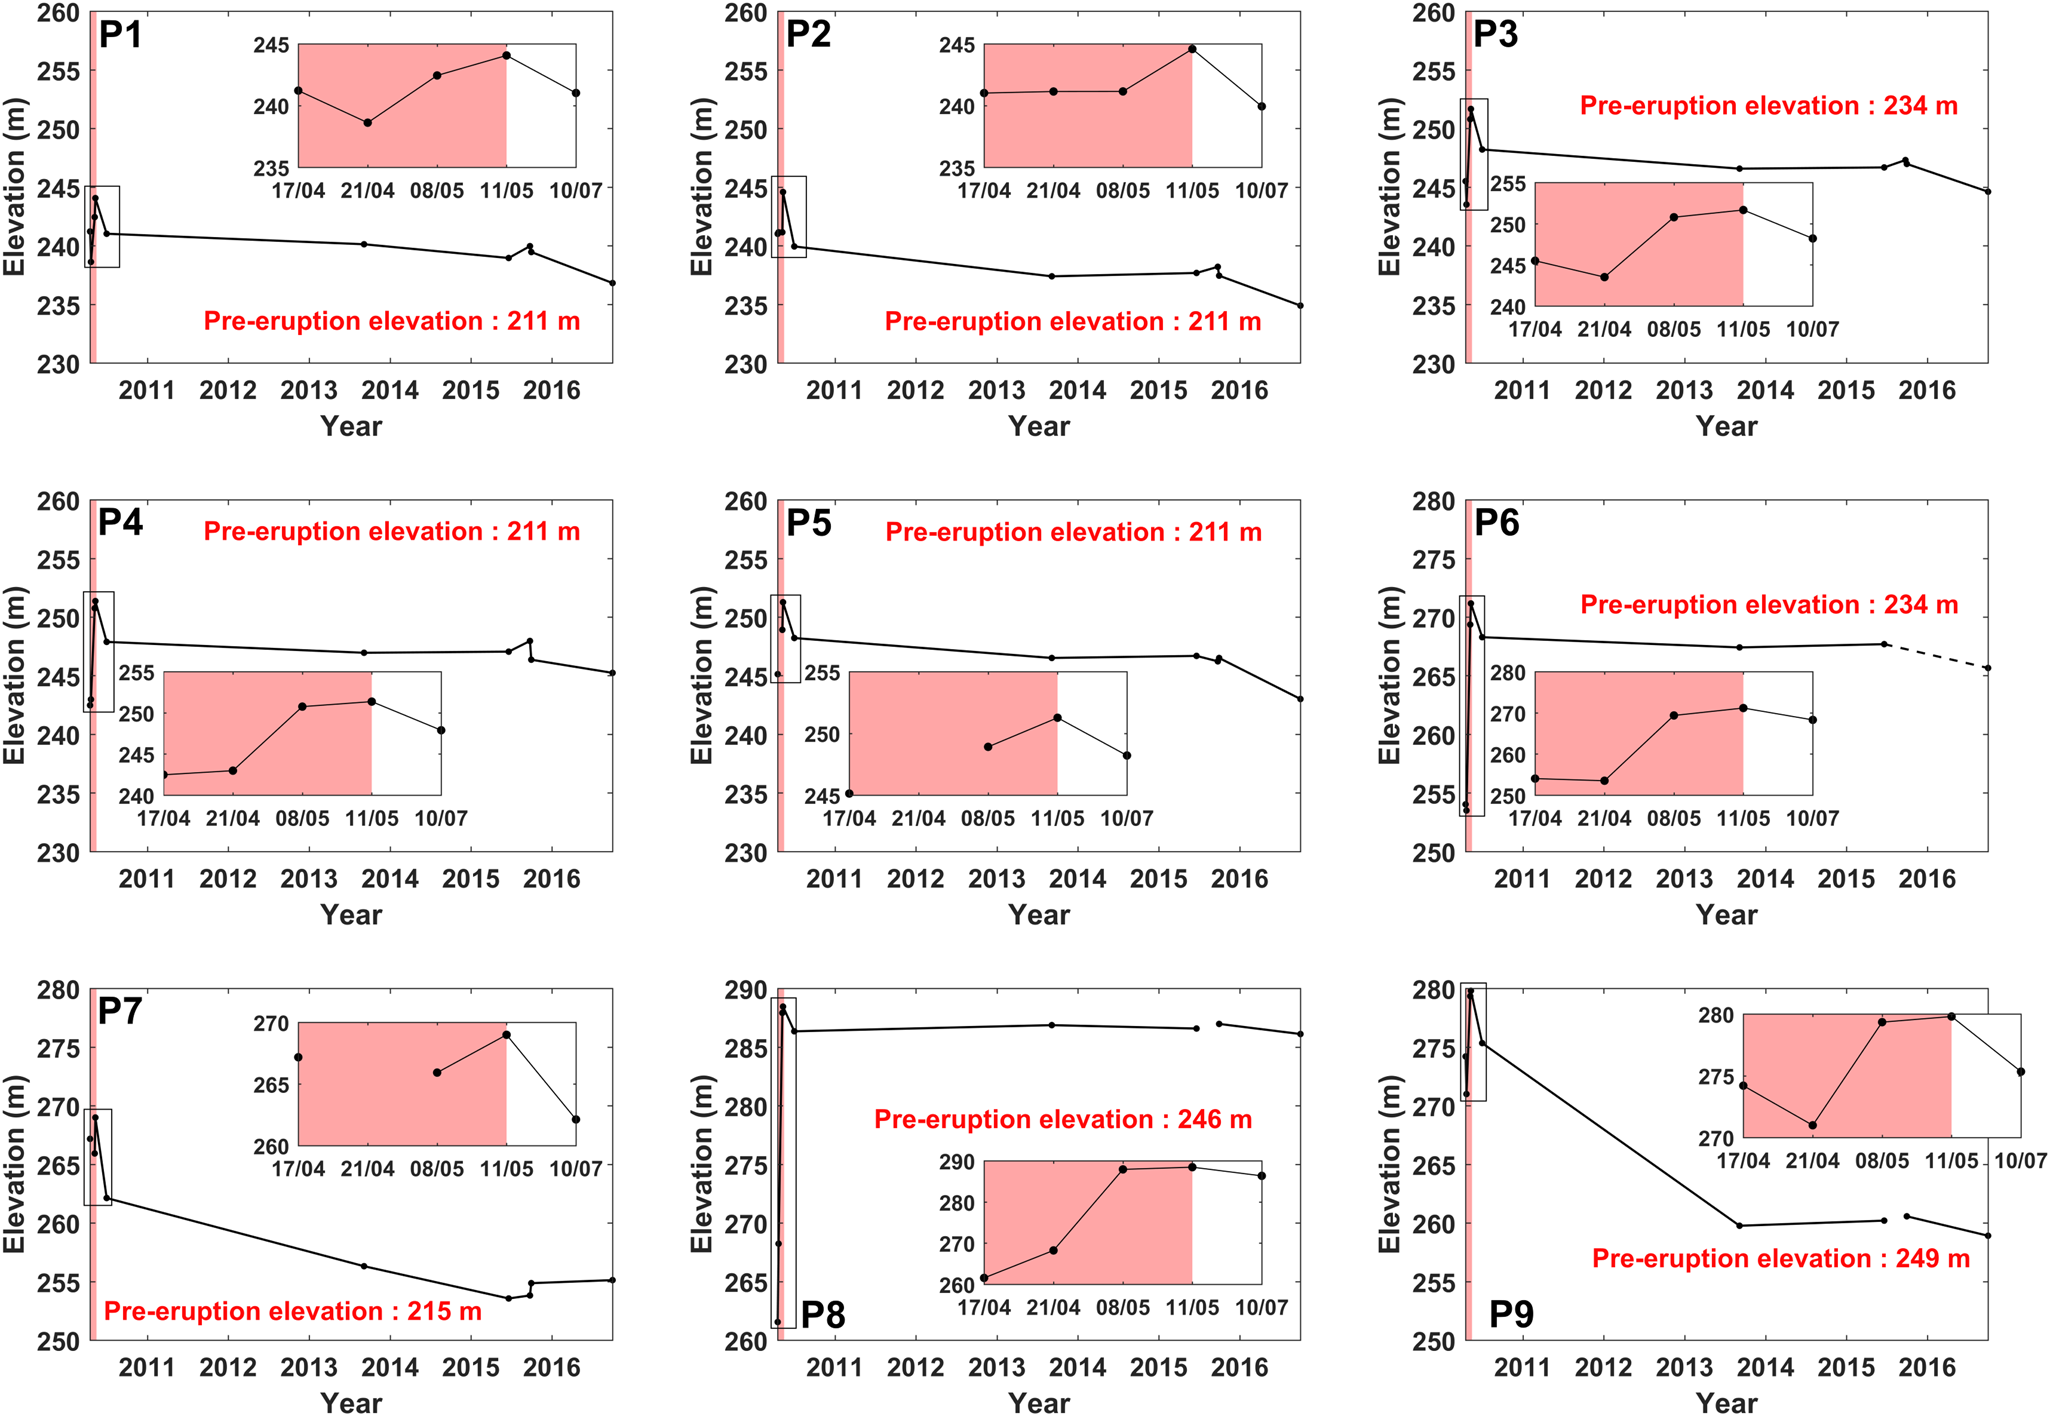
Rates of elevation change between 2010 and 2016 vary both spatially and temporally (Fig. 6). At all point measurement locations, surface elevations reach maxima after the jökulhlaups ceased following the termination of the eruption (i.e. 11 May 2010). Erosion and degradation of the sediments deposited from the largest jökulhlaups on 14–16 April 2010 occurred at several locations across the basin (i.e. P1, P3, P7 and P9). However, the overall net elevation increase of the deposits throughout the basin indicates the jökulhlaups were generally constructional until at least 11 May 2010 (Fig. 6). A significant reduction in elevation occurred throughout the basin between 11 May and 10 July 2010, with lowering ranging between 2 and 6 m. Following this initial rapid surface elevation loss, rates of change within ice-distal locations of the basin declined over a 5-year period (based upon our data points), ranging between −0.17 and −0.45 m a−1 from July 2010 to June 2015. This is in contrast to the rapid reduction in surface elevation within the main channel in the ice-proximal region, with rates of up to −3.05 m a−1 between 2010 and 2015 (i.e. P7 and P9 in Fig. 6). The elevation of the ice-proximal fan (P8 in Fig. 6) appears to be stable for the entire period between July 2010 and October 2016, with elevation changes of less than 1 m. Lowering between 2013 and 2016 within ice-proximal regions is often associated with localised kettle hole development. This indicates the localised presence of ice within the ice-proximal deposits, although this ice is less laterally extensive than in the ice-distal parts of the basin. Between 2015 and 2016, surface lowering became more pronounced in distal portions of the basin, with rates increasing from an average of −0.33 m a−1 (2010–2015) to an average of −1.88 m a−1 (2015–2016) (Fig. 6).
Point elevation change measurements 17 April 2010 – 01 October 2016 taken from TLS, dGPS and ArcticDEM datasets. Point locations shown in Fig. 1. Red shaded region indicates the time period associated with the 2010 jökulhlaups (14 April to the 16 May).
Sub-surface reconstruction
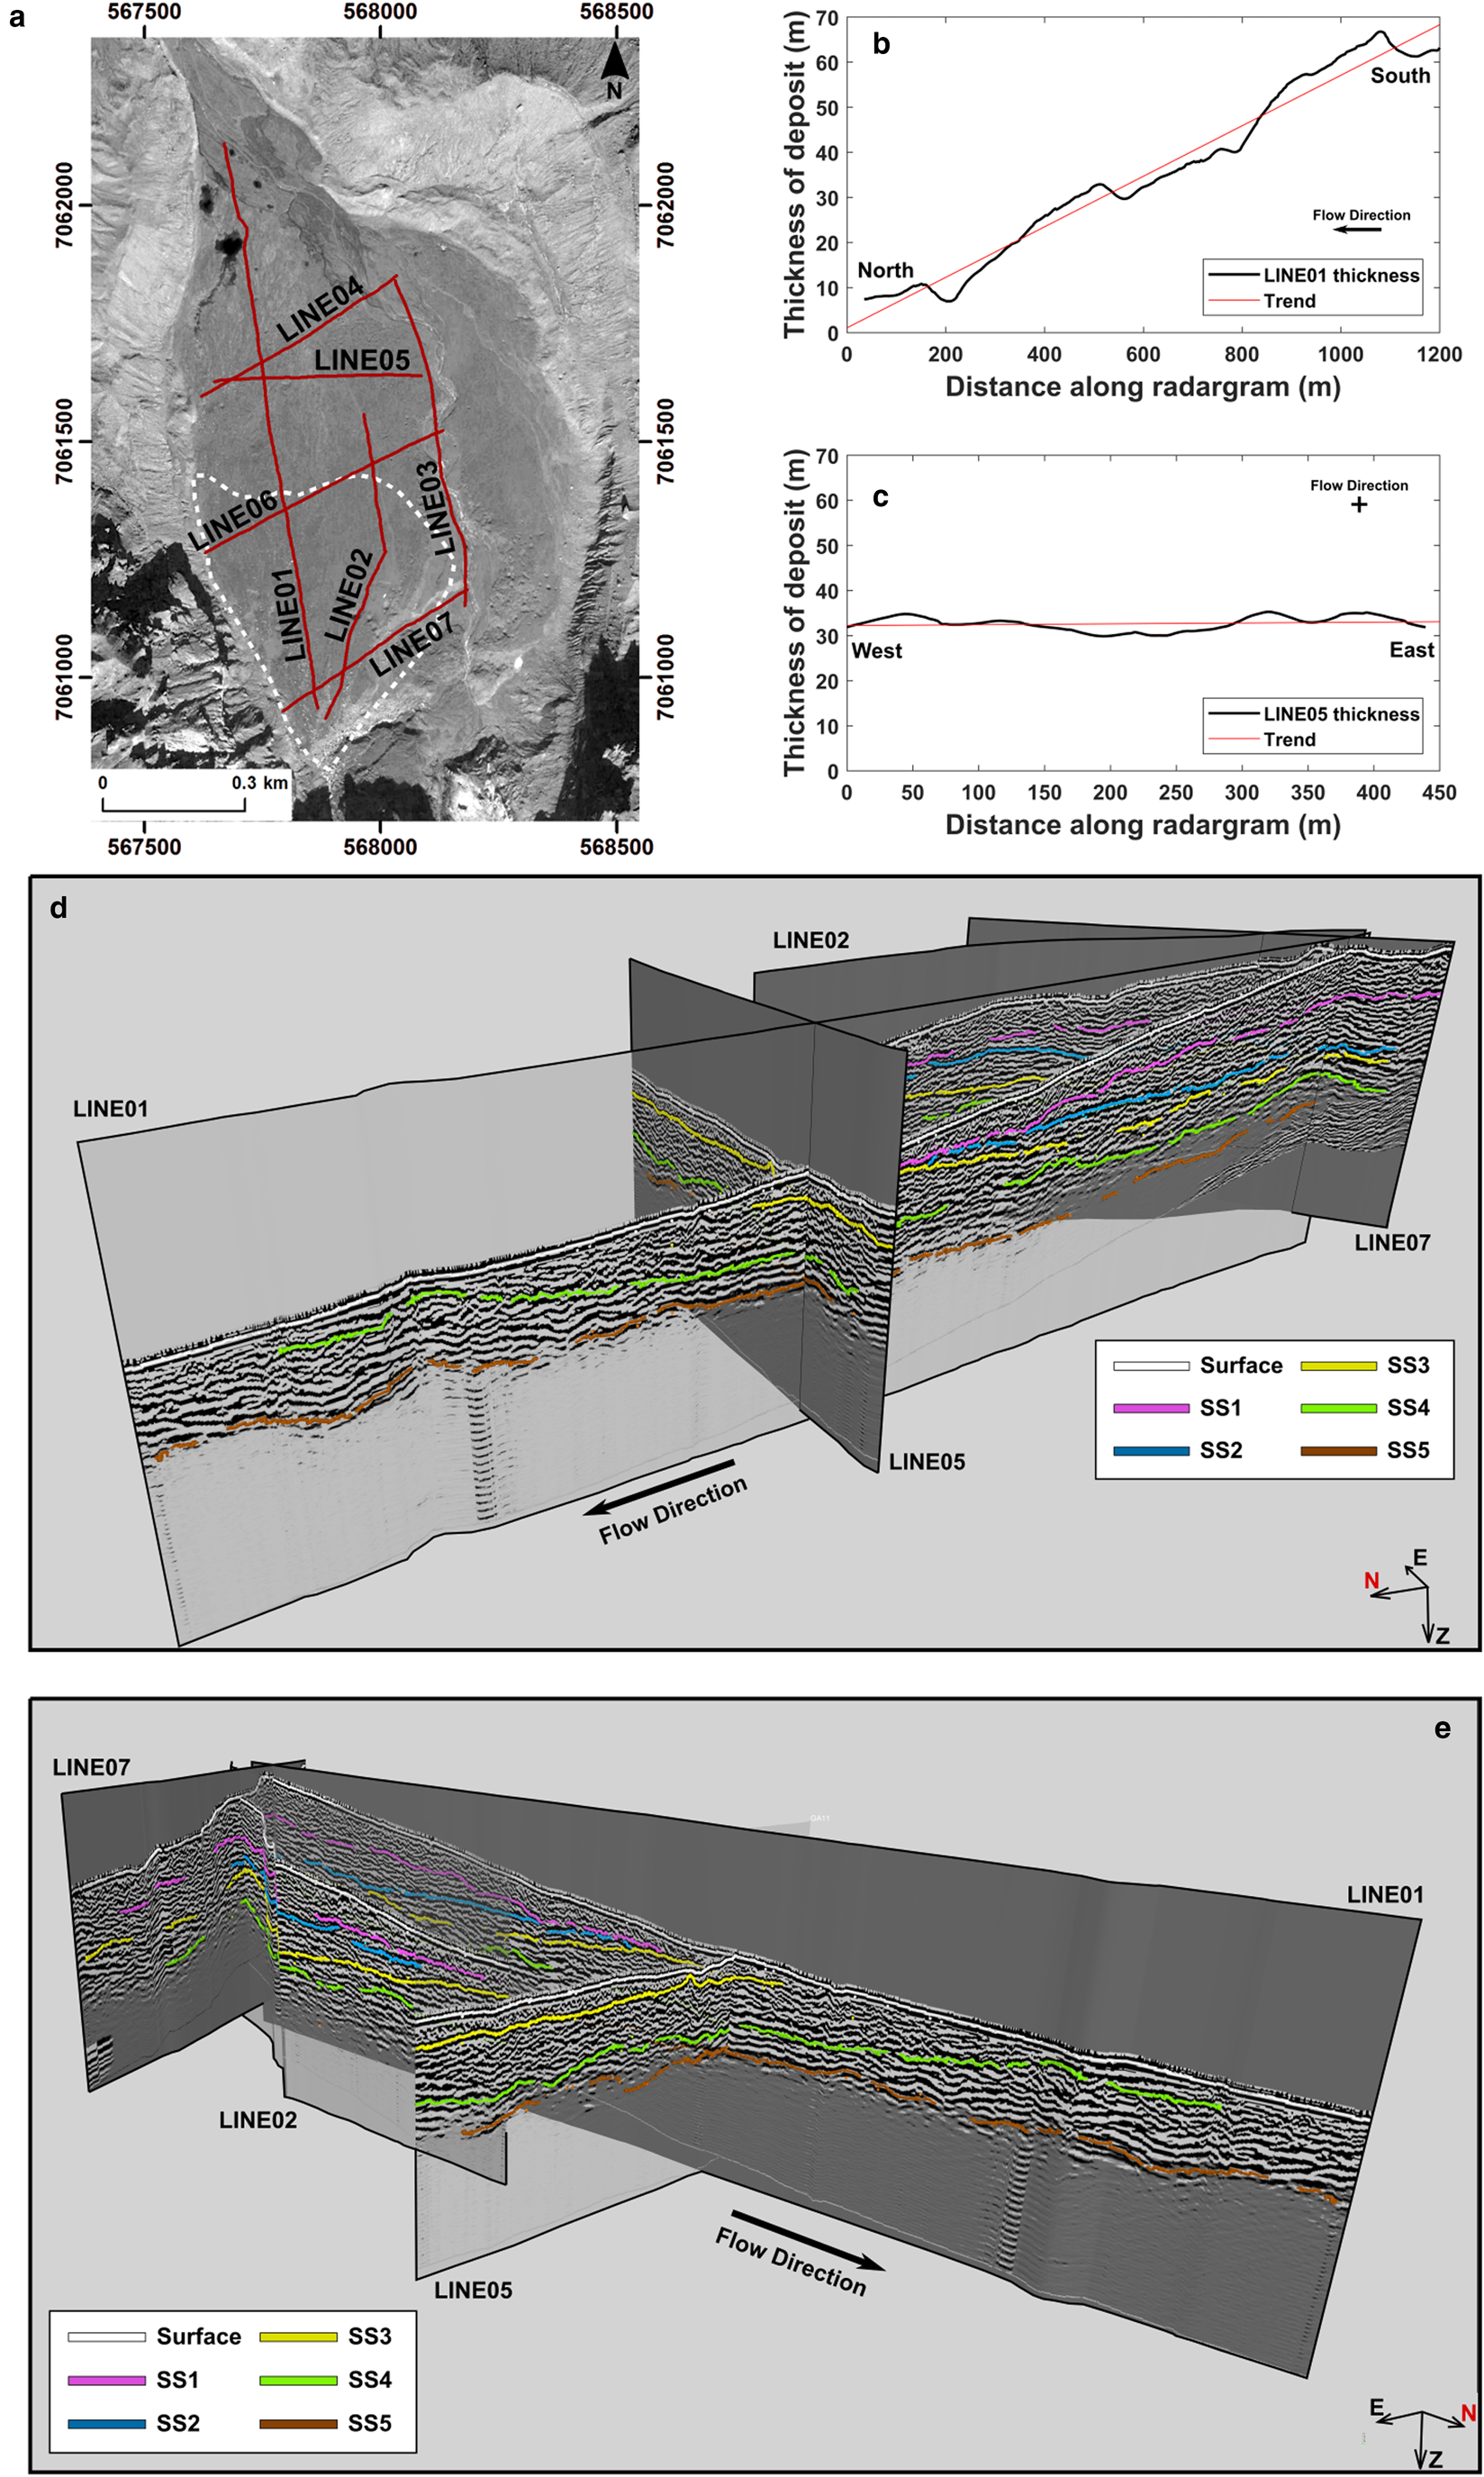
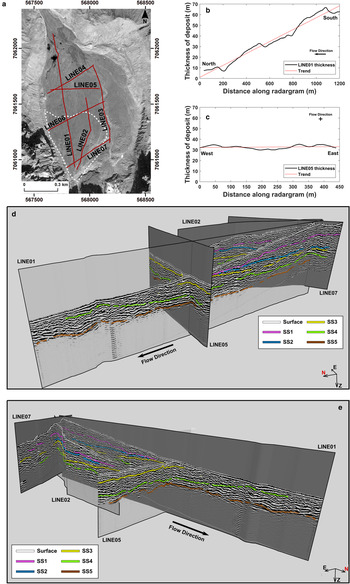
Analysis of radargrams acquired within the Gígjökull basin enables characterisation of the 3D geometry of sub-surface sedimentary units (Fig. 7). Observations from the radargrams show that the spatial extent of reflections related to a series of distinct sub-surfaces (SS1–SS5) varies from ice-proximal to ice-distal locations. Sub-surfaces SS1 to SS4 are interpreted to delimit the primary boundaries between four major sedimentary units deposited during the 2010 jökulhlaups. We interpret the base of the 2010 jökulhlaup sedimentary succession, and thus the former proglacial lake bed, as SS4. This is suggested based on the consistency of the GPR velocity-determined elevation of SS4 with aggradation levels calculated by Dunning and others (Reference Dunning2013). SS5 lacks sufficient coherency for a conclusive interpretation, but it is suggested to be a reflection from an interface below the base of jökulhlaup sedimentation. The reflections associated with the surfaces SS1 and SS2 are clearly apparent within the ice-proximal fan deposits but cannot be traced beyond the perimeter of the fan (Fig. 7). As a result of their reduced extent, we believe these units are a product of the later smaller jökulhlaups that inundated the Gígjökull basin (20 April 2010 to 16 May 2010). Both SS3 and SS4 can be seen at their greatest depths under the ice-proximal fan and decrease in depth as they are traced towards the ice-distal margins of the deposits. The sediment units located below SS2 were likely deposited during the largest jökulhlaups (14–16 April 2010) based upon their spatial extent and the overall thickness of the sediment package (Fig. 7). The thickness of the individual sediment units can be seen to vary as surfaces are traced in the flow-parallel direction, but show a mostly uniform thickness when analysed perpendicular to flow (Fig. 7c). The overall thickness of the jökulhlaup deposits within the Gígjökull basin decreases in the direction of jökulhlaup flow, ranging from 67 m ice-proximally to 6.9 m in ice-distal locations (Fig. 7b). Deposit thickness remains relatively uniform when viewed transverse to flow (Fig. 7c). Post-depositional meltout structures are visible within GPR data, exemplified by trough-like structures surrounded by chaotic and high angle dipping reflections, associated with subsidence and degradation of the sediments (Fig. 7). However, the overall chaotic nature of the reflections and the low frequency of the GPR system used makes identification difficult.
Sub-surface geometry of the Gígjökull deposits. (a) Map showing location of radar lines. (b and c) Thickness of jökulhlaup deposit acquired from Line01 (b) and Line05 (c). (d and e) 3D grid of radargrams highlighting sediment units and their bounding surfaces.
Discussion
We attribute elevation lowering of the jökulhlaup deposits in the Gígjökull basin between 2010 and 2016 to three primary factors: (i) the meltout of ice deposited by the jökulhlaups; (ii) rapid melting of the buried Gígjökull terminus following the 2010 jökulhlaups; and (iii) incision of the proglacial fluvial system into the deposits.
Meltout of buried ice
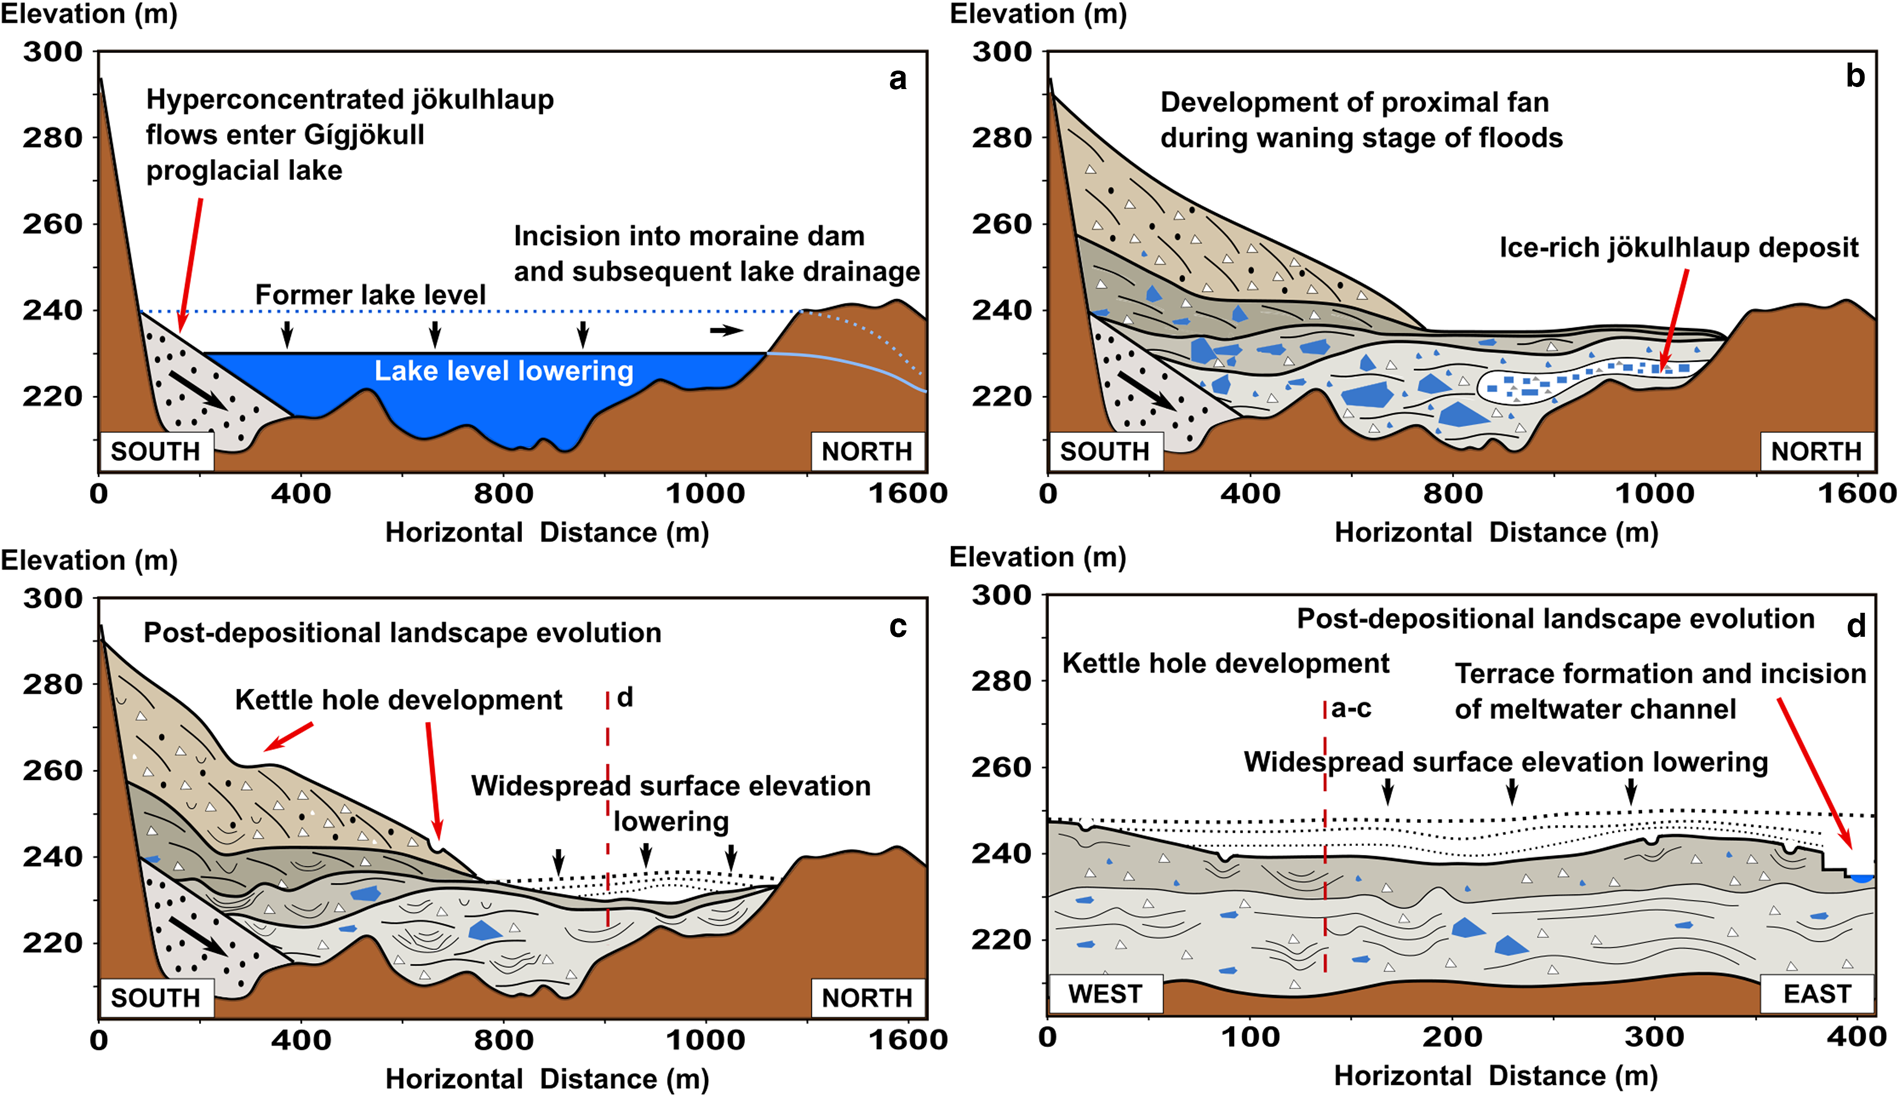
Meltout of subsurface ice is the most likely cause of the overall surface lowering of the Gígjökull deposits between 2010 and 2016. This is consistent with the presence of active ice melt and kettle hole formation within the basin during this period. It is known that deposits from the 15 April 2010 jökulhlaup (GPR unit between SS3 and SS4) consisted of up to 80% ice (Magnússon and others, Reference Magnússon2012; Dunning and others, Reference Dunning2013). Ice was deposited within the Gígjökull basin in the form of large ice blocks and sediment-rich ice slurries (Dunning and others, Reference Dunning2013). The pattern of surface lowering over time indicates that ice melt does not occur at a uniform rate across the basin, and is likely controlled by multiple factors (e.g. distribution of ice, variations in temperature, thickness of overburden). Spatially, the surface lowering attributed to ice melt is predominately located within ice-distal regions (Fig. 5), compared to the limited or localised surface lowering due to ice melt in ice-proximal areas. Ice-proximal meltout is attributed to the rapid melting of the buried Gígjökull terminus immediately following jökulhlaup deposition (Fig. 4 and P9 in Fig. 6) and meltout of individual ice blocks deposited during the later, smaller magnitude, less ice-rich jökulhaups. In contrast, surface elevation changes observed across wide areas of the distal portions of the Gígjökull basin are consistent with the meltout of a spatially extensive ice-rich jökulhlaup deposit (GPR unit between SS3 and SS4) (Fig. 8). The 15 April jökulhlaup consisted of an ice-rich slurry, which was observed flowing across the entire Gígjökull basin (Dunning and others, Reference Dunning2013). This deposit had a thickness of at least 8 m based on the total amount of surface lowering in ice-distal locations (Fig. 8). In addition to the meltout of ice within the 2010 jökulhlaup deposits, there is also potential that ice-distal surface lowering could be due to the meltout of buried glacier ice at depth. The terminus of Gígjökull was located in the ice-distal parts of the basin as recently as 1994 (Kirkbride and Dugmore, Reference Kirkbride and Dugmore2008). The spatial variations in surface elevation change shown in Figure 5 are interpreted to be the result of the ice-proximal to ice-distal tapering of deposit thickness (Fig. 7). Where the thickness of jökulhlaup sediment is greatest (i.e. beneath the proximal fan deposited by the later jökulhlaups between 20 April 2010 and 16 May 2010) (Fig. 7), there was little surface elevation change (2013–2016). In contrast, where the ice-slurry rich deposits associated with the 15 April jökulhlaups are closest to the surface (i.e. in ice-distal parts of the basin beyond the proximal fan), we observed high rates of surface lowering (2013–2016). This interpretation is consistent with evidence of deposit thickness influencing the ablation rates of buried ice masses elsewhere in southern Iceland (Price, Reference Price1971; Everest and Bradwell, Reference Everest and Bradwell2003).
Schematic model of the Gígjökull basin evolution following deposition from multiple jökulhlaups. Grey coloured deposits related to observed GPR units in Figure 7. (a) Deposition of jökulhaup sediments into proglacial water body during 14 April 2010 jökulhlaup (Dunning and others, Reference Dunning2013). (b) Development of large jökulhlaup deposit and emplacement of an ice-rich deposit in distal locations. Blue polygons represent ice-rich deposits (i.e. not an exact location of buried ice). (c and d) Post-jökulhlaup modification related to meltout of buried ice masses and fluvial incision.
The volume of the jökulhlaup deposit within the Gígjökull basin decreased by 0.95 × 10⁶ m3 a−1 (~16% per year) between May 2010 and October 2016 (Table 1). This is similar to the largest rate of post-jökulhlaup volumetric change (0.6 to 0.98 × 10⁶ m3 a−1) estimated at Mýrdalssandur in the 61 years between 1946 and 2007 (Duller and others, Reference Duller2014). Duller and others (Reference Duller2014) attributed surface lowering at Mýrdalssandur to subterranean groundwater channels, removing volcanic material by tranquil subsurface water flow. However, an alternative interpretation is that melt of buried ice over short timescales could have been a more important process at Mýrdalssandur than previously thought, particularly given the potential for high volumes of ice to be transported during jökulhlaups over Mýrdalssandur (Russell and others, Reference Russell, Duller and Mountney2009).
Fluvial incision and terrace formation
Incision of the Gígjökull deposits began as early as 4 May 2010 (Dunning and others, Reference Dunning2013), before the series of jökulhlaups had ended, with incision into ice-proximal deposits at the foot of the gorges and subsequent terrace formation (Fig. 3). Observations from July 2010 show that the meltwater stream emanating from the gorges rapidly occupied the space left by the rapid melting of the buried glacier margin. Further fluvial incision and terrace formation (July 2010 to September 2016) within the deposits led to the dissection of the deposit surface that was documented immediately post-eruption (Dunning and others, Reference Dunning2013). Incision into jökulhlaup deposits during post-flood lower magnitude fluvial activity is common in proglacial environments that have undergone aggradation from an outburst flood (Russell and others, Reference Russell, Duller and Mountney2009), and is one of many documented processes that occur in a glacio-volcanic outwash environment (Maizels, Reference Maizels1997). Elevation data (TLS-derived DEM from July 2010) indicate fluvial incision, and meltwater system development at Gígjökull can be seen to occur roughly 1 month following deposition, and is well developed by September 2013 (Fig. 5). This is consistent with the theory that incision and terrace formation into jökulhlaup deposits occurs rapidly after the jökulhlaups have ended (Marren and Toomath, Reference Marren and Toomath2013). The fluvial incision at Gígjökull is likely a result of an overall reduction in sediment supply since the end of the 2010 Eyjafjallajökull eruption and the fluvial system regrading along its long profile (Mackin, Reference Mackin1948; Schumm, Reference Schumm1979). Although the meltwater system has played a crucial role in the post-jökulhlaup geomorphic evolution of the Gígjökull basin, the meltout of buried ice masses (e.g. glacier ice, large ice blocks and small ice fragments) is believed to be the primary factor in determining the post-deposition evolution of the landscape.
Conclusions and wider implications
Analysis of geodetic data spanning from 2010 to 2016 has provided a comprehensive quantification of post-depositional surface-elevation change, and an assessment of the role of buried glacier ice in the post-depositional evolution of a jökulhlaup sandur. This study has quantified post-deposition rates of volumetric change within the Gígjökull basin of up to −1 × 10⁶ m3 a−1. Rates of surface lowering vary between proximal and distal locations and increase between 2015 and 2016. Combining the surface elevation change data with GPR profiles has allowed for the development of a schematic model displaying post-jökulhlaup landscape response as a result of ice-laden jökulhlaup flows (Fig. 8). Post-depositional meltout of buried ice masses is the dominant process in surface lowering within the Gígjökull basin. The presence of post-depositional meltout structures within the sub-surface of the deposits, the development of kettle holes throughout the Gígjökull basin and the nature of the surface lowering provide the supporting evidence for this interpretation. Proximal-to-distal variation in surface lowering is attributed to a thicker sediment body in ice-proximal locations insulating buried, jökulhlaup deposited ice. The uniform and rapid reduction in elevation in ice-distal locations is believed to reflect the degradation of the ice-rich 15 April 2010 jökulhlaup deposit. These results indicate that significant surface subsidence related to buried ice meltout can occur for at least 6 years following the emplacement of an ice-rich jökulhlaup deposit. This study has characterised the nature of surface lowering related to buried ice meltout and evaluated the role of ice in the development of jökulhlaup deposits. Further geophysical investigations (e.g. electrical resistivity tomography) are required to quantify and map out the locations and structure of buried ice masses.
Acknowledgements
This work was supported by an M.Phil. research bursary awarded to D. Harrison, from the School of Geography, Politics and Sociology, Newcastle University, and a Ph.D. studentship awarded to D. Harrison through the IAPETUS Natural Environmental Research Council Doctoral Training Partnership (NE/L002590/1). The immediate post-jökulhlaup TLS survey was acquired during fieldwork funded by a UK Natural Environment Research Council Urgency Grant (NE/I007628/1) awarded to A.J. Russell and S.A. Dunning. Fieldwork in September 2016 was supported by Newcastle University, School of Geography, Politics and Sociology small project grant awarded to N. Ross. This research was carried out under RANNIS research declaration number 21/2016. We thank Rupert Bainbridge for his assistance in the field during the 2010 jökulhlaups. We acknowledge the ArcticDEM project (Porter and others, Reference Porter2018) and DEMs provided by the Polar Geospatial Center under NSF-OPP awards 1043681, 1559691 and 1542736. We are grateful to Andy Large and Rob Duller for helpful comments during M.Phil. submission.





 Open access

