

Chronic diseases such as CVD, diabetes mellitus and metabolic syndrome are major causes of disabilities and global deaths(Reference Akter, Eguchi and Kuwahara1). Lipid profile, diabetic characteristics, blood pressure, anthropometric indices and inflammatory markers are some of the cardiometabolic risk factors. In fact, over 60 % of deaths from chronic diseases such as diabetes and chronic kidney disease in 2010 were attributable to cardiometabolic risk factors(Reference Danaei, Lu and Singh2). These risk factors are associated with a variety of genetic and environmental factors. One of the important environmental factors is diet, and various studies have shown the links between diet and these risk factors(Reference Akter, Eguchi and Kuwahara1). Nutritionists believe in evaluating the whole diet rather than individual nutrients because of the potential interaction among nutrients. One of the indices that assesses the whole diet is dietary acid load (DAL).
DAL can be related to cardiometabolic factors such as insulin resistance(Reference Akter, Eguchi and Kuwahara1,Reference Souto, Donapetry and Calvino3,Reference Williams, Heilbronn and Chen4) . Diets with a high acid load such as the Western dietary pattern can cause alteration or disequilibrium in blood pH and acid–base balance(Reference Williams, Heilbronn and Chen4). A high amount of animal proteins in the diet and inadequate bicarbonate intake from vegetables and fruits can exacerbate this condition(Reference Adeva and Souto5,Reference Engberink, Bakker and Brink6) . There are three methods for calculating DAL: (i) potential renal net acid load (PRAL) that, when positive, indicates an acid-forming potential(Reference Remer and Manz7); (ii) net endogenous acid production (NEAP) that indicates the high consumption of animal proteins(Reference Frassetto, Todd and Morris8); and (iii) net acid excretion (NAE) that indicates excess of dietary anions(Reference Remer and Manz9).
High serum lactate has been associated with insulin resistance and type 2 diabetes incidence(Reference Williams, Heilbronn and Chen4,Reference Crawford, Hoogeveen and Brancati10) . Moreover, increasing DAL is positively related to glycated Hb (HbA1c)(Reference Haghighatdoost, Najafabadi and Bellissimo11). On the other hand, there is some research that has indicated no relationship between DAL and insulin resistance, fasting glucose and HbA1c(Reference Murakami, Sasaki and Takahashi12,Reference Xu, Jia and Huang13) . Also, DAL has been shown to have a positive relationship with hypertension, hepatic TAG accumulation, total cholesterol (TC), LDL-cholesterol (LDL-C), BMI and waist circumference (WC)(Reference Akter, Eguchi and Kuwahara1,Reference Murakami, Sasaki and Takahashi12,Reference Krupp, Johner and Kalhoff14) . Acid–base balance can impact on the Mg and Ca mechanism that is related to control of blood pressure(Reference Akter, Eguchi and Kuwahara1,Reference Murakami, Sasaki and Takahashi12) . On the other hand, higher protein intake from animal-based foods can increase blood pressure(Reference Remer, Zhang and Curhan15).
To our knowledge, there is no systematic review examining the association of DAL with cardiometabolic risk factors. Therefore, we conducted the present systematic review and meta-analysis aimed at determining the relationship between DAL and cardiometabolic risk factors.
Materials and methods
The Preferred Reporting Items for Systematic Reviews and Meta-Analysis (PRISMA) checklist was followed in conducting the current review.
Search strategy
Scopus, ISI Web of Science, PubMed/MEDLINE and Google Scholar databases were searched systematically to obtain studies published up to December 2017. Medical subject headings (MeSH) and several text words were used as a search syntax for searching: dietary acid load, potential renal acid load, net endogenous acid production, insulin, blood sugar, abdominal obesity, central obesity, visceral obesity, waist circumference, BMI, Quetelet Index, HbA1c, glycosylated haemoglobin A, triacylglycerol, diabetes, high blood pressure, low density lipoprotein cholesterol, beta-lipoprotein cholesterol, body weight, high density lipoprotein cholesterol, alpha-lipoprotein cholesterol, HDL cholesterol (see online supplementary material, Supplemental Table S1). Reference lists of all studies were checked for any relationship with the topic. Two authors (E.D. and F.H.) did all of these steps independently and the third author (L.A.) checked them to resolve any disagreement.
Inclusion and exclusion criteria
All observational studies including cross-sectional, case–control and cohort studies that investigated the association of DAL with cardiometabolic factors were selected for inclusion in the present systematic review and meta-analysis. We considered articles which assessed both genders. Also, we had no restriction on age, BMI, study setting, socio-economic status and education level, type of disease or sample size. No restriction was set on publication date. Non-English papers, clinical trials, books, conference papers, reviews, non-related studies and studies which had insufficient data were excluded. The PICOS (participants, intervention, comparison, outcomes and study design) criteria used to define the research question were as follows. P: all apparently healthy people or individuals with diabetes and hypertension; however, pregnant women, infants, and individuals with malignant diseases such as cancers were excluded. I: dietary acid load. C: highest n-tile v. lowest n-tile. O: BMI, WC, HDL-cholesterol (HDL-C), LDL-C, TAG, TC, diastolic blood pressure (DBP), systolic blood pressure (SBP), fasting blood sugar (FBS), HbA1c, serum insulin and homeostatic model assessment of insulin resistance (HOMA-IR). S: observational studies.
Data extraction
For each relevant study, E.D. and F.H extracted data about the first author’s name, publication date, country, sample size, participants’ age and gender, type of study, method used to assess DAL and study duration. Also extracted were the means, sd and se of all study variables including weight, BMI, WC, LDL-C, HDL-C, TC, TAG, FBS, HbA1c, serum insulin, DBP and SBP according to the lowest and highest levels of DAL from descriptive tables. Because of limited data on odds ratios or hazard ratios, we considered means and corresponding sd according to n-tiles of DAL score. The Newcastle–Ottawa Scale was used to evaluate the quality of included studies and this score for each study is shown in Table 1. Studies that obtained six or more points were considered to be of high quality(Reference Wells, Shea and O’Connell16).
Characteristics of observational studies included in the current systematic review and meta-analysis on dietary acid load and cardiometabolic risk factors

DAL, dietary acid load; NOS, Newcastle–Ottawa Scale; Q, quintile or quartile; T, tertile; D, decile; M, male; F, female; NAE, net acid excretion; PRAL, potential renal net acid load; NEAP, net endogenous acid production; DHQ, diet history questionnaire; WC, waist circumference; SBP, systolic blood pressure; DBP, diastolic blood pressure; TC, total cholesterol; HDL-C, HDL-cholesterol; LDL-C, LDL-cholesterol; FBS, fasting blood sugar; HbA1c, glycated Hb; HOMA-IR, homeostatic model assessment of insulin resistance.
* indicates consecutive studies by the same authors that come from just one article but with different situations, such as difference in gender or type of outcome assessed.
Statistical analysis
The means and corresponding sd of all variables of all included studies in the lowest and the highest n-tiles of DAL were used to calculate the weighted mean difference (WMD) as effect size in the meta-analysis. In cases that sd was not reported, we calculated sd using se and sample size. Analysis was performed by the fixed-effect model and the DerSimonian–Laird random-effect model was used for variables with high heterogeneity. Subgroup analyses according to type of study, participant age, participant gender, study quality, type of DAL measurement and type of food assessment were performed with Cochran’s Q test and the I 2 statistic for evaluating the possible sources of heterogeneity. Also, publication bias was assessed using funnel plots and Egger’s regression test. Sensitivity analyses were run to determine the extent to which summary estimates might be related to one particular study or a group of studies, done in accordance with the Cochrane handbook for systematic reviews of observational studies.
All statistical analyses were performed using the statistical software package Stata version 14. P < 0.05 for the association of all variables with DAL, also P < 0.1 for heterogeneity, were considered statistically significant.
Results
Systematic review
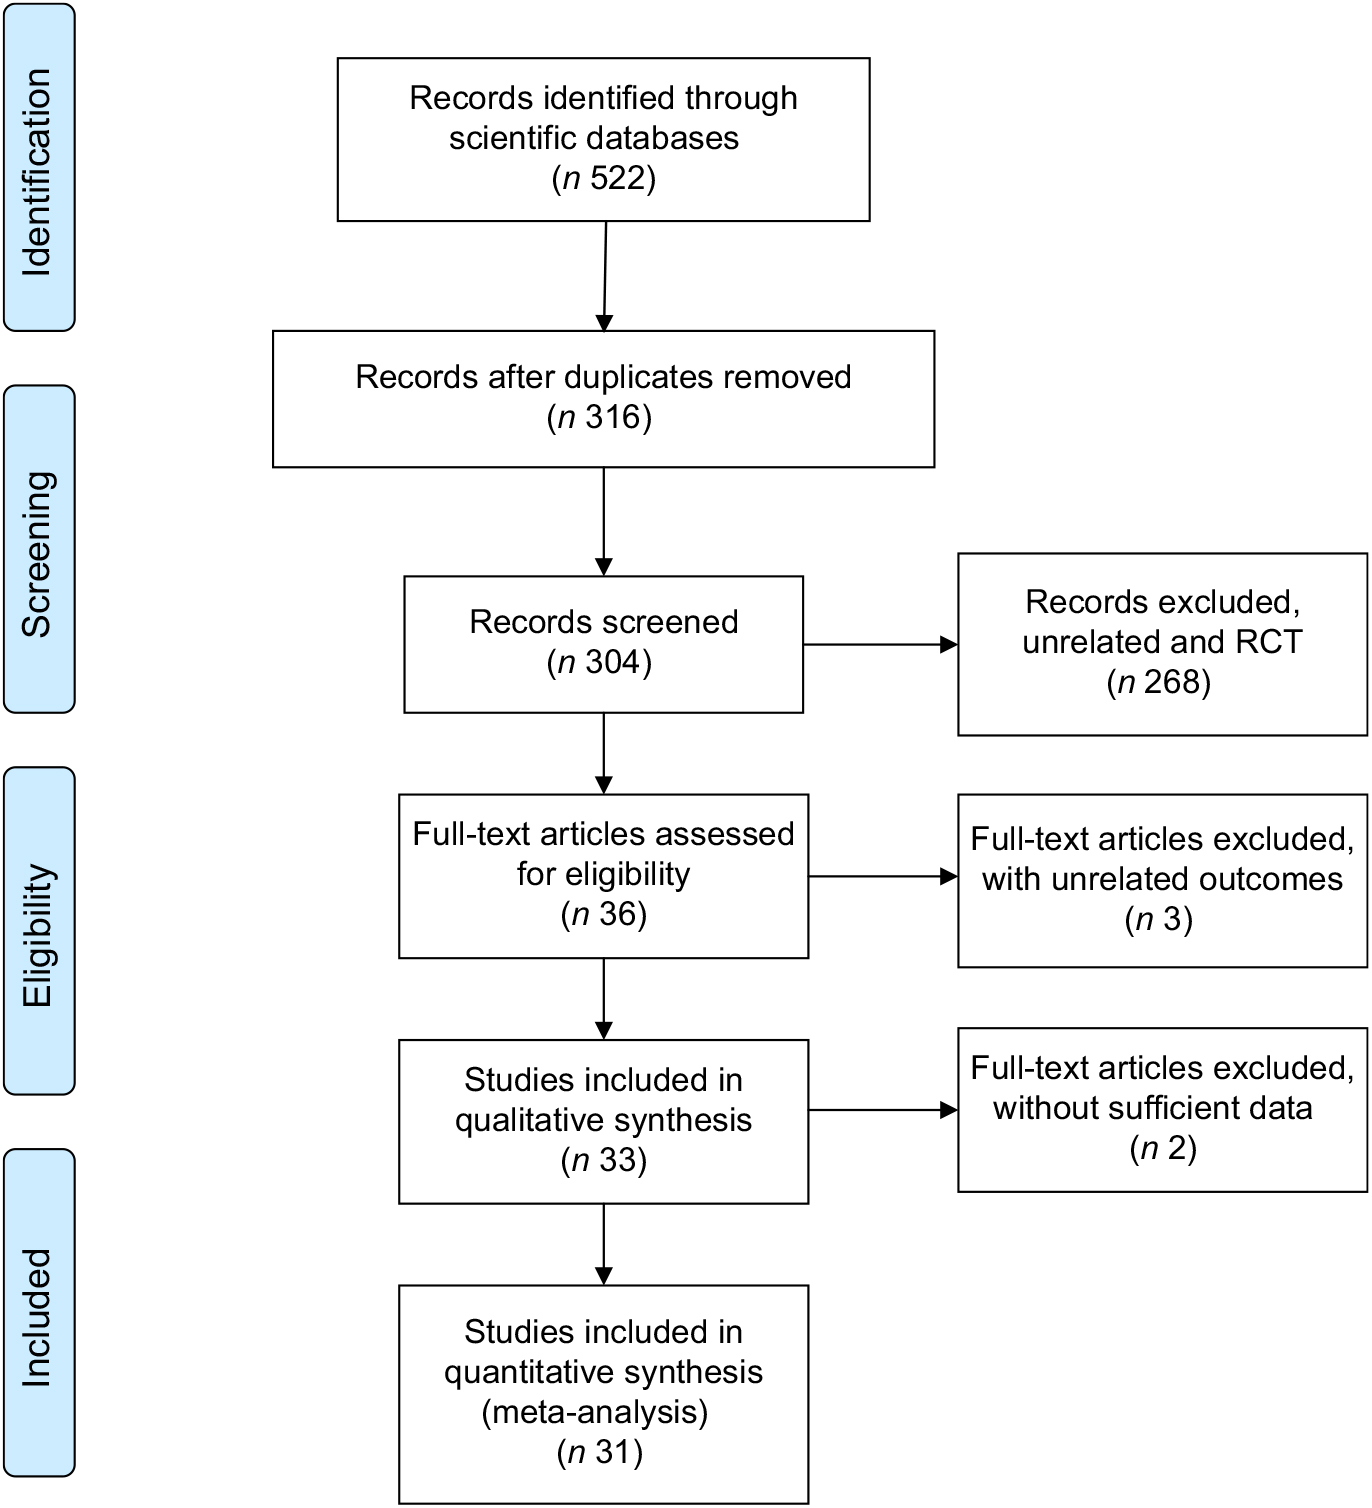
As shown in Fig. 1, 522 records were accessed by searching the scientific databases of which 316 records remained after removing the 206 duplicate references. After exclusion of irrelevant studies, sixteen cohort studies(Reference Engberink, Bakker and Brink6,Reference Xu, Jia and Huang13,Reference Wright, Michaud and Pietinen17–Reference Akter, Nanri and Mizoue30) and seventeen cross-sectional studies(Reference Akter, Eguchi and Kuwahara1,Reference Haghighatdoost, Najafabadi and Bellissimo11,Reference Murakami, Sasaki and Takahashi12,Reference Welch, Bingham and Reeve31–Reference Shea, Gilhooly and Dawson-Hughes44) were included in the current systematic review. Characteristics of the included studies, which were published between 2005 and 2017, are shown in Table 1. The sample size of these studies ranged from sixty-three to 92 478 individuals, and totally just 3574 individuals were aged 17 years or younger. Of thirty-three included studies, eleven were conducted in the Asia(Reference Akter, Eguchi and Kuwahara1,Reference Haghighatdoost, Najafabadi and Bellissimo11,Reference Murakami, Sasaki and Takahashi12,Reference Chan, Leung and Woo22,Reference Akter, Kurotani and Kashino25,Reference Moghadam, Bahadoran and Mirmiran27,Reference Akter, Nanri and Mizoue30,Reference Bahadoran, Mirmiran and Khosravi37,Reference Akter, Eguchi and Kurotani38,Reference Han, Kim and Hong41) , fourteen in Europe(Reference Engberink, Bakker and Brink6,Reference Xu, Jia and Huang13,Reference Wright, Michaud and Pietinen17,Reference Krupp, Shi and Remer20,Reference Fagherazzi, Vilier and Bonnet21,Reference Garcia, Franco and Voortman23,Reference Jia, Byberg and Lindholm24,Reference Esche, Shi and Sánchez-Guijo26,Reference Xu, Akesson and Orsini29,Reference Welch, Bingham and Reeve31,Reference Wynn, Lanham-New and Krieg32,Reference Berg, Engberink and Brink34,Reference Krupp, Shi and Maser-Gluth36,Reference Luis, Huang and Riserus43) and eight in the USA(Reference Zhang, Curhan and Forman18,Reference Scialla, Appel and Astor19,Reference Scialla, Asplin and Dobre28,Reference Scialla, Appel and Astor33,Reference Amodu and Abramowitz35,Reference Huston, Abramowitz and Zhang39,Reference Ikizler, Zelnick and Ruzinski42,Reference Shea, Gilhooly and Dawson-Hughes44) . Four studies were done on men(Reference Xu, Jia and Huang13,Reference Wright, Michaud and Pietinen17,Reference Scialla, Appel and Astor33,Reference Luis, Huang and Riserus43) , five on women(Reference Murakami, Sasaki and Takahashi12,Reference Zhang, Curhan and Forman18,Reference Fagherazzi, Vilier and Bonnet21,Reference Garcia, Franco and Voortman23,Reference Wynn, Lanham-New and Krieg32) and the remaining studies implied on both genders. Statistical analysis was performed separately for men and women in five studies(Reference Garcia, Franco and Voortman23,Reference Akter, Kurotani and Kashino25,Reference Xu, Akesson and Orsini29,Reference Welch, Bingham and Reeve31,Reference Shea, Gilhooly and Dawson-Hughes44) . DAL had been assessed by NAE method in six studies(Reference Wright, Michaud and Pietinen17,Reference Krupp, Shi and Remer20,Reference Esche, Shi and Sánchez-Guijo26,Reference Scialla, Asplin and Dobre28,Reference Berg, Engberink and Brink34,Reference Shea, Gilhooly and Dawson-Hughes44) , PRAL in nineteen(Reference Akter, Eguchi and Kuwahara1,Reference Engberink, Bakker and Brink6,Reference Haghighatdoost, Najafabadi and Bellissimo11–Reference Xu, Jia and Huang13,Reference Krupp, Shi and Remer20,Reference Fagherazzi, Vilier and Bonnet21,Reference Garcia, Franco and Voortman23,Reference Akter, Kurotani and Kashino25,Reference Moghadam, Bahadoran and Mirmiran27,Reference Xu, Akesson and Orsini29–Reference Welch, Bingham and Reeve31,Reference Krupp, Shi and Maser-Gluth36–Reference Akter, Eguchi and Kurotani38,Reference Iwase, Tanaka and Kobayashi40,Reference Han, Kim and Hong41,Reference Luis, Huang and Riserus43) and NEAP in nine studies(Reference Zhang, Curhan and Forman18,Reference Scialla, Appel and Astor19,Reference Chan, Leung and Woo22,Reference Jia, Byberg and Lindholm24,Reference Wynn, Lanham-New and Krieg32,Reference Scialla, Appel and Astor33,Reference Amodu and Abramowitz35,Reference Huston, Abramowitz and Zhang39,Reference Ikizler, Zelnick and Ruzinski42) . These assessment methods were assessed and calculated using FFQ(Reference Engberink, Bakker and Brink6,Reference Haghighatdoost, Najafabadi and Bellissimo11,Reference Zhang, Curhan and Forman18,Reference Chan, Leung and Woo22–Reference Akter, Kurotani and Kashino25,Reference Moghadam, Bahadoran and Mirmiran27,Reference Xu, Akesson and Orsini29–Reference Wynn, Lanham-New and Krieg32,Reference Bahadoran, Mirmiran and Khosravi37,Reference Shea, Gilhooly and Dawson-Hughes44) , 24 h urine collection(Reference Wright, Michaud and Pietinen17,Reference Scialla, Appel and Astor19,Reference Esche, Shi and Sánchez-Guijo26,Reference Scialla, Asplin and Dobre28,Reference Scialla, Appel and Astor33,Reference Berg, Engberink and Brink34) , diet history questionnaire(Reference Akter, Eguchi and Kuwahara1,Reference Murakami, Sasaki and Takahashi12,Reference Fagherazzi, Vilier and Bonnet21,Reference Akter, Eguchi and Kurotani38,Reference Iwase, Tanaka and Kobayashi40) , 24 h food recall(Reference Amodu and Abramowitz35,Reference Huston, Abramowitz and Zhang39,Reference Han, Kim and Hong41,Reference Shea, Gilhooly and Dawson-Hughes44) , 3 d dietary record(Reference Krupp, Shi and Maser-Gluth36,Reference Ikizler, Zelnick and Ruzinski42) and 7 d dietary record(Reference Xu, Jia and Huang13,Reference Krupp, Shi and Remer20,Reference Luis, Huang and Riserus43) . Included studies had assessed weight(Reference Esche, Shi and Sánchez-Guijo26,Reference Moghadam, Bahadoran and Mirmiran27,Reference Bahadoran, Mirmiran and Khosravi37) , BMI(Reference Akter, Eguchi and Kuwahara1,Reference Engberink, Bakker and Brink6,Reference Haghighatdoost, Najafabadi and Bellissimo11–Reference Xu, Jia and Huang13,Reference Wright, Michaud and Pietinen17–Reference Scialla, Appel and Astor19,Reference Fagherazzi, Vilier and Bonnet21–Reference Esche, Shi and Sánchez-Guijo26,Reference Scialla, Asplin and Dobre28–Reference Scialla, Appel and Astor33,Reference Amodu and Abramowitz35,Reference Bahadoran, Mirmiran and Khosravi37–Reference Shea, Gilhooly and Dawson-Hughes44) , WC(Reference Haghighatdoost, Najafabadi and Bellissimo11,Reference Murakami, Sasaki and Takahashi12,Reference Bahadoran, Mirmiran and Khosravi37,Reference Han, Kim and Hong41) , TC(Reference Engberink, Bakker and Brink6,Reference Haghighatdoost, Najafabadi and Bellissimo11,Reference Murakami, Sasaki and Takahashi12,Reference Berg, Engberink and Brink34,Reference Han, Kim and Hong41) , HDL-C(Reference Engberink, Bakker and Brink6,Reference Murakami, Sasaki and Takahashi12,Reference Moghadam, Bahadoran and Mirmiran27,Reference Berg, Engberink and Brink34,Reference Han, Kim and Hong41) , LDL-C(Reference Haghighatdoost, Najafabadi and Bellissimo11,Reference Murakami, Sasaki and Takahashi12,Reference Moghadam, Bahadoran and Mirmiran27,Reference Iwase, Tanaka and Kobayashi40,Reference Han, Kim and Hong41) , TAG(Reference Haghighatdoost, Najafabadi and Bellissimo11,Reference Murakami, Sasaki and Takahashi12,Reference Berg, Engberink and Brink34,Reference Bahadoran, Mirmiran and Khosravi37,Reference Iwase, Tanaka and Kobayashi40,Reference Han, Kim and Hong41) , FBS(Reference Haghighatdoost, Najafabadi and Bellissimo11–Reference Xu, Jia and Huang13,Reference Moghadam, Bahadoran and Mirmiran27,Reference Bahadoran, Mirmiran and Khosravi37,Reference Han, Kim and Hong41,Reference Ikizler, Zelnick and Ruzinski42) , HbA1c(Reference Haghighatdoost, Najafabadi and Bellissimo11,Reference Murakami, Sasaki and Takahashi12,Reference Berg, Engberink and Brink34,Reference Iwase, Tanaka and Kobayashi40) , HOMA-IR(Reference Haghighatdoost, Najafabadi and Bellissimo11,Reference Moghadam, Bahadoran and Mirmiran27) , insulin(Reference Haghighatdoost, Najafabadi and Bellissimo11,Reference Moghadam, Bahadoran and Mirmiran27,Reference Ikizler, Zelnick and Ruzinski42) , SBP(Reference Engberink, Bakker and Brink6,Reference Haghighatdoost, Najafabadi and Bellissimo11,Reference Murakami, Sasaki and Takahashi12,Reference Krupp, Shi and Remer20,Reference Moghadam, Bahadoran and Mirmiran27,Reference Berg, Engberink and Brink34,Reference Krupp, Shi and Maser-Gluth36,Reference Bahadoran, Mirmiran and Khosravi37,Reference Iwase, Tanaka and Kobayashi40–Reference Luis, Huang and Riserus43) and DBP(Reference Engberink, Bakker and Brink6,Reference Murakami, Sasaki and Takahashi12,Reference Krupp, Shi and Remer20,Reference Moghadam, Bahadoran and Mirmiran27,Reference Berg, Engberink and Brink34,Reference Bahadoran, Mirmiran and Khosravi37,Reference Han, Kim and Hong41–Reference Luis, Huang and Riserus43) in relation to n-tiles of DAL. These outcomes were reported as mean and sd across n-tiles of DAL measurement; therefore, we compared the changes of the outcomes’ effect size by conducting a meta-analysis as reported below. Amodu and Abramowitz’s study(Reference Amodu and Abramowitz35) presented BMI in relation to DAL by percentage in underweight, normal, overweight and obese status. Also, Krupp et al.’s(Reference Krupp, Shi and Remer20) study did not present sufficient data for combining and performing a meta-analysis; therefore, we mentioned these two studies just in the systematic review. Only two studies(Reference Akter, Eguchi and Kuwahara1,Reference Haghighatdoost, Najafabadi and Bellissimo11) presented considerable outcomes with adjustment, and the rest of the studies had no adjustment for outcomes. All included studies except four of them(Reference Murakami, Sasaki and Takahashi12,Reference Wynn, Lanham-New and Krieg32,Reference Iwase, Tanaka and Kobayashi40,Reference Ikizler, Zelnick and Ruzinski42) were of high quality based on the Newcastle–Ottawa Scale.
Flow diagram showing the selection of observational studies for the current systematic review and meta-analysis on dietary acid load and cardiometabolic risk factors (RCT, randomized controlled trial)
Totally nine included studies showed a significant(Reference Engberink, Bakker and Brink6,Reference Fagherazzi, Vilier and Bonnet21,Reference Akter, Kurotani and Kashino25,Reference Scialla, Asplin and Dobre28,Reference Akter, Nanri and Mizoue30,Reference Amodu and Abramowitz35,Reference Bahadoran, Mirmiran and Khosravi37,Reference Huston, Abramowitz and Zhang39,Reference Han, Kim and Hong41) or marginally significant(Reference Scialla, Appel and Astor33) positive association between DAL and BMI. Also, thirteen included studies had no significant association between DAL and BMI(Reference Akter, Eguchi and Kuwahara1,Reference Haghighatdoost, Najafabadi and Bellissimo11–Reference Xu, Jia and Huang13,Reference Scialla, Appel and Astor19,Reference Chan, Leung and Woo22–Reference Jia, Byberg and Lindholm24,Reference Moghadam, Bahadoran and Mirmiran27,Reference Welch, Bingham and Reeve31,Reference Akter, Eguchi and Kurotani38,Reference Iwase, Tanaka and Kobayashi40,Reference Luis, Huang and Riserus43) . In addition, one study had no significant(Reference Bahadoran, Mirmiran and Khosravi37) relationship between weight and DAL. There were only two studies that reported weight across DAL n-tiles; therefore, we could not perform meta-analysis on this variable. Two studies showed a significant positive relationship between WC and DAL(Reference Murakami, Sasaki and Takahashi12,Reference Bahadoran, Mirmiran and Khosravi37) ; however, others(Reference Haghighatdoost, Najafabadi and Bellissimo11,Reference Han, Kim and Hong41) did not find a significant association.
Six studies(Reference Engberink, Bakker and Brink6,Reference Haghighatdoost, Najafabadi and Bellissimo11,Reference Murakami, Sasaki and Takahashi12,Reference Krupp, Shi and Remer20,Reference Krupp, Shi and Maser-Gluth36,Reference Han, Kim and Hong41) indicated a positive significant relationship between SBP and DAL, whereas five studies had no significant association between SBP and DAL(Reference Moghadam, Bahadoran and Mirmiran27,Reference Berg, Engberink and Brink34,Reference Bahadoran, Mirmiran and Khosravi37,Reference Iwase, Tanaka and Kobayashi40,Reference Luis, Huang and Riserus43) . In addition, three studies showed a positive significant association between DBP and DAL(Reference Murakami, Sasaki and Takahashi12,Reference Krupp, Shi and Remer20,Reference Han, Kim and Hong41) , while five studies had no significant relationship(Reference Engberink, Bakker and Brink6,Reference Moghadam, Bahadoran and Mirmiran27,Reference Berg, Engberink and Brink34,Reference Bahadoran, Mirmiran and Khosravi37,Reference Luis, Huang and Riserus43) .
Five studies found no significant relationship between FBS and DAL(Reference Akter, Eguchi and Kuwahara1,Reference Murakami, Sasaki and Takahashi12,Reference Moghadam, Bahadoran and Mirmiran27,Reference Bahadoran, Mirmiran and Khosravi37,Reference Han, Kim and Hong41) , as well as no association of insulin, HOMA-IR(Reference Moghadam, Bahadoran and Mirmiran27,Reference Han, Kim and Hong41) and HbA1c(Reference Akter, Eguchi and Kuwahara1,Reference Murakami, Sasaki and Takahashi12,Reference Berg, Engberink and Brink34,Reference Iwase, Tanaka and Kobayashi40) with DAL. However, Haghighatdoost et al. found a significant positive relationship between FBS, HbA1c and DAL(Reference Haghighatdoost, Najafabadi and Bellissimo11). Akter et al. found a significant positive relationship between insulin, HOMA-IR and DAL(Reference Akter, Eguchi and Kuwahara1).
Three studies found no significant relationship between TAG and DAL(Reference Moghadam, Bahadoran and Mirmiran27,Reference Berg, Engberink and Brink34,Reference Bahadoran, Mirmiran and Khosravi37) ; however, other studies indicated a significant positive association(Reference Haghighatdoost, Najafabadi and Bellissimo11,Reference Iwase, Tanaka and Kobayashi40,Reference Han, Kim and Hong41) . Three studies(Reference Engberink, Bakker and Brink6,Reference Haghighatdoost, Najafabadi and Bellissimo11,Reference Han, Kim and Hong41) indicated no significant association between TC and DAL, but Murakami et al. (Reference Murakami, Sasaki and Takahashi12) and Berg et al. (Reference Berg, Engberink and Brink34) indicated a significant association. Several studies had no significant relationship between LDL-C and DAL(Reference Haghighatdoost, Najafabadi and Bellissimo11,Reference Moghadam, Bahadoran and Mirmiran27,Reference Iwase, Tanaka and Kobayashi40) ; however, Murakami et al. (Reference Murakami, Sasaki and Takahashi12) and Han et al. (Reference Han, Kim and Hong41) indicated a significant association. Murakami et al. (Reference Murakami, Sasaki and Takahashi12), Berg et al. (Reference Berg, Engberink and Brink34) and Han et al. (Reference Han, Kim and Hong41) did not show a significant relationship between HDL-C and DAL, but one study showed a marginally significant(Reference Engberink, Bakker and Brink6) positive association between DAL and HDL-C.
Meta-analysis
Of thirty-three studies, two studies were excluded because of insufficient data; thus thirty-one studies (sixteen cohort and seventeen cross-sectional studies) were included in the meta-analysis. Means and sd for mentioned outcomes in all studies were considered in analysis. Meta-analysis on the association of anthropometric indices, lipid profiles, blood sugar and blood pressure with DAL was performed in cross-sectional and cohort studies separately, and results are presented in Figs 2 and 3 and the online supplementary material. Subgroup analyses based on age, gender, method of DAL assessment, dietary intake assessment tool and study quality are presented in Supplemental Tables S2 to S11.
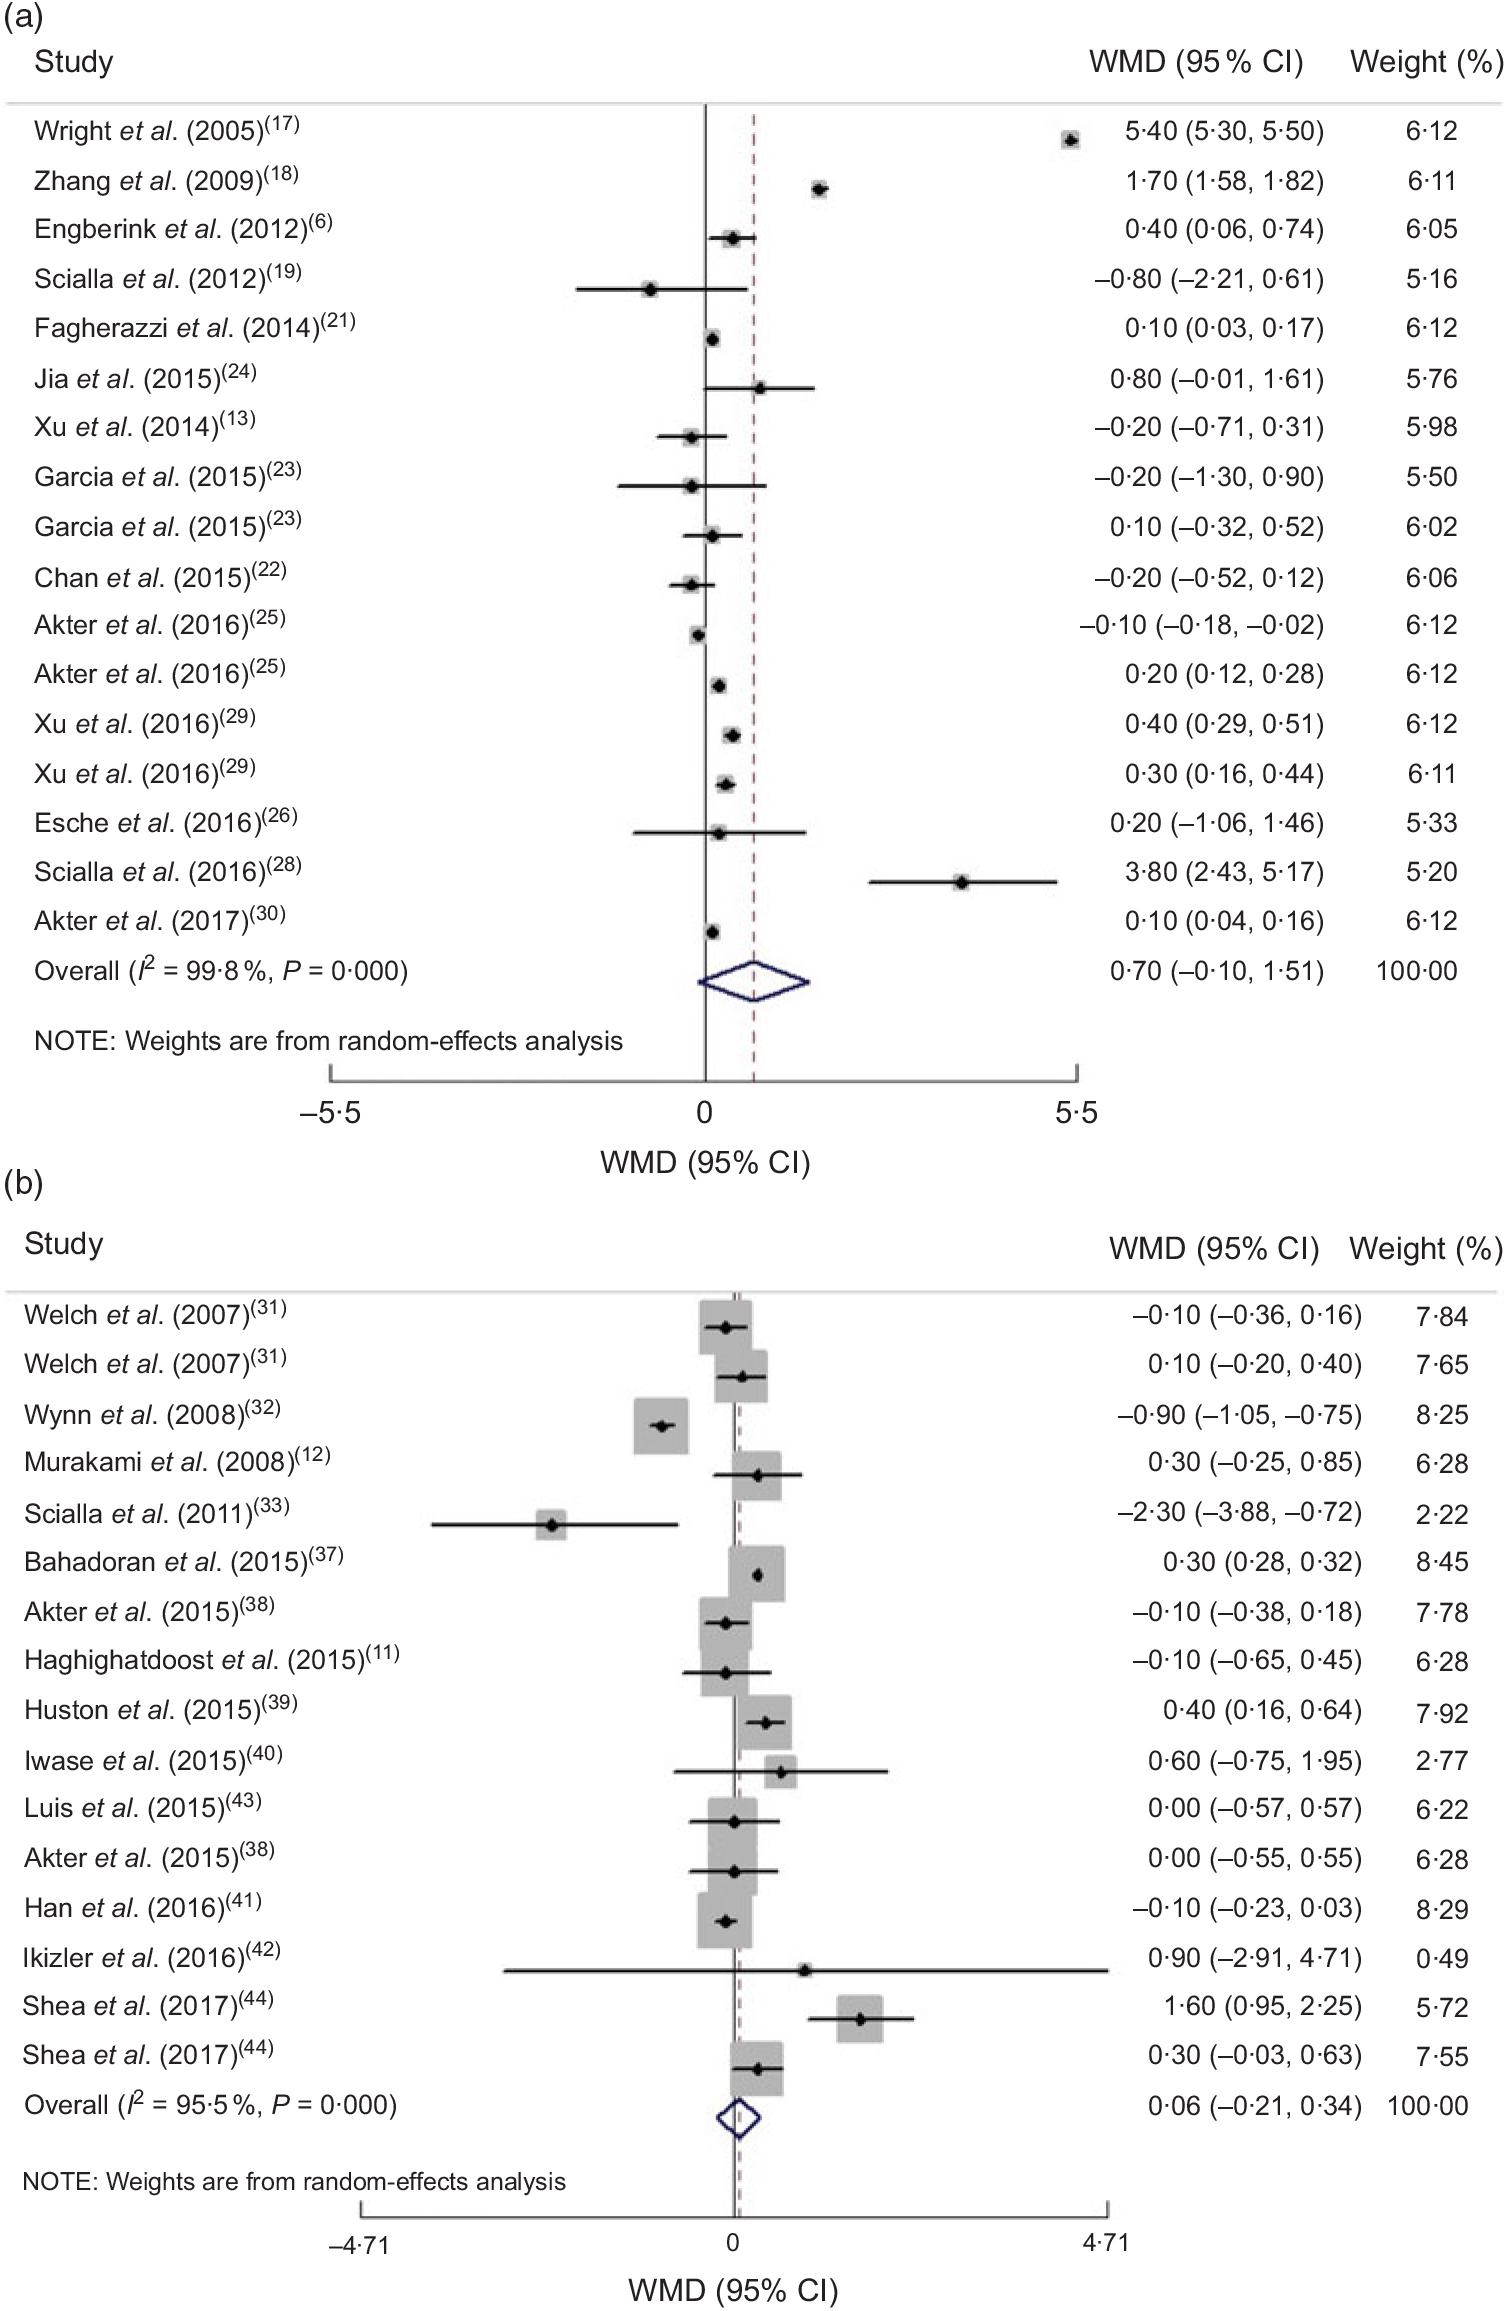
(a) Forest plot for the association between dietary acid load and BMI in cohort studies by the random-effect model; (b) Forest plot for the association between dietary acid load and BMI in cross-sectional studies by the random-effect model. The study-specific effect size (expressed as weighted mean difference (WMD)) and 95 % CI are represented by the solid diamond and horizontal line, respectively; the area of the grey square is proportional to the specific-study weight to the overall meta-analysis. The centre of the open diamond and the vertical dashed line represent the pooled effect size, and the width of the open diamond represents the pooled 95 % CI
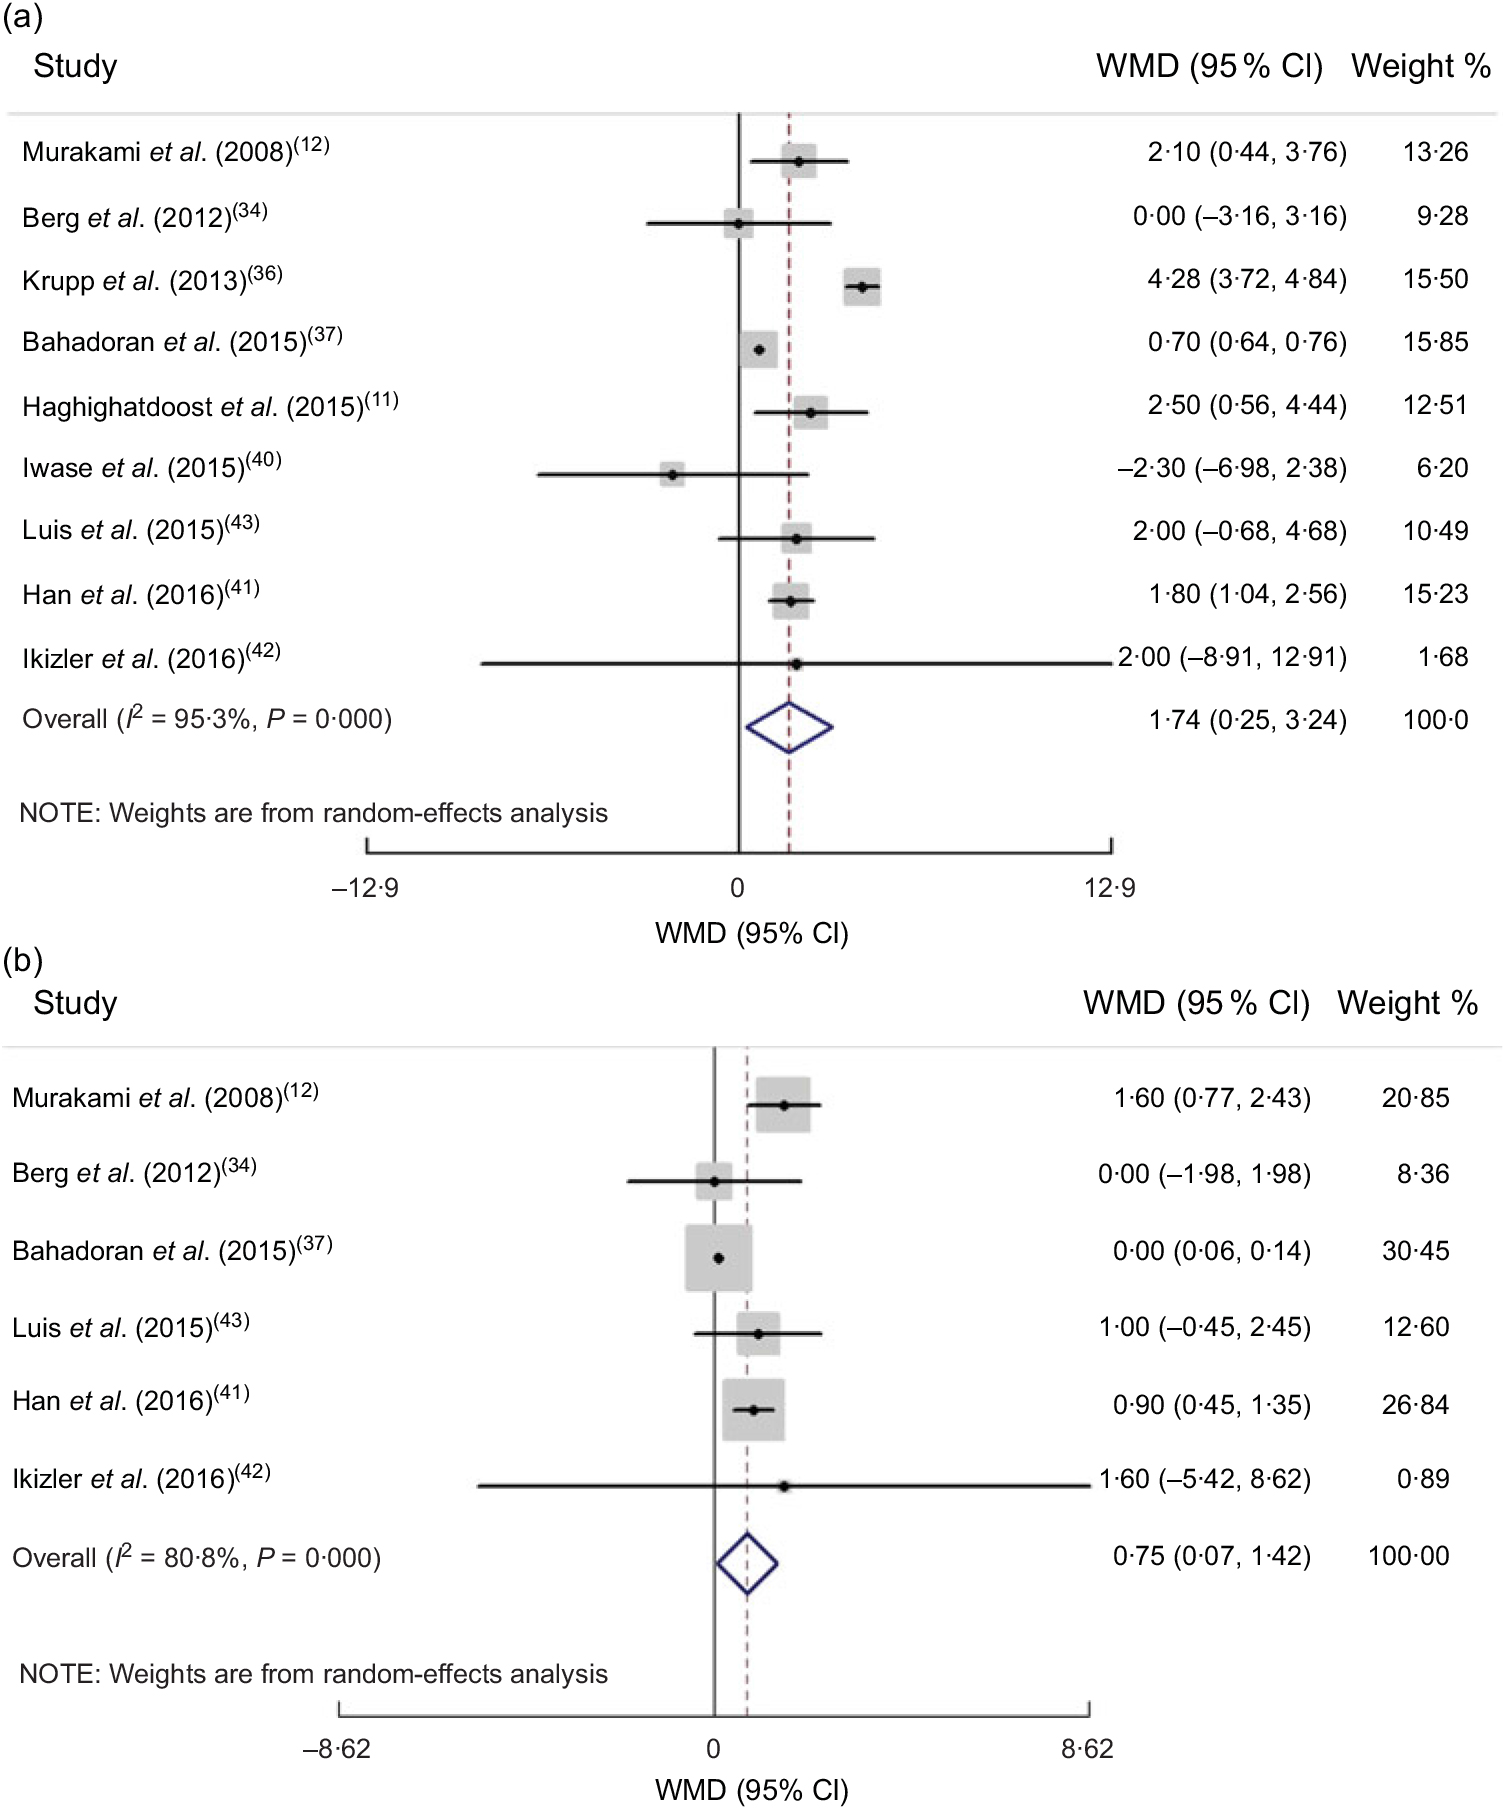
(a) Forest plot for the association between dietary acid load and systolic blood pressure in cross-sectional studies by random-effect model; (b) Forest plot for the association between dietary acid load and diastolic blood pressure in cross-sectional studies by random-effect model. The study-specific effect size (expressed as weighted mean difference (WMD)) and 95 % CI are represented by the solid diamond and horizontal line, respectively; the area of the grey square is proportional to the specific-study weight to the overall meta-analysis. The centre of the open diamond and the vertical dashed line represent the pooled effect size, and the width of the open diamond represents the pooled 95 % CI
Anthropometric measures
Combining effect sizes of both cohort and cross-sectional studies revealed a non-significant association between DAL and BMI by the random-effect model (pooled effect size = 0·39 (95 % CI −0·02, 0·80) kg/m2, P = 0·062; I 2 = 99·7 %, P < 0·0001). Since cross-sectional studies present less power in defining causation, we separated the results based on type of study. Combining the seventeen cohort studies by random-effects analysis indicated that there was no association between DAL and BMI (pooled effect size = 0·70 (95 % CI −0·10, 1·51) kg/m2, P = 0·088; I 2 = 99·8 %, P < 0·0001; Fig. 2(a)).
When we performed subgroup analysis based on age, the significant positive association was seen for individuals older than 17 years (pooled effect size = 0·69 (95 % CI 0·66, 0·72) kg/m2, P < 0·0001; I 2 = 99·9 %, P < 0·0001), while the relationship was not significant in individuals younger than 17 years old (pooled effect size = 0·11 (95 % CI −0·29, 0·51) kg/m2, P = 0·590; I 2 = 0 %, P = 0·883). We found that age was a source of heterogeneity (Supplemental Table S2).
Combining sixteen effect sizes of cross-sectional studies revealed no association between DAL and BMI (pooled effect size by random-effect model = 0·06 (95 % CI −0·21, 0·34) kg/m2, P = 0·651; I 2 = 95·5 %, P < 0·0001; Fig. 2(b)). Based on subgroup analyses, the method of dietary assessment and health status were the sources of the heterogeneity (Supplemental Table S3).
Overall analysis of four cross-sectional studies which reported WC showed that there was no significant relationship between WC and DAL (pooled effect size based on random-effect model = 0·42 (95 % CI −0·80, 1·65) cm, P = 0·495; I 2 = 96·3 %, P < 0·0001). We could not find the source of heterogeneity for this relationship by subgroup analysis (Supplemental Table S4). Moreover, there was not enough effect size to pool for determining the association of WC and DAL in cohort studies.
Blood pressure
By combining two effect sizes of cohort studies, no significant association was observed between SBP and DAL (pooled effect size = 1·12 (95 % CI −0·002, 2·25) mmHg; P = 0·050; I 2 = 0 %, P = 0·443), or between DBP and DAL (pooled effect size = 0·61 (95 % CI −0·17, 1·40) mmHg, P = 0·127; I 2 = 0 %, P = 0·927).
Combining six effect sizes of cross-sectional studies revealed a positive association between SBP, DBP and DAL, in fixed-effect models. Because of high heterogeneity also after performing random-effect models, there was a significant relationship between SBP, DBP and DAL (pooled effect size = 1·74 (95 % CI 0·25, 3·24) mmHg, P = 0·022; I 2 = 95·3 %, P < 0·0001 and pooled effect size = 0·75 (95 % CI 0·07, 1·42) mmHg; P = 0·030; I 2 = 80·8 %, P < 0·0001, respectively; Fig. 3(a) and (b), respectively). Based on subgroup analysis, the method of dietary assessment, study quality and health status were the sources of heterogeneity for SBP and DBP. When we performed subgroup analysis based on dietary assessment, the significant positive association was seen for individuals whose dietary intake was assessed by food records (pooled effect size = 4·18 (95 % CI 3·63, 4·73) mmHg, P < 0·0001; I 2 = 28·9 %, P = 0·245; Supplemental Tables S5 and S6).
Serum lipids
Findings from four cross-sectional studies revealed that there was no association between DAL and TC by the random-effect model (pooled effect size = −1·94 (95 % CI −7·97, 3·90) mg/dl; P = 0·515; I 2= 86·1 %, P < 0·0001). Health status was the source of heterogeneity for the association between TC and DAL (Supplemental Table S7). Moreover, there was not enough effect size to pool for determining the association of TC and DAL in cohort studies.
Findings from three cross-sectional studies (pooled effect size = 0·09 (95 % CI −0·42, 0·61) mg/dl, P = 0·713; I 2 = 0 %, P = 0·998) and two cohort studies (pooled effect size = −0·55 (95 % CI −1·70, 0·60) mg/dl, P = 0·348; I 2 = 3·3 %, P = 0·309) revealed that there was no association between DAL and HDL-C by fixed-effect models.
Findings from four cross-sectional studies revealed that there was no association between DAL and LDL-C by the random-effect model (pooled effect size = 1·61 (95 % CI −2·19, 5·42) mg/dl, P = 0·407; I 2 = 68·5 %, P = 0·023). Gender, dietary assessment and study quality were the sources of heterogeneity for the association of LDL-C with DAL (Supplemental Table S8). Moreover, there was not enough effect size to pool for determining the association of LDL-C with DAL in cohort studies.
Findings from six cross-sectional studies revealed that there was a non-significant association between DAL and TAG by the random-effect model (pooled effect size = 4·46 (95 % CI −0·76, 9·70) mg/dl, P = 0·515; I 2 = 82·9 %, P < 0·0001). We did not find the sources of heterogeneity for the association between TAG and DAL (Supplemental Table S9). Moreover, there was not enough effect size to pool for determining the association of TAG with DAL in cohort studies.
Glycaemic parameters
Overall, combining eight studies that reported FBS by the fixed-effect model showed a significant positive association between FBS and DAL with high heterogeneity; however, after performing a random-effect model, there was no significant association (pooled effect size = −3·73 (95 % CI −9·99, 2·51) mg/dl, P = 0·242; I 2 = 99·5 %, P < 0·0001). Since cross-sectional studies present less power in defining causation, we separated the results based on study type. Combining six effect sizes of cross-sectional studies indicated that there was no association between DAL and FBS (pooled effect size = 0·43 (95 % CI −3·68, 4·54) mg/dl, P = 0·839; I 2 = 98·5 %, P < 0·0001). Dietary assessment and study quality were the sources of heterogeneity for the association of FBS with DAL (Supplemental Table S10). Moreover, combining two effect sizes of cohort studies revealed a non-significant association between FBS and DAL after performing the random-effect model.
By combining five effect sizes of cross-sectional studies, there was no significant relationship between HbA1c and DAL (pooled effect size based on random-effect model = −0·012 (95 % CI −0·046, 0·069) %, P = 0·693; I 2 = 57·7 %, P = 0·051). The method of dietary assessment, health status and study quality were the sources of heterogeneity (Supplemental Table S11). Moreover, there was not enough effect size to pool for determining the association of HbA1c with DAL in cohort studies.
Combining two effect sizes of cross-sectional studies revealed no significant association between HOMA-IR and DAL (pooled effect size = 0·06 (95 % CI −0·02, 0·14), P = 0·165; I 2 = 0 %, P = 0·758). Moreover, there was not enough effect size to pool for determining the association of HOMA-IR with DAL in cohort studies.
Combining three effect sizes of cross-sectional studies revealed no significant association between serum insulin and DAL (pooled effect size based on fixed-effect model = 0·29 (95 % CI −0·04, 0·61) μU/ml, P = 0·084; I 2 = 1·6 %, P = 0·362). Moreover, there was not enough effect size to pool for determining the association of serum insulin with DAL in cohort studies.
Based on the results of Egger’s test, no evidence of publication bias was found for BMI (P for cohort studies = 0·781; P for cross-sectional studies = 0·149), WC (P for cross-sectional studies = 0·381), SBP (P for cross-sectional studies = 0·214), DBP (P for cross-sectional studies = 0·104), TC (P for cross-sectional studies = 0·500), LDL-C (P for cross-sectional studies = 0·464), FBS (P for cross-sectional studies = 0·070), HbA1c (P for cross-sectional studies = 0·502) and serum insulin (P for cross-sectional studies = 0·451). There was a significant publication bias for the association of TAG and DAL (P for cross-sectional studies = 0·030).
Discussion
In the present systematic review and meta-analysis, we found that DAL was positively associated with SBP and DBP. However, there was no significant association of DAL with BMI, WC, glycaemic factors and lipid profile. Subgroup analysis revealed that DAL which was calculated with PRAL from FFQ was positively associated with FBS and HbA1c. To the best of our knowledge, the present review is the first to investigate the association between DAL and cardiometabolic factors.
In the present review, we found that DAL was directly associated with SBP and DBP. In line with our results, several studies reported that higher level of DAL was associated with hypertension risk(Reference Krupp, Shi and Remer20,Reference Krupp, Shi and Maser-Gluth36,Reference Han, Kim and Hong41) ; nevertheless, some others showed no association(Reference Berg, Engberink and Brink34,Reference Bahadoran, Mirmiran and Khosravi37,Reference Luis, Huang and Riserus43) . Kidney function is an important factor which regulates the acid–base balance(Reference Goraya and Wesson45), suggesting that glomerular filtration rate and renal function should be assessed for the exact association between DAL and blood pressure. On the other hand, acid–base balance impacts on the absorption of minerals which are effective in hypertension improvement such as Ca and Mg(Reference Rylander, Tallheden and Vormann46). It has been shown that PRAL and NEAP scores have an inverse association with K, Ca and Mg(Reference Akter, Kurotani and Kashino25). High DAL can increase excretion of Ca and Mg, which leads to increased blood pressure and insulin resistance(Reference Nielsen and Rylander47). Another mechanism related to hypertension due to higher DAL and higher renal acid excretion is stimulation of the production of cortisol by DAL, which can increase blood pressure as well as insulin resistance(Reference Kelly, Mangos and Williamson48). Also decreasing urinary citrate excretion due to higher DAL can lead to hypertension(Reference Taylor, Mount and Forman49). Two other mechanisms which lead to hypertension due to higher DAL are related to increasing BMI and glycaemic factors such as FBS, serum insulin, HOMA-IR and HbA1c. In fact, higher DAL induces metabolic acidosis which leads to impaired secretion of insulin-like growth factor 1(50) and increases insulin resistance(Reference Souto, Donapetry and Calvino51).
According to previous studies, individuals who had higher DAL tended to have higher BMI and WC(Reference Murakami, Sasaki and Takahashi12,Reference Fagherazzi, Vilier and Bonnet21,Reference Han, Kim and Hong41,Reference Chan, Wong and Chu52) . Moreover, Maalouf et al. showed that decreased 24 h urine pH is associated with higher HOMA-IR(Reference Maalouf, Cameron and Moe53). According to a prospective study, higher plasma level of bicarbonate is associated with a lower incidence of type 2 diabetes(Reference Mandel, Curhan and Hu54). Akter et al. found no association between DAL and FBS and HbA1c(Reference Akter, Eguchi and Kuwahara1). In the present review, we found no association between FBS, serum insulin, HbA1c and HOMA-IR and DAL. However, there was a direct significant association between FBS, HbA1c and DAL in studies that assessed the dietary intakes by FFQ, and diet history questionnaires, but not recalls. Definitely, a dietary assessment with these former methods is more precise than dietary recalls which confirm short daily dietary intake with remembering error(Reference Han, Kim and Hong41,Reference Kowalkowska, Slowinska and Slowinski55) .
The present results indicated no significant association between lipid profiles and DAL. However, there was a significant positive relationship between LDL-C and DAL in studies that assessed dietary intakes by diet history questionnaire. Included studies were different in the methods used to assess dietary intakes and the DAL assessment tool. Inconsistent with our overall results, Murakami et al. (Reference Murakami, Sasaki and Takahashi12) found a positive association between PRAL and LDL-C and TC, but did not find a significant association between PRAL and TAG. Metabolic acidosis induced by DAL might influence cardiometabolic factors by increasing cortisol production(Reference Dimitriou, Maser-Gluth and Remer56–Reference Fraser, Ingram and Anderson58). Further investigations are warranted to find the exact relationship. Moreover, according to different mentioned mechanisms, health status should be considered to discuss the real associations regarding higher DAL in patients with diabetes, hypertension or kidney diseases.
The present study has some strengths. A comprehensive systematic literature search was performed to include all relevant studies. Moreover, we considered and analysed different cardiometabolic factors such as HbA1c, serum insulin, lipid profile and BMI. Also, subgroup analyses were conducted to find sources of heterogeneity. Since the present review is the first assessing the association between DAL and cardiometabolic risk factors, its limitations must be kept in mind. Since there was no adjustment of the considered variables for confounders such as energy intake, age and gender, our results should be interpreted carefully. Also, we could not find the source of heterogeneity for TAG and WC. Moreover, although we conducted subgroup analysis based on health status, the study participants were different in health status which may a subject bias. Also, different DAL categories (tertile, quartile or quintile) were used in each included study.
Conclusion
The findings of the current review suggest that high DAL is associated with increased SBP and DBP. More studies with adjustment for risk factors are needed to find any relationship between DAL and lipid profile and glycaemic factors.
Acknowledgements
Financial support: This study was supported by Tehran University of Medical Sciences (grant number 97-01-161-38074). Tehran University of Medical Sciences had no role in the design, analysis or writing of this article. Conflict of interest: The authors declared no conflict of interest. Authorship: E.D. and L.A. contributed in the conception and design of the study. E.D. and F.H. performed the search process, excluded irrelevant studies and conducted data extraction separately, with final checking by L.A. E.D. and F.H. contributed in statistical analyses, data interpretation and manuscript drafting. All authors approved the final manuscript for submission. Ethics of human subject participation: Not applicable.
Supplementary material
To view supplementary material for this article, please visit https://doi.org/10.1017/S1368980019001125


