
14.1 Introduction
Epidemics make for powerful stories. Ever since Thucydides’ account of the Plague of Athens, the epidemic story has joined the ranks of the grand tales of war, terror and devastation. Thucydides’ account of the events of a plague in the Hellenic world also gave shape to a genre of writing that has since been copied, developed and expanded by countless witnesses to epidemic events in Western history. Since then, the epidemic narrative has contributed to the chronology through which an epidemic unfolds and has become the principal source to infer meaning and to make sense of epidemic crises. The same narrative has enabled authors to characterize the sweeping and limitless effects of epidemic events and to join aspects of natural phenomena, social conventions and cultural customs implicated in the distribution of plagues. The epidemic narrative, finally, has come to offer a generalized lesson, a common theme or an eternal truth, that the epidemic had laid bare (Reference PagePage 1953; Reference WrayWray 2004).
This chapter revisits the position of the epidemic narrative within a significant epistemological transformation. At the end of the nineteenth century, writing about epidemics shifted from an emphasis on storytelling to the production of methods and instruments to elevate an epidemic into the status of a scientific object. Written accounts of epidemic events were no longer judged upon their capacity to invoke lively pictures of terror or to excel in the inference of political lessons from tragic circumstances but were scrutinized within a field increasingly oriented towards a shared understanding of a scientific method.
As Reference AmsterdamskaOlga Amsterdamska (2005; Reference Amsterdamska, Gaudillière and Löwy2001) points out, epidemiology has a complicated history as a medical science. Without the tradition of the clinic and beyond the experimental and deductive methods of the laboratory, many of epidemiology’s early protagonists turned to quantification to defend their work’s status as a ‘full-fledged science, no different in this respect from other scientific disciplines’ (Reference AmsterdamskaAmsterdamska 2005: 31). However, quantification and medical statistics were not the only resources required to establish the field’s authority. Through boundary work, Amsterdamska shows how epidemiologists established epidemics as ‘a collective phenomenon’, as the field’s ‘special object’ (Reference AmsterdamskaAmsterdamska 2005: 42). In the quest to establish its unique scientific authority, the field came to rely ‘on a wide range of widely used scientific methods’ (Reference AmsterdamskaAmsterdamska 2005: 42), which went far beyond statistics and quantification.
This chapter focuses on narrative reasoning as one of these methods deployed by epidemiologists to account for their special object at a time when the disciplinary boundaries of epidemiology were rather incongruent. The study of epidemics required a generalist dedication to historical accounts, a reliable understanding of medical classification, the capacity to account fluently for social dynamics, while maintaining expertise in the biological variables of contagion and infection. Epidemics were primarily medical events, as they constituted the multiplied occurrence of a specific disease, and most early epidemiologists approached the subject from the vantage point of their medical career. However, since Quetelet, even the medical profession had accepted that the aggregated occurrence of disease might not resemble the dynamics of the individual case.Footnote 1 The social body is, after all, not equivalent to the individual, and the spatial and temporal patterns of a series of cases in society followed discrete regularities (Reference ArmstrongArmstrong 1983; Reference MatthewsMatthews 1995).
Most of the historiography of epidemiology has looked to the quantification of epidemiological methods since the mid-nineteenth century to explain how this new object of concern took shape. Epidemics were represented in lists, tables, maps and diagrams to measure and calculate the dynamics of their waxing and waning, and medical statistics had become the dominant framework to envision the distribution of a disease within society (Reference Magnello and HardyMagnello and Hardy 2002). Narrative reasoning, so the gospel of formal epidemiology goes, took on a secondary position, predominantly concerned with the interpretation and explanation of formalized expressions (Reference MorabiaMorabia 2013). With this chapter, I challenge the widely held assumption that narrative reasoning lost significance in the formation of a scientific method in epidemiology. Instead, I argue that narrative assumed a new epistemic function in the late nineteenth century, supporting the professional reorganization of the field and shaping what I call here ‘epidemiological reasoning’.
This chapter will turn to outbreak reports of the third plague pandemic published between 1894 and 1904 to demonstrate how epidemiologists navigated the complexity of their ‘special object’. To develop their account of epidemic events, the authors of the reports contributed to, engaged in and relied on epidemiological reasoning. The second section (14.2) will outline the nature of these reports and contextualize them within the field of medical and colonial reporting practices at the time. In the following sections, I will take in turn three aspects in which the reports’ epidemiological reasoning advanced the constitution of epidemics as scientific objects. The third section (14.3) will return to the historical dimension of epidemics, asking how epidemiological reasoning has made epidemics ‘known and understandable by revealing how, like a story, they “unfold” in time’ (Reference MorganMorgan and Wise 2017: 2). In the fourth section (14.4), the focus will lie on the ordering capacity of epidemiological reasoning to produce epidemic configurations. Through narrative, the authors combine, or rather colligate (Reference MorganMorgan 2017), empirical descriptions, theoretical projections and a range of causal theories to capture the complex characteristics of the outbreak. In the fifth section (14.5) I will revisit the question of formalization in the evaluation of how lists, graphs and maps were positioned within an epidemiological reasoning dedicated to possibilities, conjecture, contradictions and contingency. Narrative is the technology which allows these reports to configure epidemics as more than just a multiplication of individual cases, more than just a result of social and environmental conditions and more than just the workings of a pathogen.
14.2 Outbreak Reports of the Third Plague Pandemic (1894–1952)
The production and circulation of outbreak reports was firmly grounded in a British administrative reporting practice: the Medical Officer of Health reports. As Anne Hardy has demonstrated in her extensive work on the ‘epidemic streets’, the reports of the medical officers of health were produced from the mid-1800s within a rationale of prevention, and established the provision of ‘facts and faithful records about infectious disease’ (Reference HardyHardy 1993: 7). These reports were usually written with a focus on the range of diseases to be found in a specific district or city. Some diseases had also become the subject of dedicated reports during the nineteenth century, which compared and contrasted the occurrence of cholera or typhoid fever in different places (Reference WhooleyWhooley 2013; Reference Steere-WilliamsSteere-Williams 2020). However, only in the reporting on the third plague pandemic at the end of the nineteenth century do we see the emergence of a sizeable number of comparable reports.
Each of the over one hundred reports on plague was concerned with a city or a region, usually written after an outbreak had ended. A first look at these manuscripts shows them to be highly idiosyncratic pieces of writing, perhaps as much influenced by the authors’ interests and professional expertise as by the specific local circumstances in which the outbreak occurred. However, comparing the range of reports published on outbreaks of bubonic plague between 1894 and 1904 allows for an appreciation of structural, stylistic and epistemological commonalities.Footnote 2 Over the course of the pandemic, reporting practices were neither discrete nor arbitrary; rather, authors tended to collect, copy, adapt and emulate their colleagues’ work. The authors, who were local physicians, medical officers, public health officials or epidemiologists, would write their own account of a plague outbreak with a global audience of like-minded epidemiologists, medical officers and bacteriologists in mind. Archival provenance further suggests that these reports often circulated globally and followed the vectors of the epidemic. The occurrence of novel outbreaks in Buenos Aires or New South Wales appears to have prompted local health officers in these regions to collect outbreak reports from around the world to inform their actions and to adjust their narrative. A key function of the growing global collection of reports was to integrate each local outbreak into the expanding narrative of a global pandemic.
Comparable in form and style, the narrative genre of the epidemiological outbreak report resembles the medical genre of the clinical case report (Reference Hess and MendelsohnHess and Mendelsohn 2010).Footnote 3 Like clinicians, the authors of the reports practised epidemiology as an empirical art, dedicated to inductive reasoning and correlative modes of thinking. Unlike clinicians, the epidemiologist’s scope was much less defined. Authors drew from history, clinical medicine, bacteriology, vital statistics, sanitary science, anthropology, sociology and demography. From Porto, San Francisco, Sydney to Hong Kong and Durban, the reports covered significant aspects of the location, ranging from climate trends, descriptions of the built environment, to the social and cultural analysis of populations in urban or rural communities.Footnote 4 These elements were bound together to constitute the epidemic narrative, tracing how the epidemic offered new ways of ordering what had appeared before as disparate sources and disconnected information.Footnote 5 With sections moving from questions of bacteriology to mortality rates, quarantine measures, outbreaks among rodents, to summaries of the longer history of plague, the narrative colligated disease, environment and population to let the epidemic emerge as a configuration of these coordinates. However, for this narrative to provide a formalized and ordered account of the epidemic – for it to become a scientific account – it was also punctuated with instruments of abstraction and formalization: tables, lists, graphs, and maps.
As such, reports are understood in this chapter as a peculiar global genre of epidemiological reasoning, which was ultimately concerned with producing a robust and global epidemiological definition of plague. This was not achieved just through cross-referencing and intertextual discussions of reports from different places. As a record of events, data and observations tied together by a single disease in a specific place, reports considered the local incident to shape the pandemic of plague as a global object of research.
The three reports discussed below, chosen from over one hundred written on the third plague pandemic, demonstrate three interlinked aspects of epidemiological reasoning: outbreak histories, epidemic configurations and visual formalizations. I have selected one of the first written reports on the emerging epidemic in Hong Kong in 1894, a second from the sprawling and fast-developing outbreak in Bombay, India, and a final one from a South African outbreak in Durban. All three epidemic events occurred within the confines of the British Empire at the time, and were subject to scrutiny, observation and reportage by officers under imperial British command. The reports on plague should therefore also be understood with regard to the long-standing forms of reporting carried out by British colonial officers. These forms included concerns of overseas administration; occasionally reports served as legal evidence for actions taken and they were instruments of stabilizing colonial hierarchies of power and knowledge (Reference DonatoDonato 2018). Reports and their destinations, the colonial archives, furnished the administration with knowledge to govern territory and populations, while establishing difference and hierarchy through ‘epistemic violence’ (Reference StolerStoler 2010). Especially with regards to the governance of public health in British India, administrative reporting practices have been shown to have contributed substantially to the formation of common colonial tropes, such as the opacity of the colonial city as well as the pathogenicity of foreign territory. Reporting on outbreaks of plagues was therefore interlinked with evaluating plague’s capacity to destabilize colonial rule and to provide evidence about how containment measures contributed to the reinstatement – but also the failure – of colonial power (Reference EchenbergEchenberg 2007). Ultimately, all reporting on outbreaks of plague in colonies and overseas territories was driven by utopian considerations of hygienic modernity (Reference RogaskiRogaski 2004; Reference Engelmann and LynterisEngelmann and Lynteris 2020), aiming to stabilize the increasingly fragile image of Europe as a place of immunity and security against epidemic risks.Footnote 6
James Alfred Lowson, the author of the report on plague from Hong Kong in 1894, was a young Scottish doctor and acting superintendent of the civil hospital in Hong Kong by the age of 28 (Reference SolomonSolomon 1997). He took on a key role in the outbreak, diagnosed some of the first cases and led early initiatives for rigorous measures to be put in place in the port and against the Chinese population. He remained on the sidelines of bacteriological fame, as the controversy between Kitasato and Yersin unfolded, both claiming to have first identified the bacterium responsible for the plague, later named yersinia pestis (Reference Bibel and ChenBibel and Chen 1976).
The second report is one of many written by the Bombay Plague Committee, which was at the time under the chairmanship of James McNabb Campbell (Reference MacNabb Campbell and MostynMacNabb Campbell and Mostyn 1898). The Scottish ethnologist had joined the Indian Civil Service in 1869 and served as collector, administrator and commissioner in the municipality of Bombay. In 1897, he succeeded Sir William Gatacre as the chairman of the Plague Committee to encourage cooperation, prevent further riots and contribute to the reinstatement of colonial rule (Reference EvansEvans 2018).
Ernest Hill, the author of the report on plague in Natal, was a member of both the Royal College of Physicians and the Royal College of Surgeons, and from 1897 was appointed health officer to the colony of Natal in South Africa. He authored a number of reports on the health challenges of the colony, notably on suicide as well as malaria outbreaks, and was reportedly involved in ambitious planning to introduce and establish vital statistics overseas (Reference WrightWright 2006; Reference HillHill 1904).
14.3 Outbreak Histories
Until the early twentieth century, epidemiology had been a field intertwined with historical methods and narrative accounts. The historical geography of diseases, as exemplified by August Hirsch, had substantial influence on the development of formal accounts of epidemics (Reference HirschHirsch 1883). Understanding the wider historical formation of a disease was, Hirsch and his contemporaries had argued, fundamental to anticipating which diseases were confined to certain geographies, which diseases occurred with seasonal regularity and how diseases corresponded to what Sydenham had called the epidemic constitution of societies (Reference Susser and SteinSusser and Stein 2009). History, in short, was what gave a form to epidemics, and it was historical narrative that enabled differentiation between smallpox, syphilis and phtysis (or tuberculosis) from plague and cholera (Reference Mendelsohn, Lawrence and WeiszMendelsohn 1998). Investigating the natural history of an epidemic disease was a powerful instrument of generalization and classification. Considering the origins, geographical distributions, stories of migration and relations to wars and famines offered a biographical form to diseases in the history of Western society (Reference Rosenberg, Rosenberg and GoldenRosenberg 1992b).Footnote 7
It is therefore unsurprising to see most reports opening with some form of appreciation of the history of plague at large. Lowson, in his account of events in Hong Kong, even apologized for his limited access to relevant historical scholarship on the plague. However, revisiting what he had available in Hong Kong, he delved into a historiographical critique of the limited state of scholarship on Asiatic plague history. Knowledge of the historical geography of plague was for Lowson essential in considering how plague might have arrived in Hong Kong from Canton. The Cantonese outbreak had reportedly also begun in 1894, where plague might have been endemic for some time (Reference LowsonLowson 1895: 7).
Similarly, for the South African report, Ernest Hill dedicated his first chapter to the history of plague to emphasize three characteristics of the disease, known from extensive scholarship. He noted its ‘indigenous’ quality, as the epidemic appeared to persist historically in particular localities. Hill accounted for a predictable periodicity of outbreaks and included the fact that epidemics appear ‘interchangeable’ between men, rats and mice (Reference HillHill 1904: 5–6). From these generalized historical qualities, Hill inferred then a short history of the most recent outbreaks preceding the events in Natal, originating in Hong Kong and a series of outbreaks in India, Australia, and Africa to let the historical arc arrive finally in 1901 in the Cape Colony, from which the disease had most likely spread to Natal in 1903.
The report from India, however, does not refer to the recorded history of plague over previous centuries, but offers a different, perhaps more pertinent, account of outbreak history (Reference MacNabb Campbell and MostynMacNabb Campbell and Mostyn 1898). Where the large historical narratives of plague suggest generalization about plague, the repetitive chronologies, or what I call here outbreak history, emphasize a different register of historical reasoning. Without much preamble, the report gives a month-by-month overview of the development of the epidemic from July 1897 to April 1898. It continues on from previous reports that account for the development of the epidemic beginning in August 1896 in Bombay (Reference EvansEvans 2018; Reference GatacreGatacre 1897). Monthly summaries of the epidemic constitute by far the largest section of this report, and each monthly vignette cycles through aspects that the plague committee considered important to record over time in the epidemic diary. Rainfall, mortality and sickness, relief works, staffing, quarantines and migration of people in and out of Bombay were recorded monthly, each enclosed in a short narrative description. This entry for December 1897, for example, marks the beginning of the second outbreak and describes the reasoning for the ‘segregation of contacts’:
In early December the arrival of infected persons in Bombay, and in many attacks an increase of virulence and infectiousness, made it probable that at an early date the Plague would develop into an epidemic. To prepare for an increase in disease, two measures received the consideration of the Committee. These were the separation of Contacts, of the sick man’s family, and the vacating of infected or un-wholesome houses, with the removal of the inmates to Health Camps.
For some months, miscellaneous events such as riots or house inspections were added. But overall the author’s choice of structure emphasized the temporal characteristics of the epidemic, which offers a sense of how circumstances, case numbers as well as reactive measures changed over time. August 1897 saw plenty of rainfall, with 15.59 inches, and a moderate number of 83 new plague cases. Relief works were required in August, as it was noted that ‘the city was infested with numbers of starved idlers whose feeble condition, predisposing to plague, was a menace to public health’ (Reference MacNabb Campbell and MostynMacNabb Campbell and Mostyn 1898: 4). Quarantine was established on sea routes to prevent importing plague and the total movement of people in and out of the city recorded an excess of 15,224 departures. In November of the same year, rainfall had been zero, while plague cases rose by a dramatic 661 cases. Relief works were in steep decline as movement of people into the city also continued to decrease.
The history of plague crafted in the Bombay report was structured to deliver a picture of the temporal dynamic of the epidemic within a complex configuration. Monthly summaries provide a granular view onto the variability of case numbers, of the changing climatic, social and political conditions in which plague emerged and thrived. This chronological reconstruction of the epidemic was entirely invested in the temporal dynamic of the outbreak.Footnote 8 Narrative gave a sense of the beginning, the waxing and the waning of the disease while integrating quantifiable indicators such as case numbers, rainfall and immigration as well as dense descriptions of what the committee perceived to be mitigating measures (poverty relief) and exacerbating circumstances (the immigration of homeless people).
Outbreak history, which considered the series of events that structured the local outbreak from its beginning to its end (if it had been reached), was a key component of reports of the third plague pandemic. Within epidemiological reasoning, this kind of temporal characterization was dislodged from the grand historical portraits of plague. While the latter were concerned with the settled story of what plague was, and how the contours of the epidemic’s biography aligned and criss-crossed with sections of the history of the Western world, the former provided a lens for investigation and open-ended speculation. The historical arc of plague provided a hook, a larger, global narrative within which the report’s account had to be situated, whereas the outbreak history offered the opportunity to bring the many facets that contributed to the local outbreak into a temporal order.
In contrast to that broad temporal arc, Lowson, in Hong Kong, dedicated only a small section explicitly to the ‘time of the outbreak’ (Reference LowsonLowson 1895: 30). A sense of the chronology of the Hong Kong outbreak can, however, be traced through all of Lowson’s thematic sections. In his discussion of climatic influences, he reasoned on ‘the increase of the disease after the rainy season’ (Reference LowsonLowson 1895: 5), and in the ‘Administrative’ section, he provided day-by-day details on how staffing levels at the hospital were arranged and adapted to match the dynamic of the epidemic (Reference LowsonLowson 1895: 26). Lowson’s section dedicated to statistics conveys a sense of the sudden growth and then quick slump in case numbers through June and July 1894. Overall, Lowson was eager to impart a picture of the Hong Kong plague as a sudden incident that emerged in April 1894 as ‘people were reported fleeing from Canton on account of the plague’ (Reference LowsonLowson 1895: 2) and which was expected to end with the strict observation of a list of recommendations provided by Lowson to improve the sanitary state of the city’s worst dwellings (Reference LowsonLowson 1895: 26).
Where Lowson let varied aspects of the outbreak chronology unfold in parallel, section by section, in the colony of Natal, Hill structured sections of his report very explicitly around the chronology of the outbreak, relating the ‘origin’, the ‘course’ as well as the ‘spread’ and the ‘limitation’ of the outbreak, each told in a dedicated section. The plague story of Natal began in the ‘first weeks of December’ 1902, when ‘the disease was found to be causing a heavy mortality among rats over a roughly triangular area’ at the Veterinary Compound (Reference HillHill 1904: 8). However, one month later, rats infected with plague were found in a produce store in the middle of Durban. Suspecting that the disease had been imported, Hill charted the epidemic distribution over time and space, as it spread to five or six further areas in Durban where it prevailed for some time. To characterize the temporal ‘course of the epidemic’ Hill utilized the metaphor of ‘water spilt on a dry surface: a continuous forward progression with occasional branching off shoots, and now and again a return flow’ (Reference HillHill 1904: 26). After detailed discussion of the relation between plague in rats and humans as well as white and (what Hill described as) native inhabitants, he closed his chronology with a detailed description of local measures put in place to control and end the outbreak.
14.4 Epidemic Configurations
The historian of medicine, Charles Rosenberg, identified two conceptual frameworks through which epidemics – his case was predominantly cholera – were explained until the late nineteenth century. The first, configuration, emphasized a systems view in which epidemics were explained as ‘a unique configuration of circumstances’ (Reference RosenbergRosenberg 1992a: 295), each of which was given equal significance. Communal and social health was imagined as a balanced and integrated relationship between humankind and environmental constituents, in which epidemics appeared not only as the consequence, but also as the origin of disturbance, crisis and catastrophe. Rosenberg’s second framework, contamination, prioritized particular identifiable causes for an epidemic event. Where configuration implies holistic concepts, the contamination perspective suggested a disordering element, a causa vera, suggestive of reductionist and mono-causal reasoning. As Rosenberg emphasizes, both of these themes have existed since antiquity in epidemiological reasoning, but it is particularly in the late nineteenth century, with the emergence of bacteriological science, that we can see a proliferation of these mutually resistant themes into polemical dichotomies.
Plague reports, however, did not neatly fit within this antagonism. Despite successful identification of the plague pathogen in 1894, and despite historiographical claims of a subsequent laboratory revolution (Reference Cunningham, Cunningham and WilliamsCunningham 1992), the epidemic did not lend itself to reductionist attribution of cause and effect between seed and soil (Reference WorboysWorboys 2000). As the previous section illustrates, understanding the puzzling configurations on the heel of the introduction of the contaminating pathogen was subject to much deliberation in plague reports. The texts’ capacity to integrate questions of contamination and systems of configuration without adopting deterministic models is what I would propose here as a second advantage of epidemiological reasoning. Narrative was essential for a kind of reasoning that offered some breathing space around deterministic theories of cause and effect, while not resolving the question of cause altogether.Footnote 9
This quality is perhaps best observed in the more speculative sections of the reports, where narrative reasoning enabled conjecture and allowed for contradiction. In stark contrast to the sober empirical tone of historical chronology, the reports engaged in intriguing ways with theories of distribution and transmission of plague. Many historians before me have shown that these factors were subject to heated global dispute (Reference EchenbergEchenberg 2007; Reference LynterisLynteris 2016). The return of plague as a global menace, no longer confined to historical periods as a ‘medieval’ disease, challenged as many convictions about ‘hygienic modernity’ (Reference RogaskiRogaski 2004) as it supported spurious theories about racial superiority within colonial occupation and exploitation. Each of the authors of our three example reports offers a range of idiosyncratic theories attempting to arrange their observations within available causal concepts. To shed light on the circumstances under which plague moved through the communities of Hong Kong, Bombay and Natal, Lowson considered infection through the soil, the Bombay Plague Committee discussed the problem of infectious buildings, and Hill defended the rat as a probable vector of the disease.
The soil had been, as Christos Lynteris recently argued, a ‘sanitary-bacteriological synthesis’ (Reference LynterisLynteris 2017). Removed from traditional miasmatic understandings of contagion as an emanation from the ground, the soil became suspicious as a plausible source of infection as well as a reservoir for plague’s pathogen. Lowson, who, like many of his contemporaries thought that implicating rats as the cause of plague was ‘ridiculous’ (Reference LowsonLowson 1895: 4), instead dedicated a full section to infection via the soil. The soil was a likely culprit, he argued, as it explained the geographically limited distribution of plague in the district of Taipingshan. With a vivid description of the living conditions of an area mostly occupied by impoverished Chinese labourers, Lowson drew attention to ‘filth everywhere’, ‘overcrowding’, the absence of ‘light and ventilation’ and basements with floors ‘formed of filth-sodden soil’ (Reference LowsonLowson 1895: 30).
Lowson’s account of the environmental configuration in Hong Kong was populated with vitriolic and racist descriptions of Chinese living conditions. Overcrowding, filth and the poor and damp state of houses, basements and stores were to him the driving factors of the plague, while latrines were particularly suspicious, as they were ‘used by the bulk of the Chinese population’. The danger ‘to every healthy person who went into the latrine’ could be assessed through a quick ‘glance’ (Reference LowsonLowson 1895: 28). Remarkable here is not his relentless anti-Chinese sentiment, which was of course a common component of British rule in Hong Kong, but the seamless integration of bacteriological and sanitary perspectives into his reasoning.
‘Predisposing causes’, as Lowson qualified his perspective, assumed political urgency as authorities concerned themselves with the future of the district. As well as burning the district to the ground and destroying the squalid habitations, was it also necessary to remove an entire layer of soil? After consultations with bacteriologists and a series of experiments, Lowson came to the conclusion that the soil was innocent and that instead common sense should prevail. Resorting to his racist conviction, he concluded that the most ‘potent factor in the spread of the epidemic’ could be found in the ‘filthy habits of the inhabitants’ of Taipingshan (Reference LowsonLowson 1895: 32).
A similar reasoning about infective environments structured the writing of the plague committee in India. As a second line of defence, after patient cases had been relocated to hospitals and populations evacuated to quarantined camps, the remaining houses and buildings were perceived as a suspicious and potentially dangerous environment. This was reflected in extensive discussions about the need for thorough disinfection. Fire, as the report stated, was the ‘only certain agent for the destruction of infective matter’, but its application was considered too risky. Based on undisclosed experience from previous outbreaks, the local committee chose to use perchloride of mercury, followed by thorough lime-washing (Reference MacNabb Campbell and MostynMacNabb Campbell and Mostyn 1898: 65). Yet, evidence of the beneficial effect of such operations was difficult to obtain. Previously disinfected premises were, as the author states, not protected against the reintroduction of plague through vermin and people. Some disinfection officers had thrown into doubt the benefit of lime-washing, as bacteriologists had reportedly shown that bacteria thrive in alkaline environments, such as the one provided by hot slaked lime. Regardless, the committee held up against the contradictory perspective and insisted on continuing lime-washing operations, despite the death of ‘two or three limewashing coolies’, as its use following other means of disinfection was ‘invaluable for sweetening and brightening up the rooms’ (Reference MacNabb Campbell and MostynMacNabb Campbell and Mostyn 1898: 66).
Six years later, in Natal, Hill needed to consider a very different question when explaining the distribution of plague. The rat had by then become the most likely vector in the distribution of the disease, and observations of symptoms in rats were no longer the subject of myth but had moved to the centre of theories regarding the epidemic’s aetiology. Accordingly, Hill discussed a series of cases, which seem to indicate clearly that plague in rats was a precursor to human cases. Examples of grain and produce stores and a railway locomotive shop and barracks were introduced as sceneries in which rat cadavers had been found, collected and tested positively for plague before cases in human occupants of the same structures were reported (Reference HillHill 1904: 77). However, eager to deliver a balanced view, Hill also offered cases ‘of the opposite’. He reported on an employee at the same barracks, who, despite being contracted with the collection and destruction of rats in the premises, never once suffered from plague, and he included detailed description of rat-proofing constructions, encountering dozens of infected rats, which were ‘carried out without any precaution, and yet for all that fortunately not one of the persons so engaged was attacked by the disease’ (Reference HillHill 1904: 78).
14.5 Epidemiological Reasoning and Visual Formalization
Each of the reports contains formalized representations of epidemic outbreaks, such as tables, graphs and maps. With this third section, I return to the initial question of how we might position narrative reasoning within the more common perception of the field’s trajectory towards quantification and mathematical formalization. In plague reports, medical statistics and maps take on a significant role to support, and at times to illustrate, narrative. Importantly, throughout the examples cited here, as well as within most of the remaining reports, little effort is given to the explanation and interpretation of statistical representations or spatial diagrams.
Lowson dedicated a short section to quantifiable data, which he entitled ‘Statistical’. Rather than offering characterization and interpretation of the aggregated case numbers per hospital and along nationality and age groups, his writing was predominantly concerned with reasons that undermined the reliability of the listed numbers. In reference to a table of cases and mortality in different nationalities, he did not discuss or analyse the variable caseloads in the listed populations. Nor did he make any efforts to interpret the highly suggestive picture of mortality rates. Lowson did not use the visualized data to draw inferences, but the numbers appear to be listed to confirm the colonial framing of the outbreak as a Chinese issue, which had already been established through narrative. However, the table seems to have been still useful to Lowson as a rhetorical device to strengthen yet another colonial trope. The lack of reliable data, so he argued, was attributed to the invisible and unaccountable burial practices that emerged as a consequence of corpses left in the street.
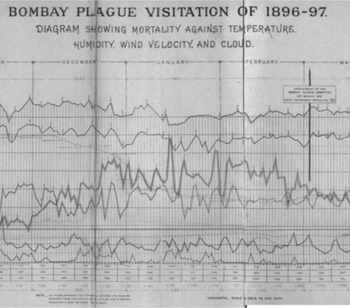
The report from Bombay shared a similar agnosticism towards formal data in the characterization of the epidemic. While the repetitive structure of the chronological narrative, with its regular references to weather, migration and control measures, appears to adhere to a formal structure, there are no tables and lists within this lengthy description of a year of plague in the city. A substantial formalization of the epidemic’s account, however, can be found in a separate set of documents that accompanied the report. The portfolio consists of a map of the island of Bombay, a second, similar map, now inscribed with detailed information on the epidemic, a complex chart of the epidemic’s case rates as well as plans for a hospital and an ambulance. The first object of interest is the chart, in which daily plague mortality from June 1897 to April 1898 was plotted together with data on the usual mortality, temperature, population, humidity, velocity of wind, wind directions and clouds (see Figure 14.1). (For further details on data collection, see Reference MacNabb Campbell and MostynMacNabb Campbell and Mostyn 1898: 213–214.) According to the report authors, the chart was developed to mount further evidence against ‘some of the theories freely advanced regarding the definite influence of temperature, humidity, wind and clouds on mortality’ (Reference MacNabb Campbell and MostynMacNabb Campbell and Mostyn 1898: 214). Intriguingly, rather than an instrument of generalization, the chart takes on the opposite function, preventing misleading and simplistic causal theories about plague as a disease of climatic circumstances through the demonstration of the fallacy of correlations.
Section of a chart provided by the Bombay Plague Committee for 1896–97
The chart combines data on climatic factors and plague mortality rate to disprove spurious correlations.
The second visual representation of interest attached to the report from Bombay is a ‘progress map’ of the epidemic (see Figure 14.2), plotting the course of the epidemic from September 1897 to the end of March in 1898. Each section of the city had been marked with a circle when it had become epidemic, and each of the circles was shaded to indicate in which months the outbreak occurred, based on granular data collection of ‘actual cases from house to house’. While the report’s authors saw the map as evidence for an improved overall picture of the epidemic compared with the previous year, its relation to the narrative account within the report requires a few further considerations.
A ‘progress map’ of the plague in Bombay in 1897 and 1898
Circles indicate the temporal dynamic of the outbreak.
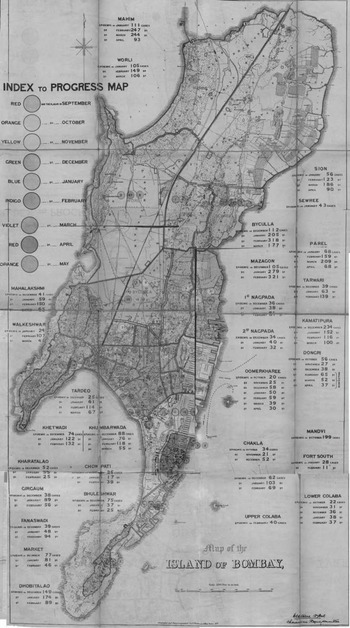
First of all, the map was designed to reinstate the image of chronology previously developed in the narrative sections of the report. It illustrated inferences drawn in writing, rather than opening a new space of geographical exploration. Second, the map served to visualize the ‘progress’ of plague, invoking the image of sweeping coverage, in which the flow of contagion becomes as visible as the obstacles that were put in place to contain the epidemic.Footnote 10 Third, within the form of the administrative report, the map constitutes a remarkable picture of granular insight, which exposes the colonial urban space through the lens of its epidemic predisposition as a radical transparent, controlled and contained space (Reference ShahShah 1995).
With maps like these, epidemiologists were able to deliver two-dimensional abstraction of the complex relations of a plague outbreak. As Tom Koch has written, such maps should not be read as representations of the outbreak, or as pictures of research results (Reference KochKoch 2011). Rather, he emphasized their use to combine data and theories, to create a visual context in which theories could be tested. The ‘progress map’ enabled a theoretical exploration of the relationship between the temporal dynamic of the epidemic and its place, following the rationale outlined in the reports’ chronology.
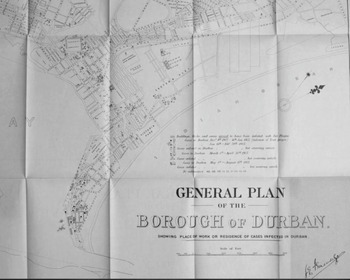
In South Africa, Hill used a quite similar map to combine temporal and spatial coordinates in his attempt to show the ‘marked correspondence between rat plague and human plague’ (Figure 14.3). His map demonstrated that in areas where plague cases were rife, rats with plague had been found; while in areas without registered cases, rats were unaffected too (Reference HillHill 1904: 37). But this neatly mapped data could not ascribe a causal direction to the distribution of plague and infections between rats and humans, as many sceptics of the rodent-vector theory continued to argue. To support and indeed to strengthen the theory of the rat as a principal vector, Hill returned to narrative speculation about the professional occupation of human plague cases. Over 22 per cent of infected people were employed in grocery stores or stables where rat plague had been shown to reside. Here, in this focused line of argument, the map assumed a status of evidence to support his causal theory: as almost 50 per cent of cases stemmed from premises adjacent to or connected to such stores and stables, Hill concluded that ‘the most important agency in the dissemination of plague was the rat’ (Reference HillHill 1904: 39).
Map used by Ernest Hill to demonstrate the correlation of rat plague and human cases, Durban 1903 Rat plague is indicated by the shaded buildings and human cases by dots.
The tables used by Lowson in Hong Kong, as well as the charts and maps included in the reports from Bombay and Durban, have one aspect in common: they were used to illustrate, accompany and reinstate arguments and inferences already made in narrative form. The visualizations were not included to lift empirical observations up to a more generalizable state, nor were they used to replace the prevailing picture of uncertainty and conjecture with unambiguous representations of causal theories. All these authors raised doubts about the reliability of the data that went into the development of the tables, charts and maps and thus qualified the status of such visualizations as temporary, exploratory and experimental rather than definitive.
Within epidemiological reasoning, this precarious status of formal representation was neither derided nor seen as problematic. Particularly as these reports were concerned with the observation and explanation of an epidemic outbreak, their authors aimed to sustain the muddy ground between correlation and causation rather than to resolve the resulting account either into radical contingency or into simplistic mono-causality. The visualizations in this period maintained a dual position – as diagrams to formalize the temporal dynamic as well as street maps to visualize the epidemic on the ground (see Wise, Chapter 22). Narratives allowed the authors to convey a sense of correlation and causal implication, as they explained why and under which conditions a series of cases assume epidemic proportions. Narrative focused on the crucial questions, which at the same time were the most difficult to answer succinctly: how mortality rates were skewed by social behaviour, how the disease dynamic unfolded in relation to climatic or sanitary conditions, and if the parallel occurrence of diseases in rodents and humans emerges as causal theory if one considered professional occupation. The visual ‘polemics’ of graphs, maps and charts were not only mistrusted, but their misleading determinism required framing and containment within the possibilities that narrative conjecture raised.
14.6 Conclusion
In this chapter, I have revised perspectives on early twentieth-century epidemiology, which has been seen as a phase of quantification and medical statistics. Contrary to this historical account, I have introduced the outbreak report as a narrative genre and as a source to consider the emergence of epidemiological reasoning. In this narrative form, epidemics retain their character as complex phenomena, which could never fully be understood through the narrow lens of bacteriology, the limited perspective of the vital statistician or the diagnostic point of view of the clinician. Epidemiological reasoning set the groundwork for the development of epidemiology as a unique scientific practice, at a remove from the clinic and the laboratory, but dedicated to colligating an endless array of material, social and biological aspects.
Historical narration emphasizes the temporal nature of the epidemic as an object of research. The rhythm, patterns and dynamics of epidemics assume significance in the writing of the reporting authors, as they seek to account for the temporal shape of plague outbreaks. Crucially, epidemiological reasoning distinguishes between what would later be called the micro-histories of outbreaks and the macro-histories of disease biographies, to evaluate and to scrutinize their relations.
Beyond the sober empiricism of historiography and chronology, the reports also offer space for the negotiation of causal theory. Assumptions about contagious soil, spaces and rodents are often brought forward without robust justifications, strong experimental evidence or academic rigour. Rather, narrative epidemiological reasoning sustains the epidemic configuration as a series of disparate factors forced into relation by the epidemic event, allowing its authors to speculate about their correlation without losing sight of a probable causal inference.
The value of conjecture and the capacity to maintain uncertainty between correlation and causation assumes prominence when the narrative is contrasted with the blunt pictures of epidemics derived from tables, lists, graphs, charts and maps. Within the epidemiological reasoning of reports of the third plague pandemic, these representations of quantifiable aspects were framed in a rhetoric of unreliability and misleading mono-causality. Rather than instruments of standardization and generalization, visual formalizations took on a role of expressing theories, testing hypotheses and exploring spurious inferences.
As a practice of empirical observation, the reasoned argument about epidemics remains deeply indebted to the epidemic narrative as a form of story-telling. However, charged with the formalization of a scientific epidemiological discourse, the narrative in outbreak reports also begins to shape the epidemic as an object of knowledge structured by historical contingency, theoretical multiplicity and a rather hesitant formalization of causes and determinants. At the beginning of the twentieth century, it is in epidemiological reasoning, rather than in the formalization of medical statistics and mathematical formulae, where the epidemic emerges as a versatile point of reference to think through and beyond the boundaries of the clinic, the laboratory, the population, the city and an increasingly fragile colonial world order.Footnote 11


 Open access