

Introduction
Grounding-line position is a key parameter in monitoring and understanding change over time in the West Antarctic ice sheet (WAIS) (Reference WeertmanWeertman, 1974; Reference Conway, Hall, Denton, Gades and WaddingtonConway and others, 1999; Reference Shipp, Anderson and DomackShipp and others, 1999; Reference SchoofSchoof, 2007). It is variable on a range of timescales because of the range of underlying processes. At the short end of the spectrum, both vertical and horizontal motion of grounded ice has been observed to vary with ocean tide height (e.g. Reference Bindschadler, King, Alley, Anandakrishnan and PadmanBindschadler and others, 2003). Over timescales of years and longer, grounding-line position must be related to the mass balance of the system as a whole, but mediated by local- and regional-scale (a few kilometers to a few hundred kilometers) effects such as sediment transport to the grounding line (e.g. Reference Alley, Anandakrishnan, Dupont, Parizek and PollardAlley and others, 2007). Ice rises (e.g. Reference Hulbe and FahnestockHulbe and Fahnestock, 2007) act as pinning points that disrupt downstream flow and are relevant in determining grounding-line position across all of these timescales. The effect of ice rises is magnified where the subglacial bed has a relatively uniform elevation over a large region, as at the tidally influenced, lightly grounded ice plains near the outlets of active West Antarctic ice streams. Here – across the Siple, Shirase and Gould coasts – switches between grounded and floating conditions are possible for small changes in ice thickness. This means that ephemeral grounding and accompanying adjustments to grounding-line position can be a pervasive feature.
Setting
The Siple, Gould and Shirase coast ice streams flow along basins that are part of the larger basin and range structural fabric within the West Antarctic Rift System (Reference BehrendtBehrendt, 1999) (Fig. 1). In the troughs, unconsolidated water-saturated sediments facilitate fast flow in ice streams (Reference Alley, Blankenship, Bentley and RooneyAlley and others, 1986). The properties of the till may change over time as shear around the ice–till interface produces changes in till porosity and thus its effect on the overlying ice (Reference KambKamb, 2001; Reference IversonIverson, 2010). In some analyses, this coupling produces cycles between relatively fast and relatively slow ice flow. Variations in the characteristics of ice flow can also be produced without variations in till properties (Reference Sergienko, MacAyeal and BindschadlerSergienko and others, 2009).
Map of Siple and Gould coast ice streams and the adjacent Ross Ice Shelf, with geographical place names. Contours represent ice surface elevation (contour interval is 50 m). Inset image is made from the Ice, Cloud and land Elevation Satellite (ICESat) and MODIS images from Reference Scambos, Haran, Fahnestock, Painter and BohlanderScambos and others (2007). Green shaded areas highlight the DF to the north and Subglacial Lake Engelhardt (SLE) to the south. Black line is the modern grounding line, after Reference Bohlander and ScambosBohlander and Scambos (2007).

Between the troughs are interstream ridges (Siple Dome (SD) to the north of Kamb Ice Stream (KIS) and Engelhardt Ridge (ER) to the south) and ice rises (Crary Ice Rise (CIR) and Steershead (SH)) represented by local highs in the bed topography. The lowest reaches of fast-flowing Whillans Ice Stream (WIS) form a broad flat ice plain: a transitional area between an ice stream and the floating ice shelf (Reference Bindschadler, Vornberger and GrayBindschadler and others, 2005) where the basal traction is relatively small and the ice surface elevation is relatively flat (Reference Hulbe and FahnestockHulbe and Fahnestock, 2007). The downstream reach of KIS is characterized by a large overdeepening (~700 m at its greatest depth), with its long axis oriented in the direction of ice flow (~150 km along flow and ~75 km across flow) (Fig. 2). A sill spanning the width of the ice-stream outlet defines the downstream boundary of the overdeepening (Fig. 2).
Mosaic of Antarctica (MOA) image (Reference Scambos, Haran, Fahnestock, Painter and BohlanderScambos and others, 2007) and bathymetry in the KIS outlet (Reference Le Brocq, Payne and VieliLe Brocq and others, 2010).

An overdeepening will promote grounding-line positions either upstream or downstream of its location (Reference SchoofSchoof, 2007). Reference Catania, Hulbe and ConwayCatania and others (2010) used ice-penetrating radar to estimate the duration of past ungrounded conditions in the main trunk of KIS by observing the degree of layer downwarping and expected rates of basal melting along the present-day grounding line. The inferred past location of the KIS grounding line is - 1 0 0 km inland of its present position and on the upstream side of the overdeepening (Reference Catania, Hulbe, Conway, Scambos and RaymondCatania and others, 2012). Additionally, lineations wrapping around the slopes of SD and ER adjacent to KIS continue across slope to the upstream end of the overdeepening. The geometry of these lineations and the fact that they wrap around the interstream ridges favors an interpretation that they were once a grounding-line feature dating to when the region was free-floating - instead of a shear margin - and were perhaps formed by localized basal melting (Reference Catania, Conway, Raymond and ScambosCatania and others 2006a, Reference Catania, Hulbe, Conway, Scambos and Raymond2012).
WAIS ice-stream outlets have complicated morphologies with varying surface textures and grounding-line configurations. The present focus is on the downstream reaches of the now stagnant KIS and the active but decelerating WIS (Reference Joughin, Tulaczyk, Bindschadler and PriceJoughin and others, 2002, Reference Joughin2005), but the outlets of the other ice streams have their own complications. Features at the corners of the KIS outlet, often identified as the Duckfoot (DF) and the Goosefoot (GF), informal names coined by Ted Scambos (Reference Jacobel, Scambos, Nereson and RaymondJacobel and others, 2000), are of particular interest here. The DF and GF are relatively smooth low-slope (10–4) slow-flowing (<0.3 m a–1) areas at the northern right-lateral corner and southern left-lateral corner of the ice-stream outlet. These features separate the ice stream from the steeper interstream ridges (Fig. 1). The bed is locally deep at the DF, but shallow at the GF. The DF is bounded by relict shear margins, identified via near-surface diffractors and distorted discontinuous deep layers in the ice stratigraphy (Reference Catania, Scambos, Conway and RaymondCatania and others, 2006b).
Ice-stream histories
On the Ross Sea side of West Antarctica, the observable record of ice flow indicates a system characterized by significant internal variability. Reference Conway, Hall, Denton, Gades and WaddingtonConway and others (1999) assimilated a range of observations and inferred a pattern of variable ice-stream retreat since ~16ka. Reference Fahnestock, Scambos, Bindschadler and KvaranFahnestock and others (2000) and Reference Hulbe and FahnestockHulbe and Fahnestock (2004, Reference Hulbe and Fahnestock2007) used Advanced Very High Resolution Radiometer (AVHRR) and Moderate Resolution Imaging Spectroradiometer (MODIS) imagery to observe flow patterns on the Ross Ice Shelf (RIS), and numerical models to infer the timing and magnitude of past flow events, which demonstrated that the WAIS ice streams stagnated and reactivated on century timescales. Given the low basal relief in this region, thickness transients probably led to many episodes of retreat and readvance of the grounding line (Reference Catania, Hulbe, Conway, Scambos and RaymondCatania and others, 2012).
Reference WeertmanWeertman (1974) and Reference Thomas and BentleyThomas and Bentley (1978) hypothesized that, once initiated, grounding-line retreat in West Antarctica would progress rapidly because of the inland-deepening bed under the grounded ice. Subsequent work on grounding-line migration (Reference SchoofSchoof, 2007; Reference Nowicki and WinghamNowicki and Wingham, 2008) has clarified and supported that general conclusion. The modern KIS grounding line does not appear to be retreating, at least not rapidly or uniformly, yet it lies across a reverse slope on the subglacial bed. We note that Reference Thomas, Stephenson, Bindschadler, Shabtaie and BentleyThomas and others (1988) inferred a retreat rate of 28±5ma–1 in one KIS location (their fig. 2), but the most upstream strain rates in their study transect are large enough to suggest that none of their measurements were made on grounded ice. Strain grid observations made across the grounding line calculate grounded ice strain rates five times smaller than the rates of Reference Thomas, Stephenson, Bindschadler, Shabtaie and BentleyThomas and others (1988), and found no migration over a 4year Ice, Cloud and land Elevation Satellite (ICESat) observation interval (C. Hulbe, unpublished data). Thus, it is necessary to address the problem of how the KIS grounding line moved downstream from its past location upstream of an overdeepening before it stagnated.
Details of the implied KIS grounding-line advance from an earlier upstream position are not recorded in the ice in obvious ways. The advance may have been uniform across the width of the stream or, more likely, may have followed the contour of the sea floor in some way. In any case, grounding-line advance most likely occurred after WIS reactivation (about 450 years ago) and before KIS stagnation (about 150 years ago), and the DF must have formed within that interval (Reference Catania, Hulbe, Conway, Scambos and RaymondCatania and others, 2012). Snow accumulation over the relict margins of the DF reveals ages of ~340 and ~150 years ago for the last active shearing along the outboard and inboard margins, respectively (Reference Smith, Lord and BentleySmith and others, 2002; Reference Catania, Scambos, Conway and RaymondCatania and others, 2006b).
Lakes
The downstream end of WIS features a hydrologically active and connected subglacial lake system (Reference Fricker and ScambosFricker and Scambos, 2009; Reference Carter and FrickerCarter and Fricker, 2012). The presence of water at the ice-bed interface or between grains in subglacial till affects ice flow rates (Reference KambKamb, 2001), and the distribution of water within the subglacial system varies on a variety of timescales (Reference Carter and FrickerCarter and Fricker, 2012). On a regional scale, large temporal changes (years or longer) to subglacial water flow paths and the development of subglacial lakes may be associated with ice-stream stagnation events, such as that which occurred in the lower portion of KIS 150 years ago (Reference Anandakrishnan and AlleyAnandakrishnan and Alley, 1997).
On a local scale, subglacial lakes both mediate, and are mediated by, ice mechanics. Smooth and low-slope surfaces indicate a very weak substrate, i.e. a contiguous water body such as a subglacial lake or the ocean. Low-slope but relatively rough surfaces develop where the substrate is weak but the ice is in contact with the bed (Reference Gudmundsson and RaymondGudmundsson and Raymond, 2008). Even without observing surface height change due to filling and draining (Reference Fricker and ScambosFricker and Scambos, 2009; Reference Carter and FrickerCarter and Fricker, 2012), the location of Subglacial Lake Engelhardt (SLE) at the right-lateral downstream corner of WIS is apparent in the contrast between relatively rough WIS and relatively smooth surface over the lake (Fig. 1).
Estuaries are likely along the grounding line where hydropotential lows upstream of the grounding line are connected to the ocean (Reference HorganHorgan and others, 2013). Reference HorganHorgan and others (2013) found geophysical evidence for an active estuary at the downstream end of the WIS ice plain. Reference AlleyAlley and others (2006) note that, during glacial advances, brackish water remains trapped as subglacial lakes upstream of pinning points.
Overview
In this paper, we explore how the KIS grounding-line configuration came to be in the particular bathymetric context at the ice-stream outlet, and investigate transient features that resulted from grounding-line migration, such as the DF and GF flat-ice terrains at the outlet corners. We use a three-dimensional (3-D) ice-sheet/ice-shelf numerical model to investigate what events (e.g. margin jumps and ice-rise stagnation) are necessary to produce thickening in the KIS outlet, and how feedbacks from such events act non-locally, in turn forcing grounding-line migration downstream to its present-day location. Specifically, we explore the following hypotheses: (1) The recent grounding-line migration across the KIS outlet is predicated on decreased divergence within the KIS outlet, which in turn is forced by changes in a combination of boundary conditions: stagnation of CIR and SH and the GF flat-ice terrain. (2) Grounding-line migration is guided by local bathymetric highs and can proceed in a transverse-to-flow direction. One consequence of this pattern of grounding is that new subglacial lakes form in bathymetric depressions, such as at the DF, during periods of grounding-line advance.
Numerical Modeling: Grounding-Line Migration and Corner Effects
Model set-up
We use an ice-shelf/ice-stream flow model adapted from Reference Hulbe and FahnestockHulbe and Fahnestock (2007) to examine the effects of bathymetry and internal variability (e.g. changes in mass flux because of ice-rise stagnation) on grounding-line position in the KIS outlet. The ‘shelf–stream’ model solves the reduced mass- and momentum-balance equations for ice (Reference MacAyealMacAyeal, 1989a) in a domain representing the RIS and the outlet regions of the WAIS ice streams. The model mesh contains 6610 nodes. The mesh resolution varies from 450 m to 7.5 km, and the finest resolution is near the grounding line, where we want to carefully track feedbacks between thickening and grounding. We note that fine resolution is also required around CIR in order to resolve shearing around its margins. Without this, ice flows too slowly around this obstacle and thickens excessively relative to the real setting (Reference Hulbe and FahnestockHulbe and Fahnestock, 2004). Grounding goes according to flotation for the computed ice thickness, and where ice runs aground it experiences a MacAyeal-type (Reference MacAyealMacAyeal, 1989a) basal traction. Additionally, basal traction can be adjusted at grounded model mesh nodes. Mass flux and surface slope are matched across mesh segments that represent grounded-to-floating and floating-to-grounded transitions. The model ‘grounding line’ is thus free to advance and retreat according to the changing ice thickness, and does so in complicated ways.
We initialize the model for a hypothetical state in which all ice streams are fast-flowing and no ice rises are stagnant, i.e. ice run aground on an ice rise flows both over and around the obstacle. The ice fluxes specified through the upstream gates of the ice streams are: Mercer: 11km3 a–1; WIS: 24 m3 a–1; KIS: 26m3 a–1; Bindschadler: 22 m3 a–1; and MacAyeal: 26 m3 a–1. Fluxes from large Transantarctic Mountain glaciers, and the temperature and flow-law rate factor, are as specified by Reference Hulbe and FahnestockHulbe and Fahnestock (2007). We then iterate on the mass and momentum equations until steady-state thickness and velocity are obtained (Fig. 3; see also the first 100 years of Fig. 7 below). With this accomplished, the model may be manipulated via changes to ice-stream mass flux or to the traction parameter where ice is grounded.
Steady-state model fields for all ice streams flowing and no stagnant ice rises: (a) shaded blue regions represent grounded nodes in the domain, and filled contours represent bed elevation (contour interval is 25 m); (b) ice surface elevation (m); (c) ice thickness (m); and (d) ice speed (ma–1). Grounded ice is easy to identify as locally high surface elevation in (b).

The combination of steady-state flow from all of the ice streams and no stagnant ice rises leads to the formation of a broad zone of grounded ice between WIS and CIR that bears similarity to the present-day ice plain observed at that location (Fig. 3). The downstream reach of KIS is floating and the grounding line is located on a forward slope ~100 km upstream of its present-day location. This result is consistent with observations of a deep bed and widening outlet downstream between SD and ER. Fast flow and downstream thinning keep the ice relatively thin between the two ridges. Grounding-line advance here will require a change that reduces divergence so that relatively more ice is retained in the KIS outlet area. The DF is afloat in our initial model state (Fig. 3). It should be noted that the outboard DF margin is the boundary of our model domain, and so we are forcing relatively large lateral shearing there. However, the bed is relatively deep at the DF, so the thin ice corresponding to uninhibited, fast flow down KIS favors floating ice at this location in any case.
Thus configured, the model may be used to examine a variety of manipulations to ice-stream flux and basal traction, including ice-rise stagnation. While we seek changes that promote grounding-line advance in the KIS outlet (via decreases in divergence through that region), we are interested more generally in feedbacks among ice thickness, mass flux and grounding. At the sites of the modern DF and GF, our goal is to distinguish cause and effect in the histories of these areas. For example, it might be the case that the GF grounded passively as other changes were underway or it might have been that grounding in the GF region modified ice flow in a way that in turn affected KIS grounding-line location. While we have generated many scenarios, here we present the results of one particularly instructive perturbation experiment.
Perturbation experiment
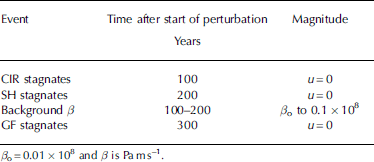
In the model experiment presented here, we hold ice flux from the interior constant and force a series of ice stagnation events that resemble historical events in the region. Ice that was grounded over CIR and SH stagnated several centuries before KIS shut down (Reference Bindschadler, Roberts and IkenBindschadler and others, 1990; Reference Fahnestock, Scambos, Bindschadler and KvaranFahnestock and others, 2000). The GF must have done the same, although we are not aware of any evidence to provide detail regarding this change. In the model experiment discussed here (Table 1), CIR is forced to stagnate 100 years into the model run, and SH is forced to stagnate 100 years later. As shown below, this yields grounding in the GF region, and we choose to stagnate ice there as well. Stagnation is represented in the model by increasing basal traction by an order of magnitude for grounded model mesh nodes at the ice-rise sites and then forcing the velocity to be zero at the end of that 100 year transition. In this simple way, we represent an ongoing change to basal properties that in the end results in stagnation at the feature. Our main interest is in the non-local effects of such changes.
Timing and description of boundary condition changes
Results
Ice-rise stagnation leads to thickening, initially at rates of 0.6–0.8 m a–1, upstream of the ice rises, which causes additional ice to run aground around the GF and across the sill marking the downstream extent of the KIS overdeepening (Fig. 4). Ice grounds across the full width of the sill only when both CIR and SH stagnate; we cannot produce this result with only CIR stagnation. We force grounded ice in the GF to stagnate at 300 years, a time when ice that was initially floating has grounded in response to changes at CIR and SH (Fig. 5). After the GF stagnates, grounded ice spreads laterally across the KIS outlet relatively quickly, on the scale of decades.
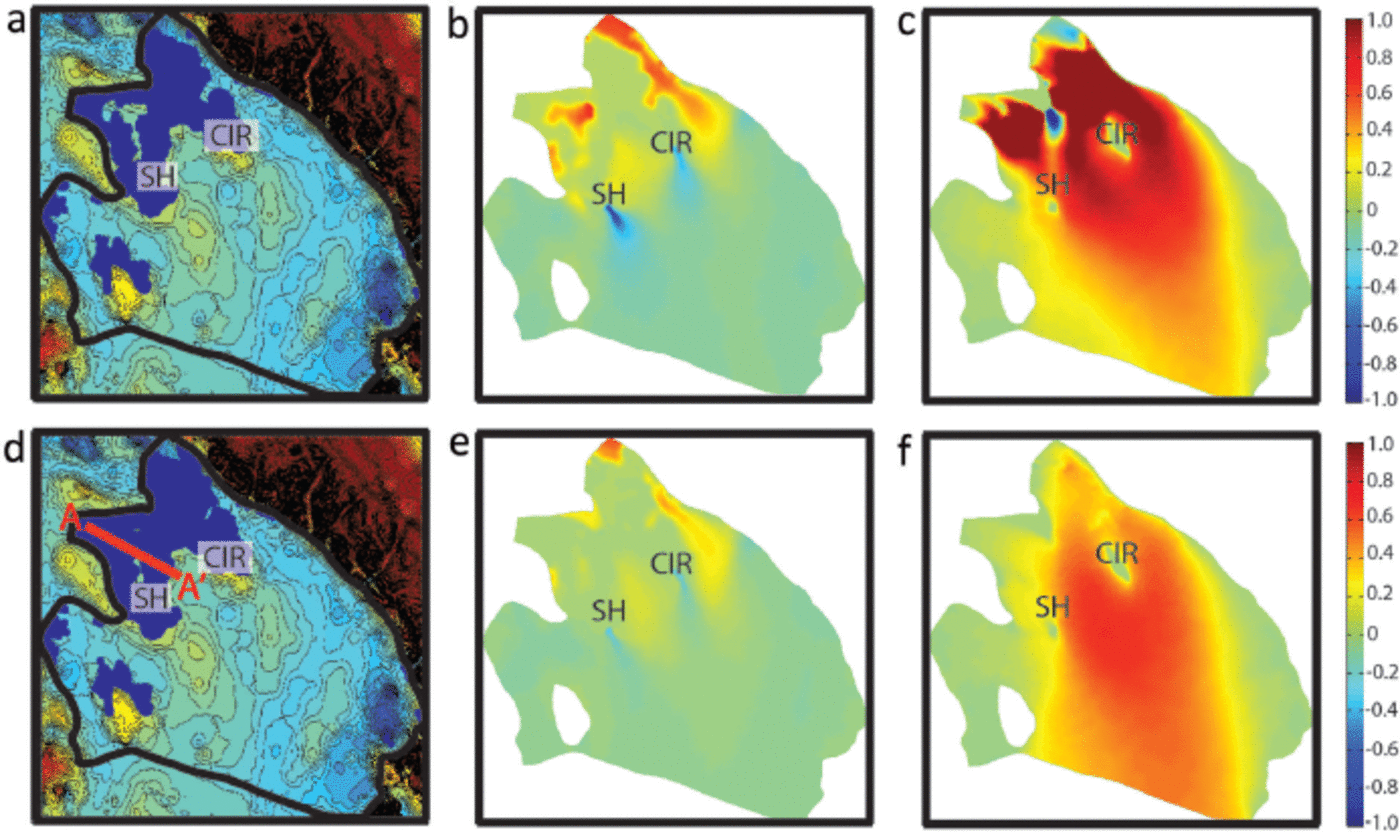
Model output from individual time-steps in the perturbation experiment: (a–c) 200 years and (d–f) 250 years into the experiment. CIR and SH stagnate at 100 and 200 years, respectively. (a, d) Shaded regions representing grounded nodes in the FEM domain. Contours are bed elevation with an interval of 25 m. (b, e) Rate of thickness change, dH/dt (m a–1). (c, f) Rate of ice speed change, dU/dt (m a–1). Panels showing rates of change share the same scale to the far right-hand side.

Model output from individual time-steps in the perturbation experiment: (a–c) 300 years and (b–f) 400 years into the experiment. GF stagnates at 300 years. (a, d) Shaded regions representing grounded nodes in the FEM domain. Contours are bed elevation with an interval of 25 m. (b, e) Rate of thickness change, dH/dt (m a–1). (d, f) Rate of ice speed change, dU/dt (m a–1). Panels showing rates of change share the same scale to the far right-hand side. The red line (A–A’) marks the location of the transect in Figure 6.
The flux of ice arriving from the interior of the ice sheet is constant in the model scenario presented here. We found no reasonable increase in KIS flux that caused significant grounding-line advance downstream because the accompanying increase in ice speed was always sufficient to flush the ice from the KIS outlet before grounding occurred.
The grounding line advances in the KIS outlet, but does so mainly transverse to the direction of ice flow as mediated by bathymetry (Fig. 4 and 5). The DF is one of several residual lakes where ice remains floating even after many other features have changed across the outlet region. The lakes remain where the bed is locally deep (Fig. 5a) and the grounding line has advanced around them. This presents a new view of an ice-stream lake, one in which the features associated with a complicated grounding line advance across, rather than down, the ice-stream outlet.
Discussion
Feedbacks
Because they involve mass flux, thickness transients propagate at ‘advective’ decade-to-century timescales (cf. Reference MacAyealMacAyeal, 1989b). Where an initial perturbation (e.g. stagnation of an ice rise) causes local thickening via reduced divergence, the associated reduction in mass flux yields thickening upstream and thinning downstream of the perturbation. Both changes may affect grounding regionally, which in turn affects basal traction and ice speed. Thickness changes also affect surface slope, and the two together cause local changes to the rate of ice flow. Thus, an initial slowdown due to increased basal traction decays as thickening drives faster flow, until a new steady state is found that reflects the changed basal traction. As that adjustment occurs at the site of the initial perturbation, the changing mass flux propagates the perturbation to other areas.
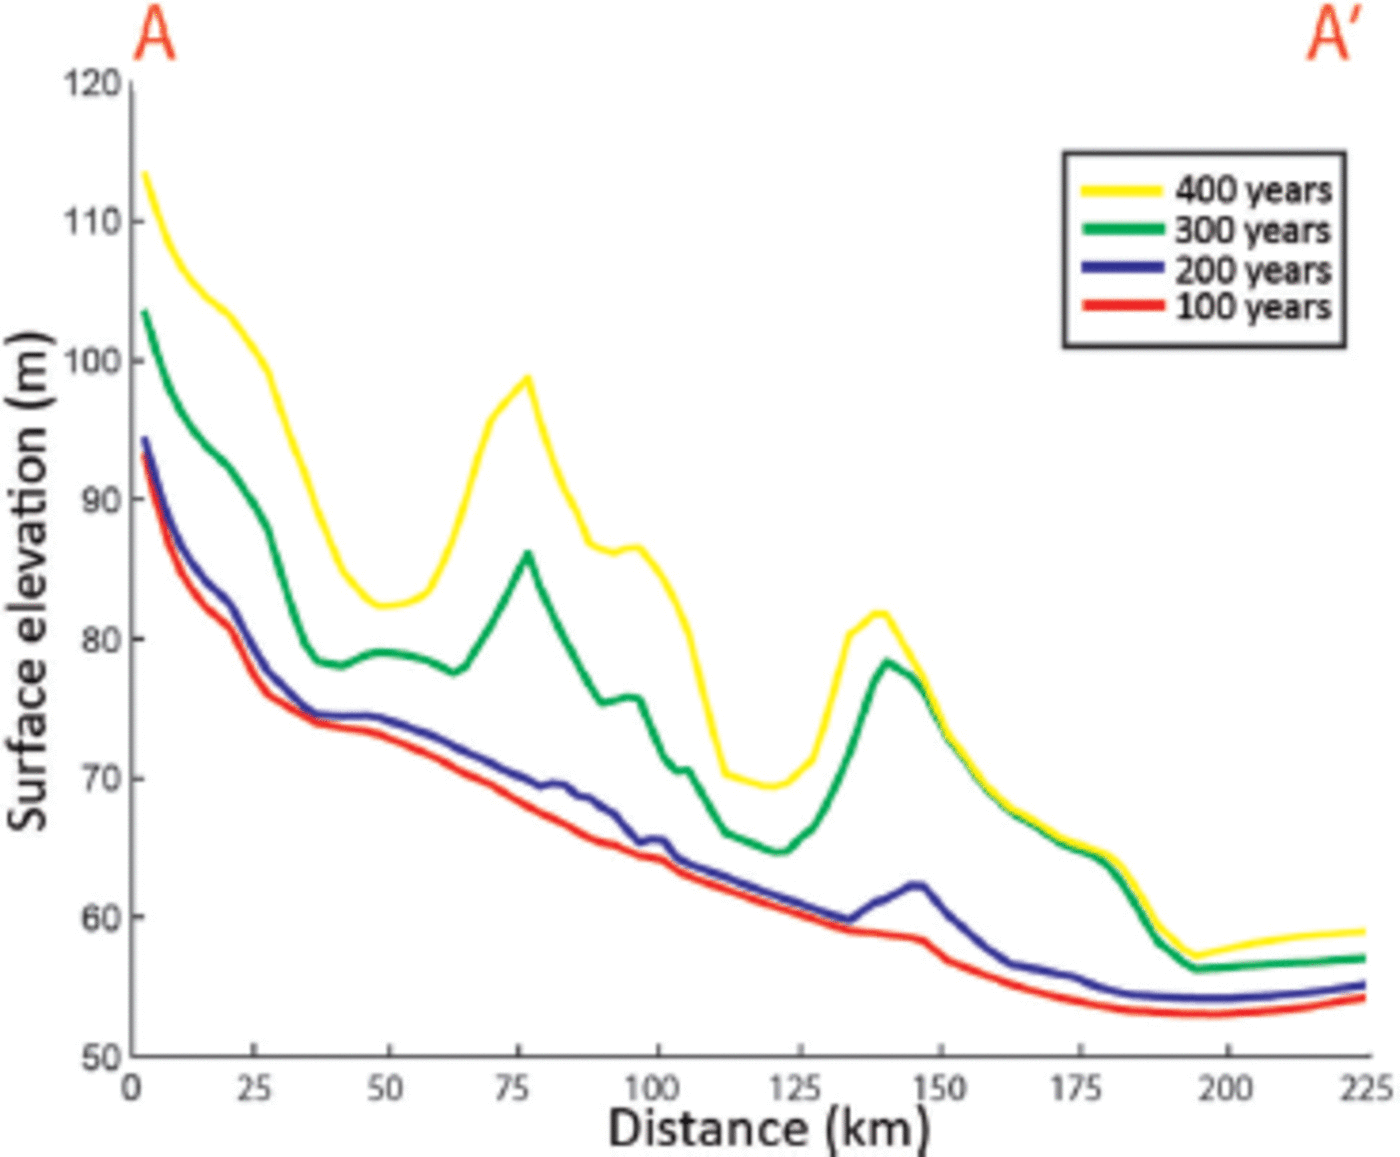
Where a thickness transient yields grounding (ungrounding), basal traction is increased (decreased) and additional thickening (thinning) occurs. In the case of grounding, decreased divergence upstream causes thickening there, while the now thicker ice transported downstream (albeit more slowly than when the ice was floating) produces thickening in the wake of the newly grounded area (Fig. 6). The grounding feedback thus propagates the initial forcing (ice-rise stagnation) far afield. Each new incidence of grounding requires its own adjustment toward a new steady state, a process that in our single experiment plays out over centuries (Fig. 7).
Time-varying along-flow surface elevation profile (A–A’) shown in Figure 5d for the perturbation experiment.
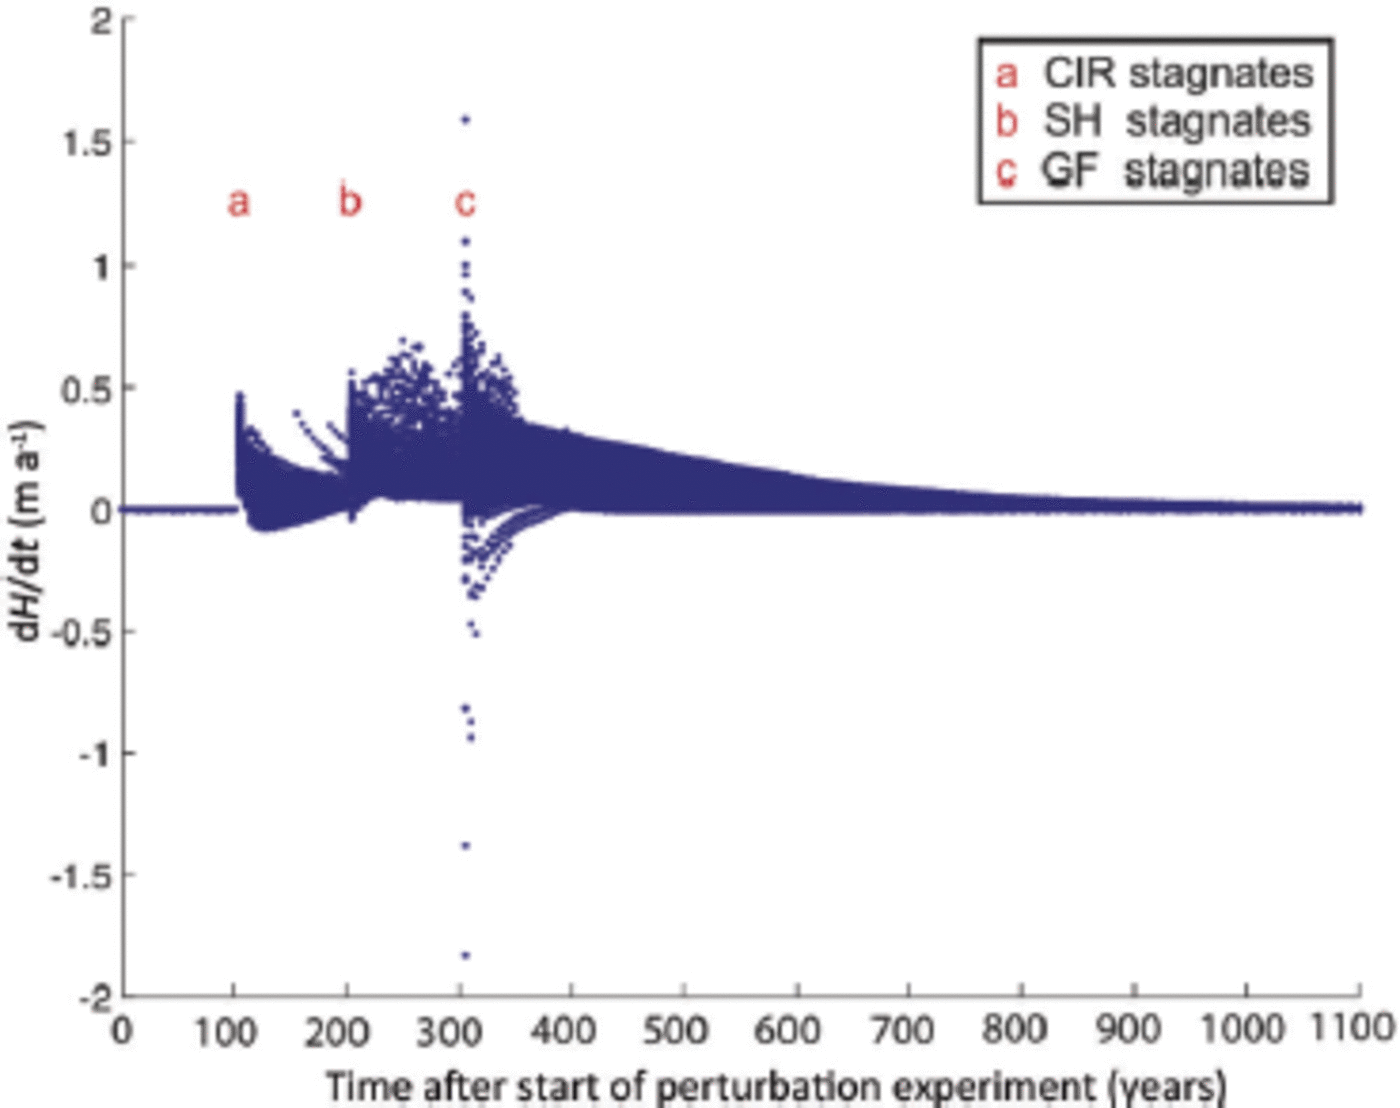
Rate of thickness change at model nodes in the KIS outlet region during the perturbation experiment. Initial responses to forced stagnation of ice rises and the GF are large and include both thickening and thinning. Thickening leads in some places to grounding, which produces a long timescale adjustment to the initial perturbation.
When CIR is forced in the model to stagnate, the thickening signal propagates upstream across the existing ice plain, and that thickening in turn propagates the signal laterally and into floating ice. New ice then runs aground, following highs in the bathymetric contours. In models not shown here, where only CIR is forced to stagnate, the new steady-state thickness corresponds to ice grounded on the shallowest parts of the sill downstream of the modern KIS grounding line, but ice over the overdeepening remains afloat (e.g. Fig. 4a). Forced stagnation of SH expands the reach of the grounding feedback, as does stagnation of the GF.
Stagnation of the GF can either promote or retard KIS grounding-line advance. When both KIS and WIS are fast-flowing, the GF area tends to be floating because of its geometric setting on the lee side of ER, where ice tends to be thinner between the KIS and WIS outflows. In our perturbation experiment, the area experiences some grounding after CIR stagnation because the bed there is relatively shallow. Forcing grounded GF ice to stagnate narrows the KIS outlet, thickening the main trunk of the ice stream. In the experiment shown here, that thickening is part of a wave of grounding that fills the overdeepening via a lateral advance of the grounding line from both the GF and DF directions. However, were we to allow ice to continue to flow over SH, i.e. grounded but not stagnant, relatively less DF ice would be grounded. Furthermore, while ice in the KIS outlet would thicken, the resulting increase in ice speed would yield thinning sufficient not only to keep ice in the trunk of KIS afloat, but also to cause previously grounded ice to unground. Thickness transients originating at SH when it is forced to stagnate keep ice grounded across the sill, a consequence that supports sustained thickening in the overdeepening. Thus, stagnation of both ice rises, not merely grounding, is required to promote grounding-line advance down the trunk of KIS.
At the end of our model experiment the grounding line is far seaward of its present-day location. Clearly, additional events are required to generate the actual grounding-line position, including ice-stream stagnation and reactivation events such as those modeled by Reference Hulbe and FahnestockHulbe and Fahnestock (2007). Our model tends towards a grounding line where a flowline model would position it, i.e. near the crest of a sill on the sea floor, but not entirely for the same reason. The importance of the sill is twofold: it is a platform across which the thickening and grounding feedback can propagate a thickness signal from a nearby (across-flow) region and, once grounded, it reduces downstream stretching so that upstream ice, which would otherwise remain floating, may ground.
Outlet lakes
The model outcomes presented here are generally consistent with the hypothesis of Reference AlleyAlley and others (2006): the proglacial sill acts as a pathway for grounding-line migration, and subglacial lakes form upstream under remnant floating ice in bathymetric depressions. In our perturbation experiment, the DF forms as such a lake proximal to the grounding line and at the ice-stream margin. Previous studies attributed the buried crevasses of different ages bounding the DF to an inward ‘margin jump’ associated with stagnation of the ice stream (Reference Retzlaff and BentleyRetzlaff and Bentley, 1993; Reference Catania, Scambos, Conway and RaymondCatania and others, 2006b). The outlet margin lake produced in our numerical model scenarios leads us to suggest a mechanism by which such a ‘jump’ may occur.
Today, subglacial lakes form preferentially in bed depressions along shear margins at the low-slope WIS ice plain. The hydraulic potential Φ is,
where ρi and ρw are the density of ice and water, respectively, Zs and Zb are the ice surface and bed elevation, respectively, and g is the acceleration due to gravity. Along shear margins, higher effective strain rates focus mechanical thinning along the ice margin, resulting in a surface gradient toward the margin. The new surface gradient produces a low in the hydraulic potential gradient, which directs water away from the main trunk of the ice stream and toward the margin (Fig. 8).
MOA image showing Whillans Ice Plain and the locations of subglacial lakes (Reference Fricker and ScambosFricker and Scambos, 2009). Effective strain rates shown as color map calculated from ice velocities in Reference Scheuchl, Mouginot and RignotScheuchl and others (2012). Shear margins are characterized as narrow bands of high effective strain rates separating the active ice stream from adjacent ice ridges. White contours indicate hydropotential (contour interval is 200 kPa). Grounding line is shown as a black line.

The four largest subglacial lakes with respect to surface area documented by Reference Fricker and ScambosFricker and Scambos (2009) are located along shear margins or, in the case of Lake 7, a shear margin suture zone now advecting from the confluence of WIS and Mercer Ice Stream (Fig. 8). The shear margins bounding WIS are heavily crevassed, with widths of a few kilometers and effective strain rates of ~0.01-0.25 a–1 (Fig. 8). Throughout the ice stream, water follows hydropotential gradients toward relatively thin shear margins (Reference Carter and FrickerCarter and Fricker, 2012) and eventually discharges through coastal embayments and estuaries (Reference HorganHorgan and others, 2013).
High-resolution imagery of SLE and the surrounding flat-ice region distinguishes several zones of distinctive surface morphology (Fig. 9), interpreted here following the example of Reference Merry and WhillansMerry and Whillans (1993). Large effective strain rates along the outboard shear margin are coincident with a narrow band of en echelon hook-shaped surface crevasses marking the transition between flowing ice in the flat-ice terrain and slow-moving ice on ER (Fig. 9a). As ice in the stream moves past ER, simple shear rotates the inboard ends of the crevasses into hooks that are concave down the ice stream. Inboard of the en echelon crevasses is a wide chaotic crevassed zone. Here, continued shearing and opening of new crevasses creates a large zone of complex crevassing (Reference Merry and WhillansMerry and Whillans, 1993). Upstream of SLE, the main trunk of WIS borders the chaotic crevassed zone on its inboard side. However, inboard of SLE, a second narrow zone of en echelon hook-shaped crevasses emerges over the lake shore, forming a second fractured (i.e. shearing) margin in the stream (Fig. 9b).
MOA image (Reference Scambos, Haran, Fahnestock, Painter and BohlanderScambos and others, 2007) showing the right-lateral flat-ice terrain at the downstream end of WIS. Curved blue line is the SLE boundary identified by Reference Fricker and ScambosFricker and Scambos (2009). Surface expression and shear margin pattern is annotated. White boxes represent areal extent of high-resolution imagery (Worldview image from the Polar Geospatial Data Center, 5 m) in A and B. Inset A shows outboard shear-zone surface morphology: (a) en echelon arcuate crevasses, (b) ER and (c) chaotic crevasse zone. Inset B shows SLE inboard shoreline surface morphology: (a) en echelon arcuate crevasses, (b) chaotic crevasse zone over the lake and (c) main trunk of WIS.

SLE as a modern analog to DF
In the case of the DF, it may be appropriate to view the morphologically similar SLE at the outlet of WIS as a related figure, created by similar processes. The arrangement of buried crevasses around the DF flat-ice terrain is similar to the modern terrain around SLE (Fig. 10). The formation of subglacial lakes along lateral margins modifies ice mechanics by focusing shear along lake shorelines oriented parallel to flow. The DF flat-ice terrain is bounded by two relic lateral margins, now buried by recent snow. An outboard band of near-surface crevasses tracks the boundary between SD and the formerly fast-flowing ice, and inboard a second zone of near-surface crevasses marks the boundary between the shear margin and the most recently active main trunk of KIS. The marginward surface slope of the DF must be the result of high effective strain rates and localized thinning along the former outboard shear margin.
MOA image showing the DF flat-ice terrain. M1 represents the oldest outboard relic shear margin (350 years) and M2 the younger inboard relic shear margin (150 years), as represented in Reference Catania, Scambos, Conway and RaymondCatania and others (2006b).

The mechanical setting at ice-stream corners facilitates subglacial lakes and flat-ice terrains, features that we suggest mediate grounding-line migration. Viewing ice-stream outlet corners as lakes, either due to thinning along a grounded shear margin or to advance of the grounding line around a relatively deep part of the bed, demands a re-examination of the ‘margin jump’ interpretation of the ages of buried crevasses on the outboard and inboard sides of the DF. In either case, the shoreline on the inboard side of a margin lake promotes shearing inboard of an older margin.
Conclusions
We have used a 3-D ice-sheet/ice-shelf numerical model to investigate the types of perturbation associated with KIS grounding-line advance prior to its recent stagnation. The simplest option is to conclude that the KIS grounding line was never that far upstream of its present location. However, if it was, as suggested by Reference Catania, Hulbe, Conway, Scambos and RaymondCatania and others (2012), then the alternative appears to be to force the change from the ice-shelf side of the system. In our model, grounding-line advance across the bathymetric overdeepening is a product of decreased divergence in the ice-stream outlet due to ice-rise stagnation. Stagnation of both ice rises (CIR and SH) is needed to produce this result.
The mass flux and grounding feedback allows a known perturbation applied at one location (e.g. stagnation of CIR) to propagate upstream and laterally, along contours on the sea floor. In our perturbation experiment, grounding-line advance proceeds not in the direction of flow, but transverse to flow, as mediated by local bathymetry. This highlights the importance of 3-D context when grounding-line advance and retreat are considered, which might not otherwise be elucidated in flowline models. Specifically, these effects modify the timescales associated with adjustments to grounding-line position, and lead to rapid episodes of grounding and, in turn, grounding-line migration.
Remnant subglacial lakes on the upstream side of the grounding line may be a consequence of grounding-line advance. In our analysis, the DF is an example of a new trapped subglacial lake forming along a shear margin at the KIS outlet corner. Here, the lake initiates two shear zones on the lake shorelines oriented approximately parallel to flow, a setting whose ice mechanical signature appears remarkably similar to the active SLE at the left-lateral corner of WIS. We identify a second younger zone of en echelon arcuate crevasses along the inboard shoreline of SLE, representing a second zone of shearing where basal traction increases outside the subglacial lake terrain. Thus, we view the buried crevasses that bound the DF as passive features intrinsic to the formation of a large subglacial lake (flat-ice terrain) at the ice-stream outlet, and not as an active ‘margin jump’ as previously noted by other studies. Following similar reasoning, the GF can be viewed as an older remnant lake. It formed as a wave of grounding due to stagnation of CIR passed by the northern end of ER and has since grounded completely.
The processes discussed here are driven entirely by forcing from the floating side of the grounding line, mediated by outlet geometry on the grounded side. In the numerical modeling experiment we present, the flux of ice arriving from the interior of the ice sheet is constant, and grounding-line migration is driven entirely by declining mass flux out of the ice-stream outlet region due to ice-rise stagnation. It is reasonable to assume that loss of ice rises would have the opposite consequence, though once the ice is stagnant, melting or an increase in sea level would be required to promote such a change.
Acknowledgements
Imagery for this work was provided by the Polar Geospatial Data Center. This work was funded by the US National Science Foundation Office of Polar Programs award No. 0838810 to C.L. Hulbe and M.A. Fahnestock. The manuscript was greatly improved by comments from Sasha Carter and an anonymous reviewer.


