
The literature on vote choice has traditionally emphasized the impact of objective or rational decision factors such as economic conditions and reactions to candidates’ revealed policy positions. This literature has noted that these objective influences are further affected by other factors such as voters’ interests as conditioned by their sociological characteristics and partisan attitudes and attachments. Reference Berelson, Lazerfeld and McPhee1,Reference Riker and Ordeshook2 More recently, an increasing number of scholars have conducted studies that explore the impact of subjective factors that are not directly connected to objective assessments of candidate quality. This growing literature is defined by the application of insights from ethology to the study of leadership and citizen response, and it has offered new insights into how such things as the physical characteristics of candidates for office affect the choices of voters. Reference Stewart, Salter and Mehu3
One aspect of this literature involves exploring the relationship between a candidate’s appearance and the support that candidate receives from voters. Reference Sullivan and Masters4 There are multiple lines of research in this growing literature, and while much has been learned about how the nonverbal displays of leaders and candidates affect the support they receive, there is still much work left to be done. This is especially true, as Stewart, Salter, and Mehu have noted, as candidates for office are continuing to evolve more sophisticated, media-based campaign strategies and as the very media outlets that present candidates’ facial displays offer higher-resolution portrayals of office seekers because of such technological developments as high-definition television. 5 In terms of how to advance this research, there are numerous avenues. These include continuing to explore the impact of nonverbal facial displays in general, and smiling in particular, in different cultural contexts and in different political (institutional) contexts. These potential avenues of approach would allow scholars to know whether the positive relationship that has been discovered between smiling and support is universal and how this relationship is affected when we control for intervening factors that define different institutional and cultural contexts.
We advance this research in this article by investigating the relationship between candidates’ smiles and the support they receive in election contests in two ways. First, we explore how the relationship between a candidate smiling and the support he or she receives in an election holds up in a different cultural context. To be sure, the relationship between the facial expressions of candidates and the support they receive in their efforts to obtain public office has been tested in many nations outside the United States. Reference Masters and Sullivan6 Nonetheless, most empirical investigations, and thus theoretical advances, have come from research conducted primarily in the United States. This is not problematic in and of itself, but it does avoid the question of how we can be certain that we are on firm intellectual footing when we conclude across all nations from research that has been conducted principally in a single country, particularly a country in which leaders are selected under a rather distinct set of institutions and processes. To address this issue, we explore the relationship between the facial displays of candidates, specifically, the extent to which they presented a smiling face to potential voters and the support they obtained by analyzing results from the 2015 local elections in Japan.
The second way we intend to advance this research involves exploring in more depth how certain intervening factors affect the positive relationship that exists between a candidate smiling and the support he or she receives in an election contest. In this study, we explore the impact of two moderating variables: levels of turnout and the number of competing candidates. Concerning the former, we know that voters with strong partisan attachments turn out at higher rates than nonpartisans, which leads us to expect that the relationship between smiling and support will be different in elections defined by different levels of turnout. By controlling for different levels of voter participation, we can obtain a more nuanced understanding of the impact of candidates’ facial displays on the responses of voters. Concerning the latter, research has shown that as the number of competing candidates in an American primary decreases, the impact of nonverbal displays elicits a stronger response from potential voters. 7 While this is not a direct test of the moderating impact of the number of candidates competing in a district election in Japan, we explore this counterintuitive result further because the Japanese local elections we use in this study are distinguished by, among other things, election districts that involved different numbers of competing candidates. Specifically, we show that instead of smiling acting as a device to help voters wade through large amounts of information that require more effort to manage, it is more like a predisposition that strengthens as political competition becomes clearer with numerically fewer candidates.
The Japanese context, campaign posters, and candidate support
A growing number of studies have investigated whether and to what extent such subjective factors as a candidate’s physical appearance affect the amount of support that candidate receives in an election in countries other than the United States. 8,9 For example, using the photos of candidates in national elections, Berggren, Jodhal, and Poutvaara investigated this relationship in Finland, while King and Leigh did the same in Australia. Both studies found that candidates with more “beautiful” faces tended to garner significantly more votes than competitors whose faces were characterized by less beauty. Reference Berggren, Jodhal and Poutvaara10,Reference King and Leigh11 Some other scholars have argued that such subjective judgments of candidates’ physical features and nonverbal displays are related to evaluations of candidate competence, which has been shown to be a robust predictor of hypothetical voting behavior. Reference Atkinson, Enos and Hill12,Reference Ballew and Todorov13,Reference Olivia and Todorov14,Reference Murray15,Reference Lawson, Lenz, Baker and Myers16,Reference Rosar, Klein and Beckers17
As stated earlier, we explore this relationship and the factors that affect it in more detail by focusing on the 2015 local elections in Japan. These local elections are an excellent context in which to conduct this research because focusing on elections in Japan allows us to continue such scholarly investigations not simply outside the United States but also outside the West in general. Such an opportunity is important because while some research conducted in Japan has found a positive relationship between the extent to which a candidate smiled and the amount of support he or she received, Reference Horiuchi, Komatsu and Nakaya18 other research has found that Japanese are somewhat different in terms of how certain sociopsychological factors may influence emotional responses to different facial expressions. Reference Matsumoto19,Reference Biehl, Matsumoto, Ekman, Hearn, Heider, Kudoh and Ton20
The 2015 local elections in Japan also provide a very useful context for examining the relationship between a candidate’s smiling and the support he or she receives because we can see how this relationship is affected by other political factors. We are interested in two moderating factors in particular. As we explain in more detail later, these elections included 20 cities, each with multiple election districts. The districts varied both in the size of their populations and in the number of seats for which candidates could compete. As a result, they represent an optimal way to control for the impact of the number of competing candidates. This is important because it will allow us to determine whether candidates’ facial displays helped voters manage information that, in these local Japanese elections, increased in complexity as the number of candidates increased or whether they had the same impacts witnessed in the U.S. primary data examined by Sullivan and Masters. Specifically, are these local elections like U.S. primary contests, in which the impact of facial displays increased in strength as the primary process moved toward the emergence of finals nominees? 21
Concerning turnout, we know that rates of voter participation vary with a number of institutional rules and with individual voter characteristics. Reference Franklin, LeDuc, Niemi and Norris22 We also know that differences in turnout levels can have a profound impact on the outcomes of elections. Reference Campbell23,Reference DeNardo24 This is particularly true for different types of elections that are conducted under different electoral systems. In the United States, we know that presidential elections have much higher turnout rates than midterm and primary elections, and these differences are also true for countries that make voter registration easier, have longer election periods, and have disincentives for nonparticipation. 25 Throughout the postwar period, turnout in Japanese national elections has declined moderately but has averaged around 65%. Contrary to patterns identified in European elections, participation rates have tended to be higher in rural areas.
With respect to the impact of different turnout rates on levels of candidate support, research has shown that strong partisans tend to turn out at higher rates than weak partisans and independents and that strong partisans are much more consistent in their vote choices than members of the other two groups. Reference Budge and Farlie26,Reference Petrocik27 As a result, all things being equal, high turnout in elections will be different in terms of outcomes compared with contests that are defined by low levels of turnout. What this means for turnout’s impact on the positive relationship between smiling and support will most likely be nuanced. On the one hand, since primary voters tend to be strong partisans and thus clearer in their political preferences, it is likely that, in accordance with the findings of Sullivan and Masters, they will be more solid in translating their responses to facial displays into actual vote choices. With respect to turnout rates, this means that the relationship between smiling and support should be stronger in low-turnout elections. On the other hand, there is another body of theory that notes that high-turnout elections contain more voters who are influenced by short-term factors that involve candidate and party effects, which can include the influence of such heuristics as the facial displays of candidates. 28 As we explain in more detail later, these two possibilities require us to do more than include turnout as a simple moderating variable in the statistical analysis.
The 2015 local elections in Japan are also a useful context to explore the relationship between a candidate’s smile and the support he or she received in these election contests because of the manner in which candidates presented themselves to the electorate. All candidates in these Japanese local elections had posters containing their photographs produced and then presented to potential voters. There are two aspects of this that are very important in terms of analyzing the relationship between smiling and support. First, in this set of local elections, the chance that voters saw candidates’ photos prior to casting their ballots was quite high because these photos were actually used in the official gazette for elections (senkyo koho), which was not only accessible on the city’s website but also mailed directly to all registered voters. 29 These photos were also used in the candidates’ campaign posters, which were displayed in conspicuous public places and thus were visible everywhere in participating cities throughout the campaign period. This means that while we know that the location and availability of these campaign posters made them readily available to registered voters, we cannot guarantee that they were actually viewed by all who voted in these elections. 30
In addition to this, these campaign photographs represent the judgment of each candidate as to how he or she wished to appear to voters. In other words, each candidate had a number of headshots taken and then selected from among them the one that best represented that candidate to voters. What voters saw was a single image of how each candidate wanted to represent himself or herself to district voters. This means that voters saw the same image without variation, eliminating the possibility that one voter might focus on one aspect of a televised representation while a different voter focused on another aspect. In other words, the campaign photos in the 2015 Japanese elections provide an excellent representation of the facial displays they wished to present to voters in their efforts to obtain district seats.
Given that we are using candidate photos to investigate this relationship, we next had to decide how we would measure the extent to which each candidate presented a smiling face on his or her campaign poster. There is an extensive literature on classifying facial expressions and what they may actually express, and more than one method is used in these studies to code the facial expressions that were examined. While all have pluses and minuses, we chose to employ an automated facial recognition technology, one that was invented by Omron Corporation, which was founded in 1933 in Osaka, Japan. This technology was utilized by Horiuchi, Komatsu, and Nakaya in their examinations of national elections in Australia and Japan, but there have been improvements in this technology since their study was conducted. 31 As we explain in more detail later, we use this technology to produce an index that captures the extent to which a candidate smiled on his or her campaign poster, and then we use that index in our analysis of the relationship between smiling and candidate support. Reference Mehu, Grammer and Dunbar32,Reference Mehu and Dunbar33
Smiling and support: Hypotheses and measures
In light of the relationships we have discussed, we now turn to the empirical part of the analysis, which involves deriving and testing three hypotheses. We state these three hypotheses formally here.
- H1:
The more a candidate smiles on a campaign poster, the more support that candidate will receive.
To complete this empirical test, we gathered the photos of 1,379 candidates in Japan’s 2015 local city elections, which are designated by ordinance (shitei toshi). 34 As we noted earlier, voters had a high probability of seeing these photos as they were displayed in conspicuous public places, used in the official gazette for elections (senkyo koho), and mailed directly to all registered voters, 35 and all of these activities continued throughout the entire campaign period. The manner in which we scored the extent to which a candidate’s poster revealed a smile will be discussed in detail in the next section.
- H2:
The impact of smiling on candidates’ support levels will be positive, but it will decline as the rate of turnout increases beyond a certain level.
We know from the literature that electors can be distinguished in terms of the strength of their partisan attachments, and different partisan strengths affect the consistency of vote choices as well as the probability of turning out in an election. 36 This literature has taught us that electors with weaker partisan attachments are less consistent in their party support, are more influenced by short-term forces in their vote choices, and turn out at lower rates than strong partisans. What is worth emphasizing here is that short-term forces involve such things as candidate effects, including responses to the facial displays candidates present to voters. It is also worth emphasizing that weaker partisans who are more responsive to short-term forces will have a greater presence in higher-turnout elections, which tells us that the relationship between turnout and the impact of smiling on a campaign poster is expected to be positive. In addition to this, we explore this relationship in a way that helps us determine whether this is monotonic or whether the impact of turnout experiences a marginal decline after turnout reaches a certain level.
We need to note that throughout the postwar period, partisanship in Japan has declined, leading to a rise in the number of weak partisans and politically unattached voters. 37,38 Moreover, we know that there are differences in turnout between rural and urban districts. Combining these two factors complicates the relationship we are investigating because some election districts in Japan — for example, districts that are more rural in composition — have fewer voters who have weak partisan attachments and, as a result, register overall higher mean rates of turnout. In addition to this, we know that highly competitive elections can stimulate higher levels of turnout and that under such conditions, partisan factors and more substantive considerations can outdo such factors as facial expressions as influences on the support that candidates receive. It is for these reasons, as well as those stated earlier, that we expect to see a declining marginal impact with respect to how turnout rates affect the relationship between smiling and the support candidates receive. 39
- H3:
The impact of smiling and candidate support will be positive, but its impact will decline as the number of competing candidates in a district election increases.
As discussed earlier, Sullivan and Masters showed that as the American primaries they examined moved closer to the selection of each party’s official nominee, the emotional response of potential voters to candidates’ nonverbal displays became stronger. We expect this relationship to be observable in our analysis of the 2015 local elections in Japan. This is because we expect that the response of Japanese voters to candidates’ facial displays will become clarified and thus stronger as the number of competing candidates declines in a district contest.
In the analysis that we conduct here, we identify, measure, and calibrate these effects. We accomplish this first by examining the extent to which such facial displays, particularly the extent to which candidates present a smiling profile to voters in their campaign posters, leads to voters having stronger preferences for those candidates. Specifically, if this relationship obtains, controlling for other influential factors, then we should see larger or fuller smiles leading to higher vote shares for candidates in general (H1). We should also witness this general relationship increase as turnout rates rise (more participants voting), but we anticipate that the generally positive impact of smiling on support will decline as turnout increases beyond a certain point (H2). Finally, while the number of candidates will increase vote shares overall, we should also see the impact of smiling on candidate support increase as the number of candidates in a district election declines (H3). Our efforts to identify and measure these relationships begin with a more detailed discussion of the smile index we employ in our analysis. 40
The smile index
As mentioned briefly earlier, we use a special facial recognition software for our analysis of candidates’ campaign posters. The software we use is called OKAO Vision, which was developed by Omron Corporation, a Japanese electronics company. One of the most significant features of this software is its ability to evaluate smiles in digital images and then to generate a continuous measure of the extent to which a face is smiling or not. This index was developed based on a growing literature that is focused on mathematically driven software approaches for describing the shape of human face. Reference Bookstein41,Reference Lestral42,Reference Viola and Jones43
Estimated smile score of sample candidates.

The OKAO Vision software works in the following manner:
(1) The software rapidly extracts a face-like object by assessing varied brightness levels in different parts of a given digital image.
(2) The software fits a three-dimensional face model onto landmark data of the identified object and identifies the various muscular components of a human face.
(3) The software computes the so-called Haar-like features around key patterns common in smiling faces, such as how much the mouth and eyes are open, how the outer corners of the eyes are shaped, and how developed wrinkles around eyes, nose, and mouth are.
(4) The software then computes five types of face expressions: “happiness,” “neutral,” “surprise,” “anger,” and “sadness.”
(5) Using a Bayesian statistical method, the software produces the posterior distribution of “happiness” scores, which range from 0 (no smile; 0%) to 1 (full smile; 100%).
Based on the way the OKAO software evaluates facial characteristics, we concluded that a “happiness” score is the most appropriate measure of a candidate’s smile, and as a result, we use it in our analysis of how a candidate’s smile affects his or her performance in the 2015 local Japanese elections we examine. Figure 1 provides three examples of candidate posters that we use to illustrate how the software estimates the degree to which the face of interest is smiling. We randomly selected three samples of 50 campaign posters and then arranged them according to smile index scores (high to low). These samples were then checked by the authors and three graduate students assisting on this project for any observable inconsistencies in the scoring of candidate smiles. 44
The OKAO Vision software shows only one score out of five possible facial types: happiness, neutral, surprise, anger, and sadness. For instance, when a candidate’s face with a full smile (like that on the right in Figure 1) is measured, the OKAO Vision software may show a score of 100 for happiness; such cases present no difficulties for employing this software in our analysis. Unfortunately, there are cases in which the OKAO Vision software did not produce a happiness score, but rather produced other scores, such as surprise and sadness scores. This is important because if the OKAO Vision software produced a score of 100 for anger or another facial type, then it would not produce any happiness score at all, as was the case in these instances.
This situation presented us with a true technical issue that could have prevented us from producing a sample of sufficient size for our analysis. To overcome this challenge, we consulted with the technical support of Omron and were informed that a happiness score for a candidate would be 0% in all cases in which no percentage that was greater than zero was produced by the evaluation of a candidate’s face. 45 This is how we obtained a smile index score for 1,379 candidates in the 2015 Election of City Designated by Ordinance (seirei shitei toshi). 46
Japan’s local election system and the 2015 data
As stated earlier, to conduct our statistical analysis using the smile index scores, we use data from the Japanese Designated City Council elections. There were 20 cities under this system (seirei shitei toshi) with Ordinance Designated City Council elections when the election we investigated was held in April 2015. 47 According to these ordinances, each city is further divided into several electoral districts (ku) with varying district magnitudes. 48 For example, the city of Sapporo has 10 districts with district magnitudes that range from 5 to 10. In the Chuo-ku section of Sapporo city, the district magnitude is 7, and in the 2015 election, there were 11 candidates competing for these seven seats.
For the 20 cities under Japan’s Designated City Council, a plurality-rule, first-past-the-post system in which candidates competed for council seats in districts that ranged in magnitude from 2 to 29 seats was used. Under this system, voters cast a single ballot, and multiple members are elected. Returning to the Chuo-ku section of Sapporo city, for example, when voters in the district cast their single ballots, the top seven candidates who obtained the most votes won one of the available seven seats, while the remaining four candidates lost. Overall, in these elections in 2015, there were 1,477 candidates, and 1,022 were elected in this 2015 Designated City Council Election in Japan. 49
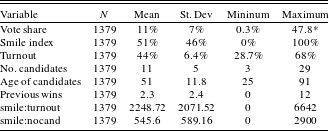
In our research, we focus exclusively on the effects of candidates’ photos on the voter support they received and how this relationship was affected by different levels of turnout and the number of competing candidates. Specifically, we seek to determine the extent to which a candidate gained support under this system when he or she presented a smiling face to electors on his or her digital and hard-copy campaign poster. We also want to determine the extent to which this effect obtained in these district elections under different levels of turnout and different numbers of competing candidates. To capture these effects, we define the variable to be explained as the share of a district’s vote obtained by a candidate. From our 1,379 observations, we see that district vote shares ranged from less than 1% (0.3%) to nearly half (47.8%) of all votes cast, with the mean of this measure being 11%. 50
Turning next to those factors that account for a candidate’s district vote share, our first principal explanatory variable is captured in scores on the smile index for candidates competing in this set of 2015 city council elections. The average value of the smile index in our data was 51%, and it ranged from 0% to 100% for candidates who competed in this election. Our second principal explanatory variable is the level turnout that occurred in a district election. In our data, turnout averaged 44%, and it ranged from a low of 28.7% to a high of 68.4%. The average number of candidates competing for district seats ranged from 3 to 29, with an average of 11 competing for district seats.
We see from Figure 2 that candidates’ vote shares are slightly skewed to the left and that most of the observations cluster around the 11% mean. For our first independent variable, the smile index, we notice that its distribution is defined by numerous observations clustered at the figure’s extremes. These two extremes (0 and 100) in the figure account for 72% of our observations on the smile index. Indeed, our evaluation of election posters revealed that about 43% of our evaluated candidates have no smile at all, but 29% have a significant smile. The remainder of our observations reveal that 28% of the candidates we evaluated have a moderate smile, which means they were located somewhere between 35% and 99% on the smile index.
Histogram of the dependent (vote share) and three types of independent variables (smile index).

Scatterplot between vote share (%) and smile index (%).

In addition to this, to illustrate the relationship between our dependent variable and first independent variable, we produced a scatterplot with observations for all our evaluated candidates; these data are presented in Figure 3. We can see from the data in this figure that there is a moderate degree of positive correlation between the two variables, implying that a higher score on our smile index leads to modest increase in votes for candidates with such facial expressions. We expect this relationship to hold even when we control for other factors known to be important explanatory variables for candidate success in district elections. The statistical analysis we conduct in the next section, however, will determine the extent to which this relationship holds up.
We must note that the amount of support a candidate receives in a district election of this type will be a function of other factors in addition to those already mentioned. To be certain that we capture these factors and avoid omitted variable bias in our analysis, we added several other control variables to our model for estimation. In addition to the level of turnout in each electoral district (turnout), which we discussed earlier, we include an interaction term between smile index and turnout (smile $\times$
turnout),
51
a candidate’s age (age), a dummy variable for a candidate’s gender (male
$\times$
turnout),
51
a candidate’s age (age), a dummy variable for a candidate’s gender (male $=$
1, otherwise
$=$
1, otherwise $=$
0), a dummy variable for an incumbent candidate (incumbent
$=$
0), a dummy variable for an incumbent candidate (incumbent $=$
1, otherwise
$=$
1, otherwise $=$
0), a dummy variable for a formerly incumbent candidate (former_incumbent
$=$
0), a dummy variable for a formerly incumbent candidate (former_incumbent $=$
1, others
$=$
1, others $=$
0),
52
the number of times a particular candidate won in the previous Designated City Council’s Election (previous), and the 19 party dummies controlling for the 20 party affiliations of the candidates.
$=$
0),
52
the number of times a particular candidate won in the previous Designated City Council’s Election (previous), and the 19 party dummies controlling for the 20 party affiliations of the candidates.
OLS regression results (Model 1, Model 2, Model 3).
Notes: Nineteen city dummy variables are included in each regression model, but their information is not reported here. The unit of observation is the candidate. $^{\ast }p<0.10$
;
$^{\ast }p<0.10$
; $^{\ast \ast }p<0.05$
;
$^{\ast \ast }p<0.05$
; $^{\ast \ast \ast }p<0.01$
.
$^{\ast \ast \ast }p<0.01$
.
Model estimation and results
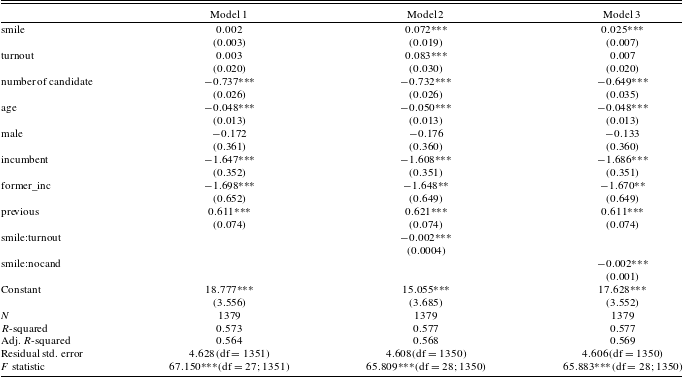
As discussed earlier, we use the smile index, a district election’s turnout rate, and the number of candidates seeking a district seat as our principal variables of concern in determining the level of support candidates received in Japan’s 2015 local elections. We estimated three models using ordinary least squares (OLS). 53 Two of the models we estimated involved estimating the impacts of our two principal independent variables separately but one included the interaction between turnout and a candidate’s score on the smile index. The results of estimating our two models are presented in Table 1.
The results for Model 1 reveal that, contrary to our initial expectation in H1, the estimated effects of a candidate’s score on the smile index and the level of turnout in that district are small, positive (coefficient $=$
0.002), but well out of range of statistical significance
$=$
0.002), but well out of range of statistical significance $(\mathit{SE}=0.003)$
. In addition to this finding, we also note all of the other factors that are known to influence candidate support levels in Japanese district elections are statistically significant with signs in the expected directions.
$(\mathit{SE}=0.003)$
. In addition to this finding, we also note all of the other factors that are known to influence candidate support levels in Japanese district elections are statistically significant with signs in the expected directions.
Specifically, estimates for Model 1 tell us that incumbency, both current and former, has positive impacts, as does the number of times a candidate won a city council seat. The one exception is the impact of a candidate’s gender, which is defined as a dummy variable where male is coded 1. This sign for this variable’s coefficient is in the wrong direction, and it is statistically insignificant. 54 The reason for this has to do with the fact that local elections, like the city council elections under investigation here, tend to have many female candidates who not only stand for available seats but also compete more successfully for them than in elections for the National Diet. Consequently, being a male candidate does not carry the same positive impacts that it typically does in national elections.
OLS regression results (high and low value models).
Note: (1) 19 city dummy variables are included in each regression model, but their information is not reported here.
(2) The unit of observation is each candidate.
(3) $^{\ast }p<0.10$
;
$^{\ast }p<0.10$
; $^{\ast \ast }p<0.05$
;
$^{\ast \ast }p<0.05$
; $^{\ast \ast \ast }p<0.01$
.
$^{\ast \ast \ast }p<0.01$
.
We expected the relationship between the level of turnout and the impact of a candidate smiling to be somewhat complicated, which is why Model 2 includes an interaction term of these two variables. We see from the model’s estimates that the inclusion of the smile/turnout interaction term has a profound impact on our results. This means that the impact of candidates smiling on obtained vote shares differs with the levels of turnout. Specifically, when we add the impact of the interaction between the smile index and district turnout, not only does the interaction term carry a statistically significant impact ( $\text{coefficient}=-0.002$
,
$\text{coefficient}=-0.002$
, $\mathit{SE}=0.0004$
), but so does the smile index itself. As we see from the data in the table, the impact of the smile index is positive (0.072) and significant.
$\mathit{SE}=0.0004$
), but so does the smile index itself. As we see from the data in the table, the impact of the smile index is positive (0.072) and significant.
In spite of this, results shown in Model 2 are those produced when turnout is zero. In other words, it is not realistic to assume there will be an electoral district in which no one votes. As a result, we needed to investigate more thoroughly the impact of a candidate’s smiling on his or her vote share as the level of turnout in a district election changes. This involves investigating marginal effects of different levels of turnout on the impact that smiles have on obtained vote shares. This involves a recentering method whereby we first compute the slope for the dependent variable, a candidate’s vote share, and our first main independent variable, that candidate’s score on the smile index. We next make these calculations as different values of the moderator variable of interest here, turnout. Specifically, we examine these marginal impacts at $+$
1 standard deviation (SD) and
$+$
1 standard deviation (SD) and $-$
1 standard deviation of the turnout variable. Proceeding this way allows us to interpret the coefficient for “smile” now being the slope of vote share on smile when turnout is equivalent to the mean of this variable plus and minus one standard deviation.
55
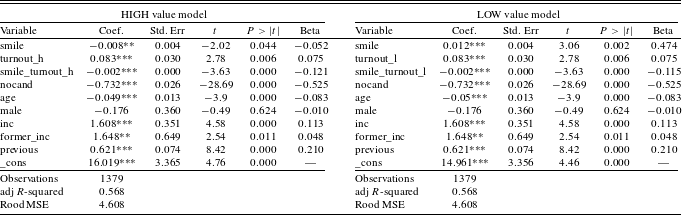
After completing this process, we estimated two equations in which the first model produced estimates of our variables when turnout took on a high value and the second equation when turnout was at a low value. Naturally, both models included the smile and turnout interaction term. We present the results of these estimations in Table 2.
$-$
1 standard deviation of the turnout variable. Proceeding this way allows us to interpret the coefficient for “smile” now being the slope of vote share on smile when turnout is equivalent to the mean of this variable plus and minus one standard deviation.
55
After completing this process, we estimated two equations in which the first model produced estimates of our variables when turnout took on a high value and the second equation when turnout was at a low value. Naturally, both models included the smile and turnout interaction term. We present the results of these estimations in Table 2.
From these two regression models, the coefficients for the impact of a candidate’s smile are 0.012 in the low-turnout model $(p<0.01)$
and
$(p<0.01)$
and $-$
0.008 in the high-turnout model
$-$
0.008 in the high-turnout model $(p<0.05)$
. These results confirm our expectations that there is a complicated relationship between the impact of a candidate smiling and the level of turnout in a district election. Specifically, the impact of smile is positive in high-value model, whereas it is negative in low-value model, and the impact of the interaction term is small and negative in both. The most important difference we observe is in the impact of a candidate’s smile in the low- versus the high-turnout models.
$(p<0.05)$
. These results confirm our expectations that there is a complicated relationship between the impact of a candidate smiling and the level of turnout in a district election. Specifically, the impact of smile is positive in high-value model, whereas it is negative in low-value model, and the impact of the interaction term is small and negative in both. The most important difference we observe is in the impact of a candidate’s smile in the low- versus the high-turnout models.
When turnout is low, smiling carries a positive impact on a candidate’s ability to gather votes. On the other hand, as turnout increases and crosses a certain threshold, the impact of a candidate’s smile not only decreases but at some point turns negative. Figure 4 reveals the level this threshold takes. When the turnout rate is low (around 30%), the impact of the smile index on vote share is positive and relatively large (around 0.02). The magnitude of this impact, however, gradually decreases as turnout rates increase to the point that the rate is 46%. This is the point at which the impact of the smile index on a candidate’s vote share is zero.
Marginal effect of smile index on vote share vis-à-vis turnout rates.

We also wanted to confirm this relationship with a graphic presentation between vote share, the smile index, and turnout rates by using both the constants, valued at 14.961 (low) and 16.019 (high), and the slopes to plot the regression lines holding the moderator variable (turnout) constant at its high (51%) and low (38%) values. These plots are captured in Figure 5, which reveals clearly the extent to which differences in turnout affected the impact that the smile index had on candidates’ vote shares. As expected, we see a positive and larger impact for the smile index (1.2 percentage points) on candidate’s vote share in election districts with lower turnout rates (38%), whereas we see “negative” and smaller impacts ( $-$
0.8 percentage points) in election districts with higher turnout rates (51%).
$-$
0.8 percentage points) in election districts with higher turnout rates (51%).
Estimated effect of smile index on vote share.

To further explore the impact of the number of competing candidates in an election contest (H3), we included an interaction term for smiling and the number of candidates (smile $\times$
nocand) in Model 3. The inclusion of this interaction term had a profound impact on our results in that the impact of a candidate smiling on vote share is different depending on the number of candidates competing in a local election contest. Specifically, when we add the interaction term between the smile index and the number of candidates, not only does the interaction term carry a statistically significant impact (
$\times$
nocand) in Model 3. The inclusion of this interaction term had a profound impact on our results in that the impact of a candidate smiling on vote share is different depending on the number of candidates competing in a local election contest. Specifically, when we add the interaction term between the smile index and the number of candidates, not only does the interaction term carry a statistically significant impact ( $\text{coefficient}=-0.002$
,
$\text{coefficient}=-0.002$
, $\mathit{SE}=0.001$
), but so does the smile index.
$\mathit{SE}=0.001$
), but so does the smile index.
The impact of the smile index itself is positive (0.025) and significant, but the results shown in Model 3 are like our previous results when the number of candidates is zero. This means that it is not realistic to assume that an election in a district will have no candidates, requiring us to investigate more thoroughly the impact of a candidate’s smiling on his or her vote share as the number of candidates in a district election changes. Using the method we used for the different rates of turnout we investigated earlier, we can compute the impact that different numbers of candidates will have on the impact of smiling on the vote shares candidates will receive in these district elections.
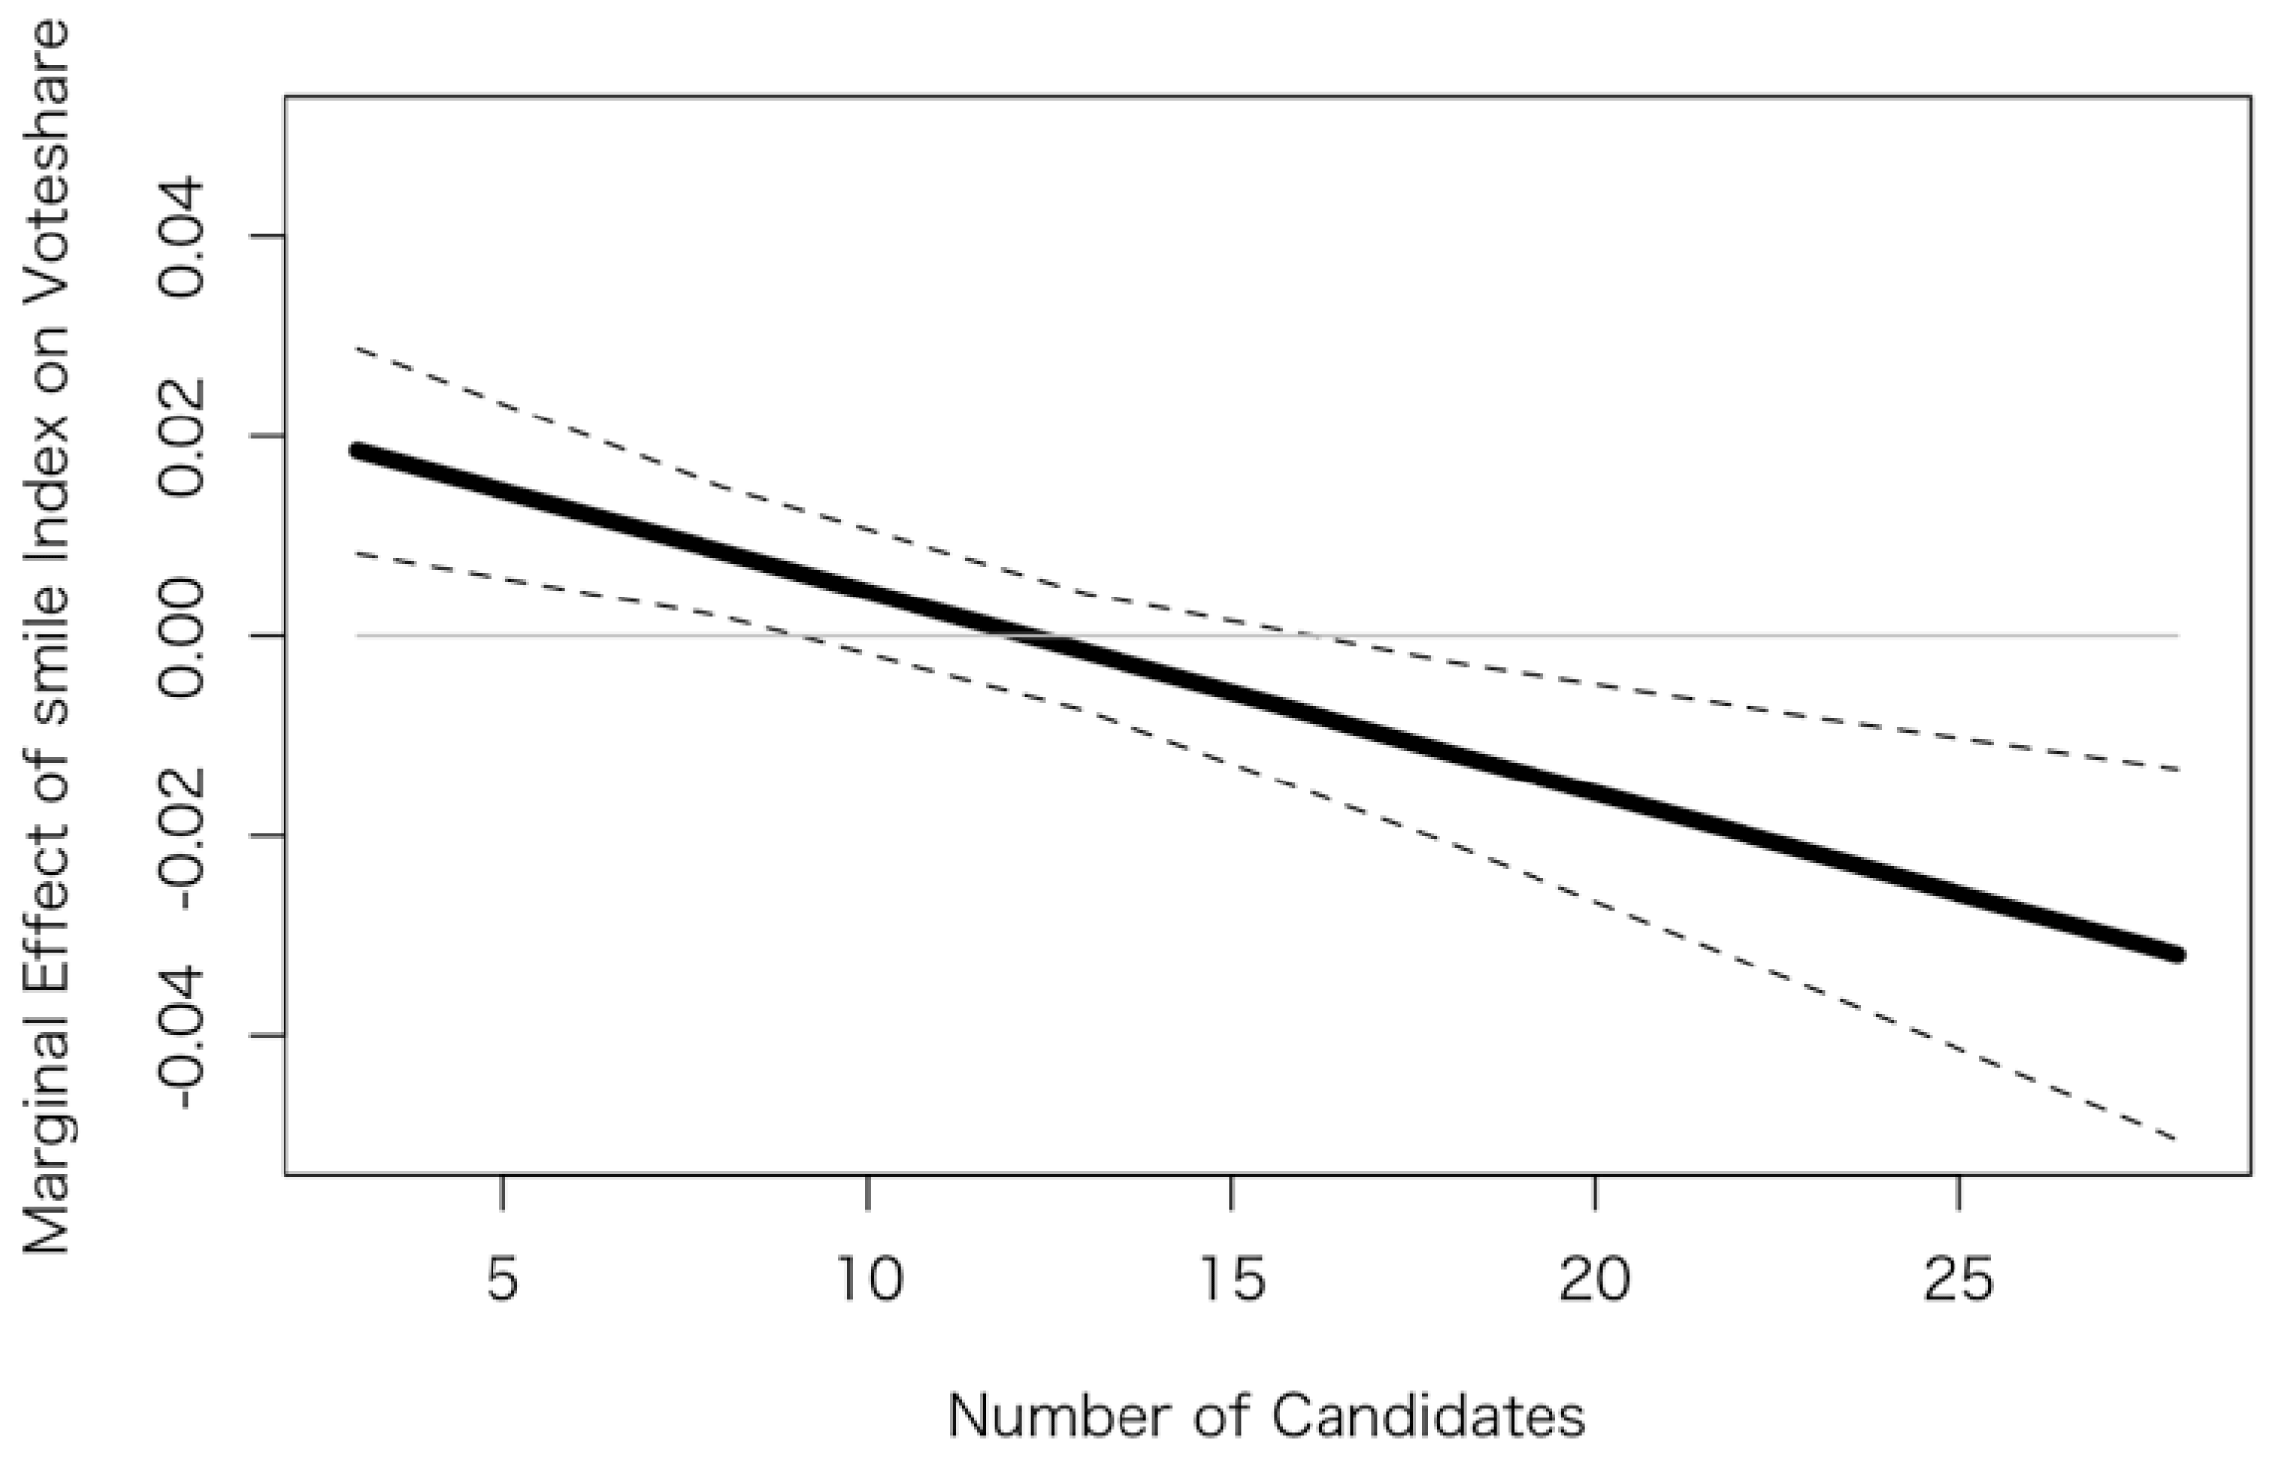
According to the data in Figure 6, when the number of candidates is small (5 or fewer), the impact of the smile index on vote share is positive and relatively large (a coefficient of 0.02). However, the magnitude of this impact gradually decreases as the number of candidates increases to the point of 12 and above, where the impact of smile index on vote share is zero. 56
Marginal effect of smile index on vote share vis-à-vis the number of candidates.
Based on these results, we can safely say that our analysis has produced several principal findings. We can conclude that H1 is supported, but in a more nuanced way than simply that candidates who smiled more in their campaign posters used in the official gazette for the 2015 local elections received higher vote shares than those who smiled less. Moreover, this was particularly true in the election districts where turnout rates were relatively low (lower than 46%). We also found that H2, the impact of a candidate’s smile on candidate support, declined as turnout rose and that a smile had a greater impact on the support levels candidates received when turnout levels were low but not when they were high.
We also confirmed H3 in that the number of competing candidates was negative, confirming the research conducted by the Dartmouth Group that voters respond more strongly to nonverbal displays as the number of competing candidates declines, clarifying the specific impacts of electoral competition. 57 Moreover, when we included an interaction term of the smile index and the number of competing candidates as in Model 3, the coefficient was significant and negative, while all other variables were relatively unchanged. This tells us that earlier research conducted by the Dartmouth Group that emotional reactions to nonverbal displays became stronger as the number of competitors declined was upheld in our analysis.
Finally, we wanted to explore in more detail just what difference a candidate smiling would make for the chances of that candidate being able to obtain a council seat. 58 In the 2015 Designated City Council Elections, given that the average difference between the votes obtained by the last winner and the first loser in each district is 2.8, an increase of even 1.2 percentage points for candidates is hardly negligible. 59 In fact, even such a small increase can be more consequential than this number would suggest, especially in competitive election districts. To make this point more clearly, we present in Figure 7 the vote share margins between the last winner and the first loser in the 150 district elections we examined in the 2015 Designated City Elections. We can see that in a majority of these 150 districts, the mean vote share margins obtained by the last winner and first loser in each district is 2.8 percentage points, and in 45% of the 150 districts we analyzed, candidates faced an average electoral margin of less than 1.6 percentage points. This is a strong indication that when conditions defined by the number of competitors and turnout rates are cooperative, candidates have a strong incentive to produce a full smile that they can then put on their election posters.
Vote share margins between the last winner and the fist loser.
National versus local elections in Japan and future research
While our analysis offered a general confirmation of previous results on smiling and electoral support, both generally and in Japanese elections specifically, it also raised some interesting questions that deserve further investigation. One such question concerns the difference in the size of the impact associated with a candidate smiling in national elections versus the local elections we examined. Using the Japan’s lower house election results in 2000, Horiuchi, Komatsu, and Nakaya found that a candidate with full smile (smile index $=$
100%) as compared with a candidate with no smile (smile index
$=$
100%) as compared with a candidate with no smile (smile index $=$
0%) increased his or her vote share by 2.3 percentage points. Our results found that a candidate with a full smile compared with a candidate with no smile at all would boost his or her vote share by 1.2 percentage points in an electoral district with a lower turnout rate (38%) and by 0.08 percentage points in an electoral district with a higher turnout rate (51%). This difference is obviously attributable to the fact that Horiuchi, Komatsu, and Nakaya’s results were from an investigation of the single-member district portion of lower house elections compared with our review of local contests that involved many more candidates on average.
$=$
0%) increased his or her vote share by 2.3 percentage points. Our results found that a candidate with a full smile compared with a candidate with no smile at all would boost his or her vote share by 1.2 percentage points in an electoral district with a lower turnout rate (38%) and by 0.08 percentage points in an electoral district with a higher turnout rate (51%). This difference is obviously attributable to the fact that Horiuchi, Komatsu, and Nakaya’s results were from an investigation of the single-member district portion of lower house elections compared with our review of local contests that involved many more candidates on average.
Moreover, we must also recall that we designed our research to tease out the more nuanced relationship that exists between turnout and the number of competing candidates and the impact of smiling on electoral support. While our results did offer more insight into these relationships, we recognize that there are other factors that may account for this differential impact. As suggested earlier, part of the answer to this puzzle may rest with the difference in electoral systems between Japan’s lower house and the Designated City Council Elections we examined here. Again, Horiuchi, Komatsu, and Nakaya used data on the lower house’s 300 single-member districts, which produced only one winner per district, while we used the data on 150 single non-transferable vote districts, which involved multiple winners. These two types of electoral districts differ in terms of the district size in area, the number of eligible voters, turnout rates, and variance in the number of competing voters seeking district seats.
The average number of candidates running in each electoral district in Japan’s Designated City Council Election in 2015 was 11, ranging from 3 to 29. 60 The average number of candidates running in each single-member district in the 2000 House of Representative election in Japan was only 4, ranging from 2 to 7. As our results have made clear, the number of candidates matters, which means that facing so many candidates for whom a voter could enter a single choice, the voter in a Designated City Council Election could simply be indifferent in selecting one out of many. Similarly, it may also be that voters downplay the importance of local elections compared with national elections, which leads them to be indifferent in casting a ballot. To test the extent to which these institutional factors account for the differential impact identified here, we will need to conduct comparative analysis on national and local-level elections using the same statistical methodology.
Second, it may be that there is measurement error in generating a score on the smile index for each candidate. Although the OKAO Vision software was used in our analysis as well as that conducted by Horiuchi, Komatsu, and Nakaya, the versions of the software were different in the two studies, which may have led to measurement error. The software used in the Horiuchi, Komatsu, and Nakaya analysis showed only one “smile index,” whereas we employed a more advanced version of the software in our analysis, which provided the “most appropriate score” out of the five facial types we noted earlier. 61 Although we only needed the happiness score, the latest OKAO Vision software we used did not necessarily show the degree of happiness. Sometimes it produced a happiness score, but at other times, it produced an anger score. In cases where the OKAO Vision did not provide happiness score, we followed the suggestion from the technical support of Omron and coded the particular candidate’s smile index as 0%. If we had used the same version of OKAO Vision Horiuchi, Komatsu, and Nakaya used, then we might have had stronger results. 62
Finally, the differences in results between national and local elections in Japan also rests with the complicated relationship that exists between turnout levels and the number of competing candidates with the impact of a candidate’s smile on the level of support he or she receives. To investigate these relationships further, we would need to extend the comparative analysis referred to earlier in a couple of ways. First, we need to add additional variables to the aggregate data we used for our analysis to see how their inclusion affects the relationships we examined with respect to smiling and candidate support. 63 We know that, in Japan, rural districts tend to have higher levels of turnout than urban districts, and the same is true for district elections that are more as opposed to less competitive. Adding these measures to an analysis of both local and national elections will add substantive information to the results presented here, allowing for a more developed explanation.
Such an extended analysis will certainly help us better understand the institutional variations that exist with respect to the impact of smiling on candidates’ support levels, but it will also provide a basis on which more substantive questions can be addressed. 64 For example, adding a measure to help us distinguish district elections based on how competitive they are will help us investigate more thoroughly if the decline in the impact of smiling as the number of candidates increases indicates that candidates are more apt to fight the competition when facing a large number of competitors and more likely to rally the troops as the number of competitors declines. Our hope is that the results presented here offer a basis on which these and other interesting questions can be explored.
Acknowledgements
We would like to thank Fumiya Nakayama, Riona Sakuma, Risa Taira, Tatsuya Taniguchi, and Mizuha Yamamoto for their outstanding research assistance.
Appendix. Descriptive statistics on variables used in our analysis
Variables in the analysis and descriptive statistics.