The role of PUFA and n-3 has been pointed out during pre- and postnatal development and growth(Reference Riediger, Othman and Suh1,Reference Bourre2) . But their main role in the prevention of cardiovascular and inflammatory pathologies, certain cancers and neurodegenerative diseases has been widely described in recent years(Reference De Lorgeril3–Reference Astorg9). This is particularly the case for n-3 long chain (LC) PUFA, that is, EPA (20:5 n-3), docosapentaenoic acid (22:5 n-3) and DHA (22:6 n-3). Indeed, n-3 LC-PUFA are components of phospholipid (PL) membranes(Reference Carughi, Huynh and Perelman10), wherein they increase membrane fluidity(Reference Riediger, Othman and Suh1,Reference Bourre2) , regulate gene expression and are lipid mediator precursor, namely the eicosanoids and docosanoids(Reference Serhan, Lu and Hong11,Reference Yang, Chiang and Oh12) . Otherwise, these bioactive molecules possess pivotal roles in physiological and pathophysiological processes. Indeed, they play a role in haemodynamics and inflammation with both anti-inflammatory and protective properties(Reference Serhan, Lu and Hong11–Reference Harayama and Shimizu15). The n-3 LC-PUFA are provided by seafood and can be synthetised from their precursor, the α-linolenic acid (ALA; 18:3 n-3). ALA offers also specific health benefits because it is associated with decreased cardiovascular risk through various biological mechanisms, including platelet function, inflammation, endothelial cell function, arterial compliance and arrhythmia(Reference De Lorgeril3,Reference Rose16–Reference Bemelmans, Broer and Feskens19) . More recently, ALA has been showed to be metabolised in dihydroxylated compounds by lipoxygenases(Reference Liu, Chen and Véricel20). This fatty acid cannot be synthesised by mammals so it must be provided by the diet. However, the global intake of n-3 PUFA is insufficient in the Western diet(Reference Combe and Boué-Vaysse21–Reference Sioen, van Lieshout and Eilander24), notably the average intakes for adult population are twice lower than the recommended dietary intake(Reference Combe and Boué-Vaysse21,25) . This insufficiency directly affects the ALA bioavailability and its bioconversion in n-3 LC-PUFA(Reference Combe and Boué-Vaysse21–Reference Sioen, van Lieshout and Eilander24,Reference Couëdelo, Termon and Vaysse26) . Therefore, the consumption of food products rich in ALA is indispensable, and increase in the ALA intake represents a major nutritional challenge to cover the physiological needs in n-3 PUFA(Reference Combe and Boué-Vaysse21,Reference Astorg27,Reference Mazurier, Rigourd and Perez28) . Thus, the French recommended dietary intake advises a daily intake of at least 1 g of ALA and 500 mg of EPA + DHA for adults(29). In a context where the dietary intake of ALA is easier than that of n-3 LC-PUFA, it is imperative to improve the consumption of ALA source products such as rapeseed, flax and walnut oils, and green leaves.
Several studies have pointed out the potential to increase ALA bioavailability through the consumption of linolenic oils in human and animals(Reference Cunnane, Ganguli and Menard30–Reference Harper, Edwards and DeFilipis38). Interestingly, a direct correlation has been observed in animal between dietary ALA intake and its bioavailability(Reference Morise, Mourot and Riottot33). Also, growing doses of linolenic oils or increased ALA levels seems to enhance its bioconversion in EPA, but not in DHA in plasma and erythrocytes(Reference Morise, Combe and Boué32,Reference Morise, Mourot and Riottot33,Reference Chan, McDonald and Gerrard37) . Moreover, some studies demonstrated that a diet providing only ALA as n-3 source showed an appropriate DHA level in brain(Reference Domenichiello, Kitson and Bazinet39,Reference Domenichiello, Chen and Trepanier40) . However, most of the studies are related to n-3 deficient diets that may have an impact on the desaturation activities of ALA into LC-PUFA, making the data biased and needing to be completed(Reference Arterburn, Hall and Oken41).
It should be noted that ALA is an excellent substrate for mitochondrial β-oxidation(Reference Arterburn, Hall and Oken41,Reference Burdge42) , and only a small proportion of ALA would be converted into EPA (8–21 %) and DHA (0·05–9 %) in human(Reference Burdge, Finnegan and Minihane18,Reference Liu, Chen and Véricel20–22) . The reason is that the bioconversion enzymatic pathway, notably the key enzyme delta 6 desaturase, is common between ALA and LA, the n-6 precursor, thus competing with n-3 series(Reference Arterburn, Hall and Oken41,Reference Nakamura and Nara43–Reference Portolesi, Powell and Gibson46) . Therefore, LA and ALA must be consumed with a certain balance, which according to the recommended dietary intake should be 5(22,Reference Mazurier, Rigourd and Perez28,29) .
In a current context where lipid intake is sufficient and should not be increased, so many questions remain unanswered about the ALA impact, not only in terms of increase in doses but also in terms of proportion in dietary lipids, with regard to its bioavailability. To date, data are unconsensual with regard to the impact of optimal level of dietary ALA on its metabolic fate, considering its capacity to be bioconverted into n-3 LC-PUFA. Furthermore, assuming an optimal bioconversion of ALA, the fact remains that n-3 LC-PUFA are sensitive to lipid peroxidation (LPO). So a high incorporation of n-3 LC-PUFA into plasma and/or tissue lipids due to ALA bioconversion may undesirably affect tissues by enhancing susceptibility of membranes to LPO and by disrupting the antioxidant system(Reference Pignitter, Lindenmeier and Andersen47). Indeed, n-3 LC-PUFA have been demonstrated to be pro-oxidant, but it has been noticed that experimental study diets are often hyperlipidic(Reference Ando, Nagata and Yoshida48–Reference Song and Miyazawa50). In this way, supplementation studies have also taken into account the impact of enhancing ALA bioconversion on LPO and consequently on oxidative stress to limit changing fluidity, inactivating receptors or enzymes which can induce cell damages(Reference Harayama and Shimizu15,Reference Ando, Nagata and Yoshida48) .
Nowadays, data on ALA are scarce and those related to the optimal ALA intake necessary to improve both its bioavailability and bioconversion are not categorical, depending on the model studied. In addition, information on the duration of supplementation required to improve these parameters is, to our knowledge, not recorded. In this context, this study was conducted to specify in rat model the suitable level of ALA in a balanced diet to enhance its bioavailability and to maximise its bioconversion in n-3 LC-PUFA, for nutritional needs and health perspectives. In addition, we enlarge data by determining the right time frame for ALA supplementation without generating lipid oxidation and/or oxidative stress during a 60-d kinetics.
Materials and methods
Animals
Animal experiments were performed using male Wistar rats (Elevage Janvier) that were 8 weeks old and weighed 300–350 g. Animals were treated in accordance with the European Communities Council Guidelines for the Care and Use of Laboratory Animals (2010/63/EU). All experiments were conformed to the Guidelines for the Handling and Training of Laboratory Animals. The experiments and procedures were approved by the French ministry, recorded under the APAFIS n° 2017031014448864 and were carried out in compliance with the local ethics committee in Bordeaux, France (CEEA50).
Experimental diets
The experimental lipid formulations used for the diets were obtained by blending several oils, kindly obtained by ITERG: nut, rapeseed, oleic sunflower, flax, peanut, grape seed, sunflower and soyabean oils.
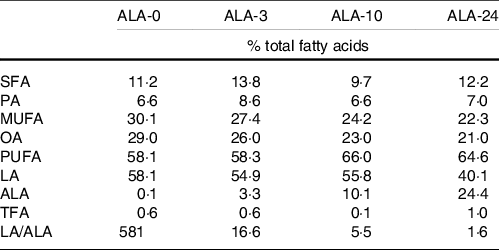
Four lipid formulas were obtained by mixing several vegetable oils in different ratio (soyabean, nuts, flaxseed, perilla, rapeseed, camelina, olive, oleic sunflower, sunflower, borage, grapeseed, palm, copra and peanut oils), to obtain four-blended oils with increased levels in ALA (Table 1). Lipid formulas were mixed to a fat-free diet (Safe) composed of glucose (625 g/kg), casein (225 g/kg), cellulose (60 g/kg), Vitamin (PV 200) and protein (PM 205B) mix (10 g/kg) and cholesterol (10 g/kg) and adjusted to 5 % of the total energy intake, for the maintenance period(51). Experimental diets were designed so that ALA was the main fatty acid whose proportions were increased in the experimental groups (Table 1). The contribution of ALA in the diet lipids varied from 0 % (ALA-0 diet) to 24 % (ALA-24 diet), which corresponds to 0, 0·3, 1 and 2·5 % total energy intake. As a consequence, the LA/ALA ratio varied from 1·6 to 581. The ALA intake was determined according to previous laboratory studies, literature data and according to the feasibility of lipid formulations(Reference Couëdelo, Termon and Vaysse26,Reference Morise, Combe and Boué32,Reference Morise, Mourot and Riottot33,51,Reference Couëdelo, Boué-Vaysse and Fonseca52) .
Fatty acid composition of the four experimental diets supplied to rats

LA, linoleic acid; ALA, α-linolenic acid; PA, palmitic acid; OA, oleic acid; TFA, trans-fatty acids (18:1 trans, 18:2 tt, 18:2 9c13t, 18:2 ct, 18:2 tc, 18:3 trans).
The fatty acid composition of the diets was assessed by gas chromatography (GC) as described in the next section.
As oils are sources at different concentrations of α-tocopherol, its level in the formulations was adjusted so that the α-tocopherol concentration represented 600 mg/l lipid formulation.
Experimental design
During 15 d prior to the experiment, rats were housed 4 per cage and kept in a temperature- and humidity-controlled environment, with a 12-h light-dark cycle. Rats were fed an ALA-deprived diet (ALA-0 diet) with free access to food and water. After acclimatisation, eight rats were killed for the baseline and the other ninety-six rats were randomly assigned to one of the four dietary groups (ALA-0, ALA-3, ALA-10 or ALA-24) over an 8-week kinetics (n 8 rats/group/time). Rats had a theoretically daily intake of ALA of 0, 45, 150 and 360 mg in the groups providing ALA-0, ALA-3, ALA-10 and ALA-24, respectively, and calculated on the basis of the % ALA in the diet lipids and related to the 1·5 g lipids consumed per day per rat.
For each interval period (Day-0, Day-15, Day-30 and Day-60), eight rats were fasted overnight, weighed and euthanised by intraperitoneal injection of sodium pentobarbital and lidocaine (Ceva) at a dose of 200 mg and 20 mg/kg of body weight, respectively. Blood was immediately recovered and plasma was separated from erythrocytes by centrifugation (20 min, 4°C, 1700 × g). Erythrocytes were then washed with physiological salt solution and all samples (plasma and erythrocytes) stored at –80°C until analysis. All animals were weighed weekly and did not show any significant difference after 60 d of experimental diets (462·2 (sd 35·3) g).
Lipid extraction from blood and tissue
Total lipids from the plasma and erythrocytes were extracted according to the procedure described by Folch et al. (Reference Folch, Lees and Sloane Stanley53). The extraction was performed in chloroform/methanol (2/1, v/v) under stirring, at room temperature. After 1 h, 0·2 volume of KCl (0·8 % in water, w/v) per volume of the extraction mixture was added, and the samples were centrifuged (1050 g , 5 min, 4°C) to separate the chloroform and hydroalcoholic phases. The aqueous phase was removed, and the chloroform phase containing the total lipids was filtered with chloroform/methanol (2/1, v/v) and evaporated under vacuum with a rotary evaporator. The extracts were then re-dissolved in chloroform, filtered and then dried under N. Extracted lipids were dissolved in chloroform/methanol (2/1, v/v) and stored at –20°C until analysis.
Separation of lipid fractions by TLC
PL, NEFA, TAG and cholesterol ester (CE) fractions from plasma were separated by TLC (glass plates 20 × 20 cm pre-coated with silica gel 60H) using a solvent mixture composed of hexane/diethyl ether/acetic acid (80/20/1, v/v/v). After vaporisation of 2,7-dichlorofluorescein and visualisation under UV-light, spots corresponding to PL, NEFA, TAG and CE were identified by external standards spotted on the plate and extracted from silica gel by addition of 2·5 ml of chloroform/methanol (2/1, v/v). After homogenisation and centrifugation of the scrapped fractions (1050 g, 5 min, 20°C), the organic phase was collected. A 100 µl distilled water volume and chloroform/methanol (2/1, v/v, 2 ml) were added to the silica gel phase. The extraction step was repeated and the organic phase was collected. Lipid extraction from silica gel ended by the addition of 2 ml of methanol to the silica gel phase, homogenisation and centrifugation. The organic phases were collected and dried under N. Finally, 2,7-dichlorofluorescein was removed using 0·4 ml of a KCl solution (0·8 % in distilled water w/v) and 2 ml of chloroform/methanol (2/1, v/v). The organic phase was washed twice by addition of 0·8 ml of a mixture composed of chloroform/methanol/KCL 0·8 % in distilled water (15/240/235, v/v/v). Samples were stored at −20°C until analysis.
Fatty acid profile from blood and lipid fractions
Total fatty acid composition from plasma was directly obtained by the method described by Lepage and Roy(Reference Lepage and Roy54). The FA profile from erythrocytes, plasma and lipid fractions from plasma (PL, NEFA, TAG and CE) were obtained after (trans) methylation procedure of FA adapted from Castro-Gomez(Reference Castro-Gómez, Fontecha and Rodríguez-Alcalá55,Reference Sehl, Couëdelo and Fonseca56) .
The resulting fatty acid methyl esters were analysed by GC (TRACE GC, Thermo Scientific) equipped with a flame ionisation detector and a split injector. A fused-silica capillary column (BPX 70, 60 m × 0·25 mm i.d., 0·25 μm film; SGE) was used with H as a carrier gas (inlet pressure: 120 kPa). The split ratio was 1:33. The column temperature programme was as follows: from 160°C, the temperature increased to 180°C at 1·3°C/min, and maintained for 65 min before increasing at 25°C/min until 230°C for 15 min. The injector and detector were maintained at 250°C and 280°C, respectively. GC peaks were integrated using Chromquest software (Thermo Finnigan). FA were quantified using an internal standard added at 10 % of the lipid weight before the (trans) methylation procedure. TAG 17:0 and PC 17:0 were used for TAG and PL quantification, respectively. As the TAG and PL concentrations were similar in all the experimental groups (0·43 (sd 0·05 and 0·49 (sd 0·09) mg/ml, respectively), the fatty acid profiles of the lipid fractions are presented as mol% of total fatty acid.
Lipid peroxidation and markers of oxidative stress
Oxidative stress was determined by the quantification of nitric oxide (NO) and antioxidant enzyme activities in rat plasma. The NO concentration was determined at Day-15 and Day-60 after experimental diets in all groups, using the NO kit as following the manufacturer instructions (CliniSciences). Results were expressed in plasma as NO concentration (µM).
Enzyme activities, catalase, superoxide dismutase and glutathione peroxidase were determined in the liver using their specific kits (Arbor Assays and Cayman Chemicals), following the manufacturer instructions. The enzyme activities were determined in all experimental groups (n 8 rats/group) at Day-60 following the experimental diets. Data were expressed as U/mg of liver protein.
Protein contents were determined in the liver using the Bradford procedure(Reference Bradford57). Briefly, liver was homogeneously prepared in cold buffer saline (1/1; w/v, respectively). 30 µl of homogenate from each sample was dispatched in a 96-well plate in duplicate and 170 µl of Bradford reagent added to each well. Optical density (OD) was read at 595 nm in a microplate reader (HTX Synergy, Biotek Agilent). Results were obtained by comparison with bovine serum albumin scale dots and expressed as mg protein/ml liver homogenate.
Determination of α-tocopherol levels in plasma
The content of α-tocopherol was determined by HPLC coupled with a fluorescence detection, according to the French regulation (NF ISO 20633) with slight modifications for plasma matrix. Briefly, 100 µl of plasma was mixed with 60 µl of butylated hydroxytoluene (5 mM in absolute ethanol), 500 µl of tert-Butyl methyl ether and 500 µl of sodium methoxide (5 % in MeOH). After 3 min stirring, 500 µl of hexane and 1 ml of a stop solution (0·4 M sodium hydrogenocitrate sesquihydrate in 2·6 M NaCl in distilled water) were added. The upper phase containing the α-tocopherol was removed after a centrifugation (1800 rpm/min; 4°C; 5 min). The extraction was repeated twice with 500 µl hexane and 500 µl distilled water was added to the pooled upper phases. The supernatant was dried under N and suspended in 100 µl heptane. All the experimental steps were conducted out of light.
Samples were directly injected (10 µl) on a Silica Kromasil 100–5-sil column (5·0 µm, 100 Å, 250 × 4·6 mm) using a Thermo system chromatograph (Thermo Scientific). The column temperature and the sampler temperature were both fixed at 20°C and the fluorescent detector fixed at 40°C. α-tocopherol was detected using an excitation wavelength of λ = 295 nm and an emission wavelength of λ = 330 nm at medium sensitivity and gain 3, for a total run of 10·0 min. The chromatography was carried out using an isocratic elution in a mixed solvent (99;1/heptane; isopropanol, respectively). The constant flow rat kept constant (2·0 ml/min). Data were acquired by Chromeleon software (Thermo Scientific). α-tocopherol levels were quantified in plasma samples on the base of peak area. Data were expressed by comparison with an external standard curve of stock solutions α-tocopherol (0·2 mg/ml in ethanol).
Chemicals
α-tocopherol, Bradford reagent, bovine serum albumin, butylated hydroxytoluene, 2,7-dichlorofluorescein, sodium hydrogenocitrate sesquihydrate, sodium methoxide and tert-Butyl methyl ether were supplied from Sigma-Aldrich.
Acetyl chloride, acetic acid, sodium chloride (NaCl), potassium chloride (KCl) and sodium carbonate (Na2CO3) were provided by Thermo Fisher Scientific (Strasbourg). They also supplied the organic solvents such as acetonitrile, di-ethyl ether, ethanol, heptane, hexane and methanol (analytical or HPLC grades). Internal standards, 1,2-diheptadecanoyl-sn-glycero-3-phosphatidylcholine (PC 17:0), 1,2,3-triheptadecanoyl-sn-glycerol (TAG 17:0), heptadecanoic acid (NEFA 17:0) and cholesteryl ester heptadecanoate (CE 17:0) were obtained from Avanti Polar Lipids INC (Alabaster). Pentobarbital sodium (Exagon) and lidocaine (Xylovet) were provided by Ceva
Statistical analysis and justification of sample size
The Harvard University (USA) software (http://hedwig.mgh.harvard.edu/sample_size/size.html) was used to determine sample size. The sample size was calculated using input parameters as follows: α error probability of 0·05, power probability of 0·8 and 1·3 % difference between the means. As a result, a total of sample size of eight rats per group was obtained.
Results were expressed as mean values and standard deviations. Data were analysed by a two-way ANOVA (with the two factors being: ALA intake and time duration of the diet) and followed by a post-hoc Tukey’s test to evaluate the influence of the different proportion of ALA in the diet lipids (i) on its bioavailability in plasma, (ii) its bioconversion in LC-PUFA and (iii) on the markers of oxidative stress in plasma throughout the 8-week kinetics’ period. Only the above tests with significance at the P < 0·05 level were judged to be significant. Normality was checked by Shapiro–Wilk’s test (P > 0·05). The predictive quality of a linear correlation was monitored by Pearson’s linear coefficient of determination (R 2) to determine the impact of ALA intake and n-3 PUFA levels in plasma and erythrocyte.
Results
Impact of the dietary α-linolenic acid intake on the n-3 PUFA enrichment in the bloodstream
Kinetics of plasma enrichment in α-linolenic acid as a function of α-linolenic acid dietary intake
Data on the kinetics of plasma incorporation of ALA as a function of dietary intake are showed in Fig. 1. Moreover, the correlation between dietary intake of ALA and plasma levels according to the time duration of the diet (15, 30, or 60 d) is presented in Fig. 1.
Kinetics of ALA incorporation in plasma as a function of ALA dietary intake (mole% of total FA). The experimental diets provide increased proportions of ALA in the diet lipids: ALA-0 (![]() ), ALA-3 (
), ALA-3 (![]() ), ALA-10 (
), ALA-10 (![]() ) and ALA2-24 (
) and ALA2-24 (![]() ); 0, 3, 10, and 24 % ALA, respectively (n 8 rats/group). Means marked with different letters are significantly different (P < 0·05); two-way ANOVA followed by Tukey’s honestly significant difference (HSD) test. Linear correlation between plasma proportion of ALA as a function of dietary ALA intake after 15 (
); 0, 3, 10, and 24 % ALA, respectively (n 8 rats/group). Means marked with different letters are significantly different (P < 0·05); two-way ANOVA followed by Tukey’s honestly significant difference (HSD) test. Linear correlation between plasma proportion of ALA as a function of dietary ALA intake after 15 (![]() ), 30 (
), 30 (![]() ) and 60 (
) and 60 (![]() ) d of experimental diet (n rats/group). ALA, α-linolenic acid.
) d of experimental diet (n rats/group). ALA, α-linolenic acid.

When the diet was ALA free (ALA-0 group), the plasma levels of ALA average 0·6 % of total fatty acids, indicating a low endogenous level in ALA (Fig. 1).
As soon as the diets contained ALA (ALA-3, ALA-10 or ALA-24), the plasma levels in ALA increased over 15 d to be then stabilised after 30 d of experimental diets.
Compared with the ALA-0 group, the plasma levels of ALA were enhanced by a factor of 5 (ALA-3 diet), 10 (ALA-10 diet) and 60 (ALA-24 diet) at the end of the experimental diets. Thus, the highest the ALA content in the diet, the highest the ALA levels in the plasma (P < 0·05).
These initial findings are supported by the data in Fig. 1, which demonstrated that the ALA levels in the plasma are linearly correlated with the dietary intake of ALA (R² 0·99), regardless the time duration of the diet. In addition, the plasma enrichment is effective as early as 15 d of diet. A 30-d diet with more than 24 % ALA allowed the maximum ALA enrichment in the plasma.
Kinetics of plasma enrichment of n-3 long chain PUFA as a function of α-linolenic acid dietary intake
The impact of the dietary enrichment of ALA on its ability to be bioconverted into higher n-3 derivatives has been determined by following EPA (Fig. 2) and DHA (Fig. 3) levels in the plasma.
Kinetics of EPA incorporation in the plasma as a function of ALA dietary intake. The experimental diets provide increased proportions of ALA in the diet lipids: ALA-0 (![]() ), ALA-3 (
), ALA-3 (![]() ), ALA-10 (
), ALA-10 (![]() ) and ALA2-24 (
) and ALA2-24 (![]() ); 0, 3, 10, and 24 % ALA, respectively (n 8 rats/group). Means marked with different letters are significantly different (P < 0·05); two-way ANOVA followed by a Tukey’s honestly significant difference (HSD) test. Linear correlation between plasma proportion of EPA as a function of dietary ALA intake after 15 (
); 0, 3, 10, and 24 % ALA, respectively (n 8 rats/group). Means marked with different letters are significantly different (P < 0·05); two-way ANOVA followed by a Tukey’s honestly significant difference (HSD) test. Linear correlation between plasma proportion of EPA as a function of dietary ALA intake after 15 (![]() ), 30 (
), 30 (![]() ) and 60 (
) and 60 (![]() ) d of experimental diet (n 8 rats/group). ALA, α-linolenic acid.
) d of experimental diet (n 8 rats/group). ALA, α-linolenic acid.

Kinetics of DHA incorporation in the plasma as a function of ALA dietary intake. The experimental diets provide increased proportions of ALA in the diet lipids: ALA-0 (![]() ), ALA-3 (
), ALA-3 (![]() ), ALA-10 (
), ALA-10 (![]() ) and ALA2-24 (
) and ALA2-24 (![]() ); 0, 3, 10, and 24 % ALA, respectively (n 8 rats/group). Means marked with different letters are significantly different (P < 0·05); two-way ANOVA followed by a Tukey’s honestly significant difference (HSD) test. Linear correlation between plasma proportion of DHA as a function of dietary ALA intake after 15 (
); 0, 3, 10, and 24 % ALA, respectively (n 8 rats/group). Means marked with different letters are significantly different (P < 0·05); two-way ANOVA followed by a Tukey’s honestly significant difference (HSD) test. Linear correlation between plasma proportion of DHA as a function of dietary ALA intake after 15 (![]() ), 30 (
), 30 (![]() ) and 60 (
) and 60 (![]() ) d of experimental diet (n 8 rats/group). ALA, α-linolenic acid.
) d of experimental diet (n 8 rats/group). ALA, α-linolenic acid.

Plasma levels of EPA represented 0·05 % of total FA in rats submitted to the ALA-0 diet, that is, deprived in ALA. The addition of ALA in the diet (3, 10 or 24 % of total fatty acids) improved the EPA levels in the plasma as early as 15 d of diet (ALA-3, ALA-10, ALA-24; factor of 3, 8 and 26, respectively).
In addition, the greater the dietary intake of ALA, the more significant the EPA level in the plasma. Indeed, the analysis of the linear correlation (Fig. 2) showed a linear correlation (R² 0·98) between the dietary intake of ALA and the plasma levels in EPA, independent of the time duration of the diet. Data indicated the metabolic changes induced by the addition of ALA in the diet.
From EPA, ALA can be then bioconverted into DHA.
The kinetics of DHA incorporation in the plasma over a 60-d period showed that an n-3 PUFA-deprived diet (ALA-0) induced a collapse of the plasma DHA levels. The DHA levels decreased by 75 % in the plasma over 60 d following an ALA-deprived diet.
However, the addition of ALA in the diet allowed the recovery of the initial DHA levels in the plasma after 60 d, even for a low ALA intake (ALA-3). Moreover, for higher ALA intakes (>10 % in dietary lipids), the DHA levels were maintained over the diet period, or even increased in the ALA-24 group after 60 d (+15 %). In our conditions, the more the time duration of the diet, the greater the DHA levels.
The analysis of the relationship between the dietary ALA and the plasma DHA levels (Fig. 3) showed a correlation that became saturated after 15 d, whatever the ALA proportion in the diet lipid. From 10 % ALA in the diet lipids, the ALA bioconversion in DHA seems to be limited.
Erythrocyte enrichment of α-linolenic acid as a function of α-linolenic acid dietary intake and time duration
The n-3 PUFA incorporation was followed in the erythrocytes, for ALA (Fig. 4) and its higher derivatives (Figs 5 and 6) as a function of ALA dietary intake.
Kinetics of ALA uptake in erythrocytes as a function of dietary intake of ALA. The experimental diets provided increased proportions of ALA in the diet lipids: ALA-0 (![]() ), ALA-3 (
), ALA-3 (![]() ), ALA-10 (
), ALA-10 (![]() ) and ALA2–24 (
) and ALA2–24 (![]() ); 0, 3, 10, and 24 % ALA, respectively (n 8 rats/group). Means marked with different letters are significantly different (P < 0·05); two-way ANOVA followed by a Tukey’s honestly significant difference (HSD) test. Linear correlation between erythrocyte proportion of ALA as a function of dietary ALA intake after 15 (
); 0, 3, 10, and 24 % ALA, respectively (n 8 rats/group). Means marked with different letters are significantly different (P < 0·05); two-way ANOVA followed by a Tukey’s honestly significant difference (HSD) test. Linear correlation between erythrocyte proportion of ALA as a function of dietary ALA intake after 15 (![]() ), 30 (
), 30 (![]() ) and 60 (
) and 60 (![]() ) d of experimental diet (n 8 rats/group). ALA, α-linolenic acid.
) d of experimental diet (n 8 rats/group). ALA, α-linolenic acid.

Kinetics of EPA uptake in erythrocytes as a function of dietary intake of ALA. The experimental diets provide increased proportions of ALA in the diet lipids: ALA-0 (![]() ), ALA-3 (
), ALA-3 (![]() ), ALA-10 (
), ALA-10 (![]() ) and ALA2–24 (
) and ALA2–24 (![]() ); 0, 3, 10, and 24 % ALA, respectively (n 8 rats/group). Means marked with different letters are significantly different (P < 0·05); two-way ANOVA followed by a Tukey’s honestly significant difference (HSD) test. Linear correlation between erythrocyte proportion of EPA as a function of dietary ALA intake after 15 (
); 0, 3, 10, and 24 % ALA, respectively (n 8 rats/group). Means marked with different letters are significantly different (P < 0·05); two-way ANOVA followed by a Tukey’s honestly significant difference (HSD) test. Linear correlation between erythrocyte proportion of EPA as a function of dietary ALA intake after 15 (![]() ), 30 (
), 30 (![]() ) and 60 (
) and 60 (![]() ) d of experimental diet (n 8 rats/group). ALA, α-linolenic acid.
) d of experimental diet (n 8 rats/group). ALA, α-linolenic acid.

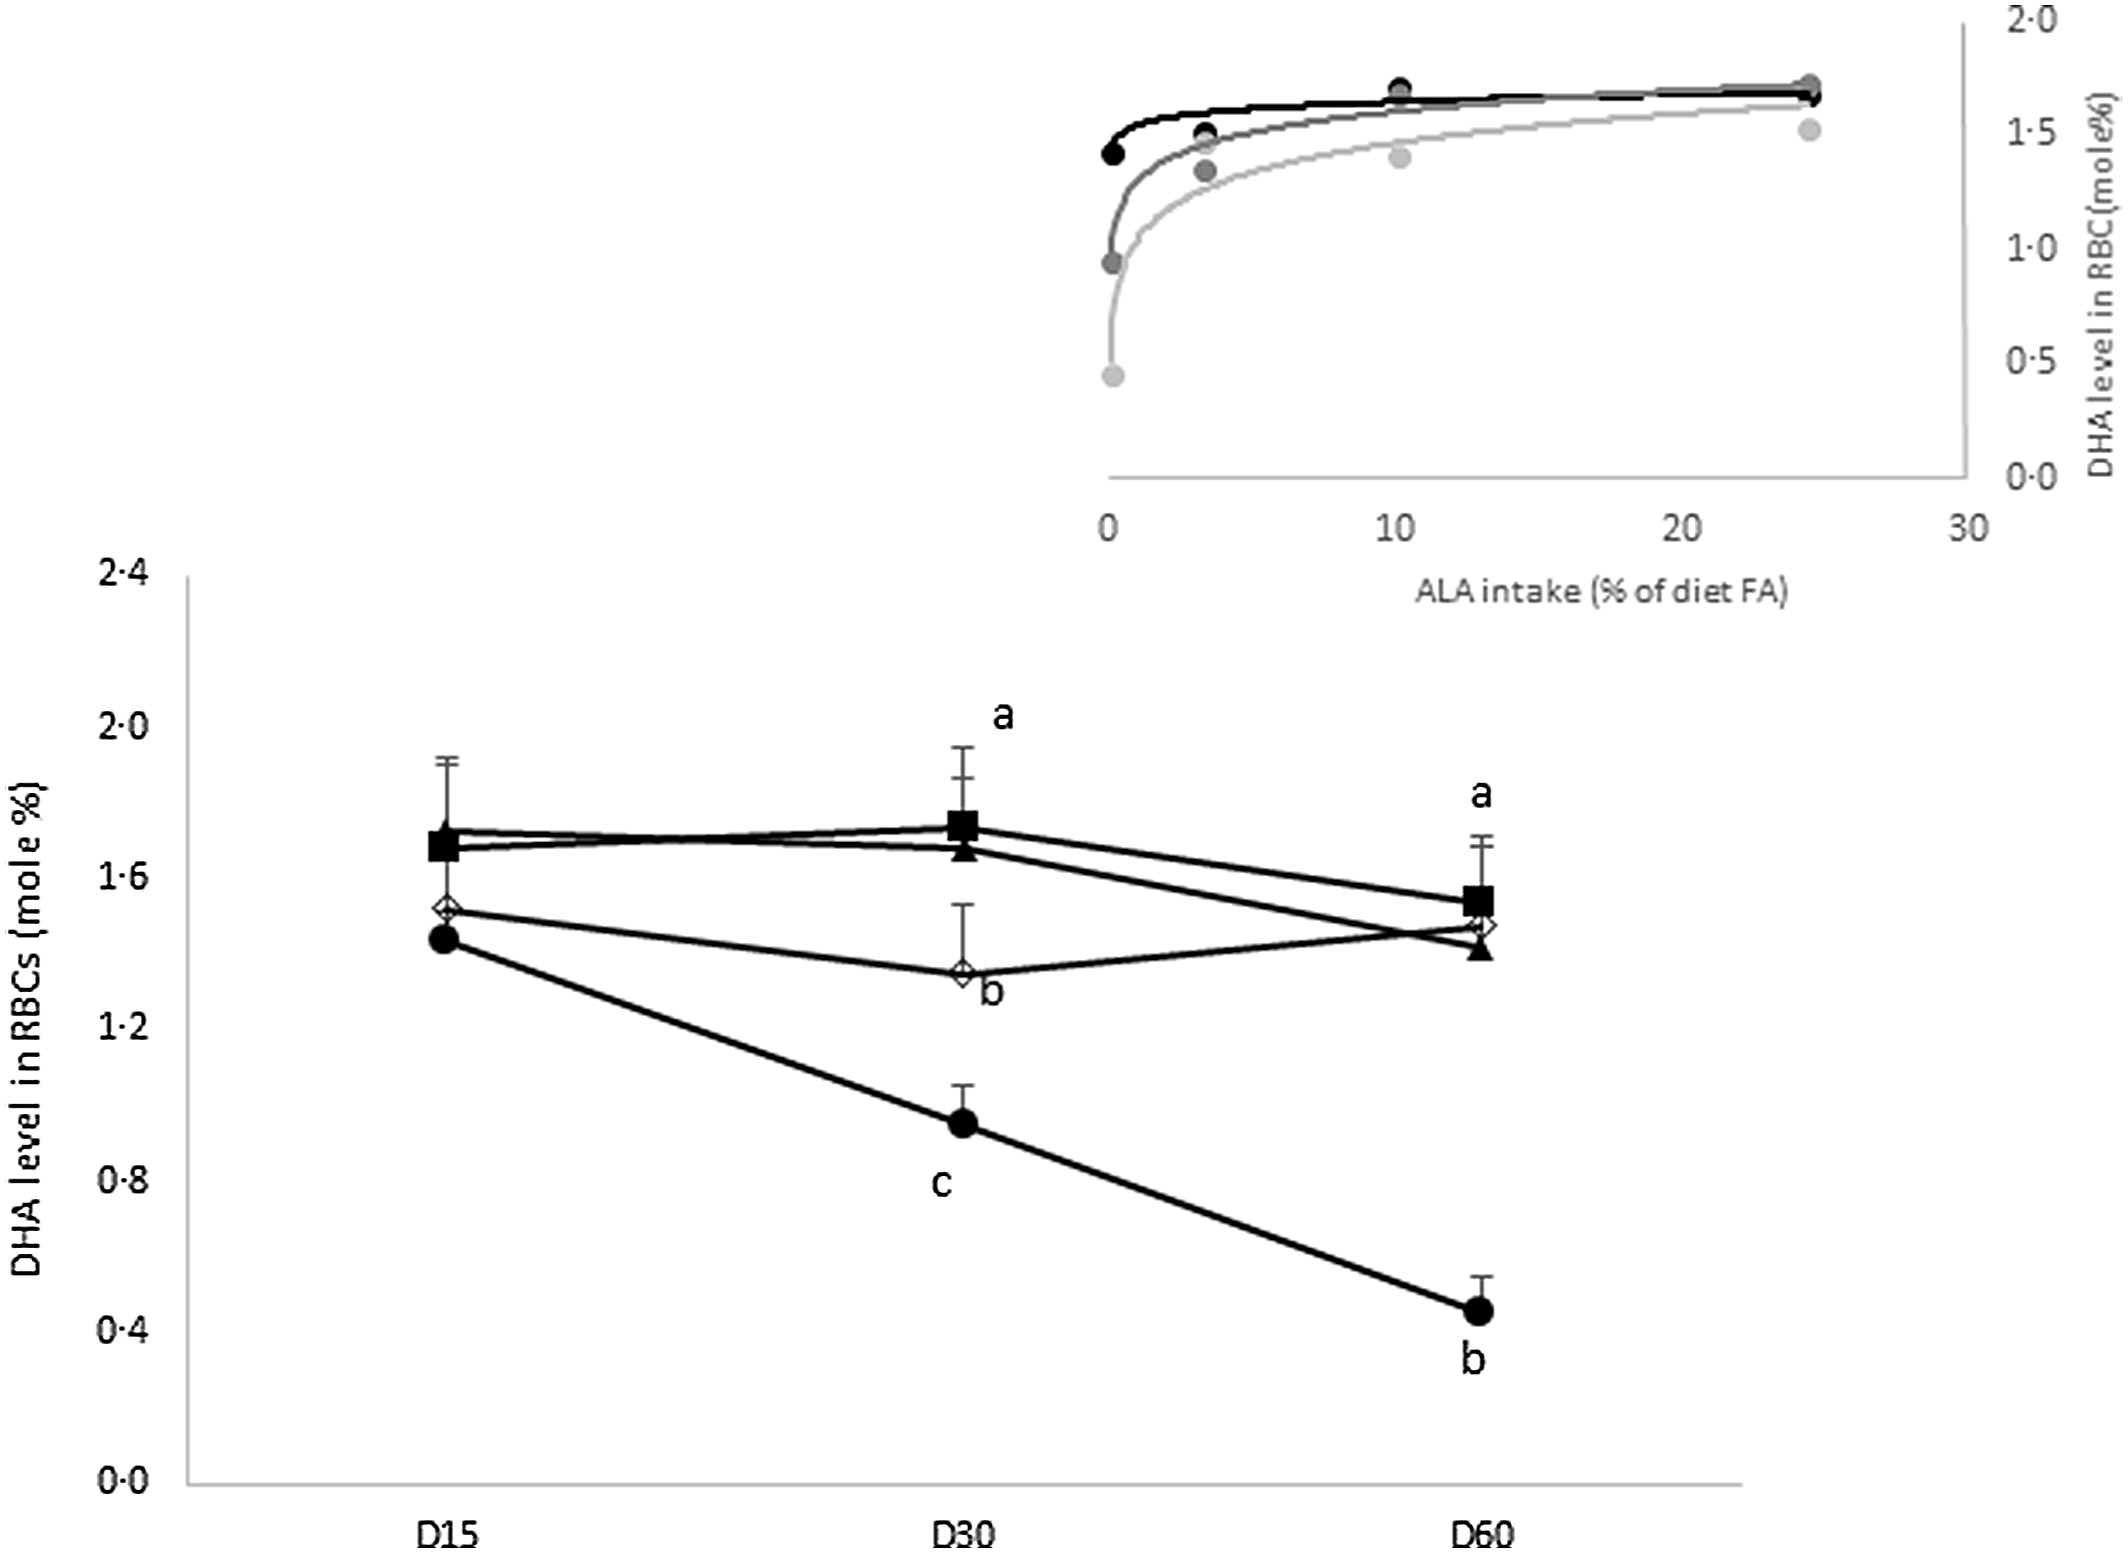
Kinetics of DHA uptake in erythrocytes as a function of dietary intake of ALA. The experimental diets provide increased proportions of ALA in the diet lipids: ALA-0 (![]() ), ALA-3 (
), ALA-3 (![]() ), ALA-10 (
), ALA-10 (![]() ) and ALA2–24 (
) and ALA2–24 (![]() ); 0, 3, 10, and 24 % ALA, respectively (n 8 rats/group). Means marked with different letters are significantly different (P < 0·05); two-way ANOVA followed by a Tukey’s honestly significant difference (HSD) test. Insert: Linear correlation between erythrocyte proportion of DHA as a function of dietary ALA intake after 15 (
); 0, 3, 10, and 24 % ALA, respectively (n 8 rats/group). Means marked with different letters are significantly different (P < 0·05); two-way ANOVA followed by a Tukey’s honestly significant difference (HSD) test. Insert: Linear correlation between erythrocyte proportion of DHA as a function of dietary ALA intake after 15 (![]() ), 30 (
), 30 (![]() ) and 60 (
) and 60 (![]() ) d of experimental diet (n 8 rats/group). ALA, α-linolenic acid.
) d of experimental diet (n 8 rats/group). ALA, α-linolenic acid.

When the diet is ALA deprived (ALA-0), the levels of ALA in erythrocytes represented less than 0·1 %.
More the ALA levels increased in the diet, more effective was the ALA incorporation in the erythrocytes (Fig. 4). Specifically, ALA levels were 7, 10 and 30-fold higher when the ALA levels increased in the diet (ALA-3, ALA-10 and ALA-24, respectively).
This incorporation of ALA into erythrocytes was linearly correlated with its dietary intake (R² 0·99), regardless of the time duration of the diet (Fig. 4). More precisely, the ALA incorporation in erythrocytes was maximal after 30-d diet to be then plateaued until 60 d, following the experimental diet.
The incorporation of n-3 LC-PUFA (EPA and DHA) into erythrocytes was monitored as a function of the proportion of ALA in dietary lipids over a 60-d kinetics.
The EPA levels in erythrocytes (Fig. 5) represented 0·2 % of total FA in the ALA-deprived group (ALA-0) or in the group submitted to a few ALA intake (ALA-3).
After 30-d diet, the EPA levels were three times higher in erythrocytes when the ALA intake represented more than 10 % in the diet lipid.
The EPA levels in erythrocytes were linearly correlated (R² 0·99) with the dietary ALA (Fig. 5). Thus, the higher the ALA intake, the greater the EPA levels. More precisely, the EPA levels increased 10-fold after 30 and 60 d of a diet enriched in ALA.
In addition to the EPA, DHA proportions were monitored in erythrocytes (Fig. 6).
When rats fed an n-3-free diet, the DHA levels in erythrocytes decreased by 30 and 64 %, respectively, at 30 and 60 d (ALA-0).
The introduction of ALA in the diet, even in small amounts (ALA-3), could restore the initial levels in DHA in erythrocytes, after 60 d of experimental diets. Moreover, an intake over than 10 % ALA in the diet lipid allowed to maintain the DHA levels (1·6 % of total FA) in erythrocytes, regardless the time duration of the diet (Fig. 6).
Impact of α-linolenic acid intake on the fatty acid profile of lipid fractions in the plasma
α-Linolenic acid bioavailability
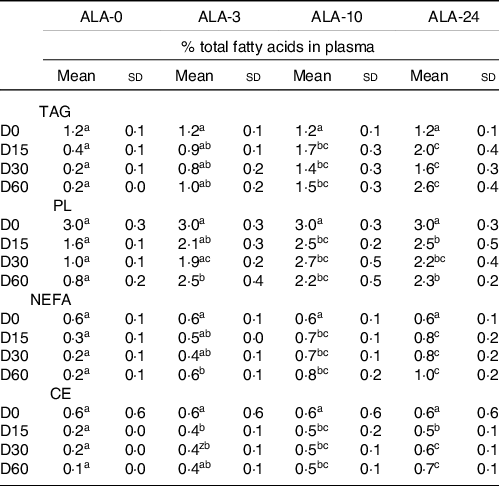
The incorporation of n-3 PUFA was studied in all lipid fractions (TAG, PL, CE and FA) of plasma, considering ALA (Table 2), EPA (Table 3) and DHA (Table 4).
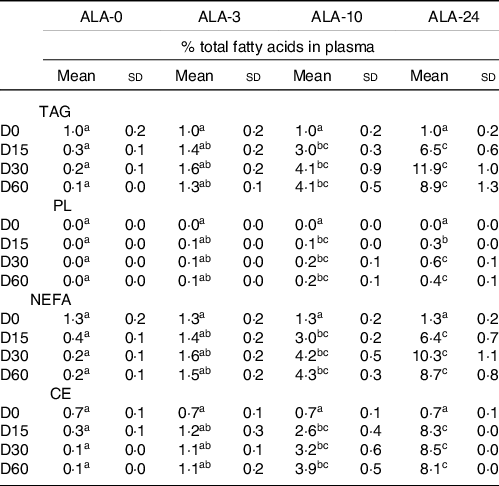
Incorporation of ALA into plasma lipid fractions as a function of dietary ALA intake over a 60-d kinetics* (n 8 rats/group)
(Mean values and standard deviations)

ALA, α-linolenic acid; TAG, triglyceride; NEFA, non esterified fatty acid; PL, phospholipid; CE, cholesterol ester.
* The experimental diets provided increased levels of ALA (ALA-3, ALA-10 and ALA-24; 0, 3, 10 and 24 % of the total FA, respectively). Rats were submitted for 0, 15, 30 or 60 d of experimental diets.
a,b,c Means marked with different letters in a same line are significantly different (P < 0·05), two-way ANOVA followed by Tukey’s HSD test.
Incorporation of EPA into plasma lipid fractions as a function of dietary ALA intake over a 60-d kinetics* (n 8 rats/group)
(Mean values and standard deviations)

ALA, α-linolenic acid; TAG, triglyceride; NEFA, non esterified fatty acid; PL, phospholipid; CE, cholesterol ester.
* The experimental diets provided increased levels of ALA (ALA-3, ALA-10 and ALA-24; 0, 3, 10 and 24 % of the total FA, respectively). Rats were submitted for 0, 15, 30 or 60 d of experimental diets.
a,b,c Means marked with different letters in a same line are significantly different (P < 0·05), two-way ANOVA followed by Tukey’s HSD test.
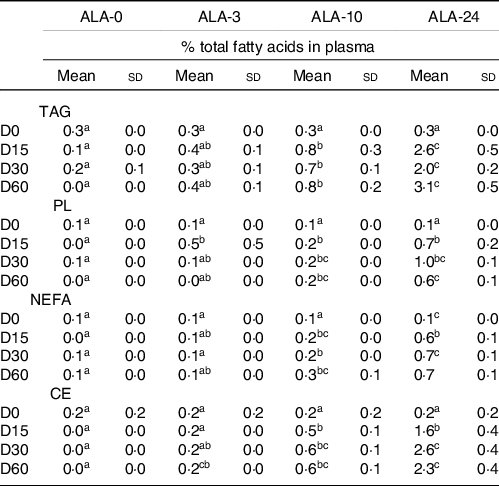
Incorporation of DHA into plasma lipid fractions as a function of dietary ALA intake over a 60-d kinetics* (n 8 rats/group)
(Mean values and standard deviations)

ALA, α-linolenic acid; TAG, triglyceride; NEFA, non esterified fatty acid; PL, phospholipid; CE, cholesterol ester.
* The experimental diets provided increased levels of ALA (ALA-3, ALA-10 and ALA-24; 0, 3, 10 and 24 % of the total FA, respectively). Rats were submitted for 0, 15, 30 or 60 d of experimental diets.
a,b,c Means marked with different letters in a same line are significantly different (P < 0·05), two-way ANOVA followed by Tukey’s HSD test.
ALA was incorporated in all lipid fractions of the plasma except for PL which are more favourable for the incorporation of LC-PUFA (Table 2). An ALA-free diet (ALA-0) induced a rapid depletion of the precursor in all lipid fractions, resulting in an ALA level below 0·2 % total FA in each lipid fractions and over the diet time kinetics.
As soon as ALA was incorporated and represented 3 % dietary lipids (ALA-3), the ALA levels were steady state in plasma lipid fractions from 15 d of experimental diets. In addition, when ALA represented more 10 % of the dietary lipids (ALA-10 and ALA-24 groups), the ALA levels increased in all lipid fractions (TAG, NEFA and CE; tripled and 8-fold) of the plasma. Data showed that the greater the ALA intake in the diet, the more efficient its incorporation into lipid fractions of the plasma. However, the time kinetics duration did not influence the ALA uptake; ALA levels plateaued from 2 weeks of experimental diets, whatever the ALA level in the lipid diet. Interestingly, for a same level of ALA intake (3, 10 or 24) ALA was homogeneously incorporated into all plasma lipid fractions, except for PL fraction.
Indeed, in TAG, CE and NEFA fractions, ALA levels mainly represented 1·5, 4 and 8% total FA in the 3, 10 and 24 % ALA diets, respectively. Therefore, the higher the ALA content in the diet, the more effective its incorporation into the overall lipid fractions of the plasma.
Bioconversion of dietary α-linolenic acid in EPA
EPA was predominantly present in TAG and CE plasma fractions (Table 3). Its level clearly depended on the initial amount of ALA in the diet lipid. Indeed, when rats fed an n-3 deprived diet (ALA-0 diet), EPA levels rapidly decreased to reach a zero threshold, in all lipid fractions of the plasma.
In addition, the more the ALA in the diet lipid, the more favourable its bioconversion in EPA, in the TAG and CE fractions. More precisely in the TAG and CE fractions of the plasma, the low EPA levels (0·2–0·3 % of total FA) observed at Day-0 were increased 3-fold and 10-fold when the ALA intake represented 10 and 24 % in the lipid diets, respectively.
In addition, as a function of time duration, the EPA enrichment in plasma TAG and EC plateaued once 15 d of experimental diets.
Bioconversion of dietary α-linolenic acid in DHA
DHA was mainly stored in plasma TAG and PL (Table 4). When the diet was n-3-deprived (precursor and long chains), the DHA level decreased in all lipid fractions of the plasma (between 80 and 90 % less).
A low ALA diet (ALA-3) allowed to maintain the basal DHA levels in all lipid fractions within 30 d, and enhanced in the ALA-24 group (+116 %). The higher the ALA content in the diet, the faster the DHA recovery in the plasma TAG.
On the other hand, DHA levels quickly raised and plateaued at 2–3 % in TAG and PL fractions and less than 1 % in NEFA and CE, as a saturation effect.
Impact of increased α-linolenic acid intake on lipid peroxidation and oxidative stress markers
Because PUFA are sensitive to lipid peroxydation (LPO) which can cause oxidative stress, NO (Fig. 7(a)) and activities of enzymes implied in the oxidative stress (catalase, superoxide dismutase and glutathione peroxidase) (Fig. 8(a), (b) and (c)) were monitored in plasma and liver, respectively. Moreover, the α-tocopherol level (Fig. 7(b)) was determined in the plasma as antioxidant source to limit LPO.
Levels of α-tocopherol and nitric oxide (NO) levels in plasma of rats submitted to experimental diets for 15 and 60 d. The experimental diets provided increased levels of ALA (ALA-3, ALA-10 and ALA-24; 0, 3, 10 and 24 % of the total FA, respectively). Data are represented by their means and standard deviations (n 8 rats/group). (a) NO concentration in plasma (µM) and (b) α-tocopherol levels (µg/ml plasma). Data were analysed by a two-way ANOVA followed by Tukey’s HSD test. ALA, α-linolenic acid.

Antioxidant activities of catalase (CAT: a), superoxide dismutase (SOD: b) and glutathione peroxidase (GPx: c) in the liver of rats submitted to experimental diets for 60 d. The experimental diets provided increased levels of ALA (ALA-3, ALA-10 and ALA-24; 0, 3, 10 and 24 % of the total FA, respectively). Data are represented by their means and standard deviations (n 8 rats/group) and expressed as unit/mg liver proteins. Data were analysed by a two-way ANOVA followed by Tukey’s HSD test. ALA, α-linolenic acid.

NO is a marker of the oxidative stress that can be generated as a result of n-3 PUFA peroxidation from the membrane. NO levels were determined in all groups (ALA-0, ALA-3, ALA-10 and ALA-24) after 15 and 60 d of experimental diets.
The markers of the oxidative stress did not show any difference in all groups, considering the NO levels in plasma (Fig. 7(a)) and the activities of the three enzymes implied in the oxidative stress. More precisely, the NO concentrations represented between 31 and 41 µM in plasma for almost groups, and whatever the time duration of the diet (15 or 60 d). The activities of catalase (2100 (sd 148) U/mg prot), superoxide dismutase (21 (sd 4) U/mg prot) and glutathione peroxidase (457 (sd 82) U/mg prot) were similar whatever the ALA level in the diet (Fig. 8(a), (b) and (c), respectively).
As a reminder, all the experimental diets provided the same amount of α-tocopherol. After 60-d diet, the α-tocopherol levels were halved in the plasma as the ALA levels increased in the diets (Fig. 7(b)).
Discussion
This study was assessed in male rat model to investigate the impact of an increased ALA enrichment in the diet lipids, on the n-3 lipid bioavailability in plasma and erythrocytes over a 60-d kinetics. The lipid diets were designed to minimise the variation between the FA profiles in all groups excepted for ALA proportions, which ranged between 0 and 24 % of the total FA in the diet lipids. Consequently, the LA/ALA ratio varied between 581 and 1·6. Knowing the impact of the LA/ALA ratio on ALA bioconversion, we followed the capacity for ALA to be bioconverted into higher derivatives, that is, EPA and DHA during several diet periods, that is, 15, 30 and 60 d.
On the one hand, when the diet was deprived in ALA, the n-3 PUFA levels were weak in the plasma and erythrocytes, notably in ALA, EPA and DHA. The longer the ALA-deprived diet persisted over time, the more the deficiency sets in. More precisely, the n-3 PUFA levels decreased in all lipid fractions of plasma and erythrocytes. However, it is to notice that the EPA and DHA levels gradually decreased in PL fractions as a function of time. It has been previously observed that an n-3 PUFA-deficient diet induced a decrease in n-3 PUFA contents in lipid fraction of plasma and erythrocytes and is associated with several adverse effects on the inflammatory level, the development of the nervous system, depression and even visual acuity in animal(Reference Neuringer, Connor and Van Petten58–Reference Smith and Mukhopadhyay60) and human(Reference Holman, Johnson and Hatch61,Reference Vinton, Heckenlively and Laidlaw62) . Indeed, cell membranes are mainly composed of PL rich in n-3 LC-PUFA which play a crucial role by modulating cellular signalling events, membrane protein function and gene expression(Reference Astorg9,Reference Alessandri, Guesnet and Vancassel14) , which could explain why DHA levels seem to be preserved in PL fractions as much as it could be to limit its membrane deficiency.
However, when the diet provided ALA, its bioavailability was similarly improved by 3-fold and 9-fold, in plasma and erythrocyte lipids, regardless of the time duration of the diet. In addition, the bioavailability of ALA in plasma and erythrocytes was linearly correlated with its proportion in the lipid diet (R² 0·9). The more the ALA level in the lipid diet, the greater its bioavailability. Our data agreed with those previously observed in hamster model(Reference Morise, Combe and Boué32),where ALA levels in CE, PL of the plasma and erythrocytes were linearly correlated with its intake, after a 2-month diet. In our work, ALA was homogeneously integrated into TAG, NEFA and CE fractions and its enrichment within was also linearly correlated with its dietary intake. Moreover, our results demonstrated that the maximal time accretion in plasma and in erythrocyte lipids ranged between 15 and 30 d of diet, whatever the level of ALA intake in dietary lipids. These data suggest that ALA bioavailability is no time dependent. Interestingly, the plateau phase occurred from 30 d of ALA supplementation and the maximal level in ALA depended on the initial ALA intake provided in the diet. Therefore, in our experimental conditions, the greatest bioavailability of ALA was obtained for an ALA intake between 10 and 24 % in the diet lipids and for a time duration of 15–30 d of diet. To our knowledge, no studies have yet determined the amount and time duration of ALA supplementation required to improve the n-3 bioavailability in the organism. Our results show the importance to follow a minimum of 15 d of ALA supplementation to get an optimal ALA bioavailability.
As a precursor of n-3 LC-PUFA, ALA can be bioconverted into higher n-3 LC derivatives, notably EPA and DHA, whose health benefits are well documented(Reference De Lorgeril3,Reference Bourre4,Reference Calder7,Reference De Lorgeril and Salen63) . However, ALA has been found to be poorly bioconverted into EPA (<10 %) and all the more, into DHA (<1 %)(Reference Harayama and Shimizu15,Reference Burdge42,Reference Kim, Choi and Park64–Reference Blondeau69) . Since the bioconversion of ALA in EPA is greater in rodents(Reference Burdge42,Reference Burdge and Wootton65–Reference Vermunt, Mensink and Simonis67,Reference Moghadasian and Eskin70) , the impact of the dietary enrichment of ALA on its ability to be bioconverted into EPA and DHA has been monitored. In our study, the EPA levels in plasma and in erythrocytes were linearly correlated (R² 0·97) with the dietary intake of ALA. In the plasma and erythrocytes, the EPA levels were 4-fold and 10-fold higher for a diet supplying 10 and 24 % ALA, respectively, compared with the n-3 PUFA-deprived diet. Notably, the EPA levels were homogeneously improved in plasma PL and CE fractions for each time point of the kinetics. The ALA-24 diet allows the best enrichment in EPA, from 15 to 30 d of diet. The greater the ALA content in the diet, the more effective its bioconversion in EPA. Consequently, EPA levels were linearly correlated with the ALA intake in the lipid diet, nonetheless the curve plateaued as a function of time duration of the diet, as previously observed for ALA. We hypothesised that the metabolism of ALA is initially increased in terms of desaturation up to 15 d of supplementation, regardless the level of ALA in the diet. Considering the steady state observed after 15 d of experimental diet, it would seem that a regulation of the ALA metabolism takes place. Previous studies reported that ALA bioconversion was limited because ALA is a privileged substrate for β-oxidation(Reference Austria, Richard and Chahine31,Reference Burdge42,Reference Ramírez, Amate and Gil71) . However, in our conditions, it seems that the proportions of ALA used in our experimental diets do not enhance its β-oxidation, since a linear correlation was observed for ALA and EPA levels.
More, the improved level in EPA indicated the activation of the bioconversion pathways from dietary ALA, which was the only n-3 PUFA source provided in the diet. Indeed, ALA can be converted into EPA, thanks to the successive action of delta 6, delta 5 desaturases and elongases(Reference Rodriguez, Sarda and Nessmann45–Reference Pignitter, Lindenmeier and Andersen47). As the bioconversion enzymes are common to both n-3 and n-6 series, LA and ALA consequently compete to their respective bioconversion in higher derivatives. It has been described that the LA/ALA ratio plays a key role in the regulation of the bioconversion pathway(Reference Choi and Park68). Based on the literature data, a LA/ALA ratio lower than 5 favours the ALA bioconversion(Reference Guesnet, Tressou and Buaud23,Reference Mazurier, Rigourd and Perez28,Reference Burdge42,Reference Portolesi, Powell and Gibson46) . Our results confirmed that the bioconversion pathway was activated notably in the experimental diets providing the lowest LA/ALA ratio. This is consistent with the decreased level observed in plasma and erythrocyte lipids for the higher derivative n-6, the arachidonic acid (data not shown). We also noticed that the improvement in the EPA levels depended not only on the LA/ALA ratio but also on the dietary-ALA intake. In the diets, we tried as much as possible to maintain similar levels of FA between the groups except for ALA (increasing % level), but the level of some FA differed by 2–5 % in some experimental groups. These differences are notably for PA, AO and LA which are not known to influence the absorption of ALA. Only LA would have an impact on the ALA bioconversion in n-3 PUFA due to the bioconversion enzymes they share. To conclude and based on the bioavailability and the capacity of ALA to be bioconverted into EPA, the most favourable diets were those that provided the highest amount of ALA with the lowest LA/ALA ratio (10 or 24 % ALA for an LA/ALA ratio of 5·5 and 1·6, respectively) and over a 15–30-d diet period.
ALA is firstly converted into EPA, which in turn can be bioconverted into DHA(Reference Rodriguez, Sarda and Nessmann45,Reference Pignitter, Lindenmeier and Andersen47) . DHA was essentially incorporated in erythrocytes and in TAG and PL fractions of the plasma. An n-3 PUFA-deprived diet dramatically decreased the DHA levels in TAG and PL. We noticed that the addition of ALA in the experimental diet promoted its bioconversion in DHA, but it was not linearly correlated with dietary ALA level as observed for the elongation in EPA. However, in an n-3 PUFA-deficient diet, the addition of ALA allowed to maintain and/or to recover the DHA levels. More precisely, 3–10 % ALA diets allowed to restore the DHA levels in plasma, whereas the 24 % ALA diet seems to improve the DHA levels in plasma TAG, after 60 d of experimental diet (+116 %). In the plasma and erythrocyte compartments, the DHA levels plateaued only with 3 % ALA in the diet lipids, demonstrating that the bioconversion of ALA in DHA was a regulated system and a rate-limiting process. As supported by other studies, the FADS2’s retroinhibition, which encodes for the delta 6 desaturase via PPAR-RXR, explains this regulation process(Reference Burdge, Finnegan and Minihane18,Reference Sioen, van Lieshout and Eilander24) . Contrary to ALA and EPA levels, no time effect of the diet was observed considering the bioconversion in DHA. The more the ALA level in the diet lipid, the faster the DHA conversion. A 3 % ALA content in dietary lipids allowed to recover the baseline levels in DHA after 60 d of feeding, and a content of 10–24 % ALA in only 15 d. When the diet is deficient in n-3 PUFA, inducing a deficient n-3 PUFA status, dietary ALA can enhance the DHA levels(Reference Holman, Johnson and Hatch61,Reference Vinton, Heckenlively and Laidlaw62) . Since the experimental diets were deprived in n-3 LC-PUFA, the restored DHA could only come from the ALA bioconversion, provided by the dietary lipids. The bioconversion pathway seems to be stimulated for DHA synthesis, suggesting the induction of desaturase activities, in a rate-limiting process. Studies demonstrated that the bioconversion of ALA in DHA was very low. However, when the diet is deprived in n-3 PUFA, dietary ALA seemed to be preferentially desaturated, to enhance the EPA levels and/or keep constant the DHA levels, by increasing the bioconversion pathway and desaturase activities. So, the conversion pathways seem to be regulated considering the n-3 levels in the diet(Reference Gibson, Neumann and Lien35).
However, studies reported that an excessive n-3 incorporation into plasma and tissue lipids can have undesirable effects by enhancing susceptibility of membranes to LPO and inducing an imbalance in the antioxidant system and oxidative stress(Reference Kelley, Yoshida and Erickson72). Indeed, EPA and DHA are mainly embedded in the membranes and being sensitive to LPO, they can in this case, generate damage in the cell membranes(Reference Ando, Nagata and Yoshida48–Reference Song and Miyazawa50,Reference Song, Fujimoto and Miyazawa73) . Globally, by considering the similar activities of catalase, superoxide dismutase and GSH-Px in the liver and the NO levels in plasma, no modification of the oxidative stress markers can be detected between the experimental groups and the initial diet. However, our results showed that the more the ALA in the diet, the lower the α-tocopherol level in plasma. As α-tocopherol is an intensive antioxidant, it can be hypothesised that α-tocopherol has been used to trap free radicals generated during LPO as reported by(Reference Ando, Nagata and Yoshida48,Reference Song and Miyazawa50,Reference Song, Fujimoto and Miyazawa73) . In our conditions, the ALA intake induced a consumption of vitamin E without generating oxidative stress as a consequence of LPO. Care should be taken to the α-tocopherol levels in plasma when providing n-3-enriched diets to compensate the possible LPO occurred in the membrane.
To conclude, our study found that a diet providing between 10 and 24 % ALA in dietary lipids (LA/ALA 5·5 and 1·6, respectively) improved not only the ALA bioavailability without modifying its capacity to be β-oxidised but also its bioconversion in EPA and DHA in a healthy adult rat model. In a case of an n-3 PUFA-deficient diet, the ALA intake promoted its bioavailability and its bioconversion in EPA in a dependent manner and allowed to maintain those in DHA without generating LPO or oxidative stress. Moreover, 15–30 d of ALA supplementation is sufficient to improve the ALA and EPA levels in the bloodstream. Ultimately, the enrichment of plasma lipids in n-3 PUFA by consuming ALA could impact the quality of lipoproteins synthesised by the liver (VLDL, HDL, LDL) and the ALA distribution towards peripheral cells to enhance the n-3 PUFA bioaccessibility in the organism.
Acknowledgements
ITERG thanks Karen Bertrand for her technical assistance and Deborah Johnson for proof-reading the article. The authors are members of the ‘Unité mixte technologique’ (UMT – Joint Technological Unit) ACTIA BALI (BioAvailability of Lipids and Intestine).
This work was supported by Terres Univia and UMT ACTIA BALI and funded by Région Nouvelle Aquitaine and FEDER.
The authors’ responsibilities were as follows: L. C. and C. V., formed the research question and designed the research; L. C., H. A., I. C. C. and C. V., conducted the research; H. A. and I. C. C., carried out the experiments and conducted the laboratory; L. C., D. M. and B. B. wrote the article.
There are no conflicts of interest.