


1. Introduction
The compliant-based microgrippers have received widely attention from the field of micro surgery, micro assembly, precision measurement, and micro manipulation due to the recent development of micro electro mechanical systems. Compliant microgripper is one of the key tools to manipulate objects in the micro level [Reference El-Sayed, Abo-Ismail, El-Melegy, Hamzaid and Osman1–Reference Liu, Chiu, Hsu and Chiang4]. Because of compliant microgrippers achieving motion, energy, and forces transmission by elastic deformation of flexure hinges, it avoids backlash, friction, with high repeatable motion and vacuum compatibility [Reference Ding, Yang and Li5].
In practical application, the force control of clamping arm is still a tough issue. For example, in the biomedical engineering, the applied excessive force would damage the object and insufficient force cannot hold the object [Reference Gan, Xu, Zhang and Ding6]. Traditional force regulation is achieved by adopting advanced force and displacement sensors. However, using sensors realize force control usually have tons of disadvantages. One major drawback is that advanced sensor always matches complex feedback algorithms, it definitely increases the complexity of system [Reference Zubir, Shirinzadeh and Tian7, Reference Bazaz, Khan and Shakoor8]. In addition, advanced sensors also increase the cost of the system, and harsh working conditions may lead to accuracy degrading and drop off of sensors. As an alternatively choice, constant force mechanisms (CFM) were developed. Unlike the traditional elastic structure, the CFM has quasi-zero stiffness (QZS) characteristics and don’t obey Hooke’s law. The CFM can be realized by many methods, and the typical method is by combining positive stiffness mechanism (PSM) with negative stiffness mechanism (NSM) to form QZS [Reference Wang and Lan9, Reference Ding, Li and Li10]. Given these characteristics, CFMs contribute significantly in operating fragile and force sensitive objects [Reference Ling, Ye, Feng, Zhu, Li and Xiao11, Reference Chen and Lan12]. More importantly, using of CFMs can avoid feedback control loops and also more suitable for utilizing in harsh environments [Reference Pham and Wang13, Reference Dong, Chen, Du, Tang and Dan14].
In addition, since design parameters of the CFM have a significant impact on its performance, it is necessary to identify optimal parameters combination to get a better performance. The constant force travel range of the CFM determines effective working stroke of the compliant constant force microgripper (CCFMG). To obtain a larger constant force stroke, architectural parameters should be optimized. Referring to previous studies, optimization methods like particle swarm optimization (PSO) and genetic algorithms require complex coding process and also exhibit disadvantages of being easy to fall into local optimal and unable to effectively identify combination optimization parameters [Reference Jin, Rocco and Ghen15]. The FEA-based optimization with advantages of easy implementation and recommending the best combination parameters was utilized in this study [Reference Mohammadali, Bijan, Ammar, Tilok and Joshua16, Reference Ding, Li and Li17].
Generally, a gripper with 1-DOF is enough to complete gripping operations, and previous works has been devoted by Wang et al. [Reference Wang, Yang and Dong18], Zhao et al. [Reference Zhao, Huang, Liu, Wang and Hong19], Das et al. [Reference Das, Shirinzadeh, Ghafarian and Al-Jodah20]. However, the deficiency is the lack of convenience and flexibility in operation. More DOFs means more flexibility. However, more flexibility means larger space occupation and complex control algorithms. Therefore, 2-DOF microgrippers driven by PEAs which are able to perform dexterous operations have been proposed in recent years [Reference Song, Yang, Fu, Li and Wei21–Reference Chen, Qu, Chen and Zhang24]. However, disadvantages of these microgrippers are obvious. One of the problems is the limited working range due to the limited stroke of PEA. Another problem is the coupling motion in process of clamping objects. Therefore, microgrippers with large operation range, totally decoupling motion and overload protection deserve further study.
Unlike most parallel grippers, a serial 2-DOF CCFMG is proposed in this paper. The horizontal direction motion is mainly responsible for gripping the object, while the vertical direction motion is mainly responsible for approaching the object. Therefore, it can realize totally decoupled motion. In addition, the FEA-based optimization method is utilized to effectively identify optimization parameters. Moreover, to compensate limited stroke of PEA, the SRDAM, lever-type displacement amplification mechanism, and BTDAM are used as hybrid amplification mechanisms to enlarge the clamping range. The framework of this study is depiected in Fig. 1. The rest of this paper is organized as follows. In Section 2, the design and analysis for CCFMG is presented. In Section 3, FEA studies are performed. In Section 4, the parameters optimization are conducted. Finally, some conclusions are drawn in Section 5.
The framework of this study.

2. Mechanical design
The proposed 2-DOF serial CCFMG is depicted in Fig. 2(a). The whole system consists of two PEAs, a SRDAM, a pair of grasping clamps, two CFM modules, a BTDAM, and a base. The overall dimensions of CCFMG is 186.31 mm
 $\times$
154.84 mm
$\times$
154.84 mm
 $\times$
8 mm. For the purpose of obtaining purely parallel movement, the design adopts symmetrical structure. In addition, it also can eliminate temperature effects and provide a more reliable grasping forces. In short, the presented CCFMG has four important features: (1) serial type; (2) 2-DOF with totally decoupling motion; (3) large stroke with hybrid amplification mechanisms in compact size; (4) overload protection using CFM module.
$\times$
8 mm. For the purpose of obtaining purely parallel movement, the design adopts symmetrical structure. In addition, it also can eliminate temperature effects and provide a more reliable grasping forces. In short, the presented CCFMG has four important features: (1) serial type; (2) 2-DOF with totally decoupling motion; (3) large stroke with hybrid amplification mechanisms in compact size; (4) overload protection using CFM module.
(a) 3D model of CCFMG, (b) the PRBM of CCFMG.

The PRBM diagram of our CCFMG is shown in Fig. 2(b). The motion of CCFMG mainly has two parts. The part of X-direction is consisted of SRDAM and two clamping arm levers.
 $S_3$
and
$S_3$
and
 $S'_{\!\!3}$
are the displacement inputs of the SRDAM. The displacement of PEA2 is amplified by SRDAM and provides a double-sided output. The other part mainly consists of one BTDAM and four leaf flexures. The main function of leaf flexures is to connect the gripper and the base.
$S'_{\!\!3}$
are the displacement inputs of the SRDAM. The displacement of PEA2 is amplified by SRDAM and provides a double-sided output. The other part mainly consists of one BTDAM and four leaf flexures. The main function of leaf flexures is to connect the gripper and the base.
 $H_2H_3$
and
$H_2H_3$
and
 $H'_{\!\!2}H'_{\!\!3}$
are the displacement inputs of BTDAM. The displacement of PEA1 is amplified by BTDAM.
$H'_{\!\!2}H'_{\!\!3}$
are the displacement inputs of BTDAM. The displacement of PEA1 is amplified by BTDAM.
2.1. PSM analysis
In this section, force deformation of the Z-beam can be derived referring to previous study [Reference Zhao, He, He and Wang25]. Here, a half of the mechanism is adopted to analysis, concerning its symmetrical structure. The Z-beam consists of three flexible horizontal straight beams and two vertical connecting beams, as is shown in Fig. 3(b).
 $\theta _1$
,
$\theta _1$
,
 $\theta _2$
, and
$\theta _2$
, and
 $\theta _3$
are the deformation angles after the horizontal straight beam subjected to the force, respectively.
$\theta _3$
are the deformation angles after the horizontal straight beam subjected to the force, respectively.
 $l_1$
,
$l_1$
,
 $l_2$
, and
$l_2$
, and
 $l_3$
are the length of each horizontal straight beam.
$l_3$
are the length of each horizontal straight beam.
 $M_1$
is the moment generated at the fixed end of the Z-beam.
$M_1$
is the moment generated at the fixed end of the Z-beam.
 $t$
and
$t$
and
 $b$
denote the thickness and width of the Z-beam, respectively.
$b$
denote the thickness and width of the Z-beam, respectively.
 $F_p$
is the reaction force generated along the vertical direction.
$F_p$
is the reaction force generated along the vertical direction.
(a) Parameters of CFM, (b) modeling of Z-beam, (c) modeling of bi-stable beam.

The reaction force
 $F_p$
of the Z-beam can be expressed as
$F_p$
of the Z-beam can be expressed as
 \begin{equation} F_p=\sum \limits _{i=1}^{m} F_{p_{\theta _i}} \end{equation}
where
 $F_{P{\theta _i}}$
is the reaction force of a single horizontal straight beam of Z-beam, it can be generated as
$F_{P{\theta _i}}$
is the reaction force of a single horizontal straight beam of Z-beam, it can be generated as
 \begin{equation} F_{p_{\theta _i}}=\frac{2EI\theta _i}{l_i^2} \end{equation}
where
 $E$
denotes the Young’s modulus of material, and
$E$
denotes the Young’s modulus of material, and
 $I$
is the second moment of area. According to the geometric relationship of the Z-beam, the following equations are derived as
$I$
is the second moment of area. According to the geometric relationship of the Z-beam, the following equations are derived as
 \begin{equation} \left \{ \begin{array}{l} l_1(1-\cos{\theta _1})-l_2(1-\cos{\theta _2})+l_3(1-\cos{\theta _3})=0\\[5pt] l_1\sin{\theta _1}+l_2\sin{\theta _2}+l_3\sin{\theta _3}=\Delta x\\[5pt] {\theta _1}={\theta _3} \end{array} \right. \end{equation}
2.2. NSM analysis
A half of the NSM and its architectural parameters are shown in Fig. 3(c).
 $L$
,
$L$
,
 $t$
, and
$t$
, and
 $\omega$
are the length, thickness, and out-of-plane width of the bi-stable beam, respectively.
$\omega$
are the length, thickness, and out-of-plane width of the bi-stable beam, respectively.
 $\varepsilon$
is the output displacement of the bi-stable beam by applying force
$\varepsilon$
is the output displacement of the bi-stable beam by applying force
 $F_n$
, and
$F_n$
, and
 $\beta$
is the angle between the fixed guide beam and the horizontal direction.
$\beta$
is the angle between the fixed guide beam and the horizontal direction.
The force–displacement expression can be obtained as
 \begin{align} F_n=ES\frac\varepsilon L\left(\frac\varepsilon L-\sin\theta\right)\left(\frac\varepsilon L-2\sin\theta\right) \end{align}
where
 $S=bt$
is the cross-sectional area of the beam. When
$S=bt$
is the cross-sectional area of the beam. When
 $\theta$
equals zero, according to Eqs. (2) and (4), the force–displacement relationship of CFM can be obtained
$\theta$
equals zero, according to Eqs. (2) and (4), the force–displacement relationship of CFM can be obtained
 \begin{equation} \left\{\begin{array}{l}F=\sum_{i=1}^mF_{p_{\theta_i}}+ES\dfrac\varepsilon L\left(\dfrac\varepsilon L-\sin\theta\right)\left(\dfrac\varepsilon L-2\sin\theta\right)\\[5pt] F=F_n+F_p\end{array}\right.\end{equation}
2.3. Clamping process analysis
The clamping process of proposed CFFMG with overload protection is shown in Fig. 4. During operation of gripping brittle and fragile objects, the BTDAM amplifies PEA1’s displacement in Y direction to approach the object, as shown in Fig. 4(b). When position of jaws is ready, the SRDAM amplifies PEA2’s displacement in X direction to clamp the object, as shown in Fig. 4(b). The large clamping force on the object will trigger the CFM module through the leverage, as shown in Fig. 4(c). Thus, the overload protection is realized. The FEA results comparison is shown in Fig. 4(d), it can be concluded that clamping force
 $F_c$
applied on the object is 20.8 N, which is much smaller than the initial constant force
$F_c$
applied on the object is 20.8 N, which is much smaller than the initial constant force
 $F$
60.25 N.
$F$
60.25 N.
(a) To approach the object, (b) to clamp the object, (c) trigger CFM module to realize overload protection, (d) output constant force comparison before and after triggering CFM module.

2.4. BTDAM analysis
Compared with other displacement amplification mechanisms, the BTDAM takes benefits of large amplification ratio and compactness structure [Reference Lobontiu and Garcia26]. Therefore, the BTDAM is utilized as the displacement amplifying mechanism in CCFMG.
The PRBM with ideal hinges of BTDAM is shown in Fig. 5(a). The structural parameters of the BTDAM are shown in Fig. 5(b). Due to the bisymmetric structure, only a quarter of the analytical mechanism is analyzed [Reference Pinskier, Shirinzadeh, lark, Qin and Fatikow27, Reference Qi, Xiang, Fang, Zhang and Yu28].
 \begin{align} \begin{array}{l}R_{\mathrm{amp_ideal}}=\dfrac{h{\left\lbrack\ln{\!\left(\dfrac h{\sqrt{h^2+L_1^2}}\right)}-\ln\!{\left(\sin{\!\left(\arctan{\left(\dfrac h{L_1}\right)}-\dfrac{\mathrm\Delta x}h\right)}\right)}\right\rbrack}}{\mathrm\Delta x}\end{array}\end{align}
where
 $\Delta x$
denotes the input displacement,
$\Delta x$
denotes the input displacement,
 $h$
is the distance in the vertical direction between the two flexible hinges, and
$h$
is the distance in the vertical direction between the two flexible hinges, and
 $L_1$
is the horizontal distance between points
$L_1$
is the horizontal distance between points
 $A$
and
$A$
and
 $B$
. From the data in Fig. 4(b) combined with Eq. (6), it is obtained that
$B$
. From the data in Fig. 4(b) combined with Eq. (6), it is obtained that
 $R_{\mathrm{amp_ideal}}=6.22$
.
$R_{\mathrm{amp_ideal}}=6.22$
.
(a) Schematic model of BTDAM, (b) structural dimensions of BTDAM, (c) structural dimensions of SRDAM, (d) schematic model of SRDAM.

2.5. SRDAM analysis
The SRDAM can be regarded as an expansion of the slider-crank mechanism. The displacement amplification effect of the SRDAM guarantees the parallel motion of the clamp by producing a wide range of precise linear motion at the output point [Reference Tian, Shirinzadeh, Zhang and Alici29]. The schematic diagram of the circular flexible hinge-based SRDAM is shown in Fig. 5(c).
 $B$
is the displacement input point of the vvPEA,
$B$
is the displacement input point of the vvPEA,
 $C$
is a fixed hinge, and
$C$
is a fixed hinge, and
 $D$
is the displacement output point of the SRDAM [Reference Chen, Hsu and Fung30]. Let
$D$
is the displacement output point of the SRDAM [Reference Chen, Hsu and Fung30]. Let
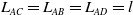 $L_{AC}={L_{AB}}={L_{AD}}=l$
and
$L_{AC}={L_{AB}}={L_{AD}}=l$
and
 ${\angle{DBC}}={\theta }$
. According to the trigonometric relationship, the coordinates of the
${\angle{DBC}}={\theta }$
. According to the trigonometric relationship, the coordinates of the
 $D$
can be derived
$D$
can be derived
 \begin{equation} \left \{\begin{array}{l}{x_D}^2+{y_B}^2=4l^2\\[5pt] y_D=0 \end{array} \right. \end{equation}
when moving
 $\Delta y_B$
along the Y-axis at input point
$\Delta y_B$
along the Y-axis at input point
 $B$
, there will be a corresponding distance
$B$
, there will be a corresponding distance
 $\Delta x_D$
at output point
$\Delta x_D$
at output point
 $D$
, i.e.
$D$
, i.e.
 \begin{equation} \begin{array}{l}{x_D}^2+{y_B}^2=(x_D+{\Delta }x_D)^2+(y_B+{\Delta }y_B)^2 \end{array} \end{equation}
Solving Eq. (8), the relationship between
 $\Delta y_B$
and
$\Delta y_B$
and
 ${\Delta }x_D$
can be obtained
${\Delta }x_D$
can be obtained
 \begin{equation} \begin{array}{l}{\Delta }x_D=-x_D+\sqrt{{x_D}^2-2y_B\Delta y_B-{{\Delta }y_B}^2} \end{array} \end{equation}
As
 ${\Delta }y_B{\to }0$
, then the displacement amplification ratio
${\Delta }y_B{\to }0$
, then the displacement amplification ratio
 $\eta _1$
can be denoted as
$\eta _1$
can be denoted as
 \begin{align} \eta_1=\frac{\mathrm\Delta x_D}{\mathrm\Delta y_B}\approx\frac{dx_D}{dy_B}=-\frac{y_B}{\sqrt{4l^2-y_B^2}}=-\frac{y_B}{x_D}=-\cot\theta \end{align}
From Eq. (10), it can be derived that the
 $\eta _1$
is 3.98. The negative sign indicates that
$\eta _1$
is 3.98. The negative sign indicates that
 $\Delta y_B$
and
$\Delta y_B$
and
 $\Delta x_D$
are approximately inversely proportional.
$\Delta x_D$
are approximately inversely proportional.
3. FEA simulation
To validate the analysis model developed in the previous section, FEA were performed using the ANSYS Workbench to test the performance of the structure. The structure is made of ABS material, which is widely used in 3D printing. The specific material properties are shown in Table I.
ABS material properties

3.1. FEA of BTADM
The BTDAM is mainly utilized to amplify the output displacement of the PEA1. The enlarged view in Fig. 6 shows two different BTDAMs with the same thickness and length of the flexible hinge. Fig. 6(a) and (b) shows the different displacement amplifications, maximum stresses, and corresponding natural frequencies obtained for the BTDAM with circular and leaf-shaped flexible hinges, respectively, with the same input displacement. The leaf-shaped flexible hinge has a greater range of rotation than the circular flexible hinge. Thus, the leaf-shaped BTDAM typically has a large output displacement, as displayed in Fig. 5(b). From Eq. (6), the theoretical amplification ratio of the BTDAM of structural analysis can be derived. The simulation of the BTDAM is shown in Fig. 6(b) with the input displacement of 45
 ${\unicode[Times]{x03BC}}\mathrm{m}$
. The maximum deformation in the output direction is 315.88
${\unicode[Times]{x03BC}}\mathrm{m}$
. The maximum deformation in the output direction is 315.88
 ${\unicode[Times]{x03BC}}\mathrm{m}$
. Therefore, the displacement amplification
${\unicode[Times]{x03BC}}\mathrm{m}$
. Therefore, the displacement amplification
 $R_{sb}$
of BTDAM can be obtained:
$R_{sb}$
of BTDAM can be obtained:
 $R_{sb}={\Delta y}/{\Delta x}={315.88}/{45}=7.02$
.
$R_{sb}={\Delta y}/{\Delta x}={315.88}/{45}=7.02$
.
(a) The BTDAM with circular-shaped hinges, (b) the SRDAM with leaf-shaped hinges, (c) the SRDAM with circular-shaped hinges, (d) the SRDAM with leaf-shaped hinges.

3.2. FEA of SRDAM
The SRDAM has two functions, one is to control the motion of the clamping arm through displacement amplification and realize the clamping and releasing of the object. Another role is to act as a pivot point for leverage, a clamp that achieves constant force through leverage. The enlarged view in Fig. 6 shows two different SRDAMs with the same thickness and length of the flexible hinge. Fig. 6(c) and (d) shows the different displacement amplifications, maximum stresses, and corresponding natural frequencies obtained for the SRDAM with circular and leaf-shaped flexible hinges, respectively. Leaf-shaped flexible hinges have a greater range of rotation than right circular flexible hinges. However, the leaf-shaped SRDAM has a lower natural frequency, which reduces the stability and bandwidth during operation and can result in a more pronounced hysteresis of the microgripper, increasing the control difficulty. Therefore, the circular-shaped flexible hinge is selected as the connecting hinge of the SRDAM. The amplification ratio of theoretical amplification can be obtained by Eq. (10). The simulation analysis of the SRDAM is shown in Fig. 6(c), the input displacement is 45
 ${\unicode[Times]{x03BC}}\mathrm{m}$
, and the maximum displacement at the output side can be seen in Fig. 6(c). Therefore, the displacement amplification
${\unicode[Times]{x03BC}}\mathrm{m}$
, and the maximum displacement at the output side can be seen in Fig. 6(c). Therefore, the displacement amplification
 $R_{ss}$
of SRDAM can be obtained:
$R_{ss}$
of SRDAM can be obtained:
 $R_{ss}={\Delta y}/{\Delta x}={135.07}/{45}=3$
.
$R_{ss}={\Delta y}/{\Delta x}={135.07}/{45}=3$
.
3.3. Output displacement of the CCFMG clamps
Output displacement of the CCFMG clamp is simulated by ANSYS Workbench. Because the maximum stroke of the selected PEA is 45
 ${\unicode[Times]{x03BC}}\mathrm{m}$
, the maximum input and output displacements of PEA1 and PEA2 are 45
${\unicode[Times]{x03BC}}\mathrm{m}$
, the maximum input and output displacements of PEA1 and PEA2 are 45
 ${\unicode[Times]{x03BC}}\mathrm{m}$
. The PEA2 applies 45
${\unicode[Times]{x03BC}}\mathrm{m}$
. The PEA2 applies 45
 ${\unicode[Times]{x03BC}}\mathrm{m}$
stroke at the displacement input of SRDAM, the displacement of a single clamp of the CCFMG in the X-direction after amplification can be obtained, as shown in Fig. 7(a). From the simulation analysis results of FEA, the maximum displacement of a single clamp is 390.67
${\unicode[Times]{x03BC}}\mathrm{m}$
stroke at the displacement input of SRDAM, the displacement of a single clamp of the CCFMG in the X-direction after amplification can be obtained, as shown in Fig. 7(a). From the simulation analysis results of FEA, the maximum displacement of a single clamp is 390.67
 ${\unicode[Times]{x03BC}}\mathrm{m}$
, then the total displacement distance of the two clamps is 781.34
${\unicode[Times]{x03BC}}\mathrm{m}$
, then the total displacement distance of the two clamps is 781.34
 ${\unicode[Times]{x03BC}}\mathrm{m}$
. The total displacement amplification ratio in the X-direction is 17.36. Similarly, PEA1 applies 45
${\unicode[Times]{x03BC}}\mathrm{m}$
. The total displacement amplification ratio in the X-direction is 17.36. Similarly, PEA1 applies 45
 ${\unicode[Times]{x03BC}}\mathrm{m}$
stroke at the displacement input of BTDAM, then the stroke of CCFMG in the Y-direction can be obtained as shown in Fig. 7(b). The total stroke of the clamp of CCFMG in the Y-direction is 258.05
${\unicode[Times]{x03BC}}\mathrm{m}$
stroke at the displacement input of BTDAM, then the stroke of CCFMG in the Y-direction can be obtained as shown in Fig. 7(b). The total stroke of the clamp of CCFMG in the Y-direction is 258.05
 ${\unicode[Times]{x03BC}}\mathrm{m}$
, and the displacement amplification ratio is 5.73.
${\unicode[Times]{x03BC}}\mathrm{m}$
, and the displacement amplification ratio is 5.73.
(a) Maximum movement of each jaw in the X-direction for CCFMG, (b) maximum motion of CCFMG in the Y-direction, (c) maximum stress analysis of CCFMG.

In Table II,
 $R_{\mathrm{SRDAM}}$
and
$R_{\mathrm{SRDAM}}$
and
 $R_{\mathrm{BTDAM}}$
are the displacement amplification rates of SRDAM and BTDAM, respectively.
$R_{\mathrm{BTDAM}}$
are the displacement amplification rates of SRDAM and BTDAM, respectively.
 $R_{\mathrm{X_CCFMG}}$
and
$R_{\mathrm{X_CCFMG}}$
and
 $R_{\mathrm{Y_CCFMG}}$
are the total displacement amplification of the CCFMG system in the X and Y directions, respectively. Since there is only one BTDAM displacement amplification mechanism in the Y-direction, the displacement amplification ratio of the CCFMG in the Y-direction is the same as that of the BTDAM. The displacement amplification ratio of SRDAM has the largest error. This is because the increment of displacement in the X-direction is ignored in the model of the theoretical displacement amplification ratio of SRDAM, resulting in insufficient accuracy of the theoretical analysis model.
$R_{\mathrm{Y_CCFMG}}$
are the total displacement amplification of the CCFMG system in the X and Y directions, respectively. Since there is only one BTDAM displacement amplification mechanism in the Y-direction, the displacement amplification ratio of the CCFMG in the Y-direction is the same as that of the BTDAM. The displacement amplification ratio of SRDAM has the largest error. This is because the increment of displacement in the X-direction is ignored in the model of the theoretical displacement amplification ratio of SRDAM, resulting in insufficient accuracy of the theoretical analysis model.
Amplification ratio comparisons

3.4. Stress analysis
The Fig. 7(c) presents the equivalent stress produced by CCFMG when PEA1 and PEA2 are simultaneously excited for 45
 ${\unicode[Times]{x03BC}}\mathrm{m}$
. The maximum equivalent stress is 5.601 MPa, which is significantly lower than the tensile strength of the material. The displacements applied to the BTDAM and SRDAM inputs vary simultaneously. The maximum stress of CCFMG is shown in Fig. 7(c). While the PEA1 and PEA2 work together, the equivalent stress will continue to increase as well. Therefore, the safety factor is reduced when the two actuators are operated together and the displacement is large. The safety factor is calculated by
${\unicode[Times]{x03BC}}\mathrm{m}$
. The maximum equivalent stress is 5.601 MPa, which is significantly lower than the tensile strength of the material. The displacements applied to the BTDAM and SRDAM inputs vary simultaneously. The maximum stress of CCFMG is shown in Fig. 7(c). While the PEA1 and PEA2 work together, the equivalent stress will continue to increase as well. Therefore, the safety factor is reduced when the two actuators are operated together and the displacement is large. The safety factor is calculated by
 $n_{\mathrm{fos}}=\mathrm{yield\;strength}/\mathrm{tensible\;strength}$
.
$n_{\mathrm{fos}}=\mathrm{yield\;strength}/\mathrm{tensible\;strength}$
.
In the worst-case scenario, the minimum safety factor is 8.93 when PEA1 and PEA2 output simultaneously 45
 ${\unicode[Times]{x03BC}}\mathrm{m}$
. If the presented CCFMG is applied to grasp micro-objects, the object size is inversely proportional to the maximum stress of the mechanism, since smaller objects require larger gripping clamp displacements.
${\unicode[Times]{x03BC}}\mathrm{m}$
. If the presented CCFMG is applied to grasp micro-objects, the object size is inversely proportional to the maximum stress of the mechanism, since smaller objects require larger gripping clamp displacements.
3.5. Coupling motion analysis
In this section, decoupling analysis are performed. When applied a input 45
 ${\unicode[Times]{x03BC}}\mathrm{m}$
displacement on PEA2, the displacement in the X-direction is its working stroke, and displacement along Y-direction is coupling displacement. The corresponding output displacement of individual jaw is shown in Fig. 8(a). It demonstrates that the coupling displacement in the X-direction is 4.21
${\unicode[Times]{x03BC}}\mathrm{m}$
displacement on PEA2, the displacement in the X-direction is its working stroke, and displacement along Y-direction is coupling displacement. The corresponding output displacement of individual jaw is shown in Fig. 8(a). It demonstrates that the coupling displacement in the X-direction is 4.21
 ${\unicode[Times]{x03BC}}\mathrm{m}$
. Similarly, when applied a 45
${\unicode[Times]{x03BC}}\mathrm{m}$
. Similarly, when applied a 45
 ${\unicode[Times]{x03BC}}\mathrm{m}$
input displacement on the PEA1, the output displacement in Y-direction is shown in Fig. 8(b). The maximum parasitic displacement in X-direction is 2.18
${\unicode[Times]{x03BC}}\mathrm{m}$
input displacement on the PEA1, the output displacement in Y-direction is shown in Fig. 8(b). The maximum parasitic displacement in X-direction is 2.18
 ${\unicode[Times]{x03BC}}\mathrm{m}$
. The coupling rates in X-direction and Y-direction are 1.1% and 0.9%, respectively. It can be concluded from FEA results that the proposed CCFMG possesses low coupling ratio.
${\unicode[Times]{x03BC}}\mathrm{m}$
. The coupling rates in X-direction and Y-direction are 1.1% and 0.9%, respectively. It can be concluded from FEA results that the proposed CCFMG possesses low coupling ratio.
Coupling analysis (a) coupling displacement in Y-direction, (b) coupling displacement in X-direction.

3.6. Modal analysis
In addition, modal simulations were performed to examine the dynamic performance of the CCFMG structure in terms of resonance modes and frequencies of the CCFMG structure. The simulation results of the six resonance modes are shown in Table III. It can be seen that the first frequency of the CCFMG is 107.16 Hz. The high natural frequency enables the CCFMG device to respond quickly.
The first-six resonant frequencies

From the simulation results, it can be seen that the purpose of the design has been achieved. The CCFMG can provide both a wide range of output and approximate linear motion. The rectilinear movement is useful for grasping various particles in practice.
4. Optimization study
Before conducting parameter optimization, the parameters of CFM must be analyzed to determine the key parameters affecting CFM characteristics. The parameters of the CFM are the length
 $L$
, thickness
$L$
, thickness
 $t_b$
, angle
$t_b$
, angle
 $\beta$
of the bi-stable beam, and the Z-beam length
$\beta$
of the bi-stable beam, and the Z-beam length
 $l_1$
,
$l_1$
,
 $l_2$
,
$l_2$
,
 $l_3$
thickness
$l_3$
thickness
 $t_z$
. When analyzing the parameters of the Z-beam, the parameters of the bi-stable beam are kept constant. Let
$t_z$
. When analyzing the parameters of the Z-beam, the parameters of the bi-stable beam are kept constant. Let
 $l_1=l_3$
, when
$l_1=l_3$
, when
 $t_z$
is kept constant, as
$t_z$
is kept constant, as
 $l_1$
changes,
$l_1$
changes,
 $l_2$
changes accordingly. It is concluded that the independent parameters of the Z-beam are
$l_2$
changes accordingly. It is concluded that the independent parameters of the Z-beam are
 $l_2$
and
$l_2$
and
 $t_z$
. In contrast, when the parameters of the Z-beam are constant, the
$t_z$
. In contrast, when the parameters of the Z-beam are constant, the
 $L$
changes correspondingly when the
$L$
changes correspondingly when the
 $\beta$
of the bi-stable beam is changed. Therefore, the independent parameters of the bi-stable beam are
$\beta$
of the bi-stable beam is changed. Therefore, the independent parameters of the bi-stable beam are
 $\beta$
and
$\beta$
and
 $t_b$
. To sum up, the main structural parameters affecting the CFM are
$t_b$
. To sum up, the main structural parameters affecting the CFM are
 $t_b$
,
$t_b$
,
 $\beta$
,
$\beta$
,
 $l_2$
,
$l_2$
,
 $t_z$
. Before parameter optimization, the FEA can be used to analyze the influence of four main structural parameters on the CFM characteristics.
$t_z$
. Before parameter optimization, the FEA can be used to analyze the influence of four main structural parameters on the CFM characteristics.
When a parameter is analyzed, the other parameters should remain unchanged.
Referring to the Fig. 9(a), with increasing the angle of
 $\beta$
from 6
$\beta$
from 6
 $^{\circ }$
to 12
$^{\circ }$
to 12
 $^{\circ }$
, the characteristics of the bi-stable state become more and more obvious, and subsequently, the magnitude and stroke of the CFM will also increase correspondingly.
$^{\circ }$
, the characteristics of the bi-stable state become more and more obvious, and subsequently, the magnitude and stroke of the CFM will also increase correspondingly.
The influence of
 $\beta$
,
$\beta$
,
 $t_b$
,
$t_b$
,
 $l_2$
,
$l_2$
,
 $t_z$
on the constant force properties of the CFM.
$t_z$
on the constant force properties of the CFM.

In Fig. 9(b), the thickness
 $t_b$
is increased from 0.6 mm to 1.4 mm with a spacing of 0.2 mm. It can be discovered that
$t_b$
is increased from 0.6 mm to 1.4 mm with a spacing of 0.2 mm. It can be discovered that
 $t_b$
has the most significant effect on the characteristics of CFM compared to the other three parameters. With increasing of
$t_b$
has the most significant effect on the characteristics of CFM compared to the other three parameters. With increasing of
 $t_b$
, the magnitude and stroke of the CFM will also increase.
$t_b$
, the magnitude and stroke of the CFM will also increase.
The effect of thickness
 $t_z$
on the CFM properties can be studied in Fig. 9(c). The thickness
$t_z$
on the CFM properties can be studied in Fig. 9(c). The thickness
 $t_z$
is increased from 0.8 mm to 1.6 mm with 0.2 mm space. Referring to the Fig. 9(c), stroke and force magnitude of the CFM increased correspondingly with increased
$t_z$
is increased from 0.8 mm to 1.6 mm with 0.2 mm space. Referring to the Fig. 9(c), stroke and force magnitude of the CFM increased correspondingly with increased
 $t_z$
.
$t_z$
.
Figure 9(d) shows the effect of changed the
 $l_2$
on the characteristics of the CFM. The length
$l_2$
on the characteristics of the CFM. The length
 $l_2$
increased from 4 mm to 12 mm, with 2 mm interval. It can be learned that with increased of the length
$l_2$
increased from 4 mm to 12 mm, with 2 mm interval. It can be learned that with increased of the length
 $l_2$
, the constant force stroke and magnitude of the CFM are decreased.
$l_2$
, the constant force stroke and magnitude of the CFM are decreased.
To make the optimization results more accurate, the response surface optimization module in the ANSYS Workbench optimization module was selected to enable real-time transfer and calculation of data with the static structure analysis module. The optimization process is shown in Fig. 10. Before performing the optimization, it is necessary to define the relationship between the parameters of the mechanical structure and the maximum and minimum values of the parameters.
Optimization process.

There are two main parameters to measure the performance of the constant force mechanism, namely, the magnitude and stroke range of the constant force. In this paper, obtaining large constant force stroke is our main purpose.
Since constant-force stroke (CFS) of CFM cannot be measured directly, the CFS is introduced, which defined as the product of CFM stroke and input displacement. Because the input displacement of CFM is constant, the stroke of CFM is proportional to CFS. Furthermore, the total deformation maximum (TDM) and equivalent stress maximum (ESM) were also selected as parameter optimization targets.
In general, the more sample design points, the more accurate the optimization results can be obtained. First, a custom sampling method was used to design the experiment for the four parameters, and the total number of samples was set to 1200. After finite element calculation, the effective samples were 1193. Second, response surface analysis is performed on the effective samples obtained from the calculation, and the fitted relationship between the calculated observations of the target parameters and the response surface predictions can be obtained, as shown in Fig. 11. It can be observed that the observed from the design point is consistent with the predicted from the response surface.
The fitting curves of predicted and observed values.

Simultaneously, the trend of the influence of different structural parameters on the optimization objective can be obtained from the response surface analysis. The results of the analysis of the relationship between the specific parameters are presented in Fig. 12.
Response surface of CFS and ESM with respect to parameters of
 $\beta$
,
$\beta$
,
 $t_b$
,
$t_b$
,
 $l_2$
,
$l_2$
,
 $t_z$
.
$t_z$
.

According to Fig. 12, it can be concluded as follows:
-
1. In Fig. 12(a) and (b), increasing
 $t_b$
and
$\beta$
induces an increase in ESM, increasing
$l_2$
causes CFS to decrease. Moreover, the increase of
$t_z$
has almost no effect on ESM.
$t_b$
and
$\beta$
induces an increase in ESM, increasing
$l_2$
causes CFS to decrease. Moreover, the increase of
$t_z$
has almost no effect on ESM. -
2. In Fig. 12(c) and (d), to increase
$t_z$
causes CFS to increase, increasing
$t_b$
causes CFS to decrease. Moreover, the increase in
$\beta$
had almost no impact on CFS.


It can be demonstrated that different structural parameters have different degrees of influence on the optimization objectives from response surface analysis. In the meantime, sensitivity analysis between structural parameters and optimization target parameters is also provided in response surface analysis, as shown in Fig. 13. It can be observed that the four structural parameters have positive and negative effects on the target parameters. The effects of a single structural parameter on CFS and TDM are the same, and
 $t_b$
has the most impact on the two target parameters. The effect of
$t_b$
has the most impact on the two target parameters. The effect of
 $\beta$
on the target parameters is minimal.
$\beta$
on the target parameters is minimal.
Sensitivity analysis of parameters.

The optimization goals must be set prior to the optimization process. The optimization objectives are to maximize CFS and TDM as well as to minimize ESM. A multiobjective genetic algorithm is available in the module for response surface optimization. This kind of method is suitable to solve multiple inputs and multiple outputs optimization issues, recommending the optimal combinations of structural parameters, obtaining the relationship between the target parameters and optimized parameters. According to the optimization objective, three groups of candidate points for optimal results can be obtained, as shown in Fig. 14.
Optimization candidate points.

The optimization system gives three groups of candidate points. First, according to the candidate points, the 3D-model was made up and conducted the static structural in the ANSYS. After comparing the constant force characteristics of the structures constructed from the three groups of sample points, the second group was selected as the final optimal result because it has a longer constant force travel compared to the other two groups. The specific parameters of the second group of optimized values are shown in Table IV.
Obtained optimized values

Constant force curves comparison with optimized parameters and initial parameters are presented in Fig. 15. Referring to the obtained results, the CFS is increased from 1.6 mm to 3 mm after optimization conducted. Although the magnitude of the constant force is smaller, the stroke of the constant force increases more obviously. A larger constant force travel means that the CCFMG is able to grip larger objects, which is more important for CCFMG. The optimized results verified that the multiobjective genetic algorithm is very effective.
Results comparison.

5. Conclusions
A serial decoupled 2-DOF CCFMG is proposed in this paper. Each clamp arm is integrated with a CFM module which formed by NSM and bi-stable beam to achieve a constant clamping force and provide overload protection for fragile objects. Considering PEA’s limited stroke, BTDAM and SRDAM were integrated in the design. It can be concluded that stroke of the CCFMG in the gripping direction is 781.34
 ${\unicode[Times]{x03BC}}\mathrm{m}$
, and the total magnification ratio is 17.36. The stroke in Y-direction is 258.05
${\unicode[Times]{x03BC}}\mathrm{m}$
, and the total magnification ratio is 17.36. The stroke in Y-direction is 258.05
 ${\unicode[Times]{x03BC}}\mathrm{m}$
. The average constant force of the clamp is 37.49 N. The total maximum equivalent stress is 5.601 MPa. Finally, FEA-based optimization was used to identify optimal parameters of CFM for obtaining large stroke. Compared to the initial parameters, the constant force range of the optimized CFM increased from 1.6 mm to 3 mm, an increase of 87.5%.
${\unicode[Times]{x03BC}}\mathrm{m}$
. The average constant force of the clamp is 37.49 N. The total maximum equivalent stress is 5.601 MPa. Finally, FEA-based optimization was used to identify optimal parameters of CFM for obtaining large stroke. Compared to the initial parameters, the constant force range of the optimized CFM increased from 1.6 mm to 3 mm, an increase of 87.5%.
Author contributions
Ye Shan and Bingxiao Ding conceived and designed this study. Ye Shan conducted data gathering, performed statistical analysis, and wrote the article. Bingxiao Ding, Yangmin Li and Jianhua Zhong revised the manuscript, obtained fund, and supervised the study. All authors have read and agreed to the published version of the manuscript.
Financial support
This work was supported by the Huxiang High-Level Talent Project of Hunan Province (Grant No. 2019RS1066), the State Key Laboratory of Ultra-precision Machining Technology of Hong Kong Polytechnic University (Project No. UAPM).
Conflicts of interest
The authors declare no conflicts of interest exist.


 Open access