


1. Introduction
Engineering teams in industry are creating mass amounts of data every day. Teams worldwide are adopting new online communication software for information sharing, documentation, project management, collaboration, and decision making. Enterprise social network messaging platforms, like Slack, have become a staple tool for student and industry engineers alike, with tens of millions of users (Novet Reference Novet2019). From the researcher’s perspective, these software platforms unlock big data for quantitative analysis of design team communication and collaboration, from which we can identify patterns of virtual communication content, timing, and organisation.
With the accessibility of large corpora of text-based communication, it is possible to apply modern natural language processing (NLP) tools, like topic modelling, to glean detailed insight on real-world engineering design activities. These techniques provide a nonintrusive way to study design activities, for teams of any size, in real time. However, traditional topic modelling techniques rely on long documents in order to measure the probability of word co-occurrences, whereas communication through enterprise social networking platforms is characterised by short chat, therefore failing a number of the assumptions which underlie the applicability of traditional topic modelling. To combat this, recent computer science researchers have developed short text topic modelling (STTM) as a technique for analysing short-text data, relying on the assumption of one topic per document (Yin & Wang Reference Yin and Wang2014). STTM, therefore, has the potential to reveal trends from enterprise social network data that otherwise are unattainable.
Here, we present an exploratory study of the potential for STTM, applied to engineering designer communication, to uncover patterns throughout the engineering design process. Specifically in this work, we present a case study of this method applied to measuring convergence and divergence throughout the engineering design process. Many theories of the engineering design process discuss some form of convergence and divergence (Dym et al. Reference Dym, Agogino, Eris, Frey and Leifer2005; Design Council 2015; Wegener & Cash Reference Wegener and Cash2020). Studies have shown that designers diverge and converge in a double diamond pattern; once to determine the problem and again to determine the solution (Design Council 2015), while others claim that designers must first converge on each question before diverging to answer it (Dym et al. Reference Dym, Agogino, Eris, Frey and Leifer2005). It has been shown that cycling through convergence and divergence leads to better design outcomes (Adams & Atman Reference Adams and Atman2000; Song, Dong & Agogino Reference Song, Dong and Agogino2003); however, it is challenging to measure these design patterns in uncontrolled settings.
Our dataset comprises 250,000 messages and replies sent by 32 teams, representing four cohorts of teams enrolled in a 3-month intensive product design course. Using this dataset, our case study is motivated by the main research questions: Over the course of the design process, how does team communication reflect convergence and divergence? Does this trend differ between teams with strong and weak performance? We address these research questions first using quantitative measures, followed by an in-depth qualitative analysis.
We build STTMs for each team and phase of the product design process and compare the metrics of these models. We hypothesised that we would find fewer, more coherent, topics in phases that are typically convergent, and the opposite for divergent phases. We found evidence of convergence and divergence cycles throughout the design process, as previously shown in controlled lab studies, as measured by both the number of topics found and the coherence of these topics. Teams presented divergent characteristics at the beginning of the design process, and slowly converged up to the phase where they select their final product idea. Teams diverged again as they determined how to build their product, and converged in the final phase where they present their work. Additionally, we found that Strong teams have fewer topics in their topic models than Weak teams do. In order to better understand teams’ communication patterns, we qualitatively identified the topic categories for 16 teams in one convergent and one divergent phase. We found that teams discuss high-level themes such as Product, Project, Course, and Other, with Product being the most common. We identified that divergent phases discuss the product Functions, Features, Manufacturing, and Ergonomics more often than convergent phases. We found evidence that the teams often use Slack for planning and coordination of meetings and deliverables. These findings, although applied to student teams in this context, show the possibility to validate previous design process theories in industry teams by analysing the mass amounts of data that they are already creating on a daily basis.
The rest of this article is organised as follows. We begin by reviewing background information regarding communication in product design, convergence and divergence in the product design process, and finally previous topic modelling work in the field of product design. We then present our topic modelling methodology, and report on both quantitative and qualitative results of our case study. We then discuss the suitability of STTM as a method in this context, and conclude with a discussion of the limitations of this study and areas for future research.
2. Background
In this section, we begin by overviewing engineering communication patterns, followed by reviewing theories of convergence and divergence in the engineering design process, and concluding with a discussion of topic modelling and how it has been used in previous product design research.
2.1. Engineering and product development communication
Team communication is characterised as information exchange, both verbal and nonverbal, between two or more team members (Adams Reference Adams2007; Mesmer-Magnus & DeChurch Reference Mesmer-Magnus and DeChurch2009). Team communication is integral to a majority of team processes or the interdependent team behaviours that lead to outcomes, such as performance (Marks, Mathieu & Zaccaro Reference Marks, Mathieu and Zaccaro2001). Common across studies of team effectiveness is the ability of high performing teams to effectively communicate, as compared to lower performing teams (Kastner et al. Reference Kastner, Entin, Castanon, Sterfaty and Deckert1989). Communication is found to be positively correlated with team success (Mesmer-Magnus & DeChurch Reference Mesmer-Magnus and DeChurch2009), and the quality of communication is a better predictor of team success than the frequency of communication (Marks, Zaccaro & Mathieu Reference Marks, Zaccaro and Mathieu2000).
Researchers have studied product design communication in many contexts. In a study of engineering email use, Wasiak et al. (Reference Wasiak, Hicks, Newnes, Dong and Burrow2010) found that engineers use emails to discuss the product, project, and company; they send emails for the purpose of problem solving, informing, or managing; and they express this content by using positive reactions, negative reactions, or sharing and requesting tasks. Researchers have also found that two-thirds of design team communication is content-related, while about one-third is process-related (Stempfle & Badke-Schaub Reference Stempfle and Badke-Schaub2002). Part of process discussion is coordination, and a recent study found that engineers follow two different coordination strategies in complex designs: authority based, and empathetic leadership (Collopy, Adar & Papalambros Reference Collopy, Adar and Papalambros2020). Following these findings, we expect to see significant process- and product-related topics in our topic models given the hybrid nature of these teams. Additional studies of designer communication have found that users with high technical skills used technical design words at a lower rate, and teams use repeated phrases linked to domain-related topics to communicate design changes (Ungureanu & Hartmann Reference Ungureanu and Hartmann2021).
Broadly speaking, researchers have studied the use of collaborative virtual technologies – many of which are used for communication – and their impact on team performance (Easley, Devaraj & Crant Reference Easley, Devaraj and Crant2003; Hulse et al. Reference Hulse, Tumer, Hoyle and Tumer2019). Collaborative systems have been found to be positively associated with team performance for creativity tasks, but not in decision making tasks (Easley et al. Reference Easley, Devaraj and Crant2003). Recent studies have found that, while online messaging platforms promote transparency and team awareness, they also can result in excessive communication and unbalanced activity among team members (Stray, Moe & Noroozi Reference Stray, Moe and Noroozi2019). Particularly on the data of interest, a preliminary analysis by Van de Zande (Reference Van de Zande2018) found that some successful teams have more consistent and organised, although less frequent, communication patterns. Research shows that digitization is changing the design process itself, as the multiple volumes, formats, and sources of data can lead to inconsistency and lack of convergence, especially between physical and digital domains (Cantamessa et al. Reference Cantamessa, Montagna, Altavilla and Casagrande-Seretti2020). This is especially important for our work as the teams studied use hybrid tools, and thus need to merge information from online and inperson contexts.
Montoya et al. (Reference Montoya, Massey, Hung and Crisp2009) studied the use of nine types of information communication technology and found that instant messaging was already being integrated in product design organisations in 2009. Despite its established usage in product design firms, enterprise social networking software, otherwise known as instant messaging, is under-studied in the literature. Brisco, Whitfield & Grierson (Reference Brisco, Whitfield and Grierson2020) created a categorisation of computer-supported collaborative design requirements, and cited that communication channels, specifically those that allow for social interaction such as instant messaging, can reduce interpersonal barriers and thus influence engineering teamwork. For social communication, when given the choice, student design teams preferred to use Facebook, WhatsApp or Instagram, as opposed to Slack which was used to discuss project work (Brisco, Whitfield & Grierson Reference Brisco, Whitfield and Grierson2017). When analysing global student design teams, researchers found that students chose to use social networking sites to have a central place to store information free of charge, to have multiple conversation threads happening at once, and because they often used these tools daily anyways (Brisco, Whitfield & Grierson Reference Brisco, Whitfield and Grierson2018). These social networking tools provided a semi-synchronous system that allowed quick feedback on design sketches and the ability to vote on design concepts, but sometimes overwhelmed students with notifications (Brisco et al. Reference Brisco, Whitfield and Grierson2018). Students strongly believe that they will need to use social networking tools in their future careers (Brisco et al. Reference Brisco, Whitfield and Grierson2017). In other contexts, researchers have examined the use of Slack by software development teams (Lin et al. Reference Lin, Zagalsky, Storey and Serebrenik2016; Stray et al. Reference Stray, Moe and Noroozi2019) and Information Technology enterprises (Wang et al. Reference Wang, Wang, Yu, Ashktorab and Tan2019), but not in product design teams. It is clear that communication is a critical component in engineering design, and this communication is becoming increasingly virtual. Our work hopes to suggest how this virtual communication can be used to answer critical design process questions.
2.2. Convergence and divergence in product design processes
Let us consider two main design process models: the double diamond model, which represents design as a series of convergent and divergent cycles (Design Council 2015), and the co-evolution model, which claims that design is refining both the problem and the solution together, with the goal of creating a matching problem-solution pair (Dorst & Cross Reference Dorst and Cross2001). The double diamond method was developed by the Design Council in 2005, and contains four phases: discover, define, develop and deliver (Design Council 2015). The discover phase contains divergent thoughts when teams ask initial questions; the define phase is convergent as teams filter through ideas; the develop phase is divergent as teams use creative methods to bring a concept to life; and the deliver stage is convergent as teams test and sign off on final products. Contrary to the double diamond model, the co-evolution model of design argues that creative design moves iteratively between the problem space and the solution space, and is not simply defining the problem and then addressing the solution (Dorst & Cross Reference Dorst and Cross2001).
Convergence and divergence have emerged as part of the study of design from a process perspective, or analysing design over time (Wegener & Cash Reference Wegener and Cash2020). Within the idea of design as a series of convergence and divergence, work has drawn on Aristotle’s question hierarchy, stating that design teams first need to ask lower-level questions and converge on their understanding of the problem and design constraints, before they can diverge and ask the open-ended questions needed to ideate (Dym et al. Reference Dym, Agogino, Eris, Frey and Leifer2005). Two types of design processes – the traditional staged process, and the newer spiral process – differ in their frequency of cross-phase iteration: meaning how often designers revisit a previous design phase (Unger & Eppinger Reference Unger and Eppinger2011). Traditional phases can be thought of as either convergent or divergent, with ideation being a divergent phase and detail design being a convergent phase. Thus, the ability to automatically identify convergence and divergence of a team may be a first step in automatically tracking design activity (Dong Reference Dong2004). Even condensed design processes, such as those that occur during hackathons, have been shown to follow a similar pattern of convergence and divergence (Flus & Hurst Reference Flus and Hurst2021).
As engineering design problems are ambiguous and ill-structured, the understanding of the problem and possible solutions evolve throughout iteration (Adams & Atman Reference Adams and Atman2000). Iterative activities represent a designer responding to new information and completing problem scoping, which can be thought of as diverging, and then working through solution revisions, which can be thought of as converging (Adams & Atman Reference Adams and Atman2000). These frequent transitions have been shown to lead to higher-quality designs (Adams & Atman Reference Adams and Atman2000). Similarly, researchers have also found evidence that teams whose oral and written histories demonstrate cyclical latent semantic coherence throughout the product design process have better design outcomes (Song et al. Reference Song, Dong and Agogino2003). Cycles of convergence and divergence are present in various models of the engineering design process and have been shown to lead to high-quality designs; we explore the possibility of validating these models by detecting these cycles automatically from communication data.
2.3. NLP in product design
Using modern machine learning techniques to both understand and replicate human design processes is a growing area of research (Rahman, Xie & Sha Reference Rahman, Xie and Sha2021). To understand which designer activities occur during the design process, qualitative coding is often used (Neramballi, Sakao & Gero Reference Neramballi, Sakao and Gero2019), which is time consuming and thus cannot be applied to large amounts of data. The use of NLP methods is an alternative. Already, design researchers are using NLP techniques to extract frequent expressions used in design sessions and determine designer intent (Ungureanu & Hartmann Reference Ungureanu and Hartmann2021).
Specifically, topic modelling has been used in product design for studying the impact of various interventions on design (Fu, Cagan & Kotovsky Reference Fu, Cagan and Kotovsky2010; Gyory, Kotovsky & Cagan Reference Gyory, Kotovsky and Cagan2021a), to comparing human and AI teams (Gyory et al. Reference Gyory, Song, Cagan and McComb2021b), to analysing capstone team performance (Ball, Bessette & Lewis Reference Ball, Bessette and Lewis2020), to visualising engineering student identity (Park et al. Reference Park, Starkey, Choe and McComb2020), to deriving new product design features from online reviews (Song et al. Reference Song, Meinzer, Agrawal and McComb2020; Zhou et al. Reference Zhou, Ayoub, Xu and Yang2020) and identifying areas for cross-domain inspiration (Ahmed & Fuge Reference Ahmed and Fuge2018). By plotting a design team’s topic mixtures before and after a manager intervention, Gyory et al. (Reference Gyory, Kotovsky and Cagan2021a) were able to measure the result of the design intervention and whether it helped to bring the team back on track. Similarly, Fu et al. (Reference Fu, Cagan and Kotovsky2010) measured the cosine similarity between each team member’s topics to identify the impact that sharing a good or bad example solution had on the team’s convergence to one design idea, and ultimately, their design quality.
Traditional topic models such as Latent Dirichlet Allocation (LDA) were built for, and perform best, when the corpus upholds the assumption that a document contains a distribution over many topics. For example, benchmark datasets often used when evaluating topic models are comprised of many news articles or scientific publications (Röder, Both & Hinneburg Reference Röder, Both and Hinneburg2015). These documents are significantly longer than most messages that would be sent using instant messaging software. Thus, STTM algorithms, such as the Gibbs sampling algorithm for a Dirichlet Mixture Model (GDSMM) used here, present an adaption to the assumptions that allows shorter text documents to be analysed, and have proven more accurate in these cases (Mazarura & de Waal Reference Mazarura and de Waal2017; Qiang et al. Reference Qiang, Qian, Li, Yuan and Wu2019). These algorithms have been applied to news headlines, tweets, and other social media messages (Yin & Wang Reference Yin and Wang2014). Other researchers opt to analyse short-text using a pretrained topic model, trained on long document datasets (Cai et al. Reference Cai, Eagan, Dowell, Pennebaker, Shaffer and Graesser2017).
The line of research that is most similar to our work is the measurement of coherent thinking in design, through the study of natural language (Hill, Song & Agogino Reference Hill, Song and Agogino2001; Dong Reference Dong2004; Dong, Hill & Agogino Reference Dong, Hill and Agogino2004; Dong Reference Dong2005). Dong (Reference Dong2005) proposes measuring semantic coherence using the resulting vectors of another topic modelling algorithm, Latent Semantic Analysis (LSA), by calculating how close a team’s documents are in vector space. They measure convergence by comparing each member’s centroid to the group’s centroid over time, and found that knowledge convergence happens in successful design teams. In another study, Dong et al. (Reference Dong, Hill and Agogino2004) calculated team coherence by measuring the standard deviation of a team’s documentation in LSA space, and measured the correlation with team performance. They found a significant correlation between the coherence of team documentation and team performance, but a smaller correlation when emails were included in the documentation, due to the noise around scheduling and administration. We expect to see similar noise in our messaging data. Additionally, the cosine coherence between two utterances in a conversation was measured as a function of the time between them (Dong Reference Dong2004). It was found that teams engage in two types of dialog: constructive dialog, where each speaker builds on the last, or neutral dialog, where there is little building upon each other.
Though topic modelling has been used as a research methodology in the product design field, this paper presents a first-of-its-kind application of STTM – better suited to instant-message style communication – in the context of product design. We present one of the first studies related to instant-messaging use in product design, with a sizable dataset to draw conclusions across varying years and product concepts. We investigate the use of STTM to connect past digital product design communication research with theories of convergence and divergence in the engineering design cycle.
3. Methodology
In this section, we describe the methodology followed. We begin by describing the data and the course from which it was collected. We then review the data segmentation and preprocessing, followed by the topic modelling algorithm and evaluation metrics, and finish with a discussion of the qualitative methods used. An overview of our methodology is shown in Figure 1.
Complete overview of the methodology used in this work.

3.1. Data collection and characteristics
The basis of this analysis is Slack data from a senior year core product design course in Mechanical Engineering at a major U.S. institution. This particular course is an ideal baseline to study design teams because it represents a condensed yet complete design cycle, from research and ideation through to a viable alpha-prototype demonstration within 3 months. Due to the shortened timeline, team members interact frequently and depend on each other for the completion of tasks. Part of the focus of this course is for students to learn communication and cooperation skills, and gain experience working in large teams, in addition to the technical product design knowledge gained. While products vary depending on the student-identified opportunities, the course, deliverables, and timelines are controlled by the course staff through the course objectives. The course setup mirrors real-world design conditions, and the sample contains a diverse mix of student demographics. Teams meet regularly in-person for labs, lectures, and self-organised meetings, supplemented by Slack conversations. Teams were instructed to use Slack exclusively for virtual conversations, and this was verified during the semester. With respect to virtuality, these are hybrid teams of which only online communications will be analysed. Each team is composed of 17–20 students. While studying student design teams limits our ability to generalise to industry design teams, it does allow us to exclude external factors that may confound team performance, such as the market (Cooper & Kleinschmidt Reference Cooper and Kleinschmidt1995; Dong et al. Reference Dong, Hill and Agogino2004).
While only about 3 months long, this product design course cycles students through seven phases of the product design process, marked by course deliverables at the end of each phase. To support learning, scheduling and planning (Petrakis, Wodehouse & Hird Reference Petrakis, Wodehouse and Hird2021), students present physical prototypes at the end of six out of seven phases. The first phase, 3 Ideas, consists of the team splitting into two subteams and each presenting their top three ideas at a high level of detail in 2 minutes. The second phase, Sketch Model Review, is marked by each subteam presenting three rough prototypes of three design alternatives, along with basic technical, market, and customer needs. In the Mockup Review phase, each subteam presents further developed functional or visual mock-ups for their top two design ideas. The feedback from this presentation is used as the two subteams recombine into a single team and decide on which design concept they will move forward with for the remainder of the project. This is the Final Selection phase. Following this is the Assembly Review phase where teams present the complete architecture model for their product including user storyboards, computer-aided design models, test plans and electronic designs. Technical Review is the last phase for teams to gather feedback before their Final Presentation. Teams present their current progress towards a final, functional prototype. The final and longest phase culminates in a Final Presentation where teams demonstrate their product and explain their user research and market information to thousands of audience members. Figure 2 shows the entire process with the relative length of each phase.
The scaled scheduling of deliverables in the Product Design Process followed in the course. All years follow a similar workflow, which is approximately 93 days long.

Our study analyses 250,000+ Slack messages from 32 student teams, over four distinct years of course delivery (2016–2019). Slack data from all public channels were exported. Direct messages and private channels were not included in this dataset. The exported data includes information about the user, channel, message content, message type, replies and reactions. Users each have distinct, randomised usernames. Messages are sorted by channel, then date, and have precise timestamps. This allowed us to separate the data by team and phase of the product design process (Figure 2). This data collection was approved by the institutional review board, and students were aware that their public channel Slack messages were being collected for research purposes.
Expert ratings of each team’s performance were derived from process and product success at each milestone shown in Figure 2, based on instructor observation and combined relative rank of their deliverable scores compared to other groups. Based on this evidence, one expert judge, consistent through all 4 years, who has been the course instructor for 25 years, sorted teams by performance into a dichotomous variable: Strong or Weak. While this metric for success is coarse, single-sourced, and expert-derived, it was determined to be more appropriate to focus on product and process success than to make a complex calculation derived from individual team members’ course grades. To test the reliability of this measure, we analysed the agreement between the dichotomous rating and the teams’ scores for the Technical Review deliverable, which is the last time the team is assessed on the quality of their design outcome. These scores are the average of over 25 ratings from professors, teaching assistants and group instructors involved in this course. When teams in each year were split into Strong/Weak based on the median Technical Review score for that year, the ratings agreed for 24/32 teams. We expect the discrepancies to be driven by the holistic nature of the expert judge’s rating, which is based on the team performance throughout the entire semester, versus the single-moment-in-time snapshot of the assessed scores. In total, 17 of the 32 teams were rated as Strong, and 15 were rated as Weak. This rating system will be used to identify differences in communication characteristics and trends between stronger and weaker teams.
Some general statistics on the data collected: Figure 3a shows that although the number of messages varies over the years studied, increasing greatly in 2018 and 2019, we collected a minimum of 45,000 messages a year. Teams each sent an average of 7700 messages (Figure 3b), with the majority of these messages in the Final Presentation phase, when normalised by day (Figure 3d). These messages were not sent equally across all users (Figure 3f). Slack is mostly used for short, instant-message-like communication; on average, preprocessed messages are around 16 words long, with little variation over the years (Figure 3c). Preprocessed messages are longer during the second half of the product design process, peaking at close to 20 words per message in the Final Selection phase (Figure 3e).
Plots displaying the characteristics of the dataset. (a) Number of messages sent, by year. (b) Average number of messages sent per team, by year. (c) Average length of messages sent, by year. (d) Average number of messages per team per day, by phase of the product design process. (e) Average length of messages per team, by phase of the product design process. (f) Histogram displaying number of messages sent, per user. PDP represents product design process.

Past work using this dataset provides a deeper look into how these students used Slack, for the years 2016 and 2017 (Van de Zande Reference Van de Zande2018). Each team created an average of 24.4 channels on Slack, with an average of 15.1 members per channel, including anywhere from 7 to 13 staff and mentors present on the workspaces. On average, Slack activity increased greatly right before a deadline (end of a phase in Figure 2) and decreased just after the deadline, but this change differed slightly between teams. The breakdown of messages by sender varied by team, although the System Integrators (Project Managers) often sent the most messages. All teams had users who engaged with the Slack more than others, but all team members engaged in some way. This prior analysis also showed that Slack use was correlated with teams’ reported hours worked on the project, suggesting that teams used Slack mostly to discuss project-related work, and not as a social tool. The hourly activity also supports this, as Slack activity increases during and directly following their scheduled lab times, as well as right before a deliverable. This also shows that even when meeting face-to-face, teams still used Slack as a documentation tool.
3.2. Topic modelling methodology
We wanted to explore the ability of topic modelling to find expected patterns of convergence and divergence of engineering design teams; thus, we built a topic model for each team-phase, using identical hyperparameters, and compared how these models changed throughout the design process. We used topic modelling as an exploratory, unsupervised learning method, to discover the underlying clustering of messages within each team, which is a common use of topic modelling in past work (Uys, Du Preez & Uys Reference Uys, Du Preez and Uys2008; Lin & He Reference Lin and He2009; Snider et al. Reference Snider, Škec, Gopsill and Hicks2017; Naseem et al. Reference Naseem, Kumar, Parsa and Golab2020; Park et al. Reference Park, Starkey, Choe and McComb2020; Lin, Ghaddar & Hurst Reference Lin, Ghaddar and Hurst2021; Shekhar et al. Reference Shekhar and Saini2021). This means that we do not have true labels for the topic of each message, which would be near impossible to obtain given the volume of our data. Using topic modelling, we measured how many topics the teams discussed in each phase, and the coherence of these topics.
One major reason we chose to aggregate our data by team and phase is the variation in product ideas between teams. Although each year teams were told to choose a product tied loosely to a general theme, the ideas, and thus the topics discussed, still varied greatly. A single topic model trained on all teams would require a huge number of topics and would likely combine all project-specific technical terms into the same topics as they are used less frequently than planning or project management terms. Topics can be very product-specific, so we extracted topics on a case-by-case basis, similar to what has been previously done (Snider et al. Reference Snider, Škec, Gopsill and Hicks2017; Lin et al. Reference Lin, Ghaddar and Hurst2021). Additionally, building individual models for each team and phase allowed us to explore the number and coherence of topics by phase as an estimation of convergence and divergence in the design process. This also allowed us to compare model statistics by team performance, based on the expert’s rating of each team.
Due to the short nature of the messages (and as is common in enterprise social network communication more broadly), we decided to use STTM, using the Gibs Sampling Dirichlet Mixture Model (GSDMM) algorithm, instead of traditional LDA or LSA. While LDA and LSA assume that each document contains a distribution over many topics (Blei, Ng & Jordan Reference Blei, Ng and Jordan2003), the GSDMM algorithm adapts this assumption such that each document contains only one topic (Yin & Wang Reference Yin and Wang2014).
We were able to create 224 individual topic models due to the abundance of messages sent by each team using the Slack platform. Due to the format of our data, one key methodological decision was how we would define a document. In our case, typically one message alone is not long enough to constitute a document and provide useful semantic information, with an average preprocessed length of only 16 words. We thoroughly investigated the impact of the definition of a document, and thus the length of a document, on our results; we tested document sizes ranging from a single message, to an entire channel. We found that the optimal balance between number of documents and size of a document, while remaining within the assumptions of our topic modelling algorithm (Yin & Wang Reference Yin and Wang2014), was to set a document equal to a channel-day: that is, aggregating all messages sent within one Slack channel on a particular day. The latter condition is aided by the inherent function of Slack channels, as teams make new channels to separate their discussions by task force and deliverable (Van de Zande Reference Van de Zande2018). From Figure 4a, we can see that each team-phase has an average of just under 200 documents, with each document having an average length of just over 30 words, postprocessing (Figure 4b). The average document has 20 unique words. 2018 had the most number of documents per team-phase, on average (Figure 4c), and 2017 had the longest documents (Figure 4d). The third phase, Mockup Review, had the most documents on average (Figure 4e), and document size steadily increased throughout the product design process (Figure 4f). While this length is still relatively short, GSDMM has been shown to be accurate on tweets, which were a maximum of 140 characters (~20 words), or more recently, 280 (Yin & Wang Reference Yin and Wang2014). While the number of documents is smaller than the dataset used in the GSDMM debut paper (Yin & Wang Reference Yin and Wang2014), we believe that it is an appropriate value for an exploratory study, and other researchers have demonstrated success using traditional topic models with a similar number of documents to our dataset (Fu et al. Reference Fu, Cagan and Kotovsky2010; Song et al. Reference Song, Meinzer, Agrawal and McComb2020; Gyory et al. Reference Gyory, Kotovsky and Cagan2021a). Nonetheless, we tested our results for robustness with larger and smaller document definitions and found our results to be consistent.
Plots displaying the characteristics of the dataset in terms of channel-day documents, postprocessing. (a) Number of documents for each team-phase. (b) Average (nonunique) document length for each team phase. The white middle line represents the median, the green triangle represents the mean, the box extends from the first quartile to the third quartile. Whiskers represent the most extreme, nonoutlier points, with outliers represented by unfilled circles beyond the whiskers. (c) Average number of documents per team-phase, by year. (d) Average document length by team-phase, by year. (e) Average number of documents per team-phase, by phase. (f) Average length of documents for each team-phase, by phase. PDP represents product design process.

As the data were sourced from the instant messaging platform Slack, many messages contained nontextual data including ‘mentions’ of teammates, channels or threads, emojis, gifs, bot-messages and links to connected apps or external sites. Additionally, students often used shorthand, slang, and stop words to communicate. All of these elements were removed during the data preprocessing step as their inclusion would prevent the topic model from finding cohesive and informative topics. The data first went through a simple preprocessing algorithm to remove any mentions of users or channels, remove any punctuation or numeric characters, and convert all upper-case letters to lower-case. We then removed common stop words from the messages, which are words that are common in the English language and uninformative such as ‘the’. The stop words were downloaded from the Natural Language Toolkit python package (NLTK 2021). Only correctly spelled words were kept, checked using the English dictionary from the Enchant module (Kelly Reference Kelly2011). Using the SpaCy package (Spacy.io 2021), all words were lemmatized to their basic form and only nouns, verbs, adjectives and adverbs were retained. After analysing the results of the preliminary topic models, we further removed common and meaningless words whose frequency cluttered the topic model results including ‘yeah’, ‘think’ and ‘class.’ Lastly, bigrams were created from two words that often occurred together, such as ‘consumer_good’, using the Python Gensim package (Rehurek & Sojka Reference Rehurek and Sojka2010). A complete list of bigrams created is in Appendix A.1. Each document had an average length of 86 words, and 45 unique words, prior to processing, and a length of 30 words, or 20 unique words, postprocessing.
The GSDMM topic modelling algorithm used is built on the assumption that each document contains one topic (Yin & Wang Reference Yin and Wang2014). This algorithm was designed to balance the completeness of topics (all documents from one ground truth topic are assigned to the same ‘discovered’ topic) and the homogeneity of topics (all topics within a ‘discovered’ topic have the same ground truth topic label). It does this by balancing two rules: one that forces the number of topics to be large, and another that forces the number of topics to be small, resulting in convergence to the optimal number of topics. The simplified equation behind the algorithm can be seen in Eq. (1) where the probability that the topic label of document $ d $
is
$ d $
is $ z $
is equivalent to the joint probability of the topic labels and document corpus, given hyperparameters Alpha (
$ z $
is equivalent to the joint probability of the topic labels and document corpus, given hyperparameters Alpha ( $ \alpha $
), Beta (
$ \alpha $
), Beta ( $ \beta $
), divided by the joint probability of the topic labels for all documents except
$ \beta $
), divided by the joint probability of the topic labels for all documents except $ d $
in the document corpus. This method assumes that each topic is a multinomial distribution over words, and that the weight of each topic is a multinomial distribution.
$ d $
in the document corpus. This method assumes that each topic is a multinomial distribution over words, and that the weight of each topic is a multinomial distribution.
 $$ p\left({z}_d=z|\overrightarrow{z_{\neg d}},\overrightarrow{d}\right)=\frac{p\left(\overrightarrow{d},\overrightarrow{z}|\overrightarrow{\alpha},\overrightarrow{\beta}\right)}{p\left(\overrightarrow{d},\overrightarrow{z_{\neg d}}|\overrightarrow{\alpha},\overrightarrow{\beta}\right)}. $$
The GSDMM algorithm has hyperparameters Alpha ( $ \alpha $
), Beta (
$ \alpha $
), Beta ( $ \beta $
),
$ \beta $
), $ K $
, and number of iterations. Alpha is a parameter that specifies how likely it is for a new document to ‘create’ a new topic instead of joining an existing one (Yin & Wang Reference Yin and Wang2014). Beta represents how likely it is for a new document to join a topic if not all of the words in the document already exist in the topic. The parameter
$ K $
, and number of iterations. Alpha is a parameter that specifies how likely it is for a new document to ‘create’ a new topic instead of joining an existing one (Yin & Wang Reference Yin and Wang2014). Beta represents how likely it is for a new document to join a topic if not all of the words in the document already exist in the topic. The parameter $ K $
represents the ceiling for the number of topics, which should be significantly larger than the number of topics estimated to be in the dataset. In Eq. (1) above,
$ K $
represents the ceiling for the number of topics, which should be significantly larger than the number of topics estimated to be in the dataset. In Eq. (1) above, $ z $
take a value between 1 and
$ z $
take a value between 1 and $ K $
in each iteration. Lastly, the number of iterations specifies how many iterations should be used in the algorithm. In each iteration, documents are reallocated to topics based on the probabilities calculated in Eq. (1). The number of documents moved decreases every iteration. The number of topics starts off large, and converges to a smaller number after more iterations. It has been shown that the GSDMM algorithm usually converges after five iterations (Yin & Wang Reference Yin and Wang2014).
$ K $
in each iteration. Lastly, the number of iterations specifies how many iterations should be used in the algorithm. In each iteration, documents are reallocated to topics based on the probabilities calculated in Eq. (1). The number of documents moved decreases every iteration. The number of topics starts off large, and converges to a smaller number after more iterations. It has been shown that the GSDMM algorithm usually converges after five iterations (Yin & Wang Reference Yin and Wang2014).
We experimented with values of Alpha and Beta to tune these parameters to produce the most coherent topics. We estimated that given the short nature and limited number of messages, we would not expect large numbers of topics, and therefore set Alpha to 0.1. To help encourage a smaller number of well-defined topics, as opposed to many topics with only one or two messages, as well as to account for the use of rare technical terms, we investigated setting Beta to various values between 0.1 and 0.2 as shown in Yin & Wang (Reference Yin and Wang2014). However, we still found that the most interpretable and easy to differentiate topics were found when Beta was set to the default 0.1. These hyperparameter values were chosen based on the measure of coherence defined in the next section as well as qualitative analysis of the top words in each topic. We chose $ K=100 $
and number of iterations as 10 to ensure that all topics were identified, and we could accurately assess the certainty of the algorithm once it had converged.
$ K=100 $
and number of iterations as 10 to ensure that all topics were identified, and we could accurately assess the certainty of the algorithm once it had converged.
3.3. Evaluating convergence patterns
We used two main metrics to analyse the STTMs for each team and phase. Unlike many traditional topic modelling algorithms, GSDMM chooses the number of topics based on balancing the completeness and homogeneity of results (Yin & Wang Reference Yin and Wang2014). Thus, the number of topics found within a model is a property of that team’s communication in that phase. We argue that the number of topics may be used as a measure of convergence; as teams converge on their decision idea, their testing methodology, or their presentation strategy, they will discuss fewer topics. While all the phases do differ in length, we found that with our use of channel-days as documents, there was no correlation between the number of documents and the number of topics, indicating no need to normalise.
Topic coherence metrics are a common measure of the quality of a topic model (Röder et al. Reference Röder, Both and Hinneburg2015). They are used to measure how often the words in a topic would appear in the same context, and these metrics have been shown to achieve results similar to inter-annotator correlation (Newman et al. Reference Newman, Lau, Grieser and Baldwin2010). Thus, in combination with the number of topics in each phase, the quality of the topics discussed in this phase could be an indication of design team convergence: the more coherent the topic model, the more likely it is that the team is discussing only a set number of topics. This has been shown to represent shared knowledge representation (Gyory et al. Reference Gyory, Song, Cagan and McComb2021b). While the topic model will always place all documents into a topic, if these documents do not contain similar content, the coherence of the model will be low. We measured the intrinsic coherence of each model using normalised pointwise mutual information (NPMI) (Eq. (2)) (Lisena et al. Reference Lisena, Harrando, Kandakji and Troncy2020), which traditionally has a strong correlation with human ratings (Röder et al. Reference Röder, Both and Hinneburg2015). This was done using the TOMODAPI (Lisena et al. Reference Lisena, Harrando, Kandakji and Troncy2020), which applies Eq. (2) to couples of words, computing their joint probabilities. In this equation, $ P\left({w}_i,{w}_j\right) $
represents the probability of words i and j occurring in the same document, which in our case, is a team-channel-day (all messages sent by a team, in a channel, on a day).
$ P\left({w}_i,{w}_j\right) $
represents the probability of words i and j occurring in the same document, which in our case, is a team-channel-day (all messages sent by a team, in a channel, on a day). $ \varepsilon $
was set to
$ \varepsilon $
was set to $ {10}^{-12} $
, which has been shown to prevent the generation of incoherent topics (Wasiak et al. Reference Wasiak, Hicks, Newnes, Dong and Burrow2010).
$ {10}^{-12} $
, which has been shown to prevent the generation of incoherent topics (Wasiak et al. Reference Wasiak, Hicks, Newnes, Dong and Burrow2010).
 $$ {C}_{\mathrm{NPMI}}=\frac{\frac{p\left({w}_i,{w}_j\right)+\varepsilon }{p\left({w}_j\right)\cdot p\left({w}_i\right)}}{-\log \left(p\left({w}_i,{w}_j\right)+\varepsilon \right)}. $$
The number of topics and the coherence of these topics were analysed to see if a pattern of convergence and divergence emerged, as would be expected in the engineering design process. After building and evaluating the topic models for all teams and phases, we investigated trends in the above metrics using a two-way robust ANOVA model (Mair & Wilcox Reference Mair and Wilcox2020) with independent variables team performance and phase of the product design process. Posthoc tests were conducted to determine differences between specific phases. This allowed us to identify significant differences between the number of topics and their coherence as teams moved through the design process, to indicate phases of convergence and divergence.
3.4. Qualitative analysis
While the topics resulting from the topic models lose some of the contexts of Slack messages that are contained in word order, we believe that qualitatively analysing the themes within the topic words can help us to better understand the ability of our topic models to capture convergence patterns in designer communication. We qualitatively analysed the top words in each topic within two phases with opposite topic characteristics: Mockup Review and Technical Review. Within each phase, we analysed two Strong and two Weak teams per year. For this analysis, we built upon an existing coding scheme that was developed for engineering emails, a similar case study to our work (Wasiak et al. Reference Wasiak, Hicks, Newnes, Dong and Burrow2010). We adapted the coding scheme to fit our context in two main ways. First, since we are evaluating topics, which consist of words and frequencies, we lose much of the context of the message that is contained in word order. We also filter out numbers and symbols prior to building the topic model. For this reason, it was necessary to merge some categories from the existing coding scheme. Second, since our data comes from a course project, unlike the industry setting originally used to develop this scheme, we needed to include course-based topics, like assignments.
Wasiak et al. (Reference Wasiak, Hicks, Newnes, Dong and Burrow2010) created three coding schemes: one for what the email was about (Scheme 1), one for why the email was sent (Scheme 2), and a third for how the message was conveyed (Scheme 3). For this work, we focused on an adaption to the first scheme, as inferring intent and emotional information would be challenging without word order. We made the following adaptions to the coding schemes to better fit our context. Scheme 1 was divided into three categories: product, project and company. Company was replaced with course to fit the context of our data. We then combined some categories that would be challenging to differentiate without word order and numeric information, such as function and performance, or planning and time. While we did not use Scheme 2, we borrowed categories such as developing solutions, evaluating solutions, and decision making – processes that are discussed frequently in our topics – and reassigned them to the project category. The complete coding scheme, along with definitions of the codes and common terms representing the codes, is found in Table 3. During this process, the researchers used documentation of the teams’ product ideas in the corresponding phases to identify product-specific terms. Two researchers coded the topics using a thirds approach; the topics per phase were divided into thirds, with each coder coding one-third, and both researchers coding the final third. Out of the 116 topics that were coded by both researchers, 74 displayed complete agreement after the first round of coding, 39 displayed complete agreement on some of the codes with partial disagreement on others, and 3 displayed no agreement on any codes. There was agreement on 87.5% of the codes assigned to the topics coded by both researchers. Any disagreements were discussed until a consensus was reached.
4. Results
Here, we present the results of our case study, first with quantitative analysis followed by qualitative analysis.
4.1. Quantitative results
We begin by reviewing the quantitative topic modelling results to address whether there is evidence of convergent and divergent communication cycles within the product design process, and how this differs between Strong and Weak teams.
4.1.1. Number of topics
To analyse changes in the number of topics throughout the design process, we first tested for statistically significant differences in the number of documents (channel-days) throughout the design process, which may influence the number of topics found by the model. We conducted a two-way robust ANOVA on the number of documents from each team, in each phase, to help later interpret the cause of trends found in the number of topics. It is important to note that while we did find a significant effect of phase on the number of documents ( $ \hat{\Psi}=531.64,\hskip0.3em p=0.001 $
) there was no significant effect of the team strength on the number of documents (
$ \hat{\Psi}=531.64,\hskip0.3em p=0.001 $
) there was no significant effect of the team strength on the number of documents ( $ \hat{\Psi}=2.75,\hskip0.3em p=0.856 $
).
$ \hat{\Psi}=2.75,\hskip0.3em p=0.856 $
).
To study the association of design phase and team strength with the number of topics, we conducted a two-way factorial ANOVA. This metric meets the homogeneity of variance assumption $ F\left(\mathrm{13,210}\right)=0.2057,\hskip0.3em p=0.99 $
, however, it did violate the normality of residuals assumption
$ F\left(\mathrm{13,210}\right)=0.2057,\hskip0.3em p=0.99 $
, however, it did violate the normality of residuals assumption $ W=0.98,\hskip0.3em p<0.01 $
. Due to the nonnormality of residuals, we conducted a robust ANOVA, implemented using the WRS2 package (Mair & Wilcox Reference Mair and Wilcox2020). We also verified the results with a traditional two-factor ANOVA, and found the same significant effects.
$ W=0.98,\hskip0.3em p<0.01 $
. Due to the nonnormality of residuals, we conducted a robust ANOVA, implemented using the WRS2 package (Mair & Wilcox Reference Mair and Wilcox2020). We also verified the results with a traditional two-factor ANOVA, and found the same significant effects.
Using a 20% trimmed mean, we found that both team strength ( $ F=5.74,\hskip0.3em p<0.05 $
) and phase of the product design process (
$ F=5.74,\hskip0.3em p<0.05 $
) and phase of the product design process ( $ F=22.46,\hskip0.3em p<0.01 $
) had a significant main effect on the number of topics found in the topic model. The interaction effect of team strength and design phase was nonsignificant (
$ F=22.46,\hskip0.3em p<0.01 $
) had a significant main effect on the number of topics found in the topic model. The interaction effect of team strength and design phase was nonsignificant ( $ F=5.04,\hskip0.3em p=0.58 $
). The equivalent robust posthoc tests revealed that the strength of teams is significantly associated with the number of topics in their topic model (
$ F=5.04,\hskip0.3em p=0.58 $
). The equivalent robust posthoc tests revealed that the strength of teams is significantly associated with the number of topics in their topic model ( $ \hat{\Psi}=-8.42,\hskip0.3em p<0.05 $
). From the plot in Figure 5a, we can see that Weak teams had consistently more topics in their topic models than Strong teams. Posthoc tests revealed that the phases that differed significantly from each other were the 3 Ideas phase with Mockup Review, Final Selection, Assembly Review and Final Presentation; and Final Presentation also significantly differed from Technical Review (Table 1). Nearly significant relationships occurred between Sketch Model and 3 Ideas (
$ \hat{\Psi}=-8.42,\hskip0.3em p<0.05 $
). From the plot in Figure 5a, we can see that Weak teams had consistently more topics in their topic models than Strong teams. Posthoc tests revealed that the phases that differed significantly from each other were the 3 Ideas phase with Mockup Review, Final Selection, Assembly Review and Final Presentation; and Final Presentation also significantly differed from Technical Review (Table 1). Nearly significant relationships occurred between Sketch Model and 3 Ideas ( $ p=0.062 $
), Final Selection (
$ p=0.062 $
), Final Selection ( $ p=0.083 $
) and Final Presentation (
$ p=0.083 $
) and Final Presentation ( $ p=0.059 $
); and Technical Review and Final Selection (
$ p=0.059 $
); and Technical Review and Final Selection ( $ p=0.51 $
) This pattern is also demonstrated in Figure 5b. Although there is no significant interaction effect between team strength and phase, we do see an interesting pattern in Figure 5c where Weak teams have more topics in their topic models in all phases, except for the Final Selection phase.
$ p=0.51 $
) This pattern is also demonstrated in Figure 5b. Although there is no significant interaction effect between team strength and phase, we do see an interesting pattern in Figure 5c where Weak teams have more topics in their topic models in all phases, except for the Final Selection phase.
(a) Plot of the main effect of team strength on number of topics. (b) Plot of the main effect of phase on number of topics. (c) Interaction plot for interaction effect of Strength and Phase on number of topics. Error bars represent one standard error.

Results of robust post hoc tests

Note: Phases that differed significantly in the number of topics discussed display the $ \hat{\Psi} $
value and the associated p-value ∗p < 0.05, ∗∗p < 0.01, ∗∗∗p < 0.001. Empty boxes represent a nonsignificant relationship. Entries marked with a
$ \hat{\Psi} $
value and the associated p-value ∗p < 0.05, ∗∗p < 0.01, ∗∗∗p < 0.001. Empty boxes represent a nonsignificant relationship. Entries marked with a $ {}^{\dagger } $
signify that while the p-value was significant, the
$ {}^{\dagger } $
signify that while the p-value was significant, the $ \hat{\Psi} $
confidence interval crosses zero, indicating that the adjusted statistic is not significant (Field, Miles & Field Reference Field, Miles and Field
2012).
$ \hat{\Psi} $
confidence interval crosses zero, indicating that the adjusted statistic is not significant (Field, Miles & Field Reference Field, Miles and Field
2012).
4.1.2. Coherence of topics
We used the NPMI as another measure to analyse design team communication. Similar to how we studied the association of design phase and team strength with the number of topics, we analysed the coherence of topics over the design process using a two-way ANOVA model. The data violated the homogeneity of variance assumption $ \left(F\left(\mathrm{13,210}\right)=2.05,p<0.05\right) $
, but it met the normality of residuals assumption
$ \left(F\left(\mathrm{13,210}\right)=2.05,p<0.05\right) $
, but it met the normality of residuals assumption $ \left(W=0.99,p=0.5288\right) $
, thus we implemented robust ANOVA for this metric as well (Mair & Wilcox Reference Mair and Wilcox2020). We also verified using a traditional ANOVA and found similar statistical significance of main effects.
$ \left(W=0.99,p=0.5288\right) $
, thus we implemented robust ANOVA for this metric as well (Mair & Wilcox Reference Mair and Wilcox2020). We also verified using a traditional ANOVA and found similar statistical significance of main effects.
In line with the trends found for number of topics, we found a significant main effect of phase of the product design process on the coherence of the topics discussed $ \left(F=21.06,p<0.01\right) $
, but no significant effect of team strength
$ \left(F=21.06,p<0.01\right) $
, but no significant effect of team strength $ \left(F=0.36,p=0.55\right) $
or team strength and phase interaction
$ \left(F=0.36,p=0.55\right) $
or team strength and phase interaction $ \left(F=5.33,p=0.55\right) $
. Posthoc tests revealed significant differences between phases when measuring the coherence of topics. The Sketch Model phase varies significantly with Final Selection, Assembly Review, Technical Review, and Final Presentation Phases; and 3 Ideas varies significantly with Final Selection and Final Presentation. Assembly Review was almost significantly different from Final Selection (
$ \left(F=5.33,p=0.55\right) $
. Posthoc tests revealed significant differences between phases when measuring the coherence of topics. The Sketch Model phase varies significantly with Final Selection, Assembly Review, Technical Review, and Final Presentation Phases; and 3 Ideas varies significantly with Final Selection and Final Presentation. Assembly Review was almost significantly different from Final Selection ( $ p=0.071 $
) and Technical Review was almost significantly different from 3 Ideas (
$ p=0.071 $
) and Technical Review was almost significantly different from 3 Ideas ( $ p=0.089 $
). The complete post-hoc results are shown in Table 2.
$ p=0.089 $
). The complete post-hoc results are shown in Table 2.
Results of robust post hoc tests

Note: Phases that differed significantly in the number of topics discussed display the $ \hat{\Psi} $
value and the associated p-value ∗p < 0.05, ∗∗p < 0.01, ∗∗∗p < 0.001. Empty boxes represent a nonsignificant relationship. Entries marked with a
$ \hat{\Psi} $
value and the associated p-value ∗p < 0.05, ∗∗p < 0.01, ∗∗∗p < 0.001. Empty boxes represent a nonsignificant relationship. Entries marked with a $ {}^{\dagger } $
signify that while the p-value was significant, the
$ {}^{\dagger } $
signify that while the p-value was significant, the $ \hat{\Psi} $
confidence interval crosses zero, indicating that the adjusted statistic is not significant (Field et al. Reference Field, Miles and Field
2012).
$ \hat{\Psi} $
confidence interval crosses zero, indicating that the adjusted statistic is not significant (Field et al. Reference Field, Miles and Field
2012).
The plot in Figure 6 shows that Slack discussions in the fourth and final two phases have more coherent topics than in other phases, and the Sketch Model phase has the least coherent topics.
Plot of the main effect of product design phase on average NPMI topic coherence. Error bars represent one standard error.

4.2. Qualitative results
We conducted a qualitative analysis of the top 50 words in each topic, from the topic models of two Strong and two Weak teams per year, using the themes described in Table 3. Common terms for each subtheme are provided in the table, although themes were identified through the collection of terms in a topic and not just the inclusion of a single term. Most topics contained evidence of more than one theme, specifically, an average of 4.1 themes per topic. Topics from the Mockup Review phase contained an average of 4.0 themes per topic, while topics in the Technical Review phase contained an average of 4.2 themes. In terms of team strength, Strong teams’ topics contained more themes, with an average of 4.2, while Weak teams’ topics had an average of 3.9.
Qualitative coding scheme with definitions

Before discussing how these themes are distributed within the dataset, we present some examples of topics and subthemes. For each topic, we show 20 (of 50 total) words, and a corresponding list of subthemes derived from that subset of words. Table 4 shows eight example topics, spanning two phases – Mockup Review (convergent) and Technical Review (divergent) – and the corresponding subthemes we identified within these topics. Team strength is omitted for four topics as the topic words are sufficiently specific to identify the team.
Example topics, represented by the top 20 most frequent words, and the corresponding themes

Note: Asterisks represent where team strength was omitted as the topic words are sufficiently specific to identify the team.
The first topic represents a team making plans (as many topics do), but specifically making plans to meet, compile, and practice their Mockup Review presentation. This represents the Plans subtheme, as well as Project Deliverables subtheme as they are preparing the presentation deliverable, and Physical Resources and Tools, represented by the ‘conference’ ‘room’ that they are planning to meet in. The second topic, from a Weak team in the Mockup Review phase, represents the team planning to brainstorm solutions. They discuss ‘brainstorm’ ‘session[s],’ ‘continue[ing]’ the ‘discussion’, and even reactions to this such as ‘excite’ and ‘cool’. These topic words represent the subthemes Plans and Developing Solutions. The next two topics more closely represent topics that are specific to a certain product idea. The third topic comes from a team that was designing a portable blender for individuals who have trouble eating whole foods. In this topic, we see discussions regarding the Functions and Performance of the blender (‘blend’), the Operating Environment (‘restaurant’), the Features (‘battery’), and Ergonomics (‘user’, ‘interact’). The fourth topic similarly represents Functions and Performance, Features and Ergonomics for the design of their handheld bathing device for older adults.
The fifth topic represents planning to evaluate solutions (‘test’), specifically in the case of their respirator product. We also see discussions of various features of product; perhaps they were testing both an electrical and analog version. The sixth topic represents teams ordering parts for the product, as we see terms like ‘shipping,’ ‘order’, ‘purchase’ and ‘quantity’. The seventh topic also represents a product-specific topic, but in this case, we see the discussion of Risk as well, as demonstrated by terms such as ‘concern’ and ‘accidentally’. The last topic represents one of the most common topics in our dataset. Students often use Slack to organise times to meet in person, either to work on a specific part of the project, or just generally work together. These topics are often characterised by terms like ‘meeting’ or ‘meet’, along with time of day such as ‘early’, ‘morning’, or ‘tomorrow’, and sometimes mentions of what will be worked on, such as ‘design’.
In general, the high-level theme Product is discussed the most, appearing in around 30% of topics, Project appeared in 19% of topics, Other in 17% of topics and Course in 12% of topics. This pattern was mostly consistent in both phases, with the exception of Product, which was used more often in the Technical Review phase (34%) than the Mockup Review phase (24%). Strong teams had themes of Product, Project, and Course in their topics equivalently as often as Weak teams; however, Strong teams exhibited more evidence of Other themes (20% compared to 16%). When Other themes are frequently found, discussion in the Mockup Review phase tends to be the main contributor to this discussion. We found evidence of teams mostly discussing Product subthemes such as Features, Manufacturing and Ergonomics. The subtheme Features represents specific product components, such as ‘handle’, ‘sensor’ and ‘wire’. Subtheme Manufacturing was most often used to code topics that included terms such as ‘prototype’, ‘lab’, ‘build’, and terms that suggested the ordering of parts for prototypes, such as ‘shipping’, ‘tracking’ and ‘order’. Lastly, the subtheme of Ergonomics was discovered frequently when teams discussed the ‘user’ in combination with ‘research’, ‘interviews’ or ‘consultation’.
Within the high-level Project theme, we found the most evidence of the subthemes Plans and Project Deliverables. Evidence of Plans was found in around 50% of the topics, and thus it overlapped most with other subthemes. The subtheme Plans covered topics of team coordination, planning an activity, or planning a timeline. In our data, this subtheme corresponds with terms such as ‘meeting’, ‘tomorrow’, ‘progress’ and ‘task_force’. Subtheme Project Deliverables was used whenever we saw evidence of the team discussing a design deliverable, by using terms such as the phase names (‘Sketch Model’) or referring to their ‘presentation’ and ‘demos’. This subtheme was distinguished from nonproject deliverables in order to separate discussions around deliverables necessary to the design process, which mirror design reviews in engineering organisations, from those that would not be found outside of the course setting, such as peer review assignments.
The high-level theme Course was mostly comprised of references to the course’s Physical Resources and Tools, such as the ‘lab’, ‘printer’, or various tools. Mentions of course materials or instructors, such as ‘lecture’, ‘workshop’ or ‘professor’ were assigned to the theme of Knowledge Resources and Stakeholders.
Lastly, we also found evidence of subthemes that were outside of course topics and did not fit into our coding scheme, namely, Social and Personal. Interestingly, we found that these often created small topics on their own, an example being: purpose, look, meme, stress, relief, team, bond, credit. The Personal subtheme often referred to updates that someone was running late, missing a lecture, or having technical issues.
We found a few trends in the themes that often occurred together within a topic. Overall, evidence of the subthemes Plans and Evaluating Solutions were often found within the same topic. In our data, Evaluating Solutions most often referred to terms related to mechanical or user testing. Thus, this suggests that teams organised their test plans using Slack. Plans also commonly overlapped with Decision Making, signalled by terms in a topic such as ‘decision’, ‘meet’ and ‘tomorrow’. We also found that Features was often identified in topics with Functions and Performance, and Evaluating Solutions, suggesting that teams discuss how to evaluate various product components to ensure that their performance objectives are met. Another common pattern among many teams was the overlap of the subthemes Operating Environment and Ergonomics. These topics would include mentions of the target use environment for the product, for example, ‘restaurant’, within the same topic as mentions of ‘user’, ‘interface’ and ‘simple’. Lastly, we found that the Social theme was not identified in any predictable patterns with other topics. In fact, when used, it was often the only theme attributed to that topic.
Comparing the Mockup Review phase (a convergent phase) and the Technical Review phase (a divergent phase) revealed some thematic differences. While most subthemes were found in an approximately equivalent percentage of topics, the subthemes Function and Performance, Features, Evaluating Solutions, Ergonomics and Manufacturing were used more often in the divergent phase than the convergent phase. The convergent phase contained more topics that referenced deliverables, both project deliverables and nonproject deliverables, and more mention of Developing Solutions. We found that the additional Project Deliverables and Developing Solutions subthemes existed within the same topic as Evaluating Solutions.
Shifting focus to team strength, we found only minor differences. Strong teams had more topics that referenced the course’s physical resources, and general Plans. In terms of thematic overlap, we found that Strong teams had more topics that referenced an overlap between Functions and Performance and Ergonomics, and Evaluating Solutions and Manufacturing.
5. Discussion
5.1. Case study implications
We begin our discussion by analysing the results of our case study, motivated by our original research questions: Over the course of the design process, how does team communication reflect convergence and divergence? Does this trend differ between teams with strong and weak performance?
Our analysis reveals that design teams use Slack to discuss a varying number of topics, with varying levels of coherence, throughout the product design process. Considering the number of topics in each phase, in Figure 5, we see that teams start off with the most number of topics in the 3 Ideas phase when they have to present a total of six promising product ideas to the class, with an average of approximately 13 topics. Then the number of topics gradually decreases to a minimum of around nine topics in the third phase, Mockup Review, where teams present ‘looks-like’ or ‘works-like’ prototypes of their top four design concepts. The number of topics stays relatively consistent throughout the Final Selection phase, where teams choose one product concept to pursue. Although we may expect that this decision point would generate much discussion, this phase is only approximately 4 days long, and the hybrid nature of these teams suggests that some of these discussions happen in person. The number of topics then increases through the Assembly Review phase and reaches a second peak in the Technical Review phase, where teams present a technically functional prototype. The number of topics reaches another minimum in the Final Presentation phase, where teams develop their final polished prototype. This pattern is empirical evidence to validate the double diamond pattern of convergence–divergence proposed in Design Council (2015), representing a pattern of diverging to ideate, converging to decide on a single product concept, diverging to decide how to accomplish the product goals, and then converging again to a final prototype. However, post-hoc tests reveal that only the divergence in the 3 Ideas phase and the Technical Review phase are significantly, or borderline significantly, different from neighbouring phases.
Examining the coherence of the topic models, we find a different pattern. Teams have the most coherent topic models in the Final Selection phase. As seen in Figure 6, the coherence decreases from 3 Ideas to Sketch Model, increases through Mockup Review and Final Selection, and then seems to reach a constant value from Assembly Review through to Final Presentation. Post-hoc tests reveal that significant or borderline significant differences exist between 3 Ideas, Final Selection, and Final Presentation, and between Sketch Model and all of the last four phases. These significant differences suggest a general pattern of moving from levels of low coherence to higher coherence throughout the design process. We can see that the Sketch Model phase has the smallest standard deviation, meaning there is the least variation in model coherence between teams in this phase. This measure of coherence represents the quality of the topic model, so while the topic model will ensure that every document is assigned to a topic, the coherence score will drop if the documents within a topic are not semantically similar. Thus, we can interpret the coherence score as a measure of how much the teams discuss semantically similar topics within a phase. We might expect a team who is highly-coordinated and with a clear aim to communicate in a highly coherent manner, whereas a team lacking coordination and shared understanding may communicate with low coherence. Although measured differently, our coherence metric has a similar interpretation to the semantic coherence metric that was shown to cycle throughout the product design process in previous studies (Song et al. Reference Song, Dong and Agogino2003; Dong Reference Dong2005). Our coherence metric does vary between phases; however, we only see a significant change between the beginning and end of the product design process.
These patterns in number of topics and coherence of topics are most interesting when they are viewed together. We can see that the number of topics generally decreases from the 3 Ideas phase through the Final Selection phase, yet we see the opposite trend in terms of the coherence of topics, as coherence generally increases throughout the first four phases. As teams converge on a design idea, their topic models have fewer topics, and these topics are more coherent. This provides further support for the convergence that we expect to see in these phases, and this is consistent with findings from studies that use different measures of semantic coherence (Dong Reference Dong2004). Interestingly, we do not see the same pattern within the second half of the design process. After the Final Selection phase, teams’ topic models increase in size to a peak at Technical Review, and then decrease again in Final Presentation; however, we see the coherence drop after Final Selection and then remain fairly consistent throughout the final three phases. We hypothesise that this could be due to two reasons: one being that the teams have decided on a single product concept at this point, and although they are diverging to figure out how to best design the product, they would be using a smaller vocabulary than in previous phases. The second reason being that having worked on the previous phases together over time, the team has developed a ‘shared voice’. Past studies have shown that topic models have the ability to capture both content similarity and voice similarity (Hill et al. Reference Hill, Song and Agogino2001).
Our qualitative analysis revealed that the subtheme present in around 50% of topics was Plans, which includes planning and coordination of work allocation, activity processes, and timelines. This shows that even when teams are using Slack to discuss other subthemes, such as Function and Performance, or Features, there is often an element of planning involved. This mirrors previous findings in engineering communication research which found that emails contain more noise associated with scheduling and administration than design documents do, and it is used more for coordination than design discussions (Dong et al. Reference Dong, Hill and Agogino2004). Future work can further explore this trend by comparing the years 2016–2019 with the modified version of the course that ran with limited in-person activities during 2020 due to the COVID-19 pandemic. In comparison with 2016–2019 teams, we expect that teams in the 2020 course version will mention Product themes more frequently on Slack because of the restriction of in-person meetings where these technical design aspects would typically be discussed.
We found that topics in the divergent Technical Review phase have more themes per topic on average than the convergent Mockup Review phase. However, the difference is too slight to draw significant conclusions given the qualitative nature of the analysis. We also found that Product themes occurred in 10% more topics in the divergent phase than the convergent phase. This difference was driven by teams’ communication of Function and Performance, Features, Manufacturing and Ergonomics in the divergent phase. In both of these phases, though at different levels of fidelity, deliverables drive the necessity for teams to define or refine the product functions, detail the features required to carry out the functions, manufacture a prototype, and discuss user needs. Thus, we hypothesise that Product themes were found in more topics within divergent Technical Review because the challenge of figuring out how to build their near-final functional prototype kept the product at the forefront of most discussions, even if those discussions integrated other themes. Technical Review (divergent phase) topics also contained more mention of the subtheme Evaluating Solutions, represented mostly by discussions of testing, than the Mockup Review (convergent) phase did. This is most likely caused by the refinement and complexity of the prototype later on in the semester. In Mockup Review, teams use their prototype to focus on one or two feasibility concerns, and thus conduct less testing than in the Technical Review phase, where they have to test the prototype against all specifications. We found that more topics in the Mockup Review phase included subthemes of both project and nonproject deliverables than in the Technical Review phase. The subtheme of Project Deliverables was characterised by teams preparing for their presentation and demo, which is similarly structured to a design review in industry. The lesser frequency of this theme in the later Technical Review phase may demonstrate that teams need to spend more time on the product, and less time planning their presentations and demo, as the product complexity increases throughout the semester. Contrary to what would be expected from a convergent phase, we found more evidence of subtheme Developing Solutions in Mockup Review than in Technical Review. We believe that this is due to the challenge of identifying brainstorming processes from a collection of words without word order. We used the Developing Solutions theme when the words ‘brainstorming’, ‘idea’, or ‘suggestion’ were used; however, a topic consisting of multiple product components or materials could also represent a team developing solutions, but is impossible to identify without context. Additionally, as we know teams spend more time focusing on deliverables in Mockup Review, these solutions, ideas and suggestions could be in regard to the presentation design, and not the product itself.
We also identified some differences between the communication patterns of Strong and Weak teams. We found that Weak teams’ topic models have significantly more topics than Strong teams. However, there was no significant effect of team strength on the coherence of these models. Thus, Weak teams discuss more topics than Strong teams, with the same level of coherence. This contradicts previous research that shows that more noun phrases used in a design course lead to better designs, as measured by grades (Mabogunje & Leifer Reference Mabogunje and Leifer1997). While the most simple explanation for our difference is that Weak teams simply have more scattered conversations, this should not be dismissed as the only probably cause. This could also be due to the Weak teams displaying more divergent behaviour overall: proposing more ideas, and experiencing more constructive disagreement (Dong Reference Dong2004; Dong et al. Reference Dong, Hill and Agogino2004). The team strength metric encompasses team dynamics as well as product quality (although we found that it correlates strongly with their near-final product quality), and future work can measure team strength at varying points throughout the semester. This will highlight if teams that display divergent communication characteristics perform particularly well in divergent phases. Another explanation of this trend could be that stronger teams established communication norms earlier on in the design process, the lack of which has been shown to cause tension (Brisco, Whitfield & Grierson Reference Brisco, Whitfield and Grierson2016). As the teams in this course were hybrid, with regular in-person meeting times, successful teams may have delegated certain decisions and discussions for in-person meetings, and others for Slack. This would lead to fewer topics found in the stronger teams’ topic models.
We did not find a significant interaction effect between team strength and phase on the number of topics in a topic model, nor the coherence of the topic model. Thus, using our measure of convergence, we find that both Strong and Weak teams cycle through convergence and divergence, contradictory to Dym et al. (Reference Dym, Agogino, Eris, Frey and Leifer2005) who found a correlation between successful teams and cycles of convergent and divergent thinking. Further work will be required to better understand the scale of cycling; it is possible that when scoped to the phase level, or when looking at the team and not designer-level, we are not seeing micro-cycles of convergence within phases. The absence of this interaction effect could also be caused by the structure of the course; teams are instructed to move through specific design activities on a schedule. Although nonsignificant, we see an interesting effect in the Final Selection phase where Strong teams’ topic models have more topics than Weak teams’, contrary to all other phases. The cause of this effect would be best determined with a detailed study of both the face-to-face and online communication of teams during this important phase. One possibility is that Strong teams place more importance on this decision, and thus have more discussions during this phase.
We also compared the qualitative themes present in the topics by Strong and Weak teams. We found that on average, each topic from Strong teams contains slightly more themes than the topics from Weak teams. Although this difference is too small to draw significant conclusions, this pattern, in combination with the quantitative finding that Strong teams have fewer topics in their topic models, suggests that stronger teams may be more efficient in combining related subthemes into discussions. Meaning, they may cover the same grouping of subthemes in multiple discussions, such that topic models can pick up on these patterns. We found that the only noticeable difference in high-level themes was Strong teams’ use of the Other theme more often than Weak teams. This represents both an increase in Social and Personal subthemes, meaning that Strong teams have more discussion about events outside of school, team bonding activities, and sharing of personal challenges and updates. Literature shows that team bonding can lead to higher quality relationships and the building of Psychological Safety (Edmondson Reference Edmondson1999), which leads to higher levels of learning and performance on industry teams (Carmeli, Brueller & Dutton Reference Carmeli, Brueller and Dutton2009). It has also been shown that communication platforms that allow for social interaction can influence engineering teamwork (Brisco et al. Reference Brisco, Whitfield and Grierson2020). Within subthemes, Strong teams used Physical Resources and Tools, and Plans, more often than did Weak teams. This suggests that Strong teams may spend more time on planning the project on Slack, and effective planning has been correlated with new product development outcomes in past work (Salomo, Weise & Gemunden Reference Salomo, Weise and Gemunden2007). This also can be interpreted as Strong teams taking advantage of the course’s physical resources such as labs and tools more often than Weak teams. Strong teams also showed higher overlap between the subthemes Functions and Performance and Ergonomics, suggesting discussions of user-centred performance goals. There was also a lot more overlap between Evaluating Solutions and Manufacturing, suggesting that Strong teams have joint conversations of prototyping and testing (and possibly perform physical or user testing with the prototype which leads to a more robust final product), while these are subthemes are found in separate topics within Weak teams.
5.2. Suitability of STTM
In recent years, a plethora of communication technology platforms have been rapidly developed and released into the marketplace. In conjunction with globalisation and the COVID-19 pandemic, product design teams are adopting new digital communication tools that allow collaboration to occur across geographic and temporal boundaries. Yet we still do not understand how teams are using these new tools and what communication practices result in the most successful products. These platforms can provide researchers with enormous amounts of data at the click of a button – which presents both an opportunity, and a challenge.
STTM provides the opportunity to study short messages, such as those found in instant messaging software, by relaxing the assumption that every document contains multiple topics (Yin & Wang Reference Yin and Wang2014), a key assumption of conventional topic modelling. While we found evidence of team convergence and divergence throughout the product design process, and we were able to uncover some of the communication characteristics of Strong and Weak teams, the use of this method on our dataset has some limitations. The GDSMM algorithm we used was previously validated using a news headline dataset and a tweet dataset. Although the average length of each message was not reported in the original article, the authors note that short-text settings are often characterised by documents with less than 100 words (Yin & Wang Reference Yin and Wang2014). The average size of a document in this work was just over 30 words, postprocessing. This meant that some of the topics found were small, and may not represent as important of a discussion as other topics. Slack data in this format represents a trade-off between the number of documents and the size of documents, both of which should be large for topic modelling. The more messages that are combined to create a document, the larger the average size of the document, but at the cost of a decreased number of documents. We did experiment with various definitions of a document (single message, channel-days, channel-3 days and channel-weeks) to examine this trade off, and found that our patterns of convergence and divergence remained consistent, even with document sizes at 100 words, postprocessing. Thus this method has high potential for enterprise social networks that see high frequency and high volume use; yet we have demonstrated a useful scenario even with smaller documents.
We found that the teams studied in this work used Slack primarily to discuss planning and coordination, which might be a consequence of their hybrid nature. This means that they discussed matters like meetings and preparing presentations in the same documents as discussions of the product features, functions, ergonomics, project decision making, and so forth. The presence of these common terms in many documents resulted in larger topics in which the most frequent words were all planning-related. Upon first glance, it may seem that the topic is solely about planning and coordination; however, our thematic analysis revealed additional subthemes (three additional subthemes, on average) within these topics. Thus, the topics, in this case, may require a more qualitative review to be informative of design team discussion. Additionally, we expect the informative nature of topic modelling to increase when there is more balance in the frequency of terms in general. However, we note that these project-management related discussions, such as discussing meeting times, occur in a fairly consistent number of topics throughout the entire design process. Thus, we expect that their effect on the topic modelling metrics stays fairly consistent throughout the product design process, not limiting our comparison between phases.
Current and recent undergraduate students are technologically literate, which we can see from the volume of messages in our dataset. These students provide an excellent opportunity to study the use of new and emerging communication technology because they are already comfortable with instant messaging and are not hesitant to adopt new tools in their courses (Prensky Reference Prensky2001; Van Volkom, Stapley & Amaturo Reference Van Volkom, Stapley and Amaturo2014). However, this can also create limitations when using topic modelling methods to analyse these messages. Being very technologically literate, students use Slack as they would use casual messaging software with their friends. We often see slang, shorthand, and sequences of very short messages in our dataset. These factors also contribute to some of the smaller topics found in our models.
While topic modelling provides a quick and easy way to summarise large amounts of messages from instant messaging platforms, it might not always be the most appropriate method for these datasets. Further research should consider the application of STTMs to instant messaging datasets from industry, where we might expect messages to consist of more complete and detailed thoughts. Additionally, the results of STTM on these instant messaging datasets might better serve as an input into a secondary analysis. Previous work has used the topics found in topic models as an input into network graphs (Cai et al. Reference Cai, Eagan, Dowell, Pennebaker, Shaffer and Graesser2017).
6. Limitations and future work
The first limitation of this work stems from the hybrid nature of the student design teams that we studied. These students have designated meeting times, but also frequently choose to work together in person or meet in the lab. Thus, their Slack communication is limited, and we expect that much of the technically intense or important decisions may be discussed in person. In future work, the research team plans to analyse the extent to which this limitation affects this specific dataset, by comparing previous years’ data to 2020 data, when teams had minimal faceto-face interaction. In addition, we do not have access to private Slack messages, only public. Although the teams were encouraged to use public channels so that team instructors could engage in design discussions, it is possible that we are missing some design communication that occurred via direct message.
We also recognise the limitation of our team performance metric. While expert ratings can be subjective, we chose to use this metric instead of course grades as it incorporates a holistic view of the team’s performance throughout all design activities, as well as the team’s ability to effectively collaborate throughout the process. This measure was provided by the same experienced course instructor for all 4 years of analysis, and we validated the reliability by correlating this metric to the team’s grades on their near-final prototype. However, team performance and product success is better measured as a continuum than a dichotomous measure, and during the most recent iteration of the course, we have implemented a scale measure, targeting both product success and team dynamics, that was completed by the instructors and mentors for each team.
The choice of measure of topic coherence is another limitation of this research. As this is an intrinsic measure and does not rely on an external dataset, it derives word occurrence probabilities exclusively from our corpus of messages. Due to the short nature of our messages, it makes it harder to identify when two words are similar or represent the same topic when each word only occurs with around 30 additional words. However, we expect this to be less of an issue in this analysis as we explore comparative differences between phases and teams. As all models were trained on the same quality of data and evaluated using the same metrics, the comparison holds. We also note some of the characteristics of our dataset that make STTM difficult in Section 5. Although STTM has been shown to outperform traditional topic modelling methods such as LDA when used on document lengths similar to ours (Mazarura & de Waal Reference Mazarura and de Waal2017), future work can validate this finding specifically for engineering enterprise social network data.
While we saw some evidence of team communication convergence and divergence, future work can investigate this phenomenon in digital communication more closely. If written product descriptions were available for the final designs, topic modelling could be used to track these topics throughout the design process and identify where the idea first emerges, when teams focus on the idea, and when they diverge from it. Additionally, given various theories of convergence and divergence in design (Dym et al. Reference Dym, Agogino, Eris, Frey and Leifer2005), we might expect to see patterns of this cyclical nature not only between phases, but also within them. Teams may first need to converge on the meaning of a problem statement or the expectations of an assignment before they can diverge to solve the problem. Future work can investigate if these patterns exist, although a longer design process would be needed for this analysis. In this work, we analysed phase differences based on the prescribed product design process that teams follow in this class. This allowed us to compare whether the communication characteristics represent the design activities we expect to be happening. However, this limits our ability to generalise to less structured processes. In future work, we will investigate the ability of topic modelling to automatically detect differences in these phases, without providing phase information to the model. Lastly, the complete engineering communication coding scheme provided in Wasiak et al. (Reference Wasiak, Hicks, Newnes, Dong and Burrow2010) can be applied to the original messages in this dataset, to see if findings from engineering email exist within instant-messaging style communication.
7. Conclusion
By applying STTM to enterprise social network messages, we explored the intricacies of how product design engineers use this emerging software throughout each phase of the product design process. We built STTMs from a data set comprising 250,000 messages sent by 32 teams, representing four cohorts of teams enrolled in a 3-month intensive product design course. Each STTM model represents the topics discussed by each team, in each phase of the product design process.
We presented an exploratory study which demonstrates the ability of STTM to uncover insights in enterprise social network communication, led by a case study investigating research questions regarding convergence and divergence of communication and how this differs by design process phase and team performance. Analysis of STTM results revealed a number of trends: Strong teams discuss fewer topics than weaker teams; the number of and coherence of topics presents a pattern of cyclical convergence and divergence; and teams show characteristics of Product, Project, Course, and Other themes within each topic.
We provide evidence that STTM can uncover insights into enterprise social network messages and identify communication patterns of successful teams. This work presents a step towards the possibility of tracking a team’s design process in real time. We aim to inspire fellow researchers to apply this type of modelling on the emerging corpus of instant-messaging style communication used in product design. The insights gained from this paper will provide a better understanding of how to optimise engineering design communication and collaboration. Learnings provide clarity as to the conditions which influence technology-enhanced teams and their members to perform most effectively, ultimately delivering more innovative and high-quality products.
A. Appendix
A.1. List of bigrams
List of bigrams created from all teams
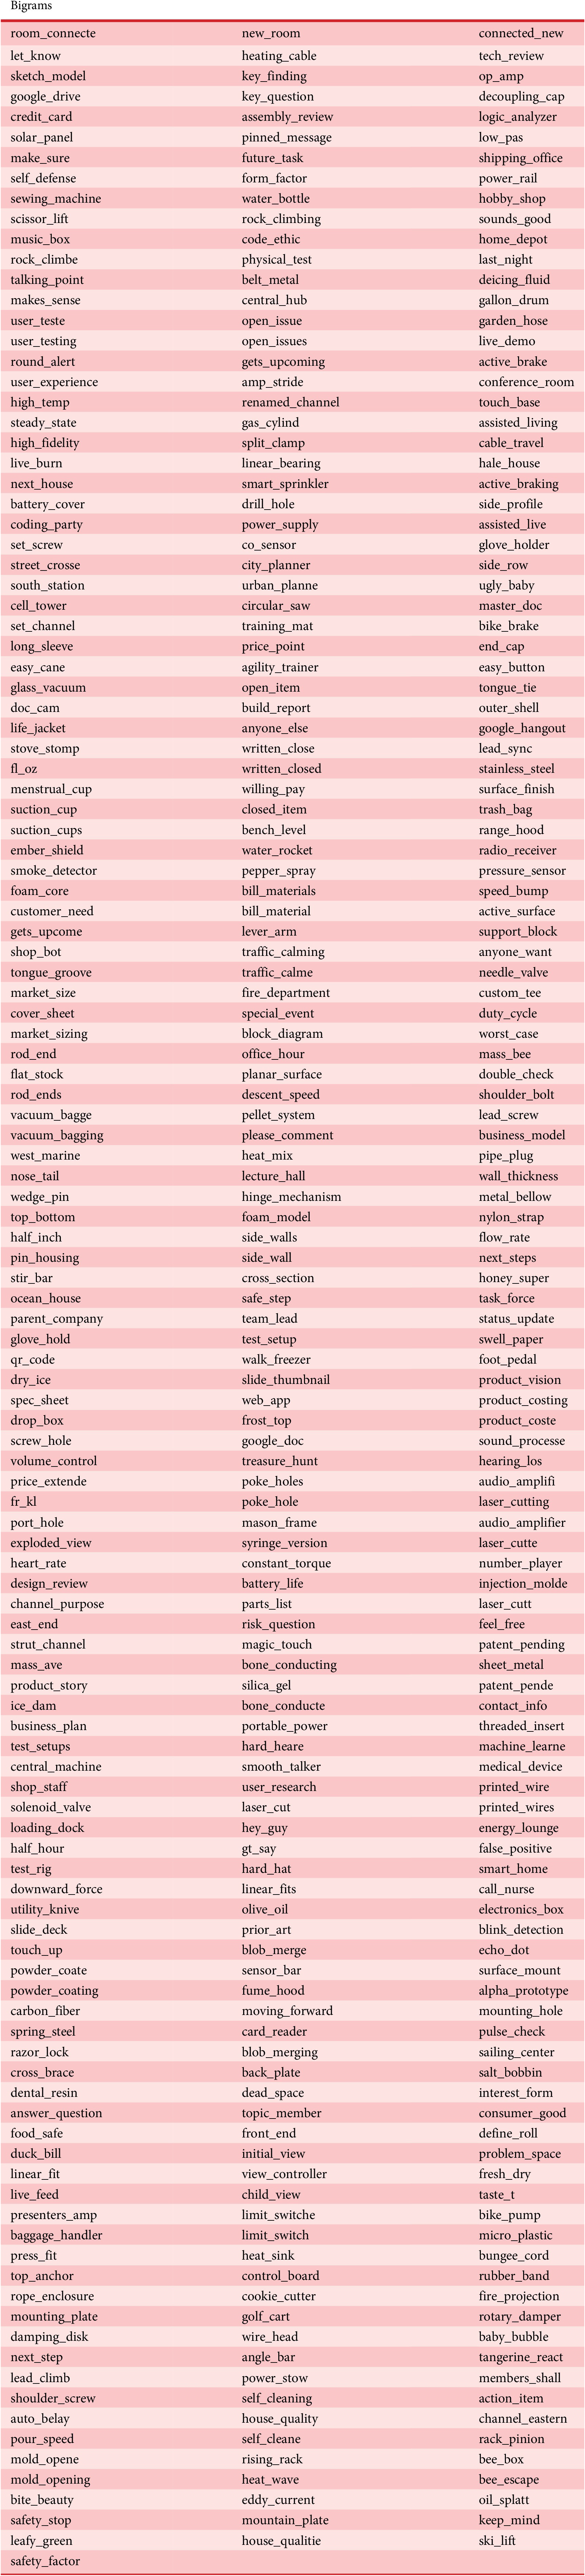


 Open access