



Many jurisdictions have implemented policies incorporating various front-of-package (FOP) interpretive labelling schemes to communicate and interpret nutritional information to consumers(Reference Kanter, Vanderlee and Vandevijvere1–Reference Jones, Neal and Reeve4). Some of the most prominent interpretive FOP labelling systems include (a) ‘warning labels’ (WL) on foods high in nutrients of concern (most commonly total/saturated fat, sugar and sodium), such as in Chile(Reference Corvalán, Reyes and Garmendia5); (b) multiple traffic light labelling (TLL), which interpret nutrient amounts for negative nutrients using easily understood colour schemes (red, amber and green) to identify foods that have ‘high’, ‘moderate’ or ‘low’ amounts, such as in the UK(6) and (c) summary systems, which consider a variety of nutrients and communicate the overall ‘healthiness’ or nutritional quality of a food or beverage product using stars, scores or symbols, such as the Health Star Rating system (HSR) in Australia and New Zealand(Reference Cecchini and Warin7). More recently, the Nutri-Score system that originated in France has been implemented in various countries across Europe, which incorporates both traffic light and summary systems(8). FOP labelling has been proposed in Canada as part of a national Healthy Eating Strategy, which incorporates ‘high in’ WL to be mandated on products with high content of sodium, sugar or saturated fat(9).
Much experimental research has been dedicated to identifying which FOP labelling system may be the most effective at communicating nutritional information to consumers, particularly examining TLL, HSR and WL(Reference Cecchini and Warin7,Reference Volkova and Mhurchu10–Reference Taillie, Hall and Popkin12) . Overall, research suggests a slightly greater impact of colour-coded FOP labelling systems such as TLL on consumer understanding and behaviour compared with HSR and WL schemes(Reference Cecchini and Warin7,Reference Volkova and Mhurchu10) ; however, fewer studies to date have included WL(Reference Taillie, Hall and Popkin12–Reference Ikonen, Sotgiu and Aydinli14), a more recent policy alternative that is less explored in the literature. The few experimental studies that have compared all three systems simultaneously have considerably mixed results regarding the superiority of the WL, TLL or HSR system or a combination of attributes (as incorporated in the Nutri-Score system), and the impact of these systems on perceived healthiness and consumer ability to understand these systems varies depending on the experimental task and outcomes included in the study(Reference Egnell, Talati and Hercberg15–Reference Egnell, Galan and Farpour-Lambert19). There is also a paucity of studies examining differences in the impact of FOP labelling across consumers with high and low health literacy(20). Lastly, few studies examining the impact of FOP interpretive labelling have used an educational intervention to teach participants about the labelling schemes before they view them on food packages in experimental tasks. This is particularly important in the Canadian context, where no mandatory or government-endorsed voluntary FOP systems have been implemented to date. To fill these gaps, the objective of the current study was to compare the effectiveness of different interpretive FOP labelling systems in their ability to help consumers understand the relative healthiness of products with varying nutritional quality when they are familiar with the labelling system used in the study.
Methods
An online survey was conducted in September/October 2017 using a representative commercial sample of 2008 Canadians recruited from an active panel of over 400 000 Canadians maintained by Leger Marketing (a professional recruitment firm). All communication took place through Leger Marketing. The sample was recruited to be as representative as possible, according to gender, age and location based on 2011 census data. Panel members were invited to participate in ‘a study on food and nutrition, and smartphone apps that talk about food’ via email and were not specifically informed that this was a study examining FOP labelling. To be eligible, participants had to speak English as a primary language, reside in Canada excluding the Northern territories, be 18 years or older and provide informed consent, do at least some of the household grocery shopping, own a smartphone (version iPhone 3 or later or Android) and be able to complete the survey on a minimum screen size of 9·7 in. Upon survey completion, participants were remunerated $10 or the equivalent in Air Miles® by Leger Marketing. The current study was conducted according to the guidelines laid down in the Declaration of Helsinki, and all procedures involving research study participants were approved by the University of Toronto Human Research Ethics board (Protocol ID 34393). Participants were shown an information screen and clicked ‘Consent and Continue’ prior to beginning the survey. The current study was registered as a randomised controlled trial (#NCT03290118).
Experimental conditions
A parallel, open-label design was used in which participants were randomised in a 1:1:1:1 ratio to one of four conditions: WL, HSR, multiple TLL or a control condition with no interpretive labelling system on the principal display panel of products. These FOP conditions were selected as they were identified as the most likely to be implemented in the Canadian policy context and were tested prior to the more widespread European adoption of the NutriScore system. Randomisation was completed by the survey company using an online randomisation system. Participants were exposed to the same labelling system for all tasks. See Fig. 1 for examples of the systems.
Examples of the experimental conditions used in all tasks*
*In all experimental conditions, participants could access the Nutrition Facts table (NFt) for all products by clicking on a link to ‘See Nutrition Information’, which included ingredient information.

FOP labels were tested on mock packages modelled after actual food packages from the Canadian food supply, altered to prevent heuristics or biases towards actual brands or products. FOP labels were applied to the bottom right of the package. A ‘zoom’ function allowed participants to enlarge sections of the image to examine package features and smaller text. In addition, participants could access the Nutrition Facts table (NFt) for all products by clicking a link to ‘See Nutrition Information’, which included ingredient information. Whether or not participants accessed the NFt in each task was recorded in the survey responses. See Supplementary Fig. 1 for an example of the zoom feature.
Nutrition information for the foods was taken from similar products available in the Canadian food supply, and nutrient profiling methods published for each of the FOP systems were used to calculate the appropriate WL, HSR or TLL information for each product. In several instances, nutritional values of products were adapted to minimise the differences in nutritional criteria between the labelling systems and to ensure alignment of the systems regarding the ordering or healthiness of products (i.e. the information portrayed on products was equivalent). Cut-offs for WL from proposed mandatory FOP WL for Canada were used which would require a ‘high in’ warning for any food that has >15 % of the daily value for sodium, saturated fat or sugar(21,22) . HSR cut-offs were based on the Food Standards of Australia and New Zealand criteria(23). TLL cut-offs were based on the United Kingdom Department of Health technical guidance for implementing FOP labels(6). As HSR and TLL cut-offs are based on 100 g or 100 ml and WL are calculated per serving size, HSR and TLL system nutrient values for saturated fat, sugars and sodium were calculated per 100 g or 100 mL, but modified to be displayed per serving size to align with nutrition labelling regulations in Canada which are on a per serving size basis.
Pre-study educational session
Before starting the survey, participants were directed to download FoodFLIP©, a smartphone application that communicates nutrition information of food products to consumers using various labelling systems (WL, HSR, TLL or the NFt) for over 15 000 food products from the Canadian marketplace and has high consumer acceptability(Reference Corvalán, Reyes and Garmendia24). The FoodFLIP© app can be used to search for Canadian foods using its phone camera as a UPC barcode scanner or by text search and provides nutrition information and interpretive nutrition information for food products. For the current study, participants were asked to scan or enter at minimum 20 products into the FoodFLIP© app from a list of actual food products and brands provided to them with varying levels of healthiness. The app displayed the labelling system to which the participant was randomised, allowing participants to familiarise themselves with the labelling system, and to learn how to identify healthier and less healthy products. See Supplementary Fig. 2 to view app images for each of the four study conditions. For any FOP labelling conditions (WL, HSR or TLL), the app directed the user to a series of comparable products within the same food category that would be ‘healthier’ according to the labelling system or indicates that they have selected the healthiest food within that food category. After the learning task, participants completed the survey and embedded experimental tasks.
Survey measures
Demographic information collected included gender, age, education, annual household income, ethnicity and self-reported height and weight to calculate BMI(Reference Ahmed, Oh and Vanderlee25). Participants were asked to complete a six-question health literacy questionnaire (The Newest Vital Sign)(26), which has been validated in the Canadian context to examine levels of numeracy and literacy(Reference Weiss, Mays and Martz27). Participant’s correct The Newest Vital Sign responses were calculated out of 6 and categorised as ‘high likelihood of low health literacy’ (scores 0–1), ‘possible low health literacy’ (scores 2–3) or ‘adequate health literacy’ (scores 4–6), as per the The Newest Vital Sign methodology(26). Label use was assessed by asking ‘Thinking specifically about all of the nutrition information on food labels (other than brand name or flavour), such as the NFt, allergen labelling, ingredients and other information you see on the various food products you buy, how often do you read these labels?’ (never, only the first time I buy a product, sometimes, usually or always).
Experimental tasks
Task 1: Perceived healthiness and purchasing intention
In Task 1, participants saw four food products (granola bars, frozen pizza, frozen vegetables in sauce and canned tomato soup) in randomised order. For each product, participants were randomised to see either a ‘healthier’ or a ‘less healthy’ product (according to Food Standards of Australia and New Zealand scoring criteria(23)) with corresponding NFt information and FOP label. Mock packages, FOP labels and NFts for the healthier and less healthy products are shown in Supplementary Fig. 3. Participants were asked how often they purchased each product type, how likely they would be to purchase each product (1 = very unlikely to 7 = very likely) and the overall healthiness of each product (1 = not at all healthy to 7 = very healthy).
Task 2: Product ranking according to healthiness
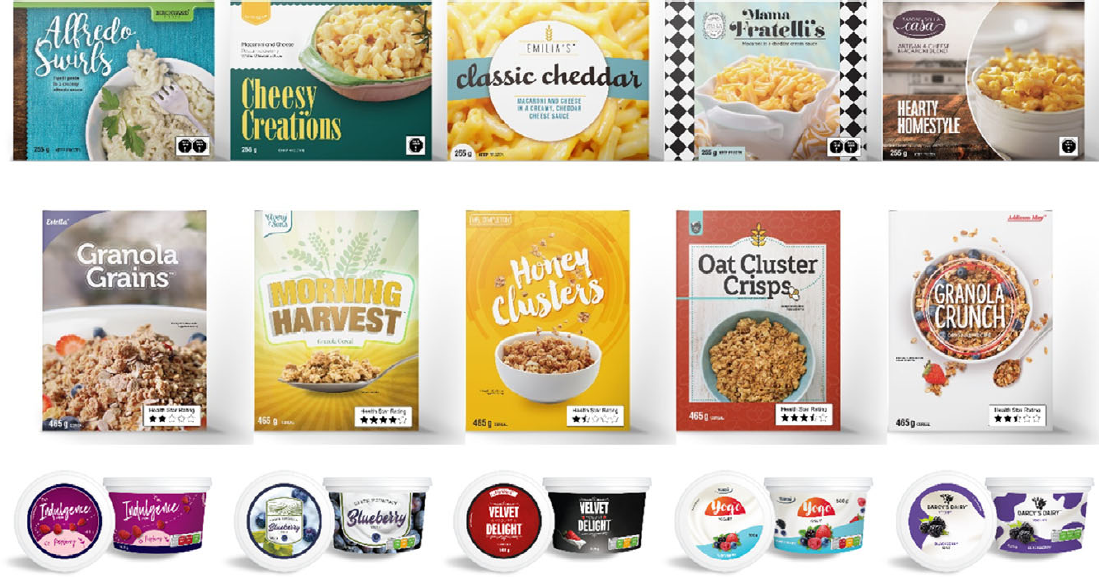
For Task 2, participants were shown five products from the same category side by side for three separate product categories (breakfast cereals, yogurts and pasta dishes) labelled with the condition to which they had been randomised. Product categories were selected to include foods that were commonly consumed, were not typically thought of as healthy or unhealthy and had sufficient variance in their nutritional profile in the Canadian marketplace. Ten image sets were randomly created for each product category to randomise the order of products shown and the ‘healthiness’ of each of the products. Examples of the product sets shown can be found in Fig. 2. The FOP labels and their relative ranking can be found in Supplementary Fig. 4. First, participants were asked ‘Please rank these products in terms of healthiness where 1 is the “most healthy” and 5 is the “least healthy” product’. Objective healthiness was based on Food Standards of Australia and New Zealand scoring criteria, a composite continuous score which adds points for nutrients to limit and deducts points for nutrients to encourage(23).
Task 2 – Ranking products according to healthiness. Examples of cereal, yogurt and pasta image sets to which front-of-package (FOP) labels were applied
Data analysis
Data analysis was conducted using SPSS version 25. Differences in mean ratings were calculated using t tests or ANOVA for normally distributed data and Mann–Whitney U tests and Kruskal–Wallis tests for non-normally distributed data. Differences in proportions were calculated using χ 2 tests. In all models, missing data were excluded on a case-wise basis.
In Task 1, generalised linear models were used with dependent variables of perceived healthiness and purchasing intention for each of the food categories (granola bars, pizza, frozen vegetables and soup) stratified by healthier and less healthy products, including variables for labelling condition (control condition, WL, HSR, TLL) and adjusting for sociodemographics, including age as a continuous variable, gender (male, female), education (high school or less, college or trade school certificate, university degree or higher), income (<$50 000 per year, $50 000 to <$100 000 per year, >$100 000 per year, not stated), ethnicity (White, otherwise), BMI (underweight/normal weight, overweight, obesity and not stated), reading of food labels (never/sometimes/only the first time and usually/always) and health literacy (likely/possible low health literacy and adequate health literacy). Individual models were conducted with two-way multiplicative interactions between the condition and health literacy score (1 = low health literacy, 2 = adequate health literacy) to examine differential impacts of the labelling systems between those with higher and lower levels of health literacy. Sensitivity analysis was conducted to examine differences in FOP influence among those who purchased the products more frequently (sometimes/usually/often). While those who purchased the products more frequently rated products as healthier, trends and patterns of significance related to the impact of the FOP conditions were very similar for perceived healthiness and intention to purchase products among those who purchased these foods frequently, with slightly diminished magnitude of impact and statistical significance of FOP labels on perceived healthiness for frozen vegetables among this population (data not shown). As such, results are shown for the entire sample.
Task 2 was analysed using Generalised Estimating Equation models for repeated measures. Two binary logistic regression models were examined (correctly identifying the healthiest product and correctly identifying the least healthy product) and one ordinal logistic regression model to examine the number of products that were correctly ranked (0, 1, 2, 3 or 5 correct responses, as it was not possible to have 4 correct responses). Models were fit with a variable for labelling condition and product, adjusted for the same variables as Task 1, in addition to a variable indicating the product set to which the participant was randomised to adjust for any differences that may have resulted from the order of products or product packaging. Two-way interactions between condition and health literacy score were again used in a separate model to examine differential impact of the FOP systems.
Lastly, analysis examined the outcome of using the NFt in Task 1 and Task 2, using the generalised linear models approach for binary outcomes, including a variable for use of the NFt in the task and the same demographic variables described above.
Statistical power
A sample size of 2000 participants (n 500 in each arm, n 250 in ‘healthier’ or ‘less healthy’ conditions for Task 1) provided 90 % power to detect a 0·4 unit difference in perceived healthiness or purchasing intention between labelling conditions (sd = 1·5), observed in similar studies.
Results
Response rates
A study flow diagram can be found in Supplementary Fig. 5. Overall, 22 907 emails were sent out, and 5936 individuals started the link. Of these, 2715 did not complete the entire survey, 1107 were screened out using eligibility criteria, 103 were screened out because the quotas for their age/gender/region were full and three had technical errors, for a total of 2008 participants who completed the entire survey. The median time to complete the survey was 47·2 min, including the smartphone app task for the pre-study education session (for which the median time was 12·5 min). Participants had the ability to pause the survey and complete it at another time.
Of the 2008 participants who completed the survey, eleven participants were removed from the sample as a result of poor data quality. Criteria applied to exclude poor quality data (careless or malicious responses) included (1) if the participant refused to answer two or more of the three main experimental tasks or (2) if the respondent responded ‘Don’t know’ to the three main experimental tasks in the survey and also responded ‘Don’t know’ to three or more of five questions considered by the research team to be variables that are not typically sensitive for participants to report. The final sample size was 1997.
Sample characteristics
Table 1 shows the sample characteristics of the respondents. The sample had an average age of 39·2 years (sd = 12·5) and had more younger participants, fewer participants with low income and a slightly lower proportion of White participants than the general Canadian population(Reference Mansfield, Wahba and Gillis28).
Sample characteristics of the final sample (n 1997)*

WL, warning labels; HSR, health star ratings; TLL, traffic light labelling.
Of the sample, 10 % had ‘likely low health literacy’ according to the The Newest Vital Sign, 13 % had ‘possible low health literacy’ and 77 % had ‘adequate health literacy’. When asked about reading labels, 5 % never read food labels, 12 % read labels only the first time they buy a product, 33 % sometimes, 30 % usually and 19 % always read labels (1 % of the sample did not report their label use).
There were no significant differences in sample characteristics between experimental conditions with the exception of income (X 2 = 19·4, P = 0·022) which was adjusted for in all models, along with other sociodemographic factors.
Task 1: Perceived healthiness and purchasing intention
The frequency of purchasing granola bars, frozen pizzas and canned or packaged soup was similar (65, 55 and 58 % of participants sometimes/often/always purchased the product); participants purchased frozen vegetables with sauce less often (21 % sometimes/often/always purchased the product).
Perceived healthiness of products
Of the entire sample, 54, 25, 52 and 80 participants reported ‘Don’t know’ or ‘Refused’ for the reported healthiness for granola bars, pizza, frozen vegetables and soup, respectively, and were excluded from further analysis of perceived healthiness. The overall ratings for products in each of the labelling conditions can be found in Fig. 3. Frozen vegetables were perceived as the healthiest (4·35 on a Likert-type scale of 1–7 where 7 is ‘very healthy’, sd = 1·64), followed by granola bars (3·95, sd = 1·76), soup (3·87, sd = 1·71) and pizza (3·17, sd = 1·57). Within all product categories and in all conditions, participants overall correctly rated products with the healthier profile (according to the nutrient profiling methods) as healthier and the less healthy profile as less healthy.
Task 1 – Perceived healthiness of granola bars, pizza, frozen vegetables and soup when they have a healthier or less healthy nutritional profile* (n 1983)
*Superscripts indicate results from linear regression models within product category stratified by product healthfulness (healthier or less healthy product), adjusted for gender, income, education, BMI, ethnicity, health literacy and nutrition label use.
**Note that in the labels for granola bars, they were erroneously labelled as 500 kcal per serving in the FOP information for the traffic light condition in both the healthier and less healthy scenarios.
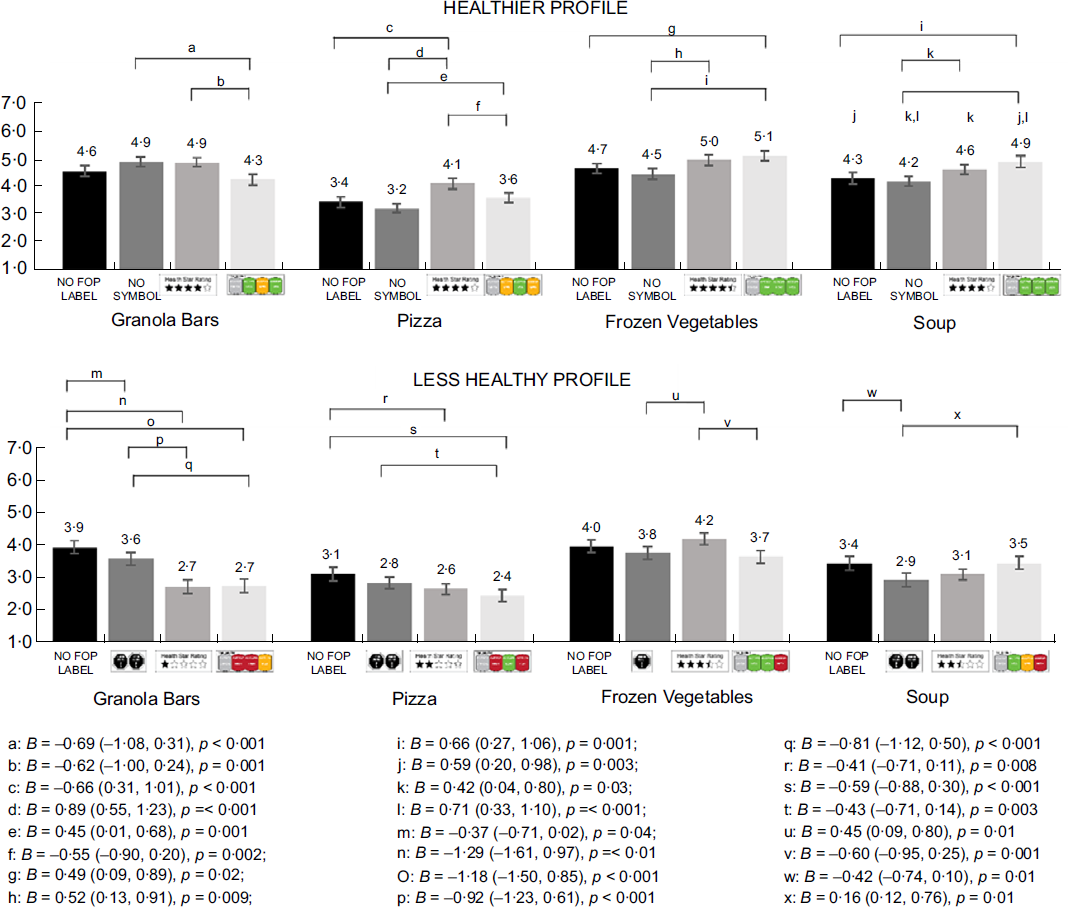
For healthier products, those who saw the HSR had significantly higher perceptions of healthiness for one category (pizza) compared with the control, for two categories (pizza, granola bars) compared with the TLL and for three categories (pizza, frozen vegetables, soup) compared with the WL. Those who saw the TLL had significantly higher perceptions of healthiness for two categories (frozen vegetables, soup) compared with the control and higher perceptions for three categories (pizza, frozen vegetables, soup) compared with the WL. There were no differences in perceived healthfulness of the healthier products between the WL and the control in any category. The TLL had higher rated healthiness compared with the control when there were three ‘green lights’, whereas the HSR (of four stars or more) only had an effect compared with the control for the least healthy food option (pizza).
For the less healthy products, those who saw the HSR had significantly lower perceptions of healthiness for two categories (granola bars, pizza) compared with the control and one category (granola bars) compared with the WL. Similarly, those who saw the TLL had significantly lower perceptions of healthiness for two categories (granola bars, pizza) compared with the control and compared with the WL. Those who saw the WL had significantly lower perceptions of healthiness than the control for two categories (granola bars, soup). Higher perceptions of healthiness were seen in the HSR condition for one category (frozen vegetables with 3·5 stars) compared with the WL with 1 warning symbol and the TLL with two green lights, and in the TLL condition for one category (soup) compared with the WL (with two warnings). The TLL only had a suppressive effect compared with the control when there were two red lights, and the HSR only had an effect compared with the control when there were two or fewer stars.
Perceived healthiness according to health literacy is shown in Supplementary Fig. 6a. In adjusted linear regression models, health literacy was significantly associated with perceived healthiness for all products except for the healthier frozen vegetables and healthier soup, such that those with low health literacy rated all products as healthier (P ≤ 0·01 for all, data not shown). The interaction term between labelling condition and health literacy tested in a model was not significant for healthier or less healthy products for any food category, suggesting that there was a similar effect of health literacy on purchasing intentions across all of the FOP systems for all products at all levels of healthiness (data not shown).
Purchasing intentions
Of the entire sample, 37, 26, 41 and 33 participants reported ‘Don’t know’ or ‘Refused’ for purchasing intentions for granola bars, pizza, frozen vegetables and soup, respectively. Purchasing intentions across food categories for healthier and less healthy products can be found in Fig. 4. Participants reported highest purchasing intentions for the granola bars (3·8 on Likert-type scale of 1 to 7, where 7 is very likely to purchase sd = 1·9), followed by pizza (3·7, sd = 1·9), frozen vegetables (3·7, sd = 2·0) and soup (3·4, sd = 1·9). Within all product categories and in all conditions, participants reported higher purchasing intentions for the healthier product than the less healthy product (P < 0·05 for all).
Task 1 – Intention to purchase granola bars, pizza, frozen vegetables and soup when they have a healthier or less healthy nutritional profile* (n 1983)
*Superscripts indicate results from linear regression models within product category stratified by product healthfulness (healthier or less healthy product), adjusted for gender, income, education, BMI, ethnicity, health literacy and nutrition label use.
**Note that in the labels for granola bars, they were erroneously labelled as 500 Kcal per serving in the FOP information for the traffic light condition in both the healthier and less healthy scenarios.
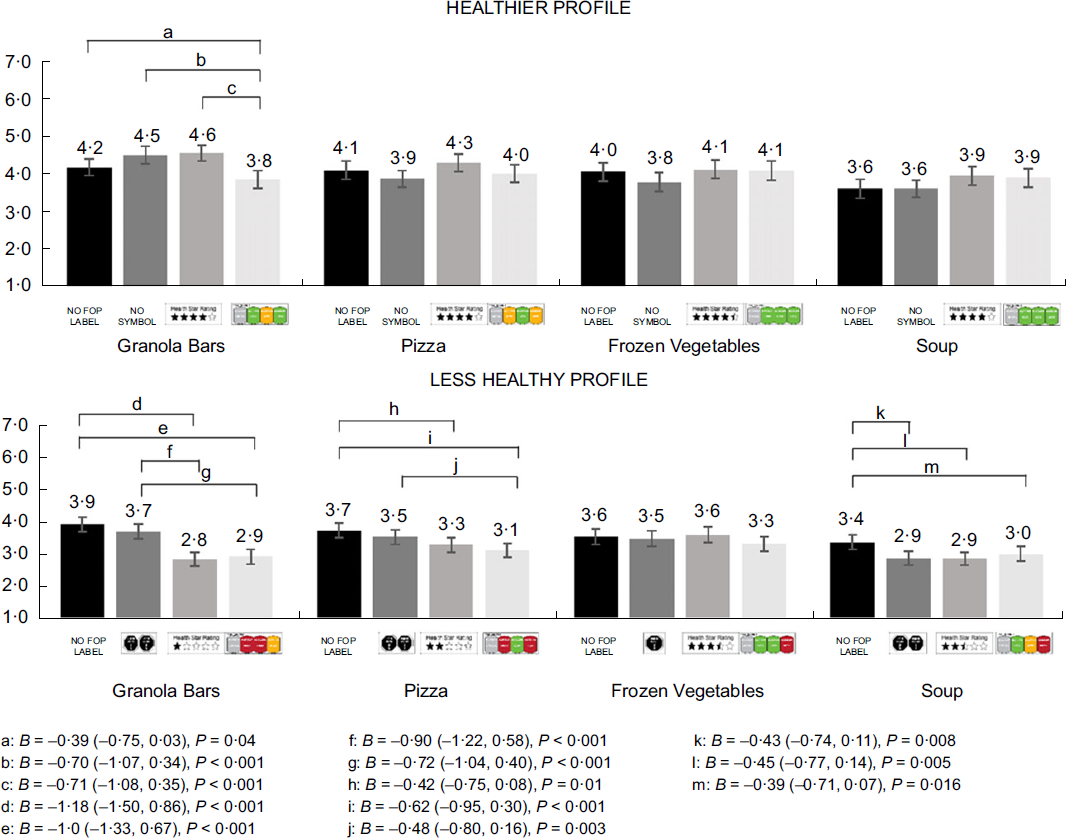
There were similar trends in purchasing intention between FOP conditions, albeit less impact on healthier products. For healthier products, those in the TLL condition had lower purchasing intentions for granola bars compared with the all other conditions. For less healthy products, those who viewed the TLL had lower purchasing intentions for three categories compared with the control (granola bars, pizza and soup), and lower purchasing intention for two categories when compared with the WL (granola bars and pizza). Similarly, those in the HSR condition had lower purchasing intentions for three categories compared with the control (granola bars, pizza, soup) and for one category when compared with the WL (granola bars). Those who viewed the WL condition had significantly lower purchasing intentions for one category (soup). There was no effect of FOP labelling condition on frozen vegetables for healthier or less healthy foods.
Supplementary Fig. 6b shows purchasing intentions according to health literacy. In adjusted linear regression models, those with lower health literacy consistently had higher purchasing intentions for all products (P ≤ 0·001 for all, data not shown). The interaction term between labelling condition and health literacy tested in a model was not significant for healthier or less healthy products, suggesting that there was a similar effect of health literacy on purchasing intentions across all of the FOP systems (data not shown).
Task 2: Product ranking according to healthiness
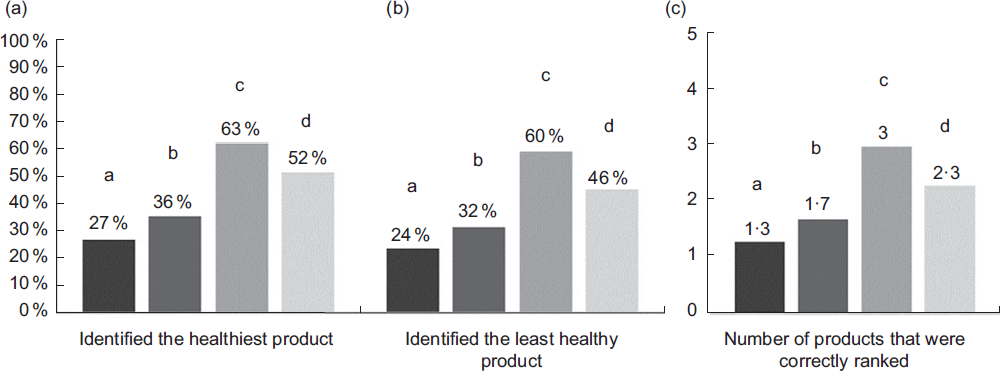
Figure 5 shows the percentage of the study population that correctly identified the healthiest and least healthy product among the five products shown in each of the FOP conditions.
Task 2 – The proportion of the sample that (A) correctly selected the healthiest product, (B) correctly selected the least healthy product and (C) the mean number of correct responses in the ranking task.*†
*Values with different letters indicate significant differences (P < 0.05) in repeated measures analysis using logistic regression (A & B) or ordinal logistic regression (C), adjusted for gender, income, education, BMI, ethnicity, healthtpfmt 0literacy and nutrition label use
†Note that figures 5A and 5B represent a proportion, whereas Figure 5C represents the mean number of responses in each of the FOP conditions.
Ability to correctly identify healthiest product
In repeated measures analysis, participants were significantly more likely to correctly identify the healthiest product when they viewed the HSR system compared with all other conditions (Adjusted OR (AOR) = 5·25, 95 % CI 4·32, 6·37, P < 0·001 v. control; AOR = 3·36, 95 % CI 2·78, 4·07, P < 0·001 v. WL; AOR = 1·65, 95 % CI 1·37, 2·02, P < 0·001 v. TLL); in the TLL compared with the control (AOR = 3·1, 95 % CI 2·67, 3·75, P < 0·001) and WL (AOR = 2·03, 95 % CI 1·71, 2·40, P < 0·001); and in the WL condition compared with the control (AOR = 1·53, 95 % CI 1·32, 1·85, P < 0·001).
Ability to correctly identify least healthy product
Overall, participants were significantly more likely to correctly identify the least healthy product when they viewed the HSR compared with all other conditions (AOR = 4·96, 95 % CI 4·12, 5·98, P < 0·001 v control; AOR = 3·38, 95 % CI 2·82, 4·07, P < 0·001 v. WL; AOR = 1·79, 95 % CI 1·19, 2·15, P < 0·001 v. TLL); in the TLL compared with the control (AOR = 2·78, 95 % CI 2·34, 3·29, P < 0·001) and the WL (AOR = 1·89, 95 % CI 1·60, 2·24, P < 0·001) and in the WL compared with the control (AOR = 1·47, 95 % CI 1·24, 1·74, P < 0·001).
Ability to correctly rank products according to healthiness
In the ordinal logistic regression, participants were significantly more likely to correctly rank more products in the HSR than all other conditions (AOR = 6·99, 95 % CI 5·77, 8·46, P < 0·001 v control, AOR = 4·71, 95 % CI 3·87, 5·72, P < 0·001 v WL, AOR = 2·27, 95 % CI 1·87, 2·76, P < 0·001 v. TLL), in the TLL compared with the control (AOR = 3·08, 95 % CI 2·67, 3·56, P < 0·001) and the WL condition (AOR = 2·07, 95 % CI 1·79, 2·41, P < 0·001) and WL condition compared with the control condition (AOR = 1·49, 95 % CI 1·29, 1·71, P < 0·001).
Number of correct ranking responses and health literacy
See Supplementary Fig. 7 for average number of correct responses in Task 2 according to health literacy in each FOP condition for each of the three foods examined. In ordinal regression models, there were significant interactions between the labelling condition and health literacy (P < 0·05) for each of the food categories in Task 2. There was a greater difference in correctly identifying the healthiest, least healthy and number of correct responses between those with low and adequate health literacy among those who saw TLL compared with those who were in the control and WL condition in all food categories (logistic regression results not shown).
Nutrition facts table use
Supplementary Fig. 8 shows the frequency that participants clicked on the link to access the NFt. Across Task 1, participants were significantly less likely to view the NFt in the TLL condition than the HSR (AOR = 0·54, 95 % CI 0·41, 0·72, P < 0·001), the WL (AOR = 0·46, 95 % CI 0·35, 0·60, P < 0·001) and the control condition (AOR = 0·39, 95 % CI 0·30, 0·51, P < 0·001). Participants were also significantly less likely to view the NFt in the HSR condition compared with the control condition (AOR = 0·72, 95 % CI 0·55, 0·94, P = 0·02).
In Task 2, participants were also significantly less likely to click on the nutrition information link in the TLL condition compared with the HSR (AOR = 0·49, 95 % CI 0·37, 0·64, P < 0·001), the WL (AOR = 0·48, 95 % CI 0·37, 0·63, P < 0·001) and the control (AOR = 0·43, 95 % CI 0·33, 0·57, P < 0·001) conditions.
Discussion
Providing nutrition information to consumers on the principal display panel of foods may help support healthier food choices. These results support the current body of literature that the three different types of FOP labelling schemes tested influence consumer perceptions and intentions to purchase products to different extents, and all of the FOP systems helped consumers identify healthier and less healthy products compared with the control without any FOP label(Reference Croker, Packer and Russell13,29) . The differences in perceived healthiness between healthier and less healthy products demonstrate that at least some attention was paid to the food labels in the tasks, as has been demonstrated in previous research(Reference Taillie, Reyes and Colchero30). While the impact of the various systems varied between tasks and product categories, a series of common trends emerged.
Ratings of perceived healthiness and purchasing intentions
In most product categories, the HSR and TLL increased perceived healthiness of a healthier product and decreased the perceived unhealthiness of a less healthy product, when compared with the WL or control conditions, and the impact of the TLL was slightly greater than that of the HSR system. There was less impact of the FOP labels on purchasing intentions, which mostly resulted in a suppression of purchasing intentions of less healthy products, in alignment with decreased perceived healthiness. The current study found that perceived healthiness and purchasing intentions were more greatly suppressed when FOP carried at least two red lights in the TLL, two or fewer stars in the HSR, and to some extent, two warning symbols. This is consistent with research that has found that consumers are more likely to be influenced by red traffic lights or negative labelling(Reference van Herpen, Hieke and van Trijp31) and suggests that consumers may be more likely to use FOP information to avoid less healthy foods, and not identify more healthy foods.
While scant research has compared all of these systems, the literature has identified TLL as being better able to help consumers interpret the healthiness of products compared with product with no labels(Reference Scarborough, Matthews and Eyles32–Reference Talati, Pettigrew and Dixon35). Other studies have not seen as pronounced of an effect of the HSR compared with other systems, as was seen in the current study(Reference van Herpen, Seiss and van Trijp34). Differences in results may be due to the vast majority of FOP labelling research being conducted outside Canada. The WL system had comparatively different effects than the HSR and TLL. Overall, WL had a greater effect for products that are perhaps more ‘nutritionally ambiguous’ less healthy products (i.e. granola bars and canned soup) compared with pizza and frozen vegetables, which received the lowest and highest ratings of healthiness, respectively. Recent research examining WL and a binary TLL system similarly found that WL may be most effective on products that were incorrectly perceived to be healthier, which appears to align with the current findings(Reference Talati, Pettigrew and Kelly36–Reference Arrúa, Machín and Curutchet38).
It is not surprising that there were no differences in perceptions of healthiness between the control and WL condition for the healthier products, as the healthier versions of the products did not carry a WL. This is a novel characteristic related to the WL system, as it is not present on all products; a lack of a WL symbol implies healthiness, with no additional cues for consumers. These findings show that the HSR and TLL were more likely to produce a positivity bias or ‘health halo’ for healthier food products, as has been seen in other research(Reference Ikonen, Sotgiu and Aydinli14,Reference van Herpen, Seiss and van Trijp34) , which was particularly apparent when there were three green lights in the TLL condition. In contrast, there was no similar ‘halo’ effect seen with the WL. Given that HSR and TLL schemes have only been implemented on a voluntary basis and tend to appear on healthier food products(Reference Lima, Ares and Deliza39) and may actually be used by strategically by industry in order to imply this ‘halo effect’ on healthier foods, these labelling schemes (when implemented voluntarily) may be less useful in helping consumers avoid less healthy foods.
The current study also uniquely employed a brief educational session prior to the study, in an attempt to simulate real-world scenarios, whereby consumers would be exposed to food labels on store and cupboard shelves as well as accompanying communication and education campaigns, and thus have a level of familiarity with the labels and the information they communicate. While some labels may be implicitly better understood by consumers, accompanying consumer education campaigns may improve consumer noticing and understanding of these systems. The current study was unable to determine whether or not this pre-study educational session influenced consumer understanding of the FOP systems.
Ranking product healthiness
All interpretive FOP systems assisted consumers in ranking product healthiness compared with the control, with the HSR performing best, followed by the TLL and WL. This is likely a result of the task examined in this part of the study, which is more aligned to systems that provide a rating scale (i.e. provide multiple levels of comparison). The systems examined in the current study differed in the specificity of the nutritional information that they described, in the different levels for classification that were possible, and the variation that was present within food categories. For example, there are twenty-seven permutations possible with the TLL, nine ordinal levels for the stars and four possible numbers of warning symbols (0, 1, 2 or 3) with eight possible permutations of the WL in the current study. The nature of the HSR, which is to rate product healthiness on a nine-point system, likely contributed to the greater performance in the ranking task. The additional level of specificity in the TLL (green, amber or red) compared with the WL (high or not high and the number of symbols) makes the former system more amenable to ranking tasks. This was highlighted in the development of the experimental tasks; in order to align the nutritional profiles of products in the tasks, the two ‘least healthy’ products in the cereal and pasta product sets received two WL symbols and had two red and one yellow nutrient in the TLL condition. In addition, this task also did not include comparisons across product categories, which is more challenging using an HSR-type system with a nutrient profiling system that may better facilitate comparisons within, and not between, HSR product categories. These results demonstrate important differences between the systems in terms of the information communicated and the desired policy objectives, for which they may be better suited.
These results are similar to other FOP studies that have found differing results in consumers’ ability to rank products in comparison tasks between types of products or between healthier and less healthy products(Reference Mhurchu, Eyles and Choi40). Future research will be needed to determine whether the differential impact between food product categories is related to consumer inherent perceptions of the food categories, or the information communicated on the labels themselves.
Health literacy
Previous research has linked diet quality and health literacy(Reference Carrad, Louie and Milosavljevic41–Reference Kuczmarski, Adams and Cotugna43), and information-based interventions such as food labelling have been identified as having the potential to exacerbate already apparent health disparities linked to socioeconomic status or health literacy(Reference Zoellner, You and Connell44). The current study found differences in perceived healthiness of the packaged foods included in the current study by health literacy, such that those with lower levels of health literacy consistently viewed packaged products as healthier, but with no differential impact of health literacy between the FOP systems. Previous research has shown similar findings among those with low and high income(Reference Olstad, Teychenne and Minaker45).
There was a greater gap in understanding and application of the FOP systems in the ranking task between those with low and adequate levels of health literacy when using the TLL system. This may relate to the amount of information communicated in the TLL system and the level of literacy required to correctly interpret the information. For example, within the TLL system, consumers may experience dissonance when products have both high (i.e. red) levels of some nutrients and low (i.e. green) levels of others, which may be more taxing to those with lower levels of health literacy. However, those with low literacy had better performance when in the HSR system compared with the control condition, despite the consistent disparity in understanding between higher and lower literacy seen for all systems. If these findings were to translate to a real-world setting, they indicate that implementing the HSR, and to a lesser extent the TLL, may have the potential to increase disparities between those with higher and lower literacy levels, but would have an overall positive effect at the population level, even among those with lower health literacy.
Use of the nutrition facts table
The current study found that between one-third and two-thirds of participants accessed the NFt depending on their task and FOP condition, which is considerably lower than 72 % of Canadian consumers who self-report NFt use(Reference Machín, Cabrera and Curutchet46). Fewer participants accessed the NFt in the TLL condition, perhaps a result of greater understanding of the information displayed on the label without the need to reference additional information in this condition, or because consumers felt that they had more information (e.g. for multiple nutrients at three levels) upon which to base their decision, compared with systems that summarised nutritional information without showing information for specific nutrients.
Limitations & strengths
This online study is not able to provide an objective measure of label influence on purchasing behaviour in a real-world setting. The sample was drawn from an online panel and required participants to be smart phones users, which may limit the generalisability of the results to general populations, although more than 80 % of Canadians are smartphone users across all age groups(47). The study did not test FOP salience and purposefully directed attention towards the labels to test the impact on consumer understanding when consumers were aware that this information was present. The tasks in the current study (rating perceived healthiness and ranking tasks) also may be better suited to some FOP systems (specifically, HSR and TLL labelling), and there may be other tasks in which WL have superior performance (e.g. identifying a product that is high in a nutrient of concern). The use of the Food Standards of Australia and New Zealand criteria to quantify objective healthiness may have also contributed to improved performed of the HSR, as these criteria form the basis for the HSR labelling system. Experimental tasks such as those presented in the current study also do not consider other policy implications of implementing a FOP labelling, such as the potential for FOP regulations to encourage product reformulation, or government’s regulatory authority to implement such systems. Lastly, there was a small error in the FOP traffic light condition for one food product (granola bars), which may have influenced perceptions of the healthfulness and intention to purchase; however, we think the effect would be minimal and does not affect the overall study conclusions. Strengths include that the study provides an objective measure of understanding (e.g. the ranking task) and included products with varying levels of healthiness, and thus varying levels of information in the TLL, HSR and WL systems, in each of the tasks. Uniquely, the current study included an educational session prior to label exposure to simulate the effect of educational campaigns and increased consumer awareness and understanding of labelling systems that would likely occur over time after such a program was widely implemented, and therefore, the results may more closely align with what a longer-term impact of FOP labelling systems might be in a real-world setting.
Policy implications
The current study suggests that the implementation of any FOP labelling system, alongside a brief educational session, has potential to impact perceptions of food product healthiness across a wide spectrum of food types and that this effect may differ depending on the nutritional quality of the products and the information communicated on those labels. While all of the systems decreased perceived healthfulness and purchasing intentions when they were displayed on less healthy products, there was evidence of a positivity bias among labels that portrayed positive labelling for healthier products (i.e. TLL and HSR systems). If ability to rank products is a policy objective, systems with greater levels of comparison may be better suited for this purpose. The results highlight strengths and weaknesses of each of the FOP labelling systems and reinforce the trade-offs between the different systems.
Acknowledgements
Acknowledgements: N/A. Financial support: Heart and Stroke Foundation of Canada (M.R.L.), E.W. McHenry Research Chair Grant (M.R.L.), Canadian Institutes of Health Research Banting Postdoctoral Fellow (L.V.), CIHR Frederick Banting and Charles Best Canada Graduate Scholarship (GSD-152299) (B.F.A.); Department of Nutritional Sciences Graduate Student Fellowship (B.F.A.), Mitacs-Elevate Postdoctoral Fellowship (M.A.) and Ontario Graduate Scholarship (M.A.). Conflict of interest: L.V. has no conflict of interests. Prior coming to the University of Toronto Beatriz Franco-Arellano was a PepsiCo Mexico employee. M.A. is a Mitacs Elevate Postdoctoral Fellow at the University of Toronto jointly funded by Mitacs and the Nestlé Research Center. None of the previous companies/organisations was involved in any way in the present research. A.O. has no conflict of interests. M.A. has received research grants from the Canadian Institutes of Health Research, Canadian Stroke Network, Burroughs Wellcome Fund, Government of Canada, Heart and Stroke Foundation of Canada, International Development Research Centre and University of Toronto (unrestricted research funds). The funding sponsors had no role in the design of the study, data collection and analyses, decision to publish or preparation of the manuscript. Authorship: L.V., B.F.A., M.A. and M.R.L. designed the research; L.V., B.F.A., M.A., A.O. and M.R.L. conducted the research; L.V. and W.L. analysed the data; L.V. wrote the paper and M.R.L. had primary responsibility for final content. All authors read and approved the final manuscript. Ethics of human subject participation: The current study was conducted according to the guidelines laid down in the Declaration of Helsinki, and all procedures involving research study participants were approved by the Research Ethics Board at the University of Toronto. Written informed consent was obtained from all participants.
Supplementary material
To view supplementary material for this article, please visit https://doi.org/10.1017/S1368980020003213



