

Introduction
Global sea-level reconstructions from coral dating or other techniques show that the sea level at the Last Glacial Maximum (LGM, around 20 ka) was lower by about 120m than the present day (e.g. Reference FairbanksFairbanks, 1989; Reference BardBard and others, 1996; Reference Yokoyama, de Deckker, Lambeck, Johnston and FifieldYokoyama and others, 2001). Melting of ice sheets during the last deglaciation was a dominant influence on sea-level change, but estimates of the contribution of the Antarctic ice sheet to this change vary widely from 0.5 to 38 m (Reference McIntyreMcIntyre and others, 1981; Reference Budd and SmithBudd and Smith, 1982; Reference OerlemansOerlemans, 1982; Reference Nakada and LambeckNakada and Lambeck, 1988; Reference BentleyBentley, 1999; Reference Ritz, Rommelaere and DumasRitz and others, 2001; Reference Denton and HughesDenton and Hughes, 2002; Reference HuybrechtsHuybrechts, 2002; Reference PeltierPeltier, 2002). In addition, the contribution of the Antarctic ice sheet to a rapid and large sea-level rise by 20–25 m during a period of 500 years at 14 ka bp, referred to as meltwater pulse 1a (MWP1a), has been discussed by, for example, Reference Bassett, Milne, Mitrovica and ClarkBassett and others (2005, Reference Bassett, Milne, Bentley and Huybrechts2007).
Reference Conway, Hall, Denton, Gades and WaddingtonConway and others (1999) show that there was migration of the grounding line position in the Ross Sea from the LGM to the present, and the grounded area has varied significantly during the deglaciation period. An ice-sheet model is therefore required to simulate ice-sheet floating or ice-shelf grounding in order to follow the migration of the transient grounding line position. Several studies have applied combined ice-sheet/ice-shelf models to simulate the time evolution of the Antarctic ice sheet over glacial/interglacial cycles (Reference Ritz, Rommelaere and DumasRitz and others, 2001; Reference Huybrechts, Gregory, Janssens and WildHuybrechts and others, 2004; Reference Philippon, Ramstein, Charbit, Kageyama, Ritz and DumasPhilippon and others, 2006; Reference Pollard and DeContoPollard and DeConto, 2009).
Reference Philippon, Ramstein, Charbit, Kageyama, Ritz and DumasPhilippon and others (2006) found a 17.5 m contribution of the Antarctic ice sheet to the change in sea level during the last glaciation using an Earth system model in which the interactions between the atmosphere, ocean, vegetation and major ice sheets are represented. However, they fail to simulate the complete deglaciation over the Weddell region to match present observations.
This may be partly explained by the work of Reference Vieli and PayneVieli and Payne (2005) and Reference SchoofSchoof (2007), who found that there is still some difficulty in simulating the grounding line position and its migration in numerical ice-sheet models. Reference Vieli and PayneVieli and Payne (2005) concluded from a comparison of several numerical models that there is no consensus on how the grounding line should react to changes in boundary conditions. On the other hand, Reference SchoofSchoof (2007) showed that fixing the grounding line and using the shallow-ice approximation (Reference HutterHutter, 1983) yields good estimates of the ice-sheet profile, and that prescribing the grounding line position is effectively the same as assuming a back pressure from an ice shelf.
In this study, a different approach to Reference Ritz, Rommelaere and DumasRitz and others (2001) and Reference Philippon, Ramstein, Charbit, Kageyama, Ritz and DumasPhilippon and others (2006) is taken: the steady-state surface topography is simulated by a grounded-only (i.e. ice shelf is not included) ice-sheet model. Instead of simulating the transient variation of grounded ice area, the maximum possible influence on ice volume of prescribed and fixed areas of grounded ice is discussed. The effects of changes in ice-grounded area in the Weddell, Ross, Amery and other marginal areas are each evaluated separately. Moreover, a transient experiment forced by glacial/interglacial climate change without variation in the grounded ice area is examined. A comparison between the sensitivity of ice-sheet volume and surface elevation obtained by the steady-state grounded-area experiment and the transient experiment is presented.
Model Description
The numerical model utilized in this paper, Ice sheet model for Integrated Earth system Studies (IcIES), is described in Reference Saito and Abe-OuchiSaito and Abe-Ouchi (2004). It is a time-dependent, three-dimensional (3-D) model including thermodynamics. The basic parts of the present model are the same as for other 3-D models with thermomechanical coupling used in previous studies (e.g. Reference Ritz, Rommelaere and DumasRitz and others, 2001; Reference Abe-Ouchi, Segawa and SaitoAbe-Ouchi and others, 2007). The model computes the evolution of the ice thickness, bedrock elevation and ice temperature under a prescribed scenario of climate forcing, in terms of the surface mass balance and temperature. The model settings such as the numerical domain, resolution, physical parameters and climate-forcing parameterizations follow Reference Saito and Abe-OuchiSaito and Abe-Ouchi (2004). Only the essence of the ice-sheet dynamics and the framework of numerical ice-sheet models are repeated below.
The evolution of surface elevation is determined by the continuity equation for the local ice thickness with a prescribed surface accumulation function. The shallow-ice approximation is applied (Reference HutterHutter, 1983) using Glen’s flow law with an exponent of n = 3 (Reference PatersonPaterson, 1994) for the velocity computation. From this approximation, the horizontal velocity vector ![]() can be calculated using surface elevation h and bedrock topography b:
can be calculated using surface elevation h and bedrock topography b:

where g is acceleration due to gravity, ρ
I is the density of ice, ![]() is basal sliding velocity and |∇h|2 = (∂h/∂x)2+(∂h/∂y)2.
is basal sliding velocity and |∇h|2 = (∂h/∂x)2+(∂h/∂y)2.
The gradient in Equation (1) is in the horizontal direction only. The rate factor A(T), through which the velocity and temperature fields are coupled, follows Reference HuybrechtsHuybrechts (1992) and Reference PatersonPaterson (1994). The enhancement factor m in Equation (1), which controls the softness of ice, implicitly reflects the effects of impurity and/or anisotropy of ice. It is used as a tuning parameter to improve the agreement between measured and modelled topography. Basal sliding is assumed to occur only when the basal ice is at the pressure-melting point, using a Weertman-type (Reference WeertmanWeertman, 1964) sliding parameterization. Reference Bueler and BrownBueler and Brown (2009) showed that with this kind of pressure-melting point activation of sliding, such a driving-stress-dependent sliding law will cause problems under significant grid refinement; this is potentially an important issue for future work.
The temperature distribution is calculated from the thermodynamic equation with prescribed surface temperature and geothermal heat flux at the base as boundary conditions, including the frictional heat from sliding and neglecting the basal melt rate. A prescribed temperature distribution is imposed at the surface of the ice, whereas mixed boundary conditions are applied at the bottom of the ice:

where k I is the thermal conductivity of ice, T pm is the pressure-melting point and Γ is the geothermal heat flux. The geothermal heat flux may not be spatially non-uniform, but is taken as a constant in the present paper. Changes in the glacier bed elevation are calculated by a linear model expressing local isostatic rebound with a prescribed time constant.
Surface mass balance is calculated by the accumulation rate alone. It is expressed as the product of a reference value and a temperature-dependent factor following Reference Huybrechts and OerlemansHuybrechts and Oerlemans (1990). Accumulation rates are reduced to 50–60% of their Holocene values with a 10 K decrease in surface temperature. The present reference accumulation is based on the data compiled by Reference Huybrechts, Steinhage, Wilhelms and BamberHuybrechts and others (2000), whose value at Dome Fuji are modified to 2.75 cm a−1 according to Reference Satow, Watanabe, Shoji and MotoyamaSatow and others (1999). The data in the vicinity of Dome Fuji are smoothed after the modification. The annual surface temperature is parameterized as a function of latitude and surface elevation following Reference Fortuin and OerlemansFortuin and Oerlemans (1990) and Reference Pattyn and DecleirPattyn and Decleir (1995).
The dynamics of both the ice shelves and of the grounding lines are not included in the present model. The lateral boundary is defined by floating conditions; ice that becomes afloat is cut off immediately.
The model domain spans 5600 × 5600 km, centred at the South Pole. The horizontal resolution is 40 km. The bedrock topography is based on the BEDMAP database (Reference Lythe and VaughanLythe and others, 2000). Different time-steps are used: Δt = 4.0 years for the computation of the dynamic evolution and Δt=20.0 years for the thermodynamic evolution.
Experiment Design
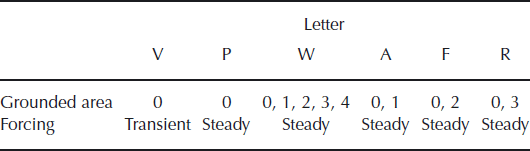
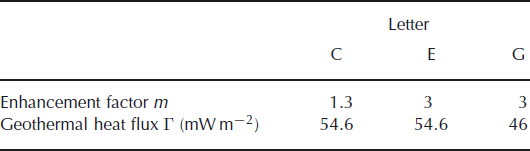
All the experiments in the present paper are identified by two capital letters. The first indicates treatment of the boundary condition (grounded area and climate forcing) and the second indicates the choices of uncertain parameters such as the enhancement factor and the geothermal heat flux. Two types of treatment of climate forcing are performed in this study: five steady-state experiments (identified by P, W, A, F and R) and one transient experiment (identified by V). For the standard cases, an enhancement factor of 1.3 and geothermal heat flux of 54.6 mW m−2 were adopted, which is identified by the letter C. The letters are summarized in Tables 1 and 2.
Summary of experiment configuration: first variable of experiment identification (grounded areas are shown in Figure 1)
Summary of parameter choices: second variable of experiment identification
The steady-state simulations are performed using a prescribed grounded area. Figure 1 shows the configuration of grounded areas used in these experiments. Control experiment PC is performed with the present-day grounded area (region 0 in Fig. 1) and present-day climate, and is conducted in two steps. First, an experiment with present-day fixed ice surface elevation coupled with flow and temperature is carried out under prescribed parameters and boundary conditions without basal sliding for 200 ka. Next, a free ice-surface experiment is conducted under the same conditions, but with basal sliding for about 100 ka to obtain a steady state.
The area of the grounded ice sheet used as initial conditions in the sensitivity experiments for the grounding line: (1) Amery, (2) Filchner–Ronne, (3) Ross and (4) small shelves. The grey area (0) was always grounded.

The ‘glacial maximum’ experiment WC is performed for all the hatched areas in Figure 1. This grounded area is determined from various reconstructions of the LGM extents of the Antarctic ice sheet. Reference Bentley and AndersonBentley and Anderson (1998) and Reference BentleyBentley (1999) presented a reconstruction of the Weddell Sea embayment during the LGM. Their relatively confident reconstructed grounding line reached the area where bedrock elevation is lower than –500 m. The reconstruction of the Ross Sea embayment by Reference McKay, Dunbar, Naish, Barrett, Carter and HarperMcKay and others (2008) shows that the grounding line during the LGM is also in the area where the bedrock elevation is –500 m or lower. Moreover, the horizontal gradient of bedrock topography is relatively gentle between –500 and –1000 m and becomes steep below –1000 m in most continental shelf areas (Reference BentleyBentley, 1999; Reference Lythe and VaughanLythe and others, 2000).
In order to cover the whole continental shelf area, the position of the grounding line is determined by the assumption that the grounded area expands to the region of –1000 m bedrock elevation in the present study. Using this threshold value, the grounded area is wider than that used by Reference BentleyBentley (1999) or Reference Conway, Hall, Denton, Gades and WaddingtonConway and others (1999) in some regions at the LGM.
The extent of experiment WC is assumed to correspond to the maximum extent of the Antarctic ice sheet, and is useful for sensitivity studies. The other three experiments (RC, FC and AC) are performed for the grounded area extending only over the Ross (region 0 and 3), the Filchner–Ronne (0 and 2) and the Amery (0 and 1), respectively, in order to identify the contribution from each area. In the five steady-state experiments, accumulation and sea level are set to the present conditions to isolate the effect of the grounded area.
The transient experiment VC is the same experiment as C presented in Reference Saito and Abe-OuchiSaito and Abe-Ouchi (2004). The model is forced by glacial/interglacial changes in the background temperature and sea level through 220 ka, while the positions of the grounding lines are prescribed and fixed as in experiment PC. The background temperature and the sea-level forcings follow the configuration of Reference HuybrechtsHuybrechts (1997, Reference Huybrechts2002). The temperature forcing is based on Vostok surface temperature change (Reference PetitPetit and others, 1999), and sea-level forcing is based on SPECMAP stack (Reference Imbrie, Berger, Imbrie, Hays, Kukla and SaltzmanImbrie and others, 1984). The initial condition is the final state of the transient experiment beginning from experiment PC as in Reference Ritz, Rommelaere and DumasRitz and others (2001). This transient experiment forced by glacial/interglacial climate change is performed to separate the influence on the ice-sheet volume from changes in the climate and from changes in the grounded area during the LGM.
Results and Discussion
The simulated surface topography for the present obtained by the transient experiment VC is depicted in Figure 2. In some areas of East Antarctica, the surface elevation is overestimated (especially near the major ice shelves). This is also true over the whole of West Antarctica. The simulated total ice volume over the grounded region at present (the end of the simulation) is 31.8×10⁶ km3, which is 24% larger than the present measured value of 25.7 × 10⁶ km3 (Reference Huybrechts, Steinhage, Wilhelms and BamberHuybrechts and others, 2000). Reference Philippon, Ramstein, Charbit, Kageyama, Ritz and DumasPhilippon and others (2006) found 30.6× 10⁶ km3 at the end of their deglaciation experiment. This difference reflects the choice of uncertain parameters such as the enhancement factor or the geothermal heat flux, as well as the treatment of climate forcing.
Simulated present surface topography obtained by the transient experiment VC. Contour intervals are 200 m (thin line) and 1000 m (thick line). The letters f, a, v and c denote the positions of Dome Fuji, Dome Argus, Vostok and Dome Concordia, respectively.

As briefly summarized in Reference Saito and Abe-OuchiSaito and Abe-Ouchi (2004), the enhancement factor m = 1.3 adopted in the present paper is relatively small compared to other modelling studies (e.g. Reference Ritz, Rommelaere and DumasRitz and others, 2001; Reference HuybrechtsHuybrechts, 2002), which may result in a larger total volume than other studies.
The time series of the total ice-sheet volume obtained by experiment VC is depicted in Figure 3. Since the experiment neglects changes in the grounded area of the ice sheet, changes in the ice volume follow the external temperature forcing. Due to the lower accumulation at lower surface temperatures, the volume in glacial periods is lower than in interglacial periods. If only changes in the external climate are taken into account, the ratio of the ice-sheet volume of the LGM to that of the present is about 0.97.
Time series of the simulated total ice volume obtained by the transient experiments VC. Changes in terms of sea-level equivalent are shown on the right axis, derived from the volume change divided by 4 × 10⁸ km2 (Reference Allison, Barry and GoodisonAllison and others, 2001).

In order to investigate the sensitivity of the ice-sheet volume and its response in a changing climate to the choice of uncertain parameters, two experiments are performed with the same climate forcing but different configurations. Experiment VE applies a different enhancement factor (m=3) and the same geothermal heat flux, close to the choice of other modelling studies such as Reference Ritz, Rommelaere and DumasRitz and others (2001). Experiment VG applies an enhancement factor of m=3 and a geothermal heat flux of 46 mW m−2.
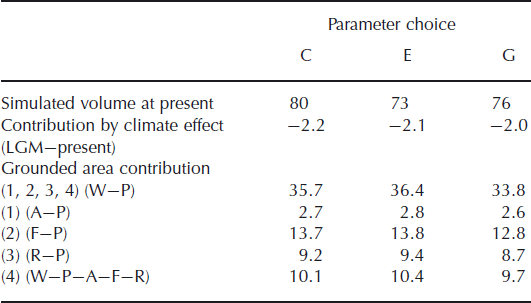
Table 3 summarizes the results obtained by these three transient experiments. The ice volume at the end of each experiment, as well as the difference in the ice volume between the LGM and the present, are shown in terms of equivalent global sea-level change. The results show that the amplitude of changes in ice-sheet volume from the LGM to the present is not greatly affected by the choice of uncertain parameters.
Summary of simulated ice-sheet volume and its difference obtained from all experiments. Each column corresponds to three choices of the uncertain parameters. Volume and volume changes are in terms of metres sea-level equivalent volume divided by 4 × 10⁸ km2 (Reference Allison, Barry and GoodisonAllison and others, 2001). The contribution by grounded area (4) is determined from the results of the other four experiments (see the text).
To investigate the effect of changes in the ice-covered area during glacial/interglacial cycles, the results of the steady-state grounded-area experiments with four different prescribed grounding line positions are compared. Figure 4 shows surface elevations obtained by these grounded-area experiments, which use the same choice of parameters as in the transient experiment VC. Figure 5 shows the differences between the ice thicknesses of each experiment and the steady-state control experiment PC. The results show that the most sensitive regions are concentrated in the vicinity of the ice shelves, whereas regions in the interior of the ice sheet are less affected. In some areas the change in ice thickness exceeds 1500 m due to changes in the grounded area, even over regions grounded at present (the dark-hatched area inside the thick lines in the figure). The effect of the Filchner–Ronne Ice Shelf grounding area appears to reach further inland than that of the Ross Ice Shelf.
Simulated surface topography obtained from grounded-area experiments: (a) WC, (b) AC, (c) FC and (d) RC. Contour intervals as for Figure 2.

Differences in simulated thickness (m) obtained by grounded-area experiments (a) WC, (b) AC, (c) FC and (d) RC relative to experiment PC. Contour interval is 250 m. The thick green line indicates the grounded area used by experiment PC.

Observational evidence for surface elevation or thickness at the LGM is uncertain and limited (Reference AckertAckert and others, 1999; Reference Huybrechts, Janssens, Poncin and FichefetHuybrechts and others, 2002). Reference Grootes and StuiverGrootes and Stuiver (1986) showed that the surface elevations were 500–600 m higher during the LGM using the Byrd core data, corresponding to the results obtained by experiment WC which are higher by 600 m compared to experiment PC. Since smaller accumulation due to lower temperature at the LGM leads to lower elevations than at present, the advance of the grounding line position is the crucial factor in explaining the difference in the elevation at Byrd.
The surface elevation near the ice divide is not significantly affected by the advance in the grounding line position. Figure 6 shows the difference in surface elevation from the steady-state control experiment at four sites in East Antarctica: Dome Fuji, Dome Argus, Vostok and Dome Concordia. The amplitude of the transient experiment between the LGM and the present is also shown. In these experiments, the position of Dome Concordia never becomes a dome in the model results.
Difference in simulated surface elevation at several sites for experiments WC, AC, FC and RC relative to experiment PC. The amplitude simulated during glacial cycles is shown for experiment VC.
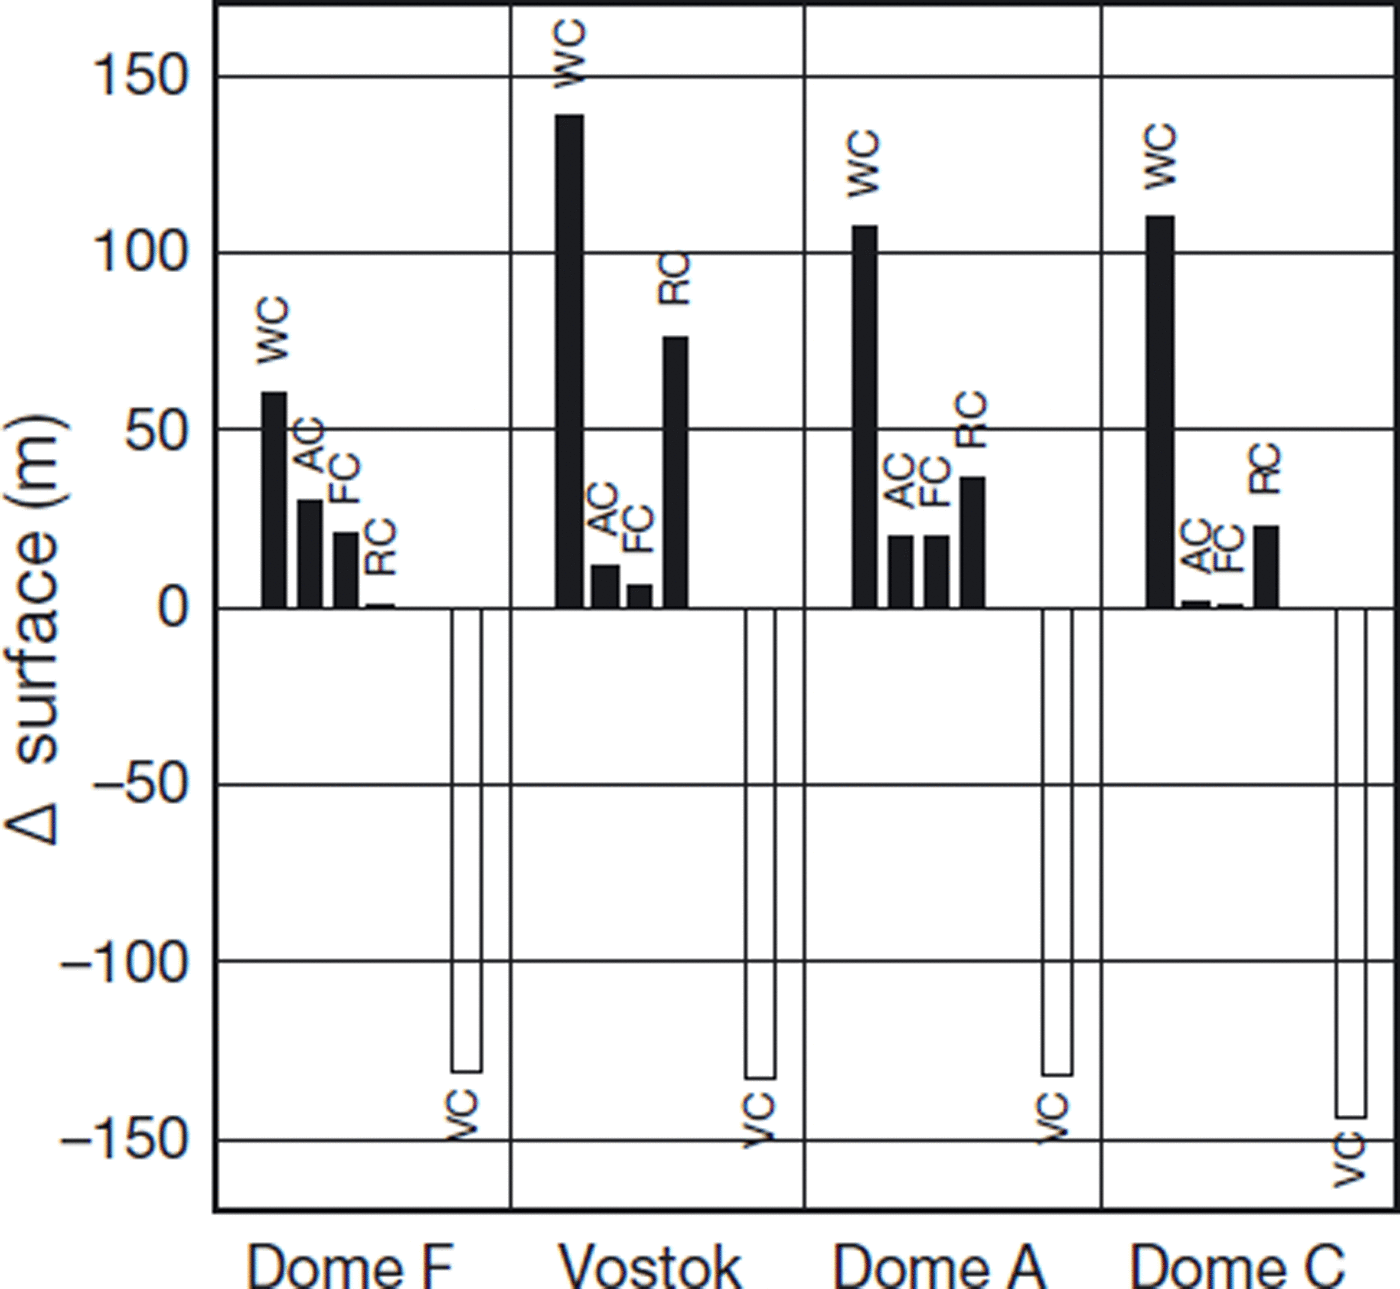
The result shows that the response of surface elevation to climate change is similar among the four sites. The changes in the grounded areas have clear regionality due to the location and distance to the major ice shelves. The elevation of Dome Fuji is less sensitive to the grounding condition compared to the other sites, and is at most 50 m. The effect from the Amery side is largest, while that on the Ross side is negligible since there are flowlines from Dome Fuji to both the Amery and Weddell regions but not to the Ross region. On the other hand, Vostok has a high sensitivity (about 130 m); the effect from the Ross side is largest while that from both the Amery and Weddell regions is negligible.
Table 3 summarizes the results obtained from the grounded-area experiments. The contribution of grounded area (4) in Figure 1 is determined from the other four results, and is assumed to be the difference between the contribution of the grounded area (1,2,3,4) and the sum of those of (1), (2) and (3) separately. The advance of the grounding line over the whole periphery contributes more than 35 m in terms of sea-level change equivalent. The Filchner–Ronne Ice Shelf grounding area affects ice volume change the most, contributing to around one-third of the total change. The combined effects of the other two ice shelves contribute to another third of the total change. The remaining proportion of the change is due to the advance of the grounding line over the other regions not connected to the three major ice shelves (region 4 in Fig. 1).
The steady-state and transient experiments were carried out with different choices of uncertain parameters. The choices are summarized in Table 3 and are identified by E and G, which are the same configuration as in the experiments presented and discussed in Reference Saito and Abe-OuchiSaito and Abe-Ouchi (2004). The differences between the simulated steady-state ice volumes and the corresponding present-day steady-state experiments (PC, PE or PG) are shown in terms of equivalent global sea-level change. The result shows that the amplitude of changes in ice-sheet volume due to changes in grounded area is far greater than the effect of parameter uncertainty. The range of the simulated differences in ice volumes is within 1 m (except for the full glacial maximum cases in experiment WC).
Reference Philippon, Ramstein, Charbit, Kageyama, Ritz and DumasPhilippon and others (2006) present a sensitivity experiment (RONNY), from which the effect of grounding line retreat over the Filchner–Ronne region on changes in the ice volume from the LGM to the present can be deduced. This experiment corresponds more or less to experiment FC in the present paper. Using the same conversion from ice-sheet volume to equivalent global sea-level rise, the effect of grounding line retreat was 7.5 m in their study ( 60% of the result found in the present study). The model used in Reference Philippon, Ramstein, Charbit, Kageyama, Ritz and DumasPhilippon and others (2006) includes ice-shelf dynamics, and the experiment is regarded as a full transient run, including transient change of grounded area during glacial/interglacial cycles. However, the Filchner–Ronne Ice Shelf was not completely deglaciated at the end of their simulation. If sufficient deglaciation on the Weddell Sea embayment is simulated in their study, the contribution of the retreat over the Filchner–Ronne area will therefore be closer to the result of the present study.
Reference HuybrechtsHuybrechts (2002) presented a reconstruction of the Antarctic ice sheet at the LGM using an ice-sheet model including the effect of changes in grounding line position. He concluded that the Antarctic ice sheet contributed 14–18 m to the sea-level lowering, which is around 50% of the result in the present paper. This difference is mainly due to the difference in the grounding line position on the Ross Sea embayment as well as the other marginal areas not connected to the major ice shelves, which have little or no advance of grounding lines. On the other hand, the simulated grounding line position of the Weddell Sea embayment at the LGM of Reference HuybrechtsHuybrechts (2002) is similar to the position in the present study.
This difference may be due to the difference in the bedrock topography of the continental shelves. In the Weddell Sea embayment, the horizontal gradient of bedrock topography is very steep at the continental shelf break, such that the –500 and –1000 m contours are very close. It is relatively gentle in the Ross Sea embayment, with more distant contours (Reference BentleyBentley, 1999; Reference Lythe and VaughanLythe and others, 2000). The assumed maximum grounded area in the present study is therefore wider than that shown in Reference HuybrechtsHuybrechts (2002) on the Ross Sea embayment.
It is concluded that the influence of climate change on the changes in the ice volume during glacial/interglacial cycles has a minor effect compared to that of the change in the grounded area. The ratio of LGM to present volume of 0.97, obtained by the transient experiment, indicates that the maximum contribution of the Antarctic ice sheet to global sea-level rise from the LGM to the present is around 36 m.
Since the geometry in the full grounded-area experiments may be regarded as an overestimation of the extent of the grounded ice sheet in the glacial period, the possible volume change may actually be smaller. Moreover, as there would be a delay in achieving the steady state in the response of ice thickness to the position of the ice-sheet margin (which is also transient), the ice-volume change may be even smaller.
The results of the above experiments may be affected by uncertainties in the basal sliding parameterization. Reference PaynePayne (1999) presented a simulation of the West Antarctic ice sheet under the steady present-day climate forcing, with fixed grounding line at the present-day position, using a linear basal sliding parameterization. An increase in the sliding coefficient by a factor of 5 resulted in a 5% decrease in the simulated ice-sheet volume at the final state (100 ka).
Reference SaitoSaito (2002) presented steady-state experiments of the Antarctic ice sheet by fixing the grounding line at the present-day position, with the sliding coefficient multiplied by 0 and 16, respectively, using the same basal-sliding parameterization as in the present paper.
It is found that even if the coefficient is multiplied by a factor of 16, the change in steady-state ice volume is only 6%, which is comparable to the influence of the enhancement factor differing by a factor of 2 or less. If the uncertainties in the sliding coefficient are smaller by a factor of 10 or less, the sensitivity of the steady-state ice-sheet volume to uncertainties in the basal sliding parameterization is expected to be within the range of results in the present paper using different parameter choices. We conclude that, in the evolution of the Antarctic ice sheet, changes in the grounded area are dominant while those in the climate are minor, as is also stated by Reference Ritz, Rommelaere and DumasRitz and others (2001) and Reference Huybrechts, Janssens, Poncin and FichefetHuybrechts and others (2002).
The results may also be affected by the uncertainties in the basal sliding if the grounding line position is allowed to advance or retreat under a transient glacial/interglacial forcing. Reference Ritz, Rommelaere and DumasRitz and others (2001) presented sensitivity experiments designed to investigate the effects of the sliding law on the results of their transient 423 ka simulation of the Antarctic ice sheet. The glacial/interglacial difference in the simulated ice-sheet volume varies by a factor of 1.7 in their results, accompanied by an insufficient retreat of the grounding line to its present-day position in one of their experiments. It will therefore be necessary to investigate the sensitivity of changes in the simulated ice-sheet volume to the uncertainties in the basal sliding parameterization when the grounded area varies under transient climate. This is, however, beyond the scope of the present paper.
A comparison of the contribution of the Antarctic ice sheet to sea-level rise between the (perhaps overestimated) maximum value in the present paper and values found in the literature, summarized in Reference Philippon, Ramstein, Charbit, Kageyama, Ritz and DumasPhilippon and others (2006), shows that almost all the results of previous studies are within the range of our values with the exception of two studies. Reference Nakada and LambeckNakada and Lambeck (1988) and Reference Budd and SmithBudd and Smith (1982) found 37 and 38 m, respectively, for the contribution of the Antarctic ice sheet to sea-level change. These values are close to the upper limit found in the present study and would only be possible under the most extreme conditions.
Since the grounded area is a dominant factor for the reconstruction of the ice-sheet topography at the LGM, the position of the chosen grounding line is crucial for model reconstructions. Reference BentleyBentley (1999) presented a grounding line position (interpolated and not well constrained) over the Weddell Sea embayment, which is shifted inland by around 200 km compared to the assumption of the present paper. Using such a configuration on the Weddell Sea embayment, the possible contribution of the Filchner–Ronne Ice Shelf grounding is much reduced. The reconstructed grounded area over the western side of the Antarctic Peninsula (Reference BentleyBentley, 1999) is also smaller than the assumed present configuration in this paper. The effect of the advance in the margin over the regions not connected to the major ice shelves is therefore also reduced under such a configuration.
Similar experiments with intermediate configurations between the extreme LGM case of the present paper and the present-day ice sheet are required. Better constraints on the LGM ice-sheet margin positions (e.g. from geological data) will help to obtain more accurate estimations of the contribution of the major ice shelves and other parts of the ice sheet to the postglacial sea-level change. Moreover, if better information on changes in the surface elevation at several sites based on ice cores can be obtained, the changes in the grounded areas of the major ice shelves and the other parts of the ice sheet may be constrained more reliably. For example, the effect of the Ross region has a dominant effect on the elevation at Vostok, while it is negligibly small on the elevation of Dome Concordia and Dome Fuji. Advances in other ice-shelf margins have a dominant effect on the elevation at Dome Concordia.
There is a debate over whether the source of MWP1a is the Antarctic or the Northern Hemisphere ice sheets. If the global sea-level rise by 20 m at MWP1a is only due to the Antarctic ice sheet, the present paper shows that the grounding area of a single ice shelf cannot explain the total amount. The grounded-area experiments of the present paper suggest that, for example, about half of the 20 m could be explained by a single ice shelf and that the other parts of the periphery of Antarctica could add almost enough. It is therefore important to investigate the changes of all grounded areas around the entire Antarctic ice sheet.
Conclusions
In the present study, a 3-D thermodynamic ice-sheet model in the shallow-ice approximation is applied to discuss the sensitivity of changes in the ice-sheet volume to glacial/interglacial changes. Steady-state experiments on the area of grounded ice (position of the ice-sheet margin) as well as a transient experiment forced by glacial/interglacial climate changes are performed and discussed.
The maximum possible contribution of the Antarctic ice sheet to sea-level change during the last deglaciation estimated in the present study covers most of the values estimated in previous studies using various methods, with a couple of exceptions. The maximum possible contribution of the Antarctic ice sheet to global sea-level rise, from the LGM to the present, estimated in this study is about 36 m.
The effect of the grounded area on ice volume is shown to dominate the contribution of the transient changes. The effects of grounding of major ice shelves are also separated, and the Filchner–Ronne region is found to have the most significant influence on the change in the ice volume. The maximum possible contribution of the Filchner–Ronne Ice Shelf grounding is around 13 m, one-third of the total change. The sum of contributions from the Ross and Amery regions is also around one-third of the total change. The remaining third is contributed by the advance in the ice-sheet margin over the other regions around Antarctica.
All of the results obtained by the grounded-area experiment in the present paper were obtained using a steady-state experiment. If the timescale of the response of the interior regions to changes in the margin positions is taken into account, the effects of the grounding area decrease.
Acknowledgements
We greatly appreciate the valuable suggestions of two anonymous referees and the scientific editor E. Bueler, which helped to improve the manuscript substantially. We also thank H. Blatter for providing valuable comments on the manuscript. This work was supported by KAKENHI 21740349.


