

High salt intake is considered an important contributor to the burden of CVD worldwide( Reference Beaglehole, Bonita and Horton 1 ). A high salt intake is associated with hypertension, which in turn can increase the risk of CVD( Reference He and MacGregor 2 , Reference Strazzullo, D'Elia and Kandala 3 ). Furthermore, a low K intake and especially a high Na:K have also been associated with higher blood pressure levels and increased incidence of CVD( Reference Cook, Obarzanek and Cutler 4 ).
Many countries have initiated salt-reduction strategies in order to reduce the population's salt intake( Reference Webster, Dunford and Hawkes 5 ). In 2006 the Health Council of the Netherlands published Dutch guidelines for a healthy diet, advising a reduction in salt consumption to less than 6 g/d( 6 ). At that time little was known about Dutch salt intake, apart from a 24 h Na excretion study among 190 Dutch participants of the European Prospective Investigation into Cancer and Nutrition calibration study. That study, conducted between 1995 and 1997, observed a salt intake of 9·8 g/d( Reference Ocke and Hulshof 7 ). The Health Council of the Netherlands concluded that a reduction of salt intake towards the realisable target of 6 g/d could only be achieved if Na levels in commercially prepared foods would be reduced. As a response, the Federation of the Dutch Food and Grocery Industry initiated a Taskforce Salt to reduce the level of Na in processed foods. Their target in 2006 was to reduce Na concentrations in certain categories of processed foods by 12 % by 2010.
An insufficient iodine intake may result in hypothyroidism( Reference Zimmermann, Jooste and Pandav 8 ). The estimated average requirement for adults is 95 μg/d( 9 ). Iodine levels naturally present in the Dutch diet are not adequate( 10 ). Since 1999, iodised salt has been permitted in a restricted number of processed foods (bread and bread substitutes (70–85 mg iodine/kg salt), processed meat (20–30 mg iodine/kg salt) and table salt (30–40 mg iodine/kg salt)) to prevent iodine-deficiency disorders. In 2008, the iodine intake of the Dutch population was considered adequate( 10 ). The Dutch iodine policy was evaluated in anticipation of changes in European food legislation. Simulations showed that the upper level of iodine intake could be exceeded if the number of food groups to which iodised salt was added was extended, using similar maximum levels of iodine fortification as in bread or bread substitutes, processed meat or table salt( Reference Kruizinga, Doest and Brants 11 ). In these simulations it was assumed that 50 % of the processed foods would contain iodised salt. Additional analyses showed that the iodine content of iodised salt in bread and bread substitutes of maximal 65 mg iodine/kg salt, as well as maximal 25 mg iodine/kg salt in other processed foods, would be most optimal and the iodine fortification policy was changed accordingly( 12 ). Reduction of (iodised) salt in processed foods may also affect iodine intake. Subsequent monitoring of iodine intake is thus important in view of identifying potential iodine deficiencies( Reference Verkaik-Kloosterman, van ‘t Veer and Ocke 13 ).
Salt and iodine intakes cannot be precisely quantified using food consumption survey data, as the amount of (iodised) discretionary salt is difficult to quantify. Moreover, limited information is available on the presence of iodised salt in Dutch processed foods. The preferred method to estimate salt and iodine intakes is by 24 h urine collections( Reference Brown, Tzoulaki and Candeias 14 ).
The aim of the present study was to evaluate the effectiveness of salt-reduction efforts and changes in iodine policy in a Dutch population between 2006 and 2010 by monitoring salt and iodine intakes using 24 h urinary excretions of Na and iodine.
Methods
Design and participants
In 2006 and 2010, monitoring surveys were carried out among adults aged 19–70 years in Doetinchem, a town in the eastern part of the Netherlands. In both surveys half of the study population was recruited from individuals (aged 35–70 years) participating in an ongoing long-term monitoring study on chronic disease risk factors (the Doetinchem Cohort Study (DCS)) and half of the participants were randomly drawn from the municipal register of Doetinchem (General Doetinchem Population Sample (GDPS); aged 19–45 years). As the DCS has aged, most participants were over 35 years at the time of sampling for the present surveys. In order to cover the whole age range of interest (19–70 years), younger participants (19–45 years) were recruited from a random sample of the general population (GDPS). Those participating in 2006 were not invited to take part in the 2010 survey in order to obtain independent samples. Pregnant women and people suffering from renal diseases were excluded from participation.
In 2006, a total number of 840 individuals were invited to participate (400 from DCS and 440 from GDPS). Positive response rate was 68 % among DCS participants and 19 % among individuals from the GDPS. In total, 333 individuals completed the study in 2006 (251 (63 %) from DCS and eighty-two (19 %) from GDPS). In 2010, 1686 individuals were invited (334 from DCS and 1352 from GDPS, with positive response rates of 69 % (n 229) and 15 % (n 208) respectively). Sixty-one per cent (n 205) of DCS members and 11 % (n 152) of individuals from GDPS completed the study in 2010 (in total, 357 individuals).
The study was conducted according to the guidelines laid down in the Declaration of Helsinki and all procedures involving participants were approved by the Medical Ethics Committee of the University Medical Centre Utrecht. Written informed consent was obtained from all participants.
24 h Urine collections
Single 24 h urine collection took place in November 2006 and 2010 using identical protocols and procedures. Samples were collected on specified days (weekdays and weekends). Detailed written and oral instructions were given on how to collect the 24 h urine sample. Participants were asked to discard their first morning urine void and then to collect, in the jars provided, all urine voided over the following 24 h up to and including the first morning urine void the next day. Participants recorded the time of start and finish of urine collection, as well as the completeness of the collection in a diary. Specimens were stored in a cool place (e.g. refrigerator or cellar) until delivery to the Municipal Health Service the following day, where specimens were processed and stored in 15 ml aliquots at −80°C. Upon collection of the jars research assistants verified the collection procedure and measured the volume of the 24 h urine sample.
Questionnaires
A short self-reported, semi-structured questionnaire was administered to collect data on smoking status, educational level (in the 2010 survey only), use of medications and food supplements. Upon collection of the jars, research assistants verified any uncertainty or inconsistency of reported answers with participants. The use of discretionary salt (yes or no) in the week before collection was assessed, as well as whether or not this salt was iodised. Recorded dietary supplements were checked for iodine and Na content in the Dutch Supplement Database( Reference Buurma-Rethans, Fransen and Ghameshlou 15 ). Participants were classified as having diabetes, suffering from thyroid disorders or taking diuretics, based on their medication use.
Laboratory analyses
In 2006 and 2010, urinary Na and K concentrations (mmol/l) were determined in each specimen by indirect potentiometry using the Synchron LX system (mean inter-assay CV of 1·1 % for Na and 1·8 % for K (2006) and 1·3 % for K and 0·9 % for Na (2010))( 16 ). In 2006, urinary iodine concentration (nmol/l) was determined in a microtitre plate format using ammonium persulfate digestion( Reference Pino, Fang and Braverman 17 ) based on the Sandell–Kolthoff reaction (mean inter-assay CV of 6 %)( Reference Sandell and Kolthoff 18 ). In 2010, urinary iodine concentration (nmol/l) was determined by ammonium persulfate digestion in a PCR system followed by the Sandell–Kolthoff reaction in a microtitre plate format (mean total assay CV of 16 %). In 2010, the lowest validated level was 45 μg/l, so samples with an iodine value below 45 μg/l (n 62) were set to 45 μg/l. In order to exclude extreme incomplete 24 h urine samples, creatinine concentration (mmol/l) was measured by the Jaffé method using the Synchron LX system (mean inter-assay CV of 2·9 % in 2006 and 1·8 % in 2010)( 19 ).
Estimation of 24 h urinary excretion and intake
Multiplying the Na, K and creatinine concentration levels (mmol/l) by the total volume of urine (in litres) resulted in the Na, K and creatinine excretions in mmol/d. Excretion in g/d was calculated by multiplying the molar mass (Na = 23 g/mol; K = 39 g/mol; creatinine = 113 g/mol) with the excretion in mmol/d divided by 1000. Na:K molar ratio was expressed by dividing the Na concentration (mmol/l) by the K concentration (mmol/l). Iodine excretion over a 24 h period (μg/d) was determined by multiplying the iodine concentration in nmol/l with the molar mass of iodine (126 g/mol) times 1000 and the total volume of the urine specimen (in litres).
Intake of Na, iodine and K was calculated by multiplying the excretion with the factor 100/95, 100/92 and 100/90, respectively, reflecting the estimated proportions of intake that are excreted via urine( Reference Gibson 20 ). Na intake was converted to salt intake by multiplication with a factor of 2·54.
Statistical analyses
Participants were excluded from statistical analyses for the following reasons: unknown urine volume (n 2 in 2006 and n 1 in 2010); extreme incomplete urine collection (based on creatinine excretion ≤5·0 mmol/d, or ≤6·0 mmol/d together with a urine volume of <1 litre( Reference Reinivuo, Valsta and Laatikainen 21 ); n 10 in 2006 and n 0 in 2010); and missing or over-collection of more than one urine void (n 4 in 2006 and n 14 in 2010). The final study population included 317 participants in 2006 and 342 participants in 2010.
The normality of the data was verified with the Kolmogorov–Smirnov test. The distributions of continuous variables were characterised by means and standard deviations for normally distributed data and by medians (50th percentile, P50) and interquartile ranges (IQR; 25th–75th percentile, P25–P75) for non-normally distributed data. Differences in salt and iodine intakes between 2006 and 2010 were assessed by the Mann–Whitney test, with significance set at P < 0·05 (two-sided). Pearson correlation coefficients were calculated to examine the associations between salt intake and iodine or K intake, and adjusted for 24 h urine creatinine excretion and sex. All analyses were performed using the statistical software package SAS version 9·2.
Results
General characteristics
The participants in 2010 were slightly younger (46·2 (sd 14·5) years) than those in 2006 (48·9 (sd 14·0) years; P = 0·02). The proportions of men, smokers, users of dietary supplements and participants taking medication were similar in both surveys (Table 1). In 2006, the proportion of participants who reported discretionary salt use was statistically significantly higher than in 2010 (88 % v. 81 % respectively, P = 0·009; Table 1).
General characteristics of the study population from Doetinchem, the Netherlands, in 2006 and 2010
Data for age presented as mean and standard deviation; data for all other variables presented as number and percentage.
*P value for the comparison with the corresponding group in 2006.
†Educational level was defined as low (primary school, lower vocational, low or intermediate general education), middle (intermediate vocational education and higher general education), high (higher vocational education and university) and other (not defined).
Mean urinary volume collected over 24 h was 2292 ml in 2006 and 1977 ml in 2010. Mean 24 h urinary creatinine excretion was lower in 2006 compared with 2010 (10·3 mmol/d v. 12·0 mmol/d, P < 0·0001).
Na excretion and estimated Na and salt intakes
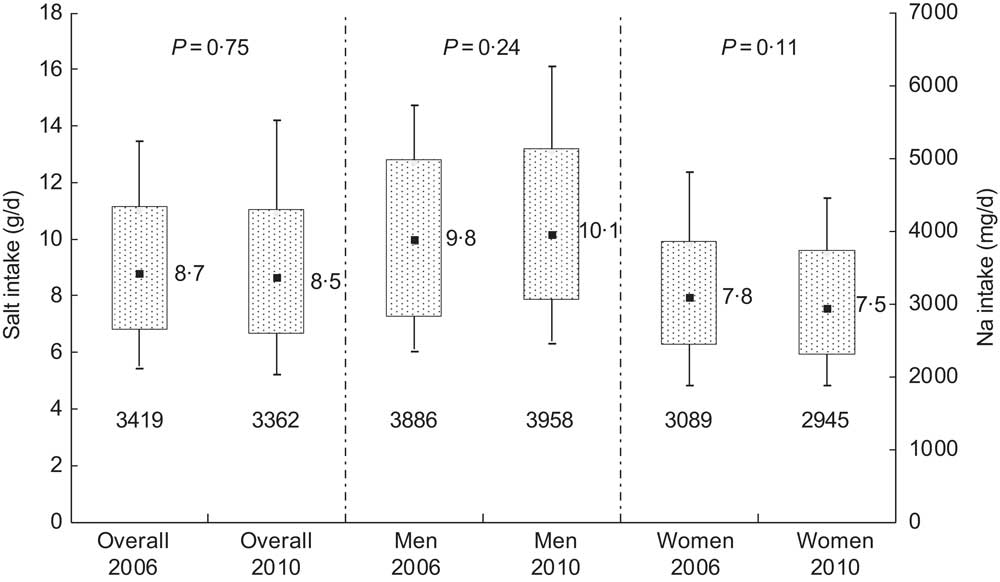
In 2006, median 24 h urinary Na excretion was almost similar to that in 2010: 141 (IQR 109–179) mmol/d and 139 (IQR 107–178) mmol/d, respectively (P = 0·75; Table 2). Median salt intake was estimated to be 8·7 (IQR 6·7–11·0) g/d in 2006 and 8·5 (IQR 6·6–10·9) g/d in 2010 (Fig. 1).
Sodium and salt intake distributions in 2006 and 2010 as estimated from 24 h urinary sodium excretions in Doetinchem, the Netherlands; overall and according to sex. Box-and-whisker plots in which the bottom and top whiskers represent the 10th and 90th percentile (P10 and P90), respectively; the bottom and top of the box represent the 25th and 75th percentile (P25 and P75; interquartile range), respectively; and ▪ represents the 50th percentile (P50; median). Numbers beneath each box are the median sodium intake
Sodium, potassium and iodine excretions based on 24 h urine collections in Doetinchem, the Netherlands, in 2006 and 2010
P50, 50th percentile (median); P25–P75, 25th–75th percentile (interquartile range, IQR).
*P value for the comparison with the corresponding group in 2006.
In 2006 and 2010, the median Na excretion from participants who reported using discretionary salt in the week before urine collection was almost similar to that of participants who did not use discretionary salt (141 mmol/d v. 148 mmol/d in 2006 (P = 0·79) and 139 mmol/d v. 137 mmol/d in 2010 (P = 0·88)). Exclusion of participants taking diabetes medication (n 6 in 2006 and n 8 in 2010) or diuretics (n 20 in 2006 and n 24 in 2010) did not affect median Na excretions (data not shown).
Median K intake increased from 2·6 (IQR 2·0–3·2) g/d in 2006 to 2·8 (IQR 2·3–3·4) g/d in 2010 (P = 0·0005). Na:K improved over this period (2·4 v. 2·2, Table 2; P = 0·0001). K intake was weakly correlated with Na intake (r = 0·19 in 2006 and r = 0·21 in 2010).
Iodine excretion and estimated iodine intake
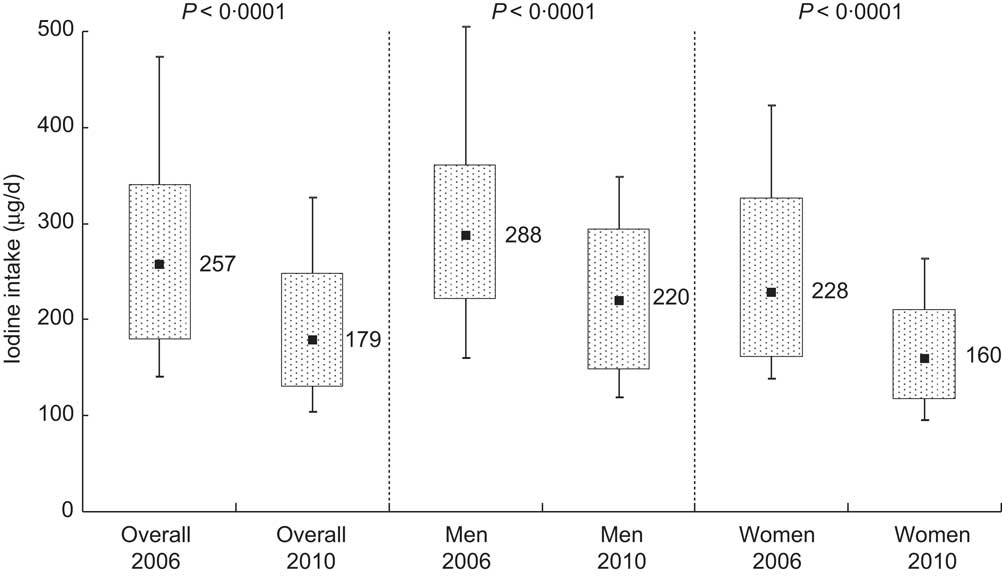
Median iodine excretion declined significantly from 2006 to 2010 (236 (IQR 165–313) μg/d in 2006 and 165 (IQR 119–227) μg/d) in 2010, P < 0·0001; Table 2). These excretion levels correspond to estimated iodine intakes of 257 μg/d and 179 μg/d, respectively (Fig. 2). Iodine intake was weakly correlated with salt intake (r = 0·36 in 2006 and r = 0·30 in 2010).
Iodine intake distribution in 2006 and 2010 as estimated from 24 h urinary iodine excretion in Doetinchem, the Netherlands; overall and according to sex. Box-and-whisker plots in which the bottom and top whiskers represent the 10th and 90th percentile (P10 and P90), respectively; the bottom and top of the box represent the 25th and 75th percentile (P25 and P75; interquartile range), respectively; and ▪ represents the 50th percentile (P50; median)
In 2006, participants who reported using iodised discretionary salt showed a higher iodine excretion (median 248 μg/d) than those who did not (median 220 μg/d; P = 0·01). In 2010, iodine excretion was not statistically different between users (median 172 μg/d) and non-users of iodised discretionary salt (median 163 μg/d; P = 0·45). Exclusion of participants taking thyroid medication (n 7 in 2006 and n 9 in 2010) did not affect median iodine excretions.
Discussion
The current monitoring study conducted in 2006 and 2010 among two independent samples of adults living in Doetinchem, the Netherlands, showed that salt intake has not changed over this 4-year period (8·7 v. 8·5 g/d) and still exceeds the recommended maximum intake of 6 g/d. Na:K improved over this period due to a higher K intake in 2010 compared with 2006. Iodine intake was significantly lower in 2010 compared with 2006, but may still be considered adequate as compared to the estimated average requirement of 95 μg/d( 9 ).
In 2006, the Dutch food industry initiated Na reduction in foods on a voluntary basis. After 4 years, they reported a 10 % Na reduction in processed foods compared with 2006( 22 ). We did not observe a decline in salt intake over this period in our monitoring survey, suggesting that the actions of the Dutch food industry did not result in a significant reduction in salt intake at the population level. Power calculations showed that we had sufficient power to detect a difference of at least 8 % in daily salt intake in the total population between 2006 and 2010. However, we observed a non-significant difference of only 2 % in total salt intake. This is in line with recent data from the Dutch Food Safety Authority. They monitored the Na levels in certain categories of processed foods in 2009, 2010 and 2011 and did not observe a reduction in Na levels( 23 ). We were unable to detect any change in salt intake over this period. This may be explained by the fact that not all food producers have yet reduced Na levels in their processed foods, or not all industry associations have committed themselves to Na reduction. Na reduction may also be achieved by substituting NaCl by KCl. Although we observed an increase in K intake we did not see a simultaneous decrease in Na intake, suggesting that higher intakes of K in 2010 are likely to be explained by other factors, such as an increase in consumption of K-rich foods.
In the UK, reductions in Na levels of up to 70 % in certain processed foods led to a decrease in the average salt intake from 9·5 g/d in 2000–2001 to 8·6 g/d in 2008( Reference Wyness, Butriss and Stanner 24 ) and to 8·1 g/d in 2011( Reference Sadler, Nicholson and Steer 25 ). This shows that substantial Na reduction in processed foods is needed if a relevant salt intake reduction is to be achieved.
The present monitoring study showed a substantial reduction in iodine intake from 2006 (257 μg/d) to 2010 (179 μg/d). This may be because iodised salt was not used in processed foods other than bread. A simulation study estimating the optimal fortification levels assumed that 50 % of processed foods would contain iodised salt. However, an inventory conducted in 2012 showed that very few foods other than bread contained iodised salt( Reference Verkaik-Kloosterman, Buurma-Rethans and Dekkers 26 ). While the maximum fortification level of iodised salt in bread was reduced, the use of iodised salt in processed foods was not extended. These results substantiate our conclusion that reduced iodine intake observed in the present study is likely due to the reduced iodine levels in bread and because of the limited use of iodised salt in processed foods. It could also be that the reported Na reduction in bread has led to lower iodine intake, as bread is an important source of iodine. Therefore, monitoring the use of iodised salt in foods, as well as monitoring iodine intake, is important when evaluating the implementation of new iodine regulations, since further reductions of Na levels in processed foods are foreseen( Reference Verkaik-Kloosterman, Buurma-Rethans and Dekkers 26 ).
Iodine fortification regulations differ across European countries. In the UK for example, iodine intake is ensured through iodine-rich artificial feed for cattle and the subsequent encouragement of milk consumption( Reference Zimmermann 27 ). Iodised salt is rarely available in the UK( Reference Vanderpump, Lazarus and Smyth 28 ). In contrast, Denmark has a mandatory iodine fortification programme of bread, salt and household salt where, after implementation of this programme in 2000, iodine excretion increased substantially from 94 μg/d in 1997–1998 to 145 μg/d in 2004–2005( Reference Rasmussen, Carle and Jorgensen 29 ). Obviously, salt-reduction strategies in different countries will influence iodine intake differently and monitoring of iodine intake should be considered when iodised salt is used in processed foods.
A strength of the present study is that we used the preferred method to estimate the salt and iodine intakes on a population level. The current study design was adequate to examine trends in median salt and iodine intakes, because intakes were assessed in two independent samples from the same source population. General characteristics of the two surveys were highly comparable. Furthermore, power calculations showed that the number of participants in both samples was sufficient to observe a 10 % change in salt intake for men and women separately, and a difference of 8 % for the total population.
A limitation of our study is that we did not have a reliable method to assess the completeness of 24 h urine collections, by using p-aminobenzoic acid tablets( Reference Gibson 20 ). However, a recent study showed that in a population-based monitoring study estimates of K excretion were very similar regardless of whether or not a check using p-aminobenzoic acid was taken into account( Reference Subar, Midthune and Tasevska 30 ). As an alternative strategy to control for incomplete urine collections, we excluded participants with extreme creatinine levels in combination with a low 24 h urine volume for normal-weight adults( Reference Reinivuo, Valsta and Laatikainen 21 ). However, the usefulness of creatinine as a check on the completeness of 24 h urine collections has been widely debated( Reference Bingham, Williams and Cole 31 , Reference De Keyzer, Huybrechts and Dekkers 32 ), particularly without information on body weight as in the present study. In order to identify incomplete 24 h urine collections, particular attention was paid by trained researchers to start and end times of urine collections to identify over- or under-collection.
Other limitations relate to the comparability of our findings to the general Dutch population. Participants were sampled from a single Dutch town and half of the study population was recruited from a large ongoing monitoring study. In addition, the high burden on study volunteers may affect the participation rate( Reference Brown, Tzoulaki and Candeias 14 ). Compared with the general population, participants in the study were more highly educated and were more likely to be non-smokers( Reference Hoeymans, Melse and Schoemaker 33 ). Since these individuals tend to have healthier dietary patterns, the salt and iodine intakes that we report here may be underestimated compared with the general Dutch population.
Salt and iodine intakes vary greatly on a day-to-day basis at the individual level( Reference Dyer, Elliott and Chee 34 ). Therefore, using single 24 h Na and iodine excretion will result in a wider intake distribution compared with the true, usual intake and thus the prevalence of participants with extreme usual intakes will be overestimated based on a single 24 h urine sample. In addition, this will reduce the power to determine a statistically significant difference between the median intakes of both years. With respect to salt intake the prevalence of participants above the recommended maximum intake of 6 g/d will be underestimated. It can be estimated that at least 84 % of the participants in 2006 and at least 82 % in 2010 had an intake above 6 g/d. For iodine, a maximum of 2 % in 2006 and 7 % in 2010 had an intake below the estimated average requirement of 95 μg/d. Iodine deficiency is a particular concern for young children and pregnant women( Reference Zimmermann, Jooste and Pandav 8 ). The estimated average requirement for pregnant women is higher (160 μg/d) compared with the general population. In 2006 a maximum of 20 % of the women of childbearing age (<45 years) had an iodine intake below 160 μg/d, while in 2010 this was a maximum of 50 %. It may be necessary to monitor the iodine intake of pregnant women in the Netherlands.
Conclusion
Total salt intake has not changed over the period 2006 to 2010, whereas iodine intake has decreased significantly based on the present monitoring study conducted in adults aged 19–70 years from a single Dutch town. In that same period the Na:K improved. Monitoring of actual salt and iodine intakes in the population over time is needed to assess the effectiveness of Na reduction initiatives or policy changes related to iodine fortification.
Acknowledgements
Sources of funding: M.A.H.H., J.M.A.v.R., C.W.v.d.H., M.C.O. and D.L.v.d.A. were funded by the Dutch Ministry of Health, Welfare and Sport. J.M.G. was funded by Wageningen University. Conflicts of interest: All authors have no conflicts of interest. Authors’ contributions: M.A.H.H., J.M.A.v.R., C.W.v.d.H., M.C.O. and D.L.v.d.A. were involved in the design of the study. M.A.H.H. analysed the data and wrote the first draft of the manuscript. J.M.A.v.R., M.C.O., D.L.v.d.A. and J.M.G. supervised the work and were involved in data interpretation. All authors contributed to the writing of the manuscript and approved the final version of the manuscript. Acknowledgements: The authors would like to thank all of the volunteers who participated in the study; Heidi Fransen, Mirjam Jager, Maud de Vries and Saartje van der Graaff for their assistance; Susan Picavet, Carolien de Rover and the field workers of the DCS for their collaboration; Eugene Jansen, Carrie Ris, Mariette Ackermans and the laboratory technicians for performing the urine analyses; and the Medical Ethics Committee of the University Medical Centre Utrecht.


