

Approximately two million people in the USA lack basic access to drinking water(Reference Roller, Gasteyer and Nelson1). However, this figure does not capture individuals who have access but do not drink their tap water. Not drinking tap water occurs for many reasons, including aesthetic considerations or distrust due to water quality violations in homes(Reference Hanna-Attisha, LaChance and Sadler2) or schools(Reference Cradock, Poole and Vollmer3). The Flint, Michigan Water Crisis(Reference Pauli4), in which the Flint community was exposed to high concentrations of lead in their water from mid-2014 to 2016 raised national awareness(Reference Jackson5) of tap water safety concerns in US communities(Reference Hanna-Attisha, LaChance and Sadler2,Reference Butler, Scammell and Benson6) . Then, Newark, New Jersey, reported a lead crisis in 2016(Reference Gostin7) further stoking fears. Both Flint and Newark are comprised predominantly of non-White residents.
Other households in the USA lack consistent access to tap water at home because of water shutoffs due to affordability issues(Reference Teodoro and Saywitz8), which disproportionately affect residents in low-income housing, and Black and Hispanic households(Reference Montag9,Reference Swain, McKinney and Susskind10) . The differential treatment of individuals in these categories increases exposure to environmental injustice and racism(Reference Jones11) which may affect both access to and use of tap water. Consequently, these groups are also more likely to drink bottled water(Reference Rosinger and Young12) and sugar-sweetened beverages(Reference Rosinger, Bethancourt and Francis13,Reference Onufrak, Park and Sharkey14) that are more costly(Reference Javidi and Pierce15) and lack the protective benefits of fluoride(Reference Sanders and Slade16) in tap water.
While previous work documented an increase in US children not drinking tap water in 2015–2016(Reference Rosinger and Young12) during the Flint Water Crisis compared to prior years, it is critical to surveil this nutritional behaviour as a way to monitor trust and usage of tap water. Therefore, we examined whether not drinking tap water in the USA continued to increase in 2017–2018 by analysing nationally representative trends among children/adolescents and adults, and whether disparities in this behaviour persisted by race/ethnicity.
Methods
Data come from the National Health and Nutrition Examination Survey (NHANES)(17), a cross-sectional survey of the civilian, non-institutionalised household population, which uses a complex, multistage probability design. Detailed sampling procedures and methodology are described elsewhere(18). NHANES is conducted by the National Center for Health Statistics (NCHS) and approved by their research ethics board. Children aged 7–17 years provided assent and parents provided consent for children under 18 years; adults consented for themselves.
This analysis uses the four most recent 2-year cycles (2011–2018) because oversampling of non-Hispanic Asians began in 2011–2012 allowing for an examination of this population’s trends in tap water consumption, and because prior work already examined trends in Black, Hispanic and White tap water consumption from 2007 to 2016(Reference Rosinger and Young12). Response rates ranged from 77·0 % in 2011–2012 to 54·6 % in 2017–2018 for the examination component for youth aged 1–19 years, and from 64·5 % in 2011–2012 to 45·3 % in 2017–2018 for adults aged 20+ years.
To assess the prevalence of not drinking tap water, we analysed responses to the dietary recall question: ‘When you drink tap water, what is the main source of the tap water?’ If respondents reported not drinking tap water, they were coded as ‘did not drink tap’. All others were coded as ‘drank tap water’(Reference Sanders and Slade16,Reference Patel, Shapiro and Wang19) . A proxy responded to interview questions for children aged ≤5 years; interviews for children aged 6–11 years were conducted with proxy assistance, while children aged ≥12 years responded themselves. If they responded that they did not know their primary source, they were excluded from analyses.
For robustness analyses, we analysed day-one 24-h dietary recall data and dichotomised tap water consumption and bottled water consumption as >0 ml or 0 ml following prior work(Reference Rosinger, Bethancourt and Francis13). This allowed for a comparison of consumption on a given day to self-reports of not drinking water from their main source of tap and if not drinking tap water shifted consumption to bottled water.
Statistical analyses
A two-sided P-value of .05 was used to assess statistical significance. Multiple log-binomial regression models were estimated since prevalence of not drinking tap was >10 %(Reference Rosinger and Young12). As there were no significant race/ethnicity by survey cycle interactions (all P > 0·05), we estimated the regressions and covariate-adjusted time trends without interaction terms. We used the 2013–2014 survey cycle as the reference category as it was the last cycle prior to awareness of the Flint Water Crisis. We plotted trends from the log-binomial regressions using marginal standardisation(Reference Graubard and Korn20) to generate predicted probabilities by self-reported race/ethnicity (White, Black, Asian, Hispanic, or other). We adjusted for the range(Reference Muller and MacLehose21) of the following covariates: age (2–5, 6–11, 12–19, 20–39, 40–59 and 60+ years), sex, federal income to poverty ratio (FIPR) (ratio of family income to the federal poverty guideline(22): ≤130 %, 131–350 %, >350 %), household reference educational attainment (for children/adolescents; high school graduate/GED equivalent and some college were released combined) and educational attainment (for adults), and whether respondents were born in the USA or not(Reference Rosinger and Young12,Reference Patel, Shapiro and Wang19) .
As robustness analyses, we re-estimated log-binomial regressions models as described above with the dichotomised outcome of not drinking any tap water (0 ml) on a given day using the 24-h dietary recall. We repeated this analysis with the dichotomised outcome of any (>0 ml) bottled water intake.
All analyses accounted for the complex survey design, including day-one dietary sample weights, which adjusted for oversampling, non-response, non-coverage, and day of week(18,Reference Korn and Graubard23) and incorporated guidelines from NCHS(Reference Ingram, Malec and Makuc24). Statistical analyses were conducted using Stata V15.1 (Statacorp.).
Results
Data for the primary analyses were analysed for 9439 children and 17 268 adults with complete covariate information (Table 1). Overall, the probability of not drinking tap water increased significantly from 12·3 % (95 % CI (9·5, 15·0)) and 13·9 % (95 % CI (11·8, 16·0)) among children and adults, respectively, in 2013–2014, to 19·9 % (95 % CI (16·0, 23·8)) and 19·5 % (95 % CI (16·5, 22·5)) in 2017–2018. Among children/adolescents and adults, respectively, in the post-Flint period (2017–2018), there was a 63 % (adjusted prevalence ratio (PR): 1·63, 95 % CI (1·25, 2·12), P < 0·001)) and 40 % (PR: 1·40, 95 % CI (1·16, 1·69), P = 0·001)) higher prevalence of not drinking tap water compared to the pre-Flint period (2013–2014), respectively (Fig. 1(a)–1(b); see online Supplemental Table 1: Models 1–2).
Descriptive characteristics of US children/adolescents and adults, NHANES 2011–2018
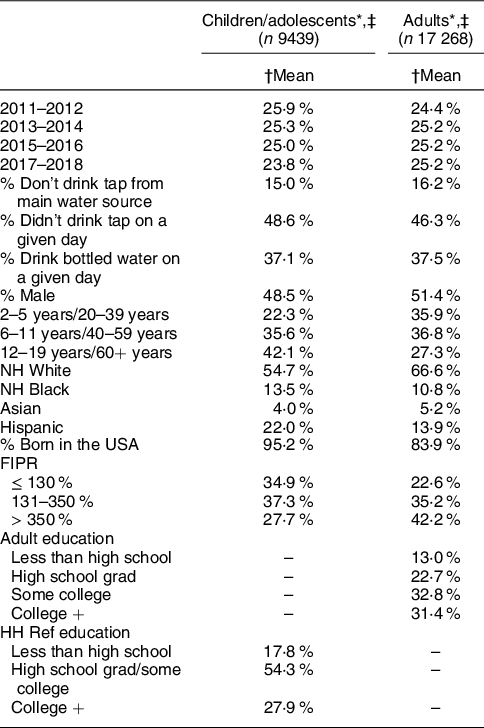
NHANES, National Health and Nutrition Examination Survey; FIPR, Federal income poverty ratio.
Other race/Hispanic origin included in analyses but not shown.
* Unweighted sample size.
† Weighted mean percentages for each category.
‡ Without missing covariate data and valid dietary recall status.
Log-binomial regression models of not drinking tap water by survey cycle, race/ethnicity and socio-demographics, NHANES 2011–2018 among (a) children/adolescents and (b) adults. Notes: n 9439 children/adolescents aged 2–19 years; n 17 268 adults; models adjusted for all variables shown in addition to sex, and age (for adults). Full models shown in Supplemental Table 1. NHANES, National Health and Nutrition Examination Survey

Hispanic, Black, and Asian children/adolescents and adults had significantly higher prevalence of not drinking tap water than White persons (all P < 0·001, Fig. 1(a)–1(b); see online Supplemental Table 1: Models 1–2). Lower income, less educational attainment, and being born outside the USA were associated with higher prevalence of not drinking tap water (Fig. 1(a)–1(b)).
Covariate-adjusted trends by race/ethnicity of not drinking tap water are presented in Fig. 2(a)–2(b). Among Black children/adolescents and adults, the probability of not drinking tap water increased significantly from 18·1 % (95 % CI (13·4, 22·8)) and 24·6 % (95 % CI (20·7, 28·4)) in 2013–2014 to 29·3 % (95 % CI (23·5, 35·1)) and 34·5 % (95 % CI (29·4, 39·6)) in 2017–2018, respectively. Among Hispanic children/adolescents and adults, not drinking tap water increased from 24·5 % (95 % CI (19·4, 29·6)) and 27·1 % (95 % CI (23·0, 31·2)) in 2013–2014 to 39·7 % (95 % CI (32·7, 46·8)) and 38·1 % (95 % CI (33·0, 43·1)) in 2017–2018, respectively (Fig. 2(a)–2(b)). The probability of not drinking tap water did not significantly increase between 2013–2014 and 2017–2018 among Asian or non-Hispanic White children/adolescents and adults, respectively.
Covariate-adjusted predicted probability time trends and 95 % CI of not drinking tap water by race/ethnicity among (a) children and (b) adults, NHANES 2011–2018. Notes: n 9439 children aged 2–19 years; n 17 268 adults; models adjusted for nativity status, sex, age group, income level (federal income to poverty ratio), and educational attainment (of household reference for children, self for adults); dashed line at 2013–2014 indicates beginning of Flint, Michigan Water Crisis. Built from models shown in Supplemental Table 1. NHANES, National Health and Nutrition Examination Survey

Robustness analysis
In robustness analyses, we used data from 10 254 children/adolescents and 17 829 adults with valid dietary recall data, slightly more than the primary analyses due to fewer missing responses on main tap water source. Results of the log-binomial regressions examining not drinking tap water on a given day were slightly attenuated but largely consistent with main analyses (Table 2). Overall for children/adolescents and adults, the prevalence of not drinking tap water was 14·0 % (PR = 1·14; 95 % CI (0·98, 1·33)) and 12·6 % (PR = 1·13; 95 % CI (1·01, 1·25)) higher in 2017–2018 than 2013–2014. As in primary analyses, Black and Hispanic children/adolescents and adults had significantly higher prevalence of not drinking any tap water on a given day than White persons (Table 2, Models 1–2).
Log-binomial regression models of not drinking any tap water on a given day by survey cycle, race/ethnicity and socio-demographics, NHANES 2011–2018 among children/adolescents and adults
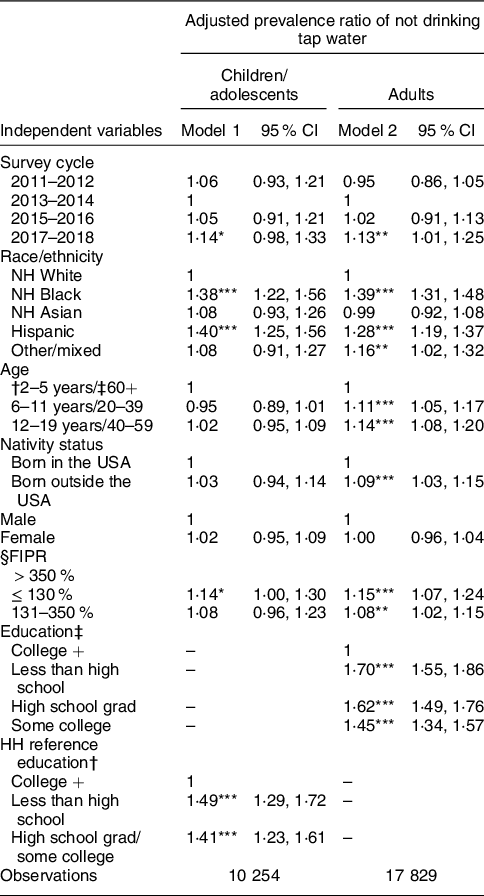
NHANES, National Health and Nutrition Examination Survey; FIPR, federal income to poverty ratio.
95 % CI in parentheses. Data using day one 24-h dietary recall.
† For children.
‡ For adults.
§ FIPR, household income for children.
* P < 0·1.
** P < 0·05.
*** P < 0·01.
In the second analysis, prevalence of any bottled water consumption on a given day was significantly higher overall for both children (PR: 1·26; 95 % CI (1·12, 1·41)) and adults (PR: 1·25; 95 % CI (1·12, 1·40)) in 2017–2018 than in 2013–2014. Further, Black, Asian, and Hispanic persons all had higher prevalence of drinking bottled water than White children and adults, respectively (Table 3, Models 1–2).
Log-binomial regression models of drinking any bottled water on a given day by survey cycle, race/ethnicity and socio-demographics, NHANES 2011–2018 among children/adolescents and adults

NHANES, National Health and Nutrition Examination Survey; FIPR, federal income to poverty ratio.
95 % CI in parentheses. Data using day one 24-h dietary recall.
† For children.
‡ For adults.
§ FIPR, household income for children.
* P < 0·1.
** P < 0·05.
*** P < 0·01.
Discussion
This study used nationally representative data to examine trends and racial/ethnic disparities in tap water consumption among US children and adults which included the pre- and post-Flint period as national awareness about water safety concerns increased. There was little change between 2011 and 2014, but probability of not drinking tap water increased successively from 2013–2014 to 2017–2018, with Hispanic, Black, and Asian individuals being more likely to not drink tap water than Whites. Self-reported race/ethnicity continued to be the largest predictor of not drinking tap water of all covariates examined as the differential treatment of individuals in these categories increases exposure to environmental injustice and racism(Reference Jones11).
Our findings demonstrate persistent racial/ethnic disparities in the tap water consumption gap, and that Hispanic and Black households’ probability of not drinking tap water has further increased in recent years. Higher inequities in water access(Reference Montag9) and distrust(Reference Patel and Schmidt25) have been pointed to in prior research as reasons that Black and Hispanic populations are less likely to drink tap water(Reference Rosinger and Young12,Reference Patel, Shapiro and Wang19,Reference Rosinger, Herrick and Wutich26) . It is critical for public health nutrition to examine how environmental racism and policies may contribute to health disparities, including disparities in water access and consumption. Tap water consumption has health benefits through fluoride delivery that lowers risk of dental caries(Reference Sanders and Slade16). Moreover, when individuals do not drink water, they consume twice the number of kilocalories from sugar-sweetened beverages(Reference Rosinger, Bethancourt and Francis13).
Environmental injustice and racism contribute to these disparities(Reference Montag9) as water quality violations(Reference McDonald and Jones27) and water shutoffs(Reference Montag9) disproportionately affect these communities. Drinking water quality violations often occur at the intersection of race and class where low-income Black and Hispanic communities are at the greatest risk of marginalisation(Reference Switzer and Teodoro28). Our results suggest little progress in addressing these inequities. Increased national awareness of water quality violations following the Flint Water Crisis, emerging local water contaminant exceedances in other cities like Newark, NJ, or other unknown factors may help explain our findings. In particular, increasing reports of lead violations in school drinking water, following increasing requirements to test at the tap, have likely heightened concerns regarding tap water safety(Reference Cradock, Poole and Vollmer3).
To address these disparities and distrust, expanded water quality testing, communication, and lead remediation efforts are needed. Simplified water quality reports that are easy to understand coupled with clear communication between utility companies and households are paramount (e.g. http://policyinnovation.org/wp-content/uploads/WaterDataPrize_Report.pdf). Further, targeted interventions for marginalised communities that use trusted community stakeholders can help address environmental injustice and rebuild trust(Reference Montag9).
While recent studies indicate that up to two million people in the USA lack basic water access(Reference Roller, Gasteyer and Nelson1) – particularly in urban areas(Reference Meehan, Jurjevich and Chun29) – our study indicates the broader problem is far more pervasive and growing. In 2017–2018, approximately 20 % of US children/adolescents and adults did not drink tap water up from ˜13 % in 2013–2014. Using the NCHS Census population totals(18), this translates into 14·8 million children and 46·6 million adults or 61·4 million people in 2017–2018 in the USA who did not drink their tap water (see online Supplemental Table 2). Since 2013–2014, this represents an increase of 19 million people (˜5·6 million children and ˜13·4 million adults) not drinking their tap water, which could be considered an epidemic of tap water distrust and disuse.
Our results differ somewhat from a recent paper examining trends in tap water intake using NHANES 2011–2016 data, which did not find significant changes in the volume of tap water consumed over time, but did uncover increases in the volume of bottled water consumed(Reference Vieux, Maillot and Rehm30). While our primary variable was based on whether persons consumed their tap water rather than the average volume of water consumed, our results were robust when using a dichotomous variable of any tap water intake from the 24-h dietary recall. Second, we found that prevalence of any bottled water consumption on a given day was 25 % higher in 2017–2018 than 2013–2014, supporting the recent trends of increasing bottled water intake in the USA(Reference Rosinger and Young12,Reference Vieux, Maillot and Rehm30,Reference Gleick31) . It is critical for public health nutrition to monitor trends in tap and bottled water use beyond average mean intakes, because this can provide a window into potential underlying water insecurity.
Study limitations include the inability to know why participants did not drink their tap water as follow-up questions were not asked. However, we used two measures of tap water consumption to provide additional internal validity of results and find that shifts to bottled water occurred. We were not able to exclude individuals with no access to tap water; however, NHANES samples the civilian, household population(18) and thus does not sample homeless, who represent a large percentage of those without tap access(Reference Capone, Cumming and Nichols32). This study is limited by not having geographical data, but its goal was to examine recent national trends in tap water consumption rather than geographic differences. Recent work has demonstrated that structural issues like precarious housing within communities of colour increases risk of incomplete plumbing(Reference Meehan, Jurjevich and Chun29,Reference Deitz and Meehan33) . The question regarding tap water filtration was discontinued following the 2009–2010 survey and thus was not controlled for. However, prior work has demonstrated that use of tap water filters do not have an overall effect on these national estimates of tap water consumption(Reference Rosinger and Young12). NCHS addressed the declining response rates through the sampling weights, which further took into account non-response and loss of screener to examination(18).
Conclusion
Approximately 63 % and 40 % more Black and Hispanic children and adults did not drink their tap water in 2017–2018 compared to 2013–2014. Overall, that approximately 61·4 million people in the USA did not drink tap water, an increase of 19 million since the Flint Water Crisis, represents a substantial opportunity to improve public health nutrition. Further, bottled water consumption continued to increase in the USA from 2011 to 2018, particularly among Black, Asian, and Hispanic households. This reliance on bottled water levies additional socio-economic strain.
Policies that address the root of environmental injustices that low-income and minority communities face in accessing safe tap water are necessary to halting the growing racial disparity gap observed in tap water consumption(Reference Patel and Schmidt25). To design meaningful solutions and rebuild trust, more work with communities of colour is needed to understand the various factors that contribute to eschewing tap water. The field of public health nutrition should engage with utility companies and community stakeholders to design interventions aimed at ensuring access to clean water and reducing these disparities in tap water distrust.
Acknowledgements
Acknowledgements: We thank our various intellectual homes, including the HWISE-RCN, the Drinking Water Network, and NOPREN for stimulating conversation around these topics. Financial support: This work was supported by the Ann Atherton Hertzler Early Career Professorship in Global Health funds, and Penn State’s Population Research Institute (NICHD P2CHD041025). The funders had no role in the research or interpretation of results. Conflict of interest: The authors declare they have no conflicts of interest. Authorship: A.Y.R. conceptualised the paper, built the dataset and analysed the data, and wrote the initial manuscript. A.I.P. critically revised the manuscript and wrote parts of the manuscript. F.W. critically revised the manuscript. All authors approved the final manuscript. Ethics of human subject participation: This study was conducted according to the guidelines laid down in the Declaration of Helsinki and all procedures involving research study participants were approved by the NCHS Research Ethics Board. Written informed consent was obtained from all subjects.
Supplementary material
For supplementary material accompanying this paper visit https://doi.org/10.1017/S1368980021002603


 Open access