


Introduction
Cognitive decline is a hallmark of Alzheimer’s disease (AD), and capturing cognitive changes as early as possible is critical for potential therapeutic intervention. Conventional assessment approaches rely on classic cognitive measures that were designed to detect more overt impairment and may not be sensitive to subtle changes that occur prior to onset of clinical symptoms. One promising approach uses data from high-frequency cognitive assessments to examine variability in performance at different timescales.
The study of cognitive variability over larger timescales (i.e., weeks, months, and years) in healthy aging and AD has revealed that older adults and those at risk for developing AD or already showing AD symptoms are more inconsistent across testing sessions (e.g., Bielak et al., Reference Bielak, Mogle and Sliwinski2019; Cerino et al., Reference Cerino, Katz, Wang, Qin, Gao, Hyun, Hakun, Roque, Derby, Lipton and Sliwinski2021; Hultsch et al., Reference Hultsch, MacDonald, Hunter, Levy-Bencheton and Strauss2000; MacDonald & Stawski, Reference MacDonald and Stawski2020; Martin & Hofer, Reference Martin and Hofer2004; Stawski et al., Reference Stawski, MacDonald and Sliwinski2015). However, moment-to-moment variability (over the course of several seconds, rather than hours) might serve an important role in basic psychological and everyday functional processes (Unsworth & Miller, Reference Unsworth and Miller2021; Unsworth, Reference Unsworth2015; Welhaf & Kane, Reference Welhaf and Kane2023). For example, the ability to maintain consistent attention and focus over the course of several seconds is important for many everyday functions like remembering a shopping list, driving, following basic instructions, and even focusing during a conversation. Failing to maintain consistent attention can result in a host of errors ranging from simple forgetting to automobile accidents. In the case of cognitive testing, consistency of reaction times (RT) might provide unique information about an individual’s attentional ability. Throughout a task, participants’ attention may naturally wax and wane, leading to periods of focused, accurate performance, and periods of worse performance (Esterman et al., Reference Esterman, Noonan, Rosenberg and DeGutis2013). This information is overlooked by only examining mean performance on a task.
Using measures of intra-individual RT variability within a single task has previously been useful in discriminating healthy aging from mild cognitive impairment and from individuals diagnosed with symptomatic AD (Christ et al., Reference Christ, Combrinck and Thomas2018; Dixon et al., Reference Dixon, Garrett, Lentz, MacDonald, Strauss and Hultsch2007; Gorus et al., Reference Gorus, De Raedt, Lambert, Lemper and Mets2008; Hultsch et al., Reference Hultsch, MacDonald, Hunter, Levy-Bencheton and Strauss2000) and even predicting increased risk of developing mild cognitive impairment (for a review see Haynes et al., Reference Haynes, Bauermeister and Bunce2017). For example, Duchek et al. (Reference Duchek, Balota, Tse, Holtzman, Fagan and Goate2009) found that individuals diagnosed with very mild AD showed increased variability on difficult trials (measured as RT coefficient of variation, [CoV]) compared to healthy older adults and young adults, in three attention control tasks. Also, Gyurkovics et al. (Reference Gyurkovics, Balota and Jackson2018) found increased CoV in a go/no-go task in early-stage AD participants compared to healthy older adults and healthy young adults. Increased RT variability has also been proposed to, at least partially, reflect efficiency of attention control (West et al., Reference West, Murphy, Armilio, Craik and Stuss2002), differences in white matter integrity (Jackson et al., Reference Jackson, Balota, Duchek and Head2012), or breakdowns in functional connectivity (Duchek et al., Reference Duchek, Balota, Thomas, Snyder, Rich, Benzinger, Fagan, Holtzman, Morris and Ances2013). If RT variability reflects efficiency of attention control (e.g., West et al., 2002) then it should also be related to conventional cognitive measures which rely on consistent attention for successful performance. Previous work suggests that attention control appears to be impaired in the early stages of AD and might be an important precursor to memory-related impairments associated with AD (see Balota & Faust, Reference Balota and Faust2001; Perry & Hodges, Reference Perry and Hodges1999).
This previous work has examined the sensitivity of RT variability between participants who are healthy and beginning to show early signs of AD. However, a major effort of AD research is to identify markers that are sensitive during the preclinical stage of the disease, especially in individual who might be at an increased risk for developing AD. For example, carrying at least one APOE ε4 allele is a major risk factor for developing AD (Corder et al., Reference Corder, Saunders, Strittmatter, Schmechel, Gaskell, Small, Roses, Haines and Pericak-Vance1993) and is often associated with increased amyloid burden (Mishra et al., Reference Mishra, Blazey, Holtzman, Cruchaga, Su, Morris, Benzinger and Gordon2018; Morris et al., Reference Morris, Roe, Xiong, Fagan, Goate, Holtzman and Mintun2010). Thus, it is possible that RT variability might be a sensitive measure to help identify cognitive decline earlier among APOE ε4 carriers. Several studies have tested for such a relationship, but the findings are mixed. Some have found that carrying at least one copy of APOE ε4 is associated with increases in RT variability in otherwise healthy older adults (Duchek et al., Reference Duchek, Balota, Tse, Holtzman, Fagan and Goate2009). Other studies have found no difference in RT variability measures between ε4 carriers and noncarriers (e.g., Anstey et al., Reference Anstey, Mack, Christensen, Li, Reglade-Meslin, Maller, Kumar, Dear, Easteal and Sachdev2007; Kay et al., Reference Kay, Seidenberg, Durgerian, Nielson, Smith, Woodard and Rao2017; Lu et al., Reference Lu, Nicholas, James, Lane, Parker, Keshavan, Keuss, Buchanan, Murray‐Smith, Cash, Sudre, Malone, Coath, Wong, Henley, Fox, Richards, Schott and Crutch2020). One possibility for these differences across studies may be due to the tasks used. Specifically, Duchek et al. (Reference Duchek, Balota, Tse, Holtzman, Fagan and Goate2009) assess RT variability in the context of attention control tasks (e.g., Stroop), whereas studies reporting null effects assessed RT variability in either simple or choice RT tasks (Anstey et al., Reference Anstey, Mack, Christensen, Li, Reglade-Meslin, Maller, Kumar, Dear, Easteal and Sachdev2007; Lu et al., Reference Lu, Nicholas, James, Lane, Parker, Keshavan, Keuss, Buchanan, Murray‐Smith, Cash, Sudre, Malone, Coath, Wong, Henley, Fox, Richards, Schott and Crutch2020) or a motor timing task (Kay et al., Reference Kay, Seidenberg, Durgerian, Nielson, Smith, Woodard and Rao2017). Thus, more work is needed to understand how APOE ε4 status is related to RT variability and how results may vary by the cognitive demands of the task.
Prior studies of RT variability have, for pragmatic reasons, all taken place in clinic or lab settings. These typically require participants to travel to the assessment facility and undergo testing for extended periods of time. These “one-shot” assessments of cognition may be biased due to many factors including stress from traveling to the site, or other performance decrements due to day-to-day hassles and contextual confounds like poor mood, or increased fatigue that naturally occur in daily life. Further, when participants come into the clinic, they may enter a “testing mode,” which might unintentionally generate different cognitive performance than they would otherwise display in real life. Additionally, traditional in-clinic testing occurred in a structured testing environment that is highly controlled and minimizes distractions. Measuring aspects of cognition, like attention, in everyday life where people are more vulnerable to distractions can be more reflective of real-world functioning compared to traditional in-clinic testing.
Our assessment approach (see Nicosia et al., Reference Nicosia, Aschenbrenner, Balota, Sliwinski, Tahan, Adams and Hassenstab2023; Wilks et al., Reference Wilks, Aschenbrenner, Gordon, Balota, Fagan, Musiek and Hassenstab2021) uses a custom-designed smartphone app to repeatedly assess cognition with a measurement “burst” design. In this type of design, participants are remotely assessed several times per day for several consecutive days with extremely brief cognitive tests that are designed for repeated administration. Participants might complete these assessment bursts annually or in our case, semiannually, to investigate cognitive change (see also Cerino et al., Reference Cerino, Katz, Wang, Qin, Gao, Hyun, Hakun, Roque, Derby, Lipton and Sliwinski2021; Sliwinski et al., Reference Sliwinski, Mogle, Hyun, Munoz, Smyth and Lipton2018; Stawski et al., Reference Stawski, MacDonald, Brewster, Munoz, Cerino and Halliday2019). Using principles of ecological momentary assessment (EMA; Shiffman et al., Reference Shiffman, Stone and Hufford2008), we can capture behavior and cognition in daily life across a variety of contexts and environments to better characterize fluctuations in RT.
Overview of the present study
The present paper focuses on how moment-to-moment variability in performance (assessed via RT variability) on a brief processing speed task given multiple times over the course of a week might be a sensitive measure to detect subtle cognitive changes in older adults at risk for AD. Below we detail the major aims of the study.
Aim 1: Can RT variability measure be reliably assessed using EMA methods?
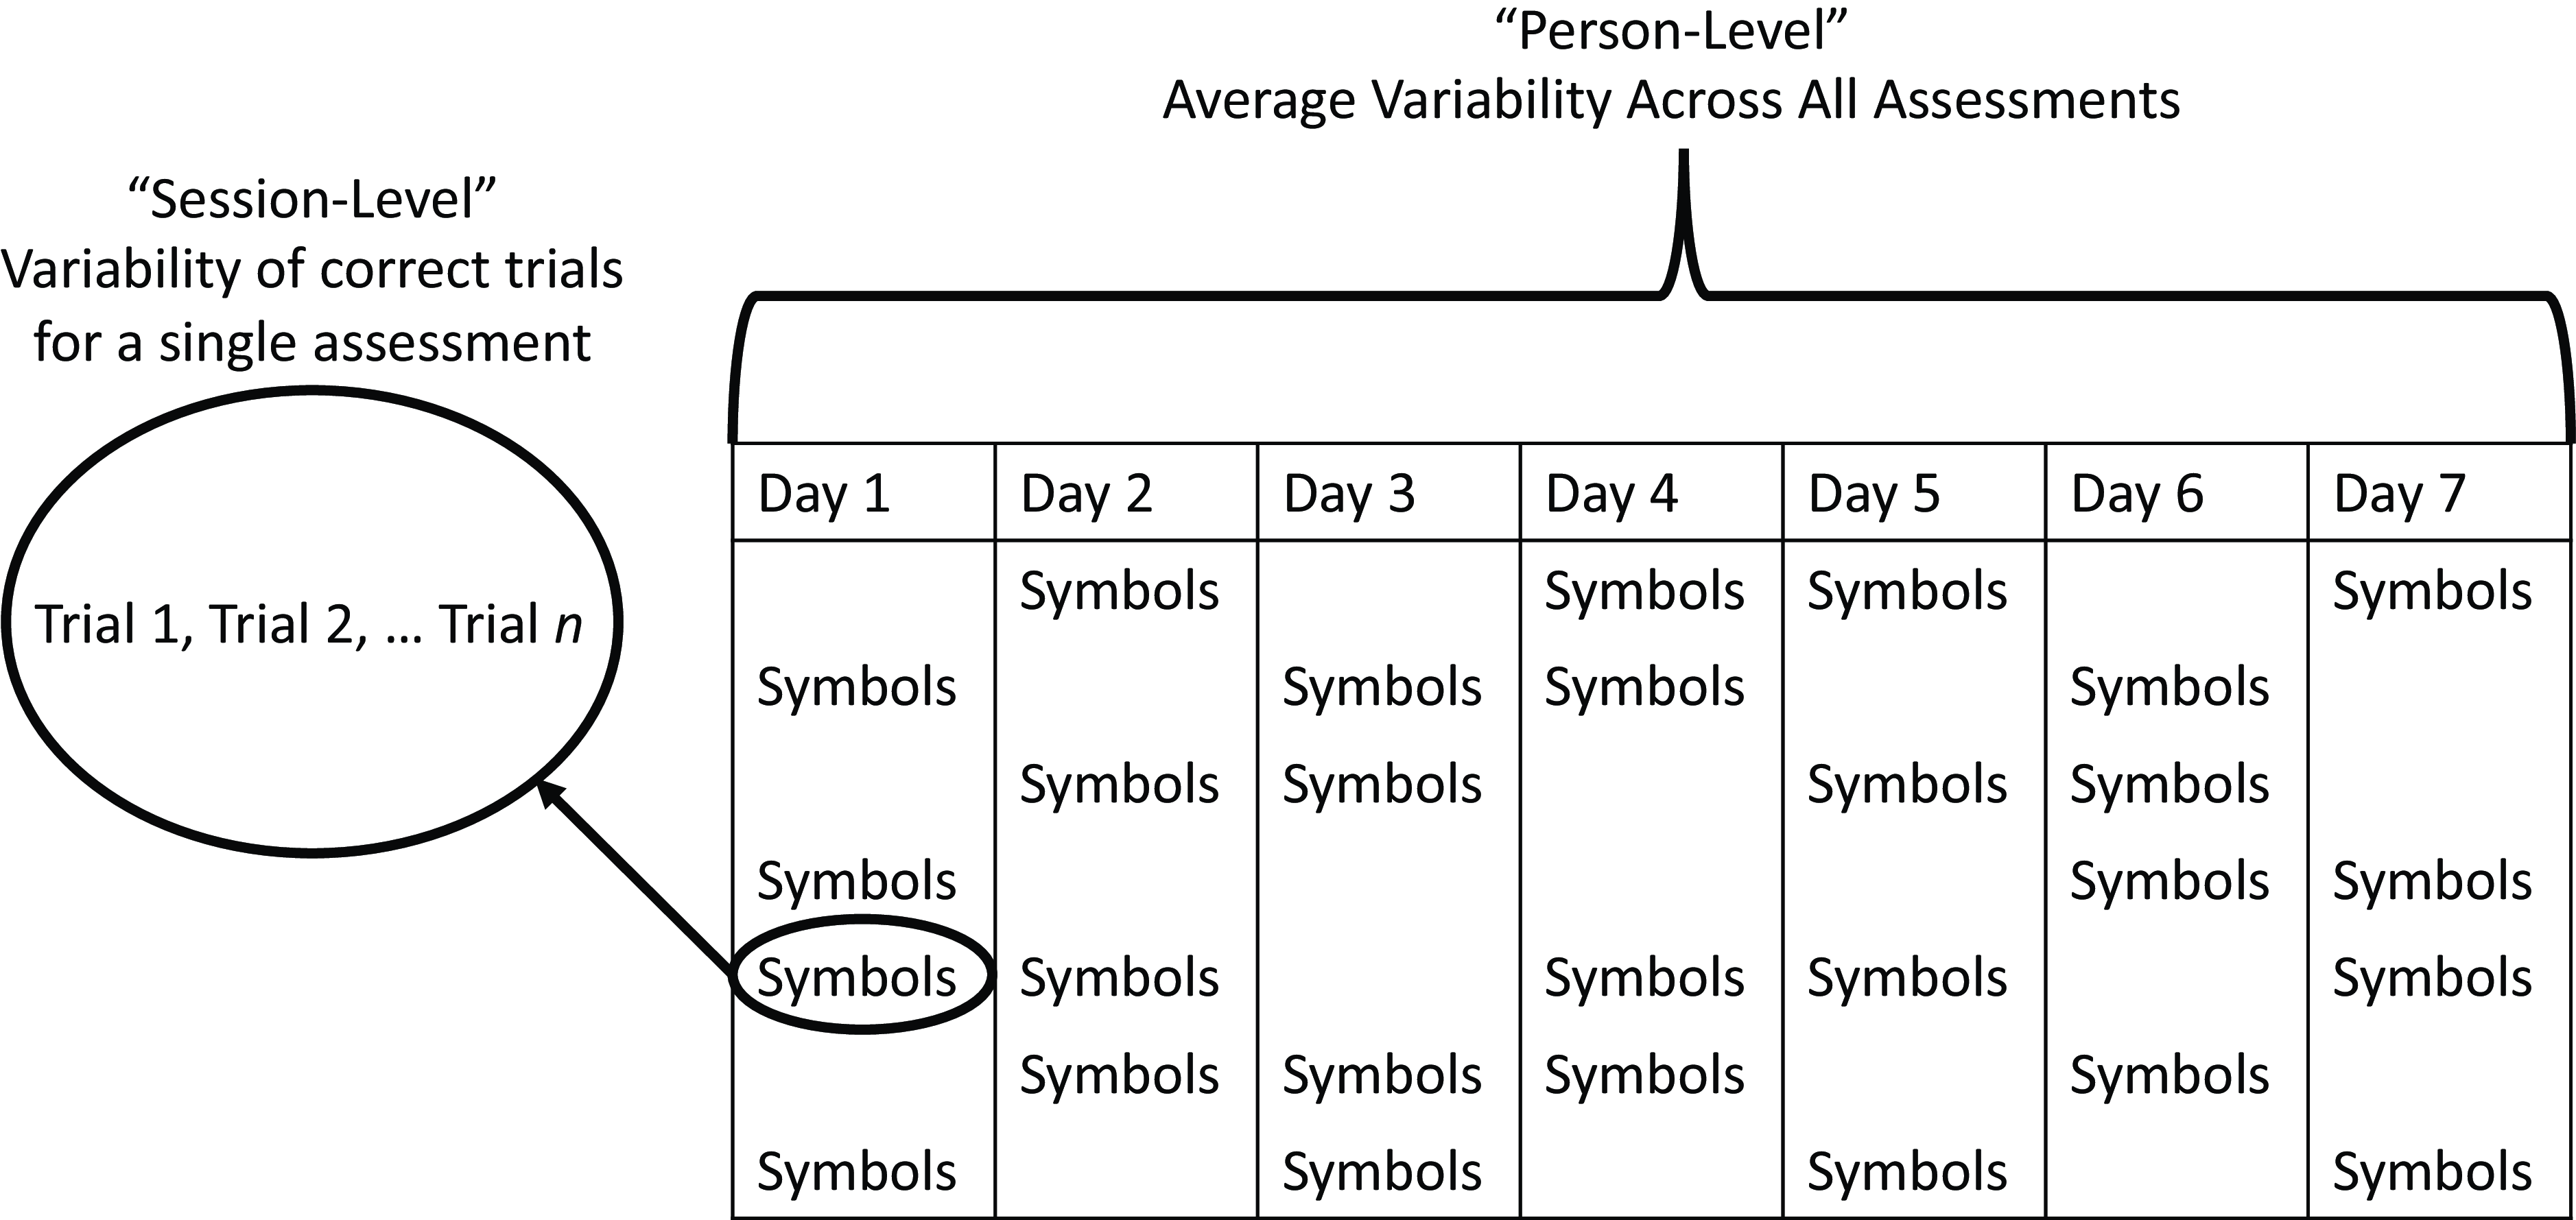
First, we examined if two measures of RT variability can be reliably assessed over the course of a week using EMA. Figure 1 depicts our general analytic approach. We examined moment-to-moment variability within each session and then calculated the mean of that variability across sessions to obtain a “person-level” estimate of variability. Thus, each visit can be equated to an individual “task” that might be given at a typical in-clinic assessment. Using this approach, we aimed to minimize influences of between-session variability, which appears to be sensitive to AD risk factors like APOE status (see Aschenbrenner et al., Reference Aschenbrenner, Hassenstab, Morris, Cruchaga and Jackson2023).
Depiction of different levels of RT variability analyses across a typical ARC assessment visit period.
Aim 2: How is RT variability related to AD risk factors?
If RT variability can be reliably assessed using EMA, the next logical question is to see if it is sensitive to important AD risk factors. In line with previous research (Duchek et al., Reference Duchek, Balota, Tse, Holtzman, Fagan and Goate2009; Gyurkovics et al., Reference Gyurkovics, Balota and Jackson2018), we hypothesized that RT variability would be greater among those already showing clinical symptoms (e.g., CDR 0.5 vs. CDR 0 participants). Further, we hypothesized that RT variability would also be a sensitive measure in a preclinical sample of participants who were at increased risk for developing AD dementia (e.g., APOE ε4 carriers).
Aim 3: How is RT variability related to conventional cognitive measures and can it explain the relationship between AD risk and cognitive performance?
We hypothesized that measures of RT variability would be modestly correlated with in-clinic measures of cognition and perhaps more strongly correlated with in-clinic measures of attention control compared to memory or speed measures. Further, we hypothesized that RT variability would be a significant mediator in the relationship between AD risk (indexed by APOE ε4 status) and in-clinic cognition. That is, part of the reason APOE ε4 carriers might perform worse on traditional cognitive measures is because of their poorer ability to maintain consistent focus (i.e., greater RT variability).
Methods
Participants
Participants were recruited from ongoing studies of aging and dementia at the Knight Alzheimer Disease Research Center (Knight ADRC) at Washington University School of Medicine in St Louis. Data collection began in March of 2020 for our ongoing high-frequency cognitive assessment study of older adults at risk for developing AD, the Ambulatory Research in Cognition (ARC) study (Nicosia et al., Reference Nicosia, Aschenbrenner, Balota, Sliwinski, Tahan, Adams and Hassenstab2023) at Washington University in St Louis. Nearly all participants were invited to enroll after completing their annual cognitive and clinic assessment and began ARC testing shortly after enrolling. As data collection is still ongoing, we used a data freeze from June 2023 for the current analyses. All participants provided informed consent, and all procedures were approved by the Human Research Protections Office at Washington University in St Louis and the research was conducted in accordance with the Helsinki Declaration.
The final sample consisted of 377 participants. Table 1 provides demographic and ARC information on the full sample, grouped by CDR status. Table 2 provides demographic information and cognitive assessment descriptive statistics participants in the CDR 0 subsample, grouped by APOE ε4 status. Participants were highly educated, most self-identified their race as White, and were majority female. Adherence was high with participants completing, on average, 23.07 ± 4.69 out of a possible 28 sessions (82.39% adherence).
Demographics of sample by CDR status
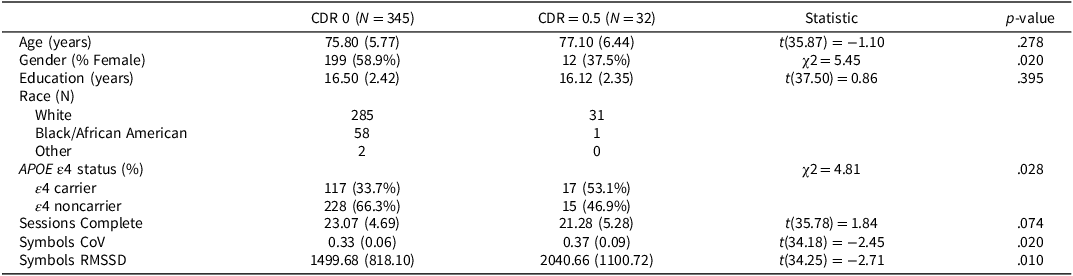
APOE ε4 = Apolipoprotein ε4, CDR = Clinical Dementia Rating.
Means (Standard Deviations) reported for continuous variables. N(%) reported for categorical variables. Gender and Race were self-reported.
Demographics and cognitive performance of CDR 0 subsample by APOE ε4 status
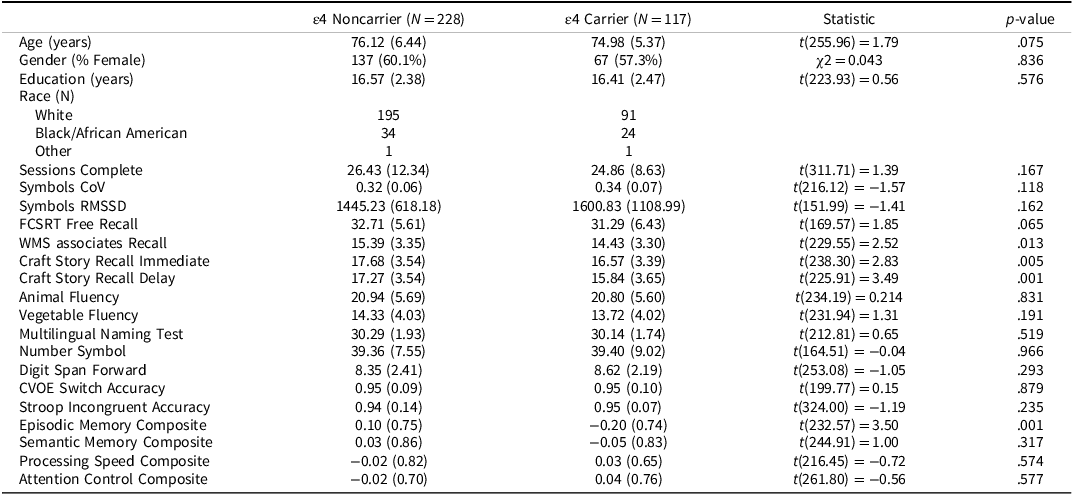
APOE ε4 = Apolipoprotein ε4; In-clinic cognitive measures were only analyzed for the CDR 0 group.
Means (Standard Deviations) reported for continuous variables. N(%) reported for categorical variables. Gender and Race were self-reported.
Clinical assessments
Clinical status was assessed using the Clinical Dementia Rating® (Morris, Reference Morris1993). The CDR® rates cognitive and functional performance on a 5-point scale across six domains (memory, orientation, judgment and problem-solving, community affairs, home and hobbies, and personal care; see Morris, Reference Morris1993). Participants and a collateral source (a close family member or friend) both underwent semi-structured interviews to determine CDR scores with CDR = 0 indicating cognitive normality, 0.5 indicating very mild dementia, 1 indicating mild dementia, 2 indicating moderate dementia, and 3 indicating severe dementia. For the current study, participants were categorized as either cognitively normal (CDR = 0), or diagnosed with very mild dementia (CDR = 0.5). By design, most participants were cognitively normal (CDR 0), with the final sample consisting of 345 cognitively normal participants and 32 CDR 0.5 participants. CDR assessments were completed 8.02 ± 7.53 weeks from the ARC assessment.
APOE genotyping was conducted using blood samples drawn from participants. Participants were classified as APOE ε4 carriers (4/4, 3/4, 2/4) or APOE ε4 noncarriers (3/3, 2/3, 2/2) (see Cruchaga et al., Reference Cruchaga, Kauwe, Harari, Jin, Cai, Karch, Benitez, Jeng, Skorupa, Carrell, Bertelsen, Bailey, McKean, Shulman, De Jager, Chibnik, Bennett, Arnold, Harold, Sims, Gerrish, Williams, Van Deerlin, Lee, Shaw, Trojanowski, Haines, Mayeux, Pericak-Vance, Farrer, Schellenberg, Peskind, Galasko, Fagan, Holtzman, Morris and Goate2013). During the start of the ARC study, biomarker assessments at the Knight ADRC were suspended temporarily due to the COVID-19 pandemic. Because of this, we focus our analyses on APOE ε4 status as our primary AD risk factor (as in Aschenbrenner et al., Reference Aschenbrenner, Hassenstab, Morris, Cruchaga and Jackson2023).
ARC smartphone assessment
Participants completed three cognitive tasks up to four times per day over a week in their natural environments (see Nicosia et al., Reference Nicosia, Aschenbrenner, Balota, Sliwinski, Tahan, Adams and Hassenstab2023 for full details on the ARC platform). For the purposes of the current study, we describe the Symbols test, as this measure features RT as its primary outcome (the other two tasks include a measure of visual working memory and associative memory). A screenshot of the Symbols test is shown in Figure 2. We only included participants if they completed 10 sessions of the Symbols test over the course of the week to ensure they engaged sufficiently with the testing.
Screenshot of ARC symbols task. Participants completed up to 4 sessions a day for 7 days. Each symbols task included 12 trials of matching items at the bottom to one of the three options in the top row.
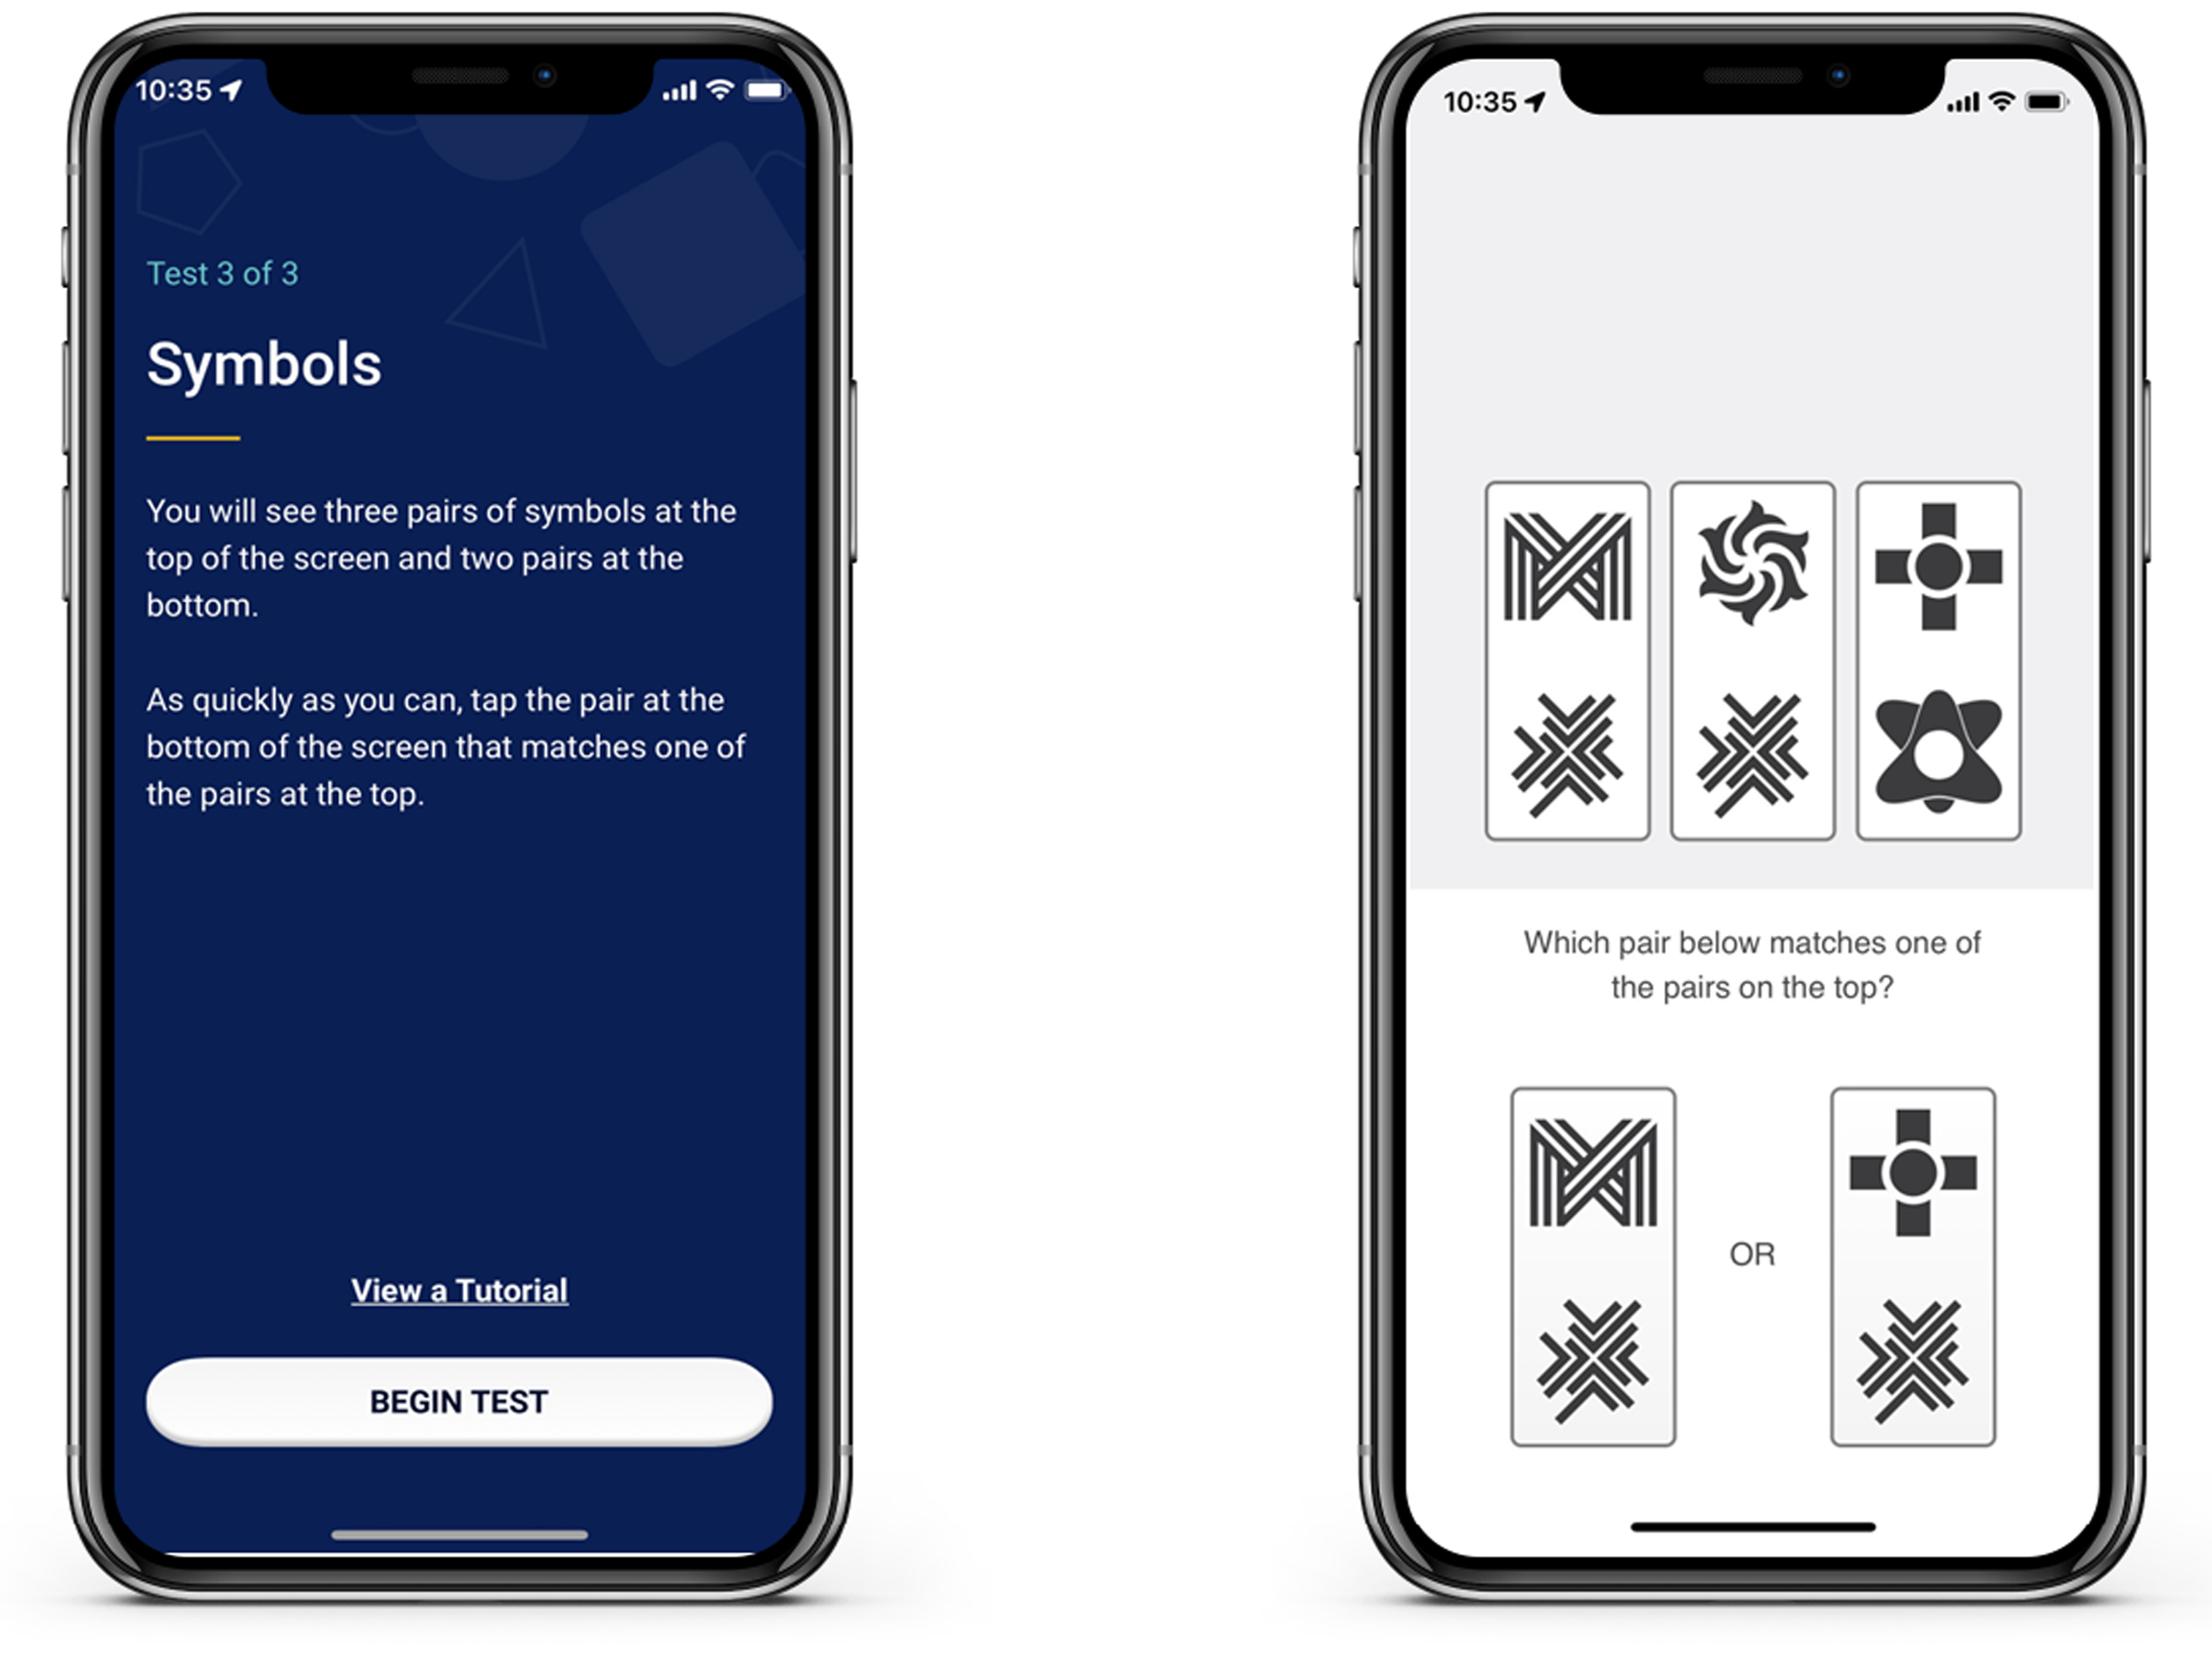
During the Symbols task, participants were randomly shown three pairs of abstract shapes and were asked to select which of two possible responses matched one of the three targets. At each assessment, participants completed 12 trials (there was no response deadline for participants in the task). In our previous work (Nicosia et al., 2022; Wilks et al., Reference Wilks, Aschenbrenner, Gordon, Balota, Fagan, Musiek and Hassenstab2021) the primary dependent measure was median RT on correct trials. For the current study, because we were interested in the variability in RTs, we calculated CoV (standard deviation of RTs / mean RT) to correct RTs.
We chose CoV for multiple reasons. First, mean RT and RT variability are highly correlated, especially in older adults (Faust et al., Reference Faust, Balota, Spieler and Ferraro1999), so we used CoV to account for age- and disease-related slowing of RTs. Second, we used CoV to maintain consistency with our past work (e.g., Duchek et al., Reference Duchek, Balota, Tse, Holtzman, Fagan and Goate2009). Higher scores indicated greater variability and thus poorer moment-to-moment attention above and beyond overall differences in processing speed.
To test the robustness of our methods, we also calculated an alternative measure of RT variability with the Root Mean Squared Successive Difference (RMSSD; Von Neuman et al., Reference Von Neumann, Kent, Bellinson and Hart1941). The equation for RMSSD is shown in Equation (1):
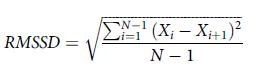 $$RMSSD = \sqrt {{{\sum\nolimits_{i = 1}^{N - 1} {{{\left( {{X_i} - {X_{i + 1}}} \right)}^2}} } \over {N - 1}}} $$
where X i is the interval between adjacent trials, X i + 1 the next trial interval, and N is the number of trials.
We calculated participant-level estimates of RMSSD the same way we did for CoV. That is, we calculated the RMSSD at each individual session and then averaged this over all sessions for a given participant. RMSSD is a well-established measure of variability in the heart rate literature and accounts for gradual shifts in mean performance over time and overall learning effects. However, because CoV can behave differently than other variability measures (e.g., Hultsch et al., Reference Hultsch, Strauss, Hunter and MacDonald2011; Stawski et al., Reference Stawski, MacDonald, Brewster, Munoz, Cerino and Halliday2019), it is important to determine if measures of variability might lead to different results or interpretations.
RT outliers were handled using the following procedures. From the correct trials, we removed RTs < 200ms as these RTs are below the threshold for participants to accurately encode and respond to stimuli. We next imputed any RTs for each subject beyond their Median + 3*Interquartile Range to that value. Thus, we retained as much data for each subject without undue influence of extremely long RTs (see Welhaf & Kane, Reference Welhaf and Kane2023). This procedure resulted in < 1% of RTs being imputed for each participant.
Conventional cognitive assessments
Participants completed several in-person cognitive measures as part of their annual assessment at the Knight ADRC (see Hassenstab et al., Reference Hassenstab, Chasse, Grabow, Benzinger, Fagan, Xiong, Jasielec, Grant and Morris2016). For the current study, we examined scores on several measures that spanned three main cognitive domains. Specifically, we included composites for semantic memory/language (Category Fluency for Animals and Vegetables, Multilingual Naming Test), episodic memory (Weschler Memory Sale Paired Associated Recall, Free and Cued Selective Reminding Test, Craft Story 21 immediate and delayed recall), processing speed (Digit Span Forward and Number Symbol Test, a measure similar to the digit symbol coding test), and Attention Control (Stroop Incongruent Accuracy and CVOE Switch Accuracy). We chose to use these composites given their increased reliability over individual tests (see Hassenstab et al., Reference Hassenstab, Chasse, Grabow, Benzinger, Fagan, Xiong, Jasielec, Grant and Morris2016 and Weintraub et al., Reference Weintraub, Salmon, Mercaldo, Ferris, Graff-Radford, Chui, Cummings, DeCarli, Foster, Galasko, Peskind, Dietrich, Beekly, Kukull and Morris2009; Reference Weintraub, Besser, Dodge, Teylan, Ferris, Goldstein, Giordani, Kramer, Loewenstein, Marson, Mungas, Salmon, Welsh-Bohmer, Zhou, Shirk, Atri, Kukull, Phelps and Morris2018 for additional information and references for individual tests). Cognitive assessments were completed 1.29 ± 4.41 weeks from the ARC assessment.
Analytic plan
To address our first aim, we report between-person reliability estimates of the two variability measures used in the present paper. For our second aim, if RT variability measures are sensitive to clinical status, we used linear regression to predict RT CoV and RMSSD (our outcome measures) from two main predictors of interest, APOE ε4 status and CDR status, while controlling for age, level of education, self-reported gender, and number of completed sessions. As part of our second aim, we also examined if RT variability could serve as a sensitive preclinical measure. To test this, we again conducted linear regression analysis in only the cognitively healthy (CDR 0) participants to determine if there was a reliable signal of APOE ε4 in a preclinical AD sample following from Aschenbrenner et al. (Reference Aschenbrenner, Hassenstab, Morris, Cruchaga and Jackson2023). Again, our outcome measure for this analysis was the RT variability measure with the main predictor being APOE ε4 status while controlling for age, level of education, self-reported gender, and number of completed sessions.
For our third and final aim, we tested the convergent and discriminant validity of our RT variability measures against conventional in-clinic cognitive measures among cognitively healthy older adults. We approached this question in two ways. First, we examined the simple bivariate correlations between the ARC RT Variability measures (CoV and RMSSD) and several in-clinic measures of episodic memory, semantic memory, processing speed, language, and attention control. Second, we asked if the reason individuals at risk for AD perform worse on in-clinic measures of cognition is due, in part, to poorer ability to maintain attention. To test this, we conducted several mediation models using the PROCESS macro to test a simple mediation model 4 (Hayes, Reference Hayes2022). A different cognitive composite served as the outcome measure in each model, APOE ε4 status served as the predictor variable, RT CoV or RMSSD as the proposed mediator, with age, education, and gender entered as covariates. We calculated bootstrapped 95% confidence intervals for the direct and indirect effects in each model. When the confidence interval did not contain zero, that effect can be interpreted as significant.
Results
Between-person reliability of RT variability measures
As previously described, aggregating scores across EMA sessions can increase the reliability of measures compared to traditional “one-shot” measures (e.g., Shiffman et al., Reference Shiffman, Stone and Hufford2008). We have previously shown that ARC measures show dramatically higher reliability compared to their in-clinic counterparts in as few as two sessions for the Symbols task and across multiple days for the other two ARC measures of visual working memory and associate memory (e.g., Nicosia et al., Reference Nicosia, Aschenbrenner, Balota, Sliwinski, Tahan, Adams and Hassenstab2023). We also think it is important to test if measures of variability (which are inherently noisier) are also reliable when gathered using EMA methods. To test this, we fit a series of unconditional multilevel models for the RT CoV and RMSSD measures to compute between-person reliability (e.g., Raykov & Marcoulides, Reference Raykov and Marcoulides2006; Sliwinski et al., Reference Sliwinski, Mogle, Hyun, Munoz, Smyth and Lipton2018). The resulting reliabilities are displayed in Table 3. Between-person reliability for both measures was quite high. Notably, the between-person reliability for RMSSD was impressively high with only a single day worth of ARC tests (i.e., four sessions). RT CoV required roughly two days’ worth of tests to reach a similar level of between-person reliability.
Reliabilities for symbols CoV and RMSSD measure
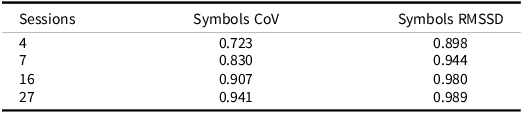
ARC Participants received 4 sessions/day for 7 days.
RT CoV differences by AD risk factors
Our first set of analyses determined if cognitively normal (asymptomatic) participants (CDR = 0) differed in their RT CoV compared to participants with very mild dementia symptoms (CDR = 0.5). As seen in Table 4, RT CoV was significantly predicted by age and CDR status. As expected, participants with very mild dementia had higher RT CoV over their week of testing indicating poorer moment-to-moment attention (see Fig. 3). The effect of APOE ε4 status was not significant, but it was in the hypothesized direction with APOE ε4 carriers showing higher CoV than noncarriers.
Linear regressions predicting symbols RT CoV
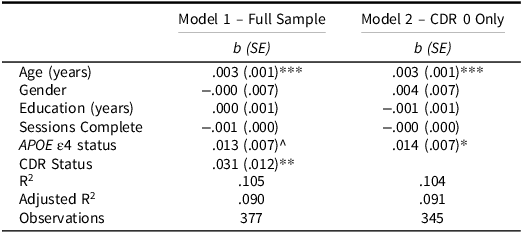
APOE ε4 = Apolipoprotein ε4; CDR = Clinical Dementia Rating.
^ p = .070; * p < .05; ** p < .01; *** p < .001.
Raincloud plots (Allen et al., Reference Allen, Poggiali, Whitaker, Marshall, van Langen and Kievit2019) depicting differences in RT CoV by CDR group. Individual dots represent participant values with the corresponding distribution. Open circles reflect the group means and the corresponding 95% confidence interval. Asymptomatic (CDR = 0) N = 345; symptomatic (CDR = 0.5) N = 32.
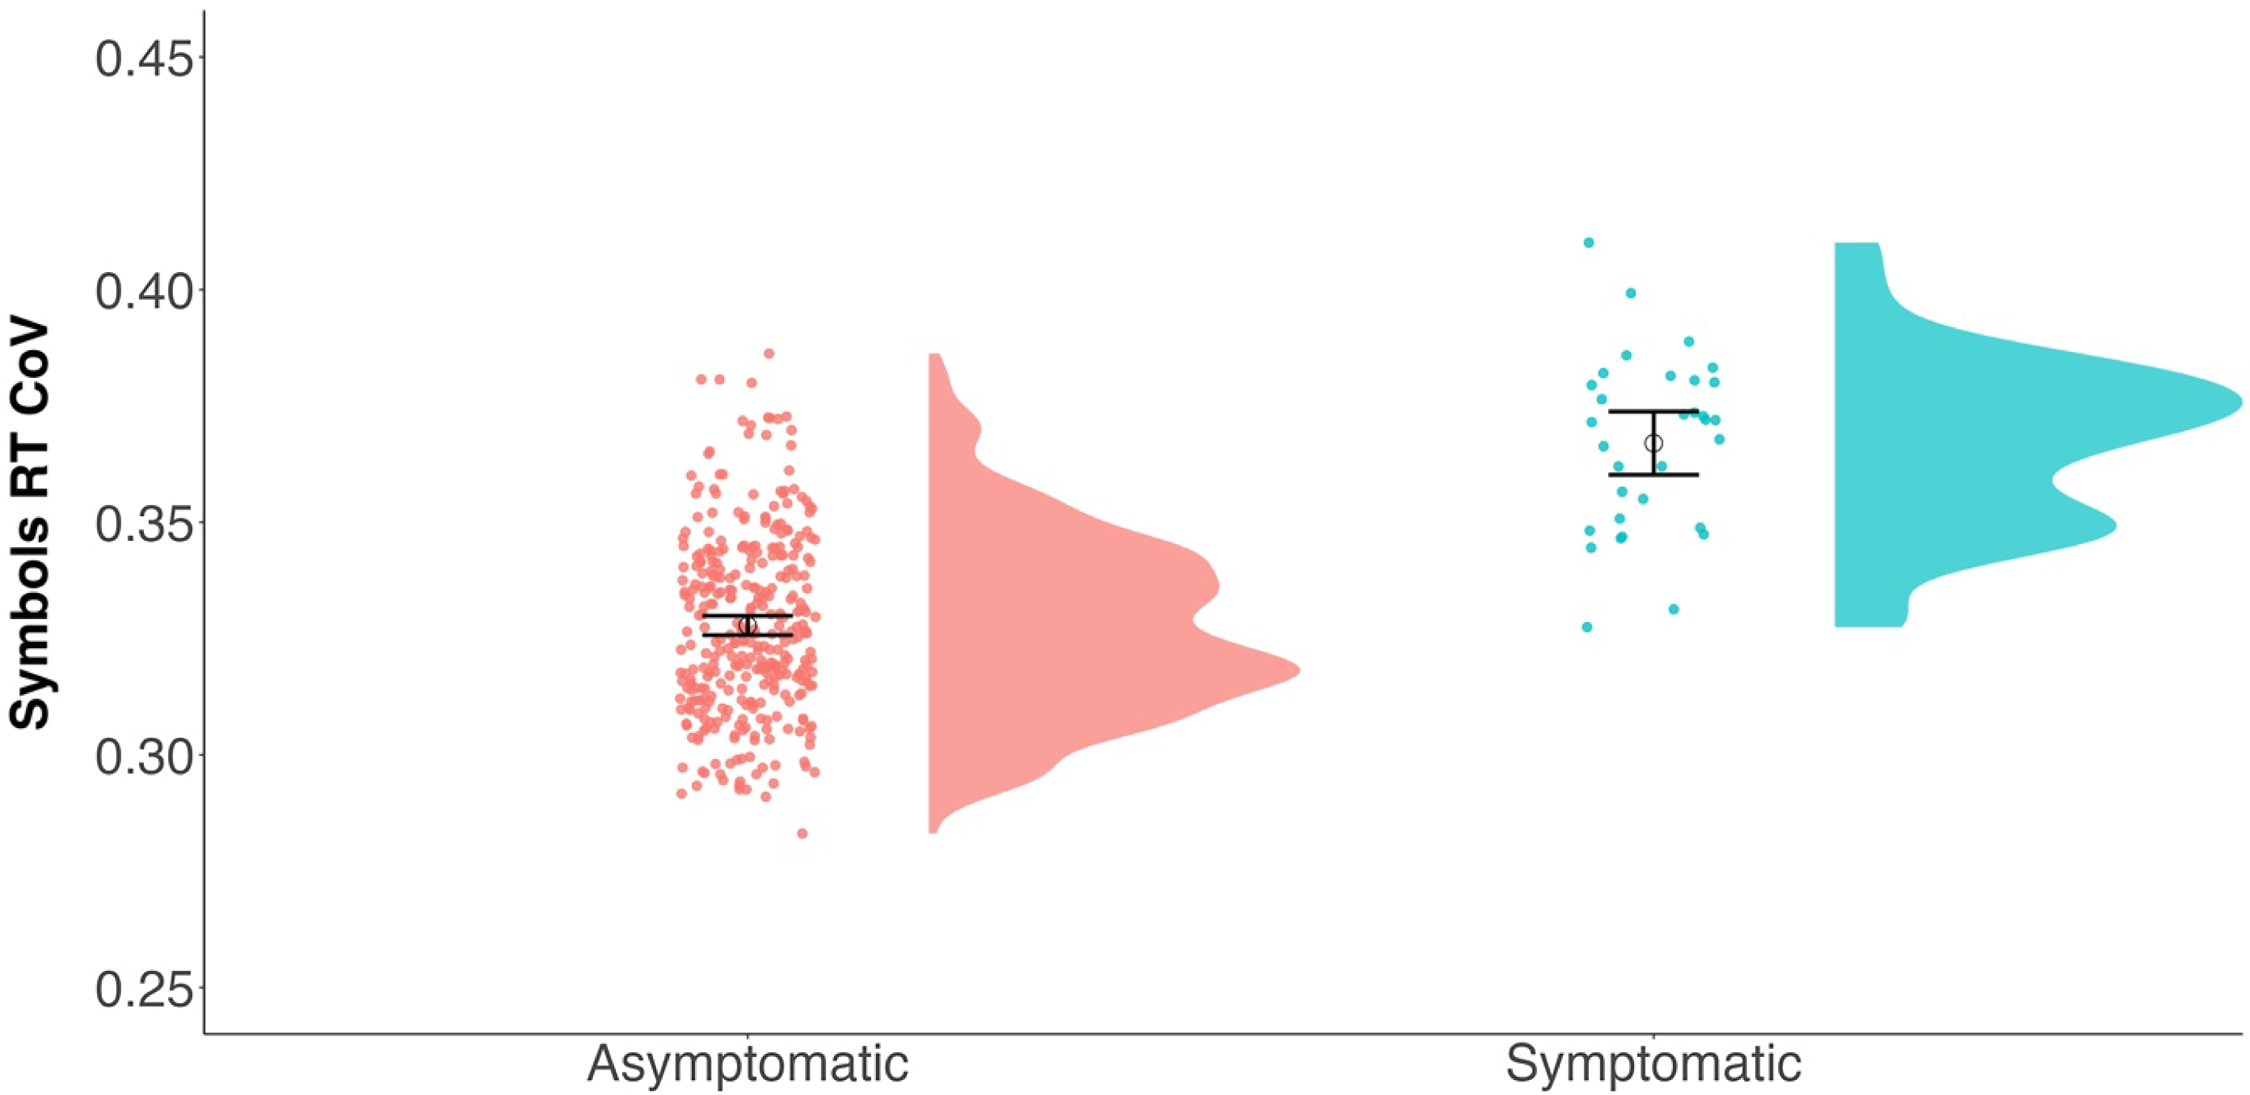
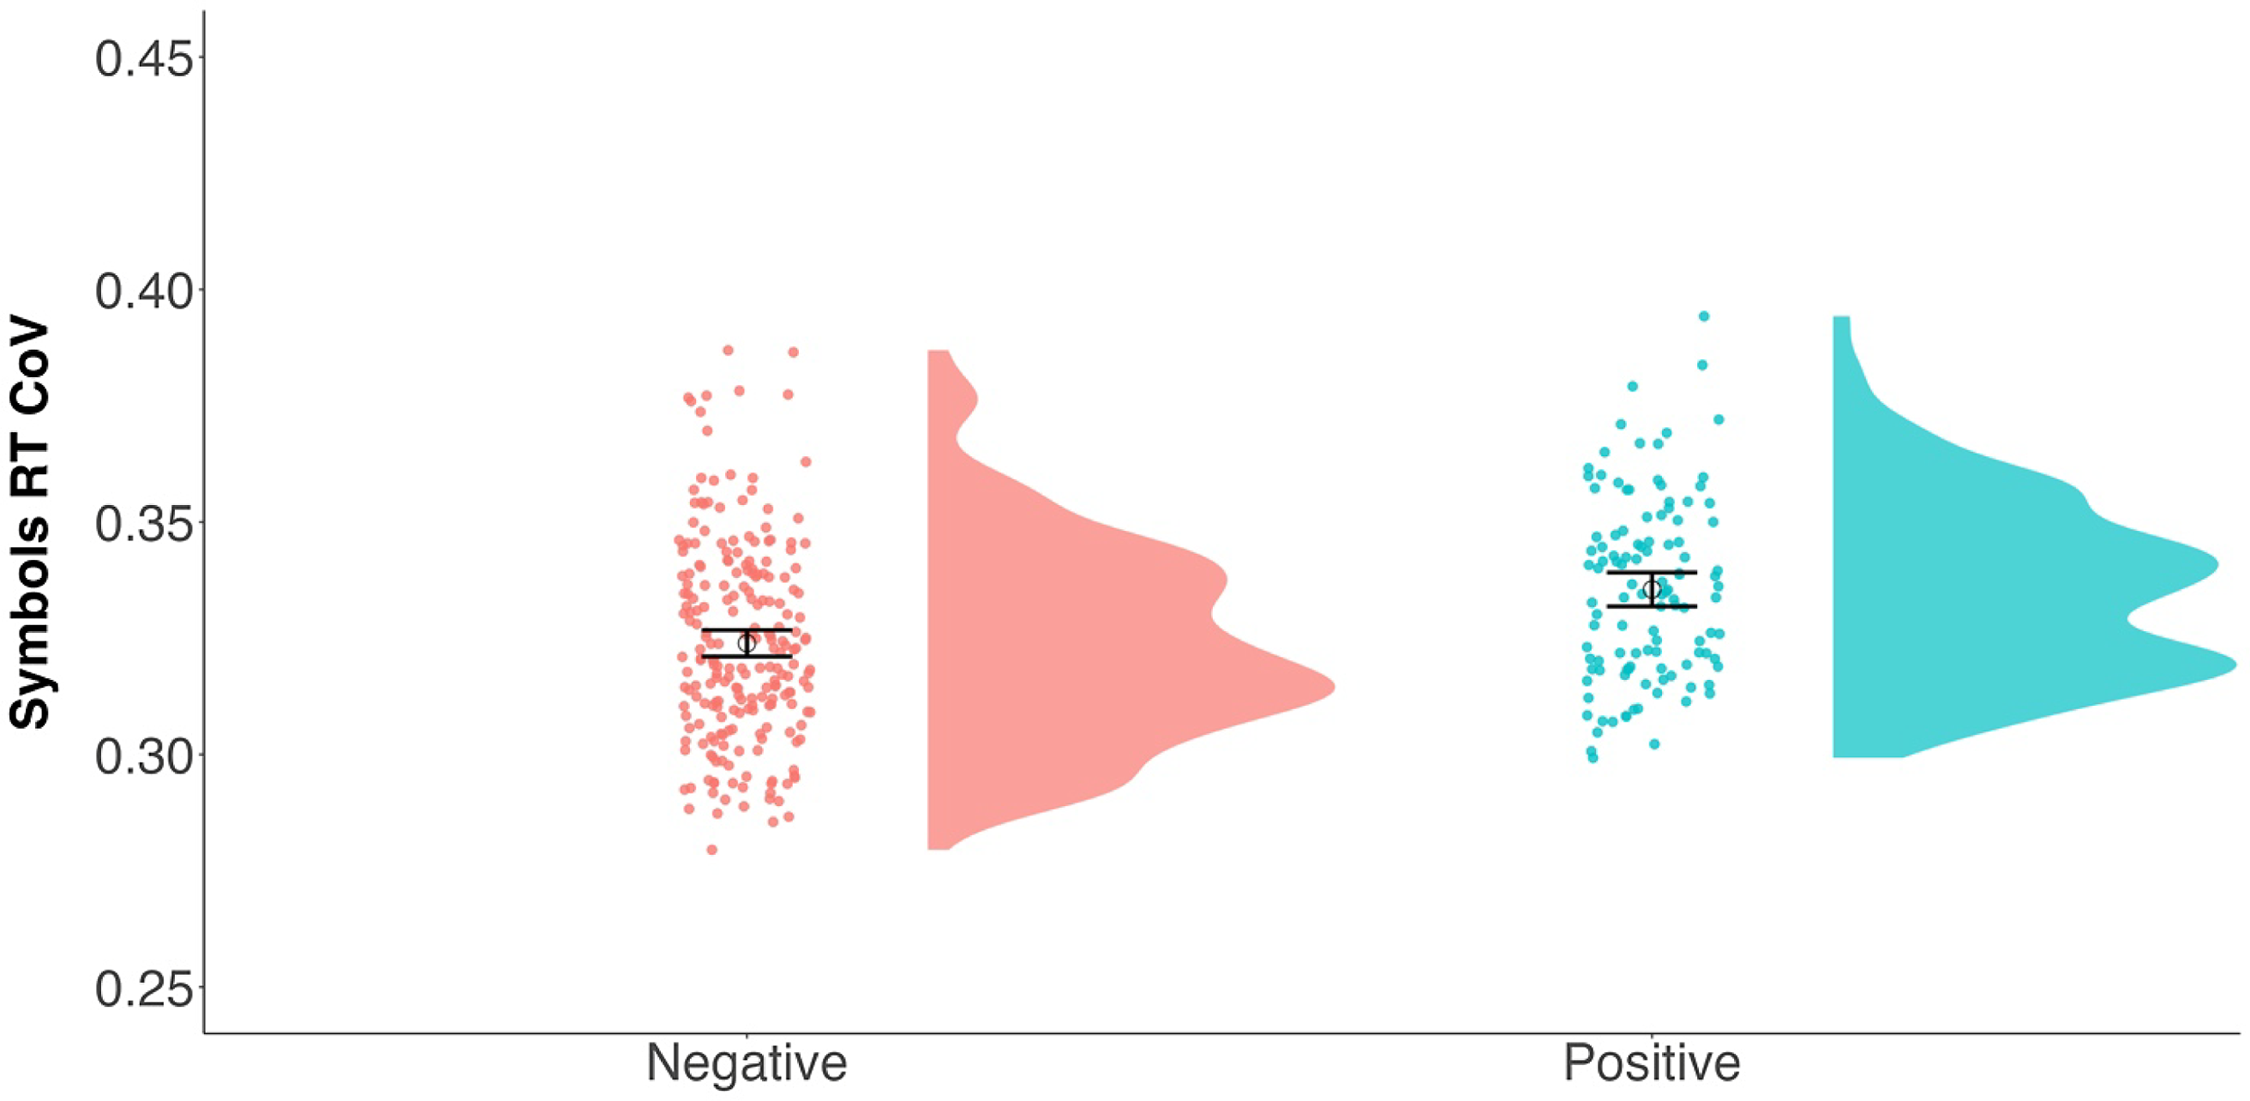
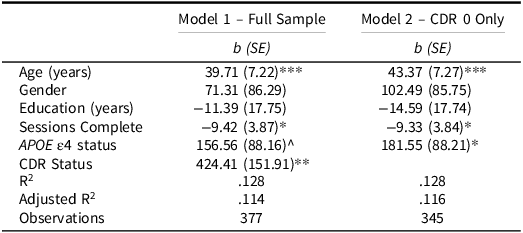
We next looked to see if this APOE ε4 effect was apparent in a cognitively healthy sample of participants to examine a possible sensitive preclinical signal. As seen in Table 4, when restricting the sample to only CDR 0 participants, APOE ε4 carriers showed greater RT CoV compared to noncarriers (see Fig. 4). Age also predicted RT CoV such that older participants had greater RT CoV. Thus, there appears to be a preclinical effect of APOE ε4 status on moment-to-moment consistency of attention.
Raincloud plots (Allen et al., Reference Allen, Poggiali, Whitaker, Marshall, van Langen and Kievit2019) depicting differences in RT CoV by APOE ε4 status. Individual dots represent participant values with the corresponding distribution. Open circles reflect the group means and the corresponding 95% confidence interval. APOE ε4 negative N = 228; APOE ε4 positive N = 117.
RMSSD as an alternative RT variability measure
As described earlier, we also attempted to provide converging evidence from a different measure of variability. To address this concern, we also calculated the RMSSD at each individual session and then averaged across these sessions for participant-level scores. We repeated the above regression analyses replacing RT CoV with RMSSD as the outcome to see if a different measure of variability would produce similar patterns.
The results of the RMSSD models are displayed in Table 5. In the full sample, RMSSD was related to age and the number of completed sessions. Critically, CDR status was again a significant predictor with CDR 0.5 participants showing increased variability (i.e., higher RMSSD) compared to cognitively healthy participants. Restricting this to only the CDR 0 participants, we again found the critical APOE ε4 effect. Specifically, APOE ε4 carriers showed greater variability (i.e., higher RMSSD values) compared to noncarriers. Thus, our main results were largely consistent across two different measures of variability.
Linear regressions predicting symbols RT RMSSD
APOE ε4 = Apolipoprotein ε4; CDR = Clinical Dementia Rating.
^ p = .077; * p < .05; ** p < .01; *** p < .001.
Evidence for convergent and discriminant validity of naturalistically assessed RT variability
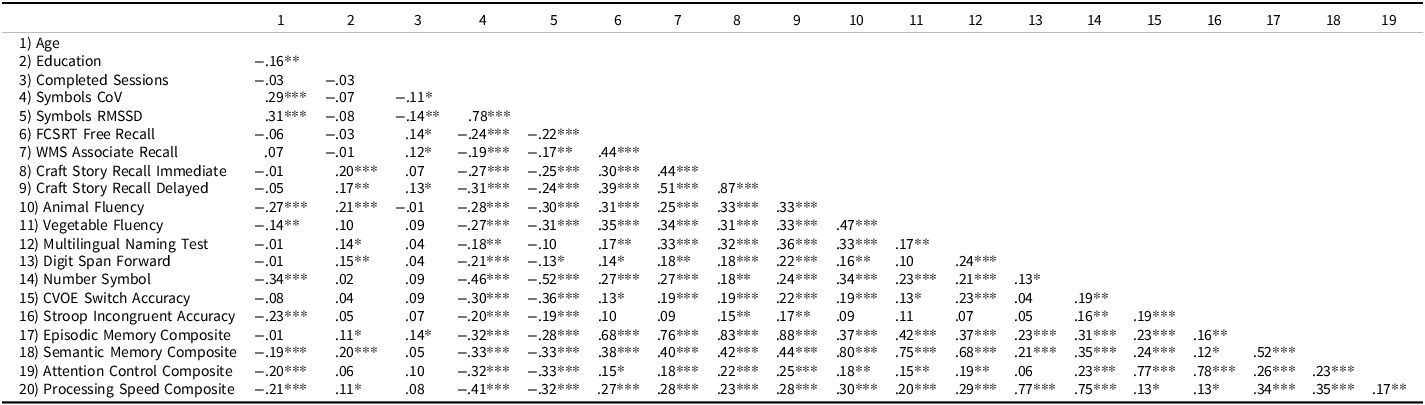
We next examined the correlations between the RT variability measures and several conventional cognitive measures to test if there was an association between the ability to successfully maintain moment-to-moment attention in naturalistic settings and various cognitive abilities (tested in a supervised clinic setting). The resulting correlation matrix is presented in Table 6. First, both measures of variability were strongly correlated with each other (r = .78). Thus, these two measures appear to be largely redundant with one another.
Correlation matrix of variables of interest for cognitively healthy (CDR = 0) participants
FCSRT = Free and Cued Selective Reminder Test.
* p < .05; ** p < .01; *** p < .001.
In terms of correlations with other cognitive variables, as expected, both measures of variability showed moderate correlations (based on Cohen’s 1988 framework) with the in-clinic cognitive composite measures. As expected, cognitively normal (CDR 0) participants who had greater variability in the ARC Symbols task had lower scores on the cognitive composites for episodic memory, semantic memory, attention control, and processing speed.
We next tested if part, or all, of the relationship between APOE ε4 status and in-clinic cognition could be explained by RT variability. Table 7 shows the resulting direct and indirect effects of several mediation models. In general, the results across both measures of RT variability were rather similar. Aside from episodic memory, all relationships between APOE ε4 status and the cognitive composites could be fully explained by RT variability. Specifically, APOE ε4 carriers exhibited greater variability which in turn predicted poorer cognitive composite scores. The only relationship that could not be fully explained was that of episodic memory. That is, there was still a direct effect of APOE ε4 status on episodic memory performance even after accounting for RT variability.
ß weights and bootstrapped 95% confidence intervals for APOE ε4–Cognitive relationship as mediated by RT variability measures
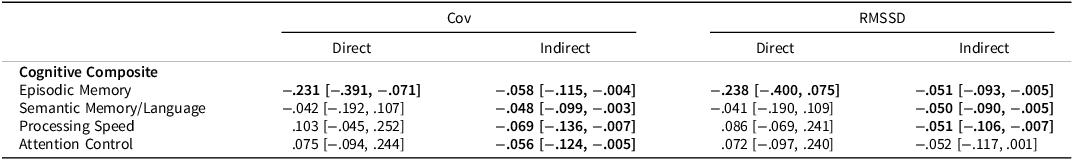
The direct effect represents the direct relationship between APOE ε4 status and the cognitive variable. The indirect effect represents the relationship between APOE ε4 status and cognitive variable, mediated by either RT variability measure. All models included covariates of age at ARC assessment, years of education, and gender. Significant effects are bolded.
Discussion
The current study examined variability in RTs using a novel smartphone application that measures cognition repeatedly in a variety of contexts in the participants natural environment over the course of 7 days. There were several key findings. First, RT variability can be reliably assessed using EMA approaches (and this was true across two different metrics of variability, CoV and RMSSD). Second, measures of RT variability appear sensitive to both clinical status (i.e., CDR status) and genetic disposition of AD (i.e., APOE ε4 status). Specifically, older adults who were already showing cognitive symptoms of AD had increased RT variability. Among cognitively normal participants, those at risk for AD also showed increased RT variability. Finally, measures of RT variability were correlated with conventional cognitive measures in theoretically meaningful ways and could largely explain the relationship between APOE ε4 status and conventional measures.
Can RT variability be reliably measured using EMA?
Our results suggest that variability in attention over the course of several seconds can be assessed using remote assessments across a variety of contexts and can leverage the strengths of EMA designs to obtain reliable estimates of RT variability. Between-person reliability estimates for both CoV and RMSSD surpassed traditional standards for “good” reliability of > .75 (Bruton et al., Reference Bruton, Conway and Holgate2000). Specifically, both RT CoV and RMSSD only required four tests (which collectively took no more than 4 minutes) to get reliability that exceeds an in-lab test of the same construct and would take more than four minutes to administer. Further, these two measures of variability were strongly correlated with one another suggesting some redundancy. Previous work has also suggested that CoV measures are not recommended as they confound changes in mean RT with changes in the standard deviation (e.g., Hultsch et al., 2011; Stawski et al., Reference Stawski, MacDonald, Brewster, Munoz, Cerino and Halliday2019). However, the results of the current study suggest there are largely similar patterns regardless of the RT variability metric used. Thus, the heightened reliability and strong correlation between the two measures could minimize concerns that CoV is a confounded measure of variability.
These measures of variability also do not appear to be susceptible to floor or ceiling effects. As displayed in Figures 2 and 3, there was substantial inter-individual variation in RT CoV (and this was also true for RMSSD). One discrepancy between the RT variability measures appeared in terms of improvement in these scores over time (i.e., practice effects). Specifically, RT CoV was not associated with the number of completed sessions (either in the full sample or in the CDR 0 subsample), while RMSSD was associated with completed sessions. Thus, at least in some cases, how RT variability is measured can produce slightly different results. When assessing trial-to-trial variability using EMA, though, RMSSD might not be a gold standard approach for assessing RT variability. RT CoV, on the other hand, might be a suitable measure for longitudinal assessments that avoids common pitfalls of conventional cognitive measures.
Is RT variability measured with EMA sensitive to AD risk factors?
Our measures of RT variability also showed consistent patterns regarding group differences. Specifically, CDR status predicted unique variance in RT CoV and RMSSD suggesting that individuals showing clinical symptoms of dementia had more difficulty maintaining moment-to-moment attention. These results replicate several studies using in-clinic measures to assess RT variability (e.g., Cherbuin et al., Reference Cherbuin, Sachdev and Anstey2010; Duchek et al., Reference Duchek, Balota, Tse, Holtzman, Fagan and Goate2009; Jackson et al., Reference Jackson, Balota, Duchek and Head2012; Tse et al., Reference Tse, Balota, Yap, Duchek and McCabe2010).
This effect of increased RT variability was also evident in cognitively normal individuals who carry a genetic risk for developing AD. Our results are consistent with previous work showing that genetic risk for AD (as defined as APOE ε4 status) is associated with increased performance variability within a task (e.g., Duchek et al., Reference Duchek, Balota, Tse, Holtzman, Fagan and Goate2009). As noted earlier, some studies have reported null effects of APOE ε4 status on RT variability measures when using more basic RT tasks. These studies tested participants using a more traditional “one-shot” assessment of cognition during a supervised clinic session. Such tasks may be too short to allow attention to fluctuate on a trial-to-trial basis. For example, Lu et al. (Reference Lu, Nicholas, James, Lane, Parker, Keshavan, Keuss, Buchanan, Murray‐Smith, Cash, Sudre, Malone, Coath, Wong, Henley, Fox, Richards, Schott and Crutch2020) noted that the choice RT task they used lasted less than three mins. In the current study, the total time to complete Symbols over the week was closer to 8–10 minutes. Thus, capturing variability using a more natural testing platform in ARC highlights the sensitivity of ARC testing.
How is EMA-assessed RT variability related to conventional cognitive measures?
Previous work has proposed that attentional processes might underly some of the declines in memory, and cognition more broadly, found in AD (e.g., Balota & Faust, Reference Balota and Faust2001). This suggests that individuals who are at risk, or even showing early signs of AD, might have cognitive issues partially because they have difficulty maintaining attention. The correlational, and, importantly, the mediation results of the current study appear to largely support this claim. RT variability accounted for significant variance in the relationship between APOE ε4 status and in-clinic cognition. The only relationship that was not fully accounted for by RT variability was episodic memory. Given how central episodic memory deficits are to AD, it is perhaps unsurprising that individuals at risk for AD showed poorer episodic memory even after accounting for attentional abilities.
One possible explanation for these results is that older adults who are at risk for developing AD (e.g., APOE ε4 carriers) might also be susceptible to, or in the early stages of, accumulation of abnormal levels of β-amyloid and phosphorylated tau, which might be contributing to larger memory impairments beyond the attentional contributions. If this is the case, then one might expect to see episodic memory impairments even after accounting for attentional ability. Although we could not adequately examine AD biomarkers in the current study (due to disruptions in biomarker collection brought on by the COVID-19 pandemic), future research should examine the link between AD biomarkers and RT variability measures assessed in EMA studies of cognition.
The results of the current study also align with recent work from our group examining the utility of RT variability in other repeated testing contexts. Aschenbrenner et al., (Reference Aschenbrenner, Welhaf, Hassenstab and Jackson2023) recently showed that over the course of 21 days of repeated testing, RT CoV in a go/no-go task was significantly correlated with n-back performance. Thus, brief, and repeated assessments, of attentional fluctuations represent a meaningful and reliable construct, is are related to cognitive performance in other domains.
Limitations
It is worth noting some limitations of the current study. First, an obvious limitation is that we used APOE ε4 status as a proxy for AD rather than measuring amyloid directly (although we did so in conjunction with CDR as a marker of AD severity which could be seen as a strength). Given that ARC testing started at the same time at the COVID-19 pandemic, collection of routine biomarker data was halted, and many participants may have outdated biomarker data which might lead to incorrect classification of AD status. Future work should also consider how biomarkers are related to naturalistic assessments of RT variability. Second, while we were able to find reliable differences in RT variability in a brief cognitive task, it is possible that 12 trials, which take roughly 20–40 s, might not fully capture differences in variability. Although some have identified attentional fluctuations in as little as 16 s (Esterman et al., Reference Esterman, Noonan, Rosenberg and DeGutis2013) future studies might consider increasing the number of trials to better capture moment-to-moment RT variability. As is typical of studies of AD, Knight ADRC participants are typically highly educated and primarily White older adults with high motivation and willingness to engage in studies. Our results might not generalize to a more diverse population where different contextual and environmental factors might make maintaining consistent attention difficult. The Knight ADRC is making continued efforts to connect with more participants from underrepresented groups in the St Louis metropolitan and surrounding areas. It is our hope that through these efforts we will be better able to make more generalizable conclusions from our studies in the future.
Conclusions
This study extends previous findings that trial-to-trial RT variability is sensitive to AD risk factors by assessing variability using EMA methods, rather than in the constraints of a lab. RT variability differences we evident between cognitively normal participants and participants with very mild dementia. Within the cognitively normal participants, increased RT variability was associated with APOE ε4 status, such that carriers showed increased variability compared to noncarriers. Finally, measures of naturalistic RT variability were moderately correlated with conventional cognitive tests and could, in most cases, fully explain the relationship between APOE ε4 and cognition. This study highlights the utility of using brief, remote, cognitive testing to measure subtle variations in attention during everyday life.
Funding statement
MSW was supported by a National Institute on Aging T32 Training Grant (AG000030-47). AJA was supported by the NIA under award number (K01AG071847).
This project was supported by National Institute on Aging grants R01AG057840, P30AG066444, P01AG026276, and P01AG003991.
Competing interests
None.


 Open access