

Mg acts as a cofactor of numerous enzymes and plays an essential role in a wide range of fundamental cellular reactions. Epidemiological studies indicate that a low Mg status is associated with various pathological conditions such as atherosclerosis, asthma, hypertension, osteoporosis, diabetes mellitus, obesity, and colon and breast cancers( Reference Ueshima 1 – Reference de Baaij, Hoenderop and Bindels 3 ). An experimental Mg deficiency has also been shown to induce a wide variety of disorders including systemic inflammation and oxidative stress, hyperlipidaemia and morphological changes in skeletal muscle( Reference Heggtveit 4 – Reference Mazur, Maier and Rock 6 ).
The liver is one of the organs most affected by Mg deficiency; it induces oxidative stress, apoptosis, changes in glucose metabolism, and increases in TAG and total cholesterol concentrations in the liver( Reference Vormann, Günther and Höllriegl 7 – Reference Barfell, Crumbly and Romani 10 ). Mast cell infiltration into the liver was found to be stimulated by Mg deficiency( Reference Takemoto, Yamamoto and Tomonaga 11 ). Furthermore, a metallomic analysis, which comprehensively reveals mineral content( Reference Fujimura, Terachi and Funaba 12 ), showed the modulation of several minerals in the liver of Mg-deficient rats( Reference Kim, Ishizaki and Iguchi 13 ). These findings suggest that Mg status also affects the metabolism of other minerals. Although some of the alterations in individual phenomena resulting from Mg deficiency are well characterised, an integrated understanding of aberrant metabolic regulation has yet to be obtained. No information is currently available about the actual metabolite content in the liver of rats fed a Mg-deficient diet. As the metabolite content reflects the net results of responses to Mg deficiency, it may provide an insight into the metabolic disturbances induced in the liver. The objective of this study was to clarify the effects of Mg deficiency on metabolite content in the rat liver.
Methods
Animals and diets
A total of twelve, 4-week-old, male Sprague–Dawley rats were purchased from Japan SLC and cared for according to the Guide for the Care and Use of Laboratory Animals (Animal Care Committee, Kyoto University). The protocols for the animal feeding and handling experiments were approved by the Committee (no. 27-43-2). The rats were individually housed in stainless-steel cages in a temperature-, humidity- and light-controlled room (24°C, 60 % and 12 h light–12 h dark cycle, respectively). All rats were fed a control diet (American Institute of Nutrition (AIN)-93G diet( Reference Reeves 14 )) for a 5-d adaptation period, followed by feeding of either a control or a Mg-deficient diet (AIN-93G-based diet with a Mg-free mineral mixture). Mg content in the control diet and Mg-deficient diet was determined to be 498 and 46 mg/kg, respectively. Rats were allowed free access to their respective experimental diets and demineralised water for 8 weeks. After the feeding trial, rats were killed by blood collection from the abdominal aorta under isoflurane anaesthesia, and the liver was dissected. Heparinised plasma samples were obtained from blood by centrifugation at 1600 g at 4°C for 15 min and were maintained at −20°C for later analyses. Liver samples were stored at −80°C after quick-freezing under liquid N2 until analysed.
Measurement of magnesium in the diet, plasma and femur
The left femur was removed, cleaned of adhering tissues and weighed. Femur, plasma and diet samples were wet-digested with trace element-grade nitric acid and hydrogen peroxide (Wako). After appropriate dilution with 0·1 mol/l hydrochloric acid and addition of strontium chloride for atomic absorption spectrophotometry (Wako) at a final strontium concentration of 5 g/l, the concentration of Mg in the digested samples was determined by atomic absorption spectrophotometer (AA-6600F; Shimadzu) with a standard solution of Mg (Mg 1000; Wako). Procedural accuracy of the Mg analysis was evaluated by spiking AIN-93G and plasma samples with the respective standard solution: recovery for Mg was 98·7 and 98·1 %, respectively, and the CV was 1·98 and 0·84 %, respectively.
Metabolomic analysis
A liver metabolomic analysis was performed using GC/MS as described previously( Reference Qiao, Tomonaga and Matsui 15 ) with some modifications. In brief, freeze-fractured liver samples (approximately 20 mg) were suspended in 250 μl of methanol–chloroform–water (2·5:1:1) and 5 μl of 1 mg/ml 2-isopropylmalic acid as an internal standard and homogenised using a polytron homogeniser (Microtec; China). Samples were subsequently mixed in a shaker at 1200 rpm at 37°C for 30 min and centrifuged at 16 000 g at 4°C for 5 min. Next, 160 μl of the supernatant was mixed with 200 μl of distilled water and vortexed, followed by centrifugation at 16 000 g at 4°C for 5 min; subsequently, 250 μl of the supernatant was dried under a vacuum using a centrifugal evaporator (RD-400; Yamato Scientific). Dried samples were pre-treated, derivatised and analysed by GC/MS (GCMS QP2010-Ultra; Shimadzu) within 24 h of derivatisation as described by Qiao et al.( Reference Qiao, Tomonaga and Matsui 15 ). The Shimadzu Smart Metabolites Database (Shimadzu) was used to identify metabolites. The DNA content in the liver was analysed using the method by Labarca & Paigen( Reference Labarca and Paigen 16 ). The relative metabolite content was calculated as follows: the peak area of each metabolite was divided by that of the internal standard, 2-isopropylmalic acid, on the same chromatogram. It was further divided by the DNA content. The level for each metabolite in the control liver was set at 100.
Pathway analyses
Pathways affected by Mg deficiency were detected using MetaboAnalyst( Reference Xia and Wishart 17 ); metabolites that differed in contents significantly between the two groups were subjected to an enrichment analysis (http://www.metaboanalyst.ca/faces/docs/Tutorial.xhtml, accessed July 2016).
RNA isolation and real-time-quantitative PCR
Total RNA isolation, complementary DNA synthesis and real-time RT-quantitative PCR (RT-qPCR) were conducted as described by Asano et al.(
Reference Asano, Yamada and Hashimoto
18
). The oligonucleotide primers for RT-qPCR are presented in the online Supplementary Table S1. The C
t
value was determined, and the abundance of transcripts of genes of interest was analysed by the
 $$^{{\Delta \Delta C_{t} }} $$
method using the C
t
value of lactate dehydrogenase or hypoxanthine phosphoribosyltransferase 1 (Hprt1) as the reference gene(
Reference Duran, Shapshak and Worley
19
). The expressions of these reference genes were stable in the livers of rats with impaired glucose metabolism, suggesting the usefulness as reference genes in RT-qPCR analysis(
Reference Hernández, Curi and Salazar
20
).
$$^{{\Delta \Delta C_{t} }} $$
method using the C
t
value of lactate dehydrogenase or hypoxanthine phosphoribosyltransferase 1 (Hprt1) as the reference gene(
Reference Duran, Shapshak and Worley
19
). The expressions of these reference genes were stable in the livers of rats with impaired glucose metabolism, suggesting the usefulness as reference genes in RT-qPCR analysis(
Reference Hernández, Curi and Salazar
20
).
Statistical analyses
Data are expressed as means with their standard errors. Differences between treatments were examined by non-parametric Mann–Whitney U test. P<0·05 was considered significant.
Results
Magnesium deficiency increases hepatic levels of taurine, hypotaurine, glycine, serine and threonine
Only one rat fed the control diet exhibited severe fatty liver at the end of the study, which was shown by appearance and histology stained with haematoxylin–eosin (data not shown). We judged that this rat was neither clinically normal nor appropriate as a control rat, and, as such, the sample from that rat was not analysed. The Mg concentrations in plasma and bone were significantly lower in rats fed the Mg-deficient diet than in those fed the control diet (Table 1).
Effects of magnesium deficiency on plasma and femur concentrations of magnesium (Mean values with their standard errors; n 5, control; n 6, magnesium deficiency)
** P<0·01 v. control group.
Metabolomic analyses identified 105 metabolites in the rat liver. Among them, three metabolites (anthranilic acid, creatinine and thymine) were detected in livers of rats fed the Mg-deficient diet only (data not shown); all these metabolites were detected in the livers of all Mg-deficient rats, whereas corresponding peaks of these metabolites were not observed or traces in the livers of all control rats were observed. A total of eighteen metabolites were significantly higher in the Mg-deficient group than in the control group, whereas fifteen metabolites were lower in the Mg-deficient group.
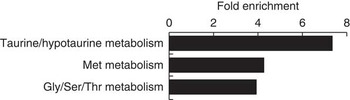
The MetaboAnalyst analysis indicated that taurine (TAU)/hypotaurine (HYP) metabolism, methionine metabolism and glycine/serine/threonine metabolism were affected in the livers of Mg-deficient rats (Fig. 1). These three pathways are interrelated as shown in the online Supplementary Fig. S1. The levels of the metabolites determined to be involved in these metabolic pathways, except for pyruvic acid, are shown in Fig. 3(a), and free amino acids are shown in Fig. 2(a). Feeding the Mg-deficient diet significantly increased hepatic TAU, HYP, glycine, serine and threonine contents, whereas it decreased the levels of 5'-methylthioadenosine (MTAD) and 2-ketobutyric acid (2-KBA). In addition, the level of putrescine (PUT) was slightly lower in the Mg-deficient group than in the control group. The levels of three metabolites were also numerically different between the groups (>35 %), but not statistically significant: glutamic acid content and phenylalanine content were higher in the Mg-deficient group, whereas N-methylglycine content was lower.
Metabolic pathways affected in the liver of rats fed the magnesium-deficient diet. Significantly different hepatic metabolite content between the control group and the magnesium-deficient group is subjected to the enrichment analysis of MetaboAnalyst. Metabolic pathways significantly affected by magnesium deficiency and their fold-enrichment are shown.
Relative content of taurine (TAU), hypotaurine (HYP), free amino acids, N-methylglycine (NMG), putrescine (PUT), 5'-methylthioadenosine (MTAD) and 2-ketobutyric acid (2-KBA) as well as the expression levels of enzymes related to amino acid metabolism in the liver of rats fed the control diet (
![]() ) or the magnesium-deficient (
) or the magnesium-deficient (
![]() ) diet. Rats were fed the control diet (n 5) or magnesium-deficient diet (n 6) for 8 weeks. (a) Metabolites in the liver were analysed by metabolomic analysis. The peak area of the metabolite was divided by that of 2-isopropylmalic acid, an internal control and DNA content. Metabolite content in the control group was set to 100. Relative levels for TAU, HYP, free amino acids, NMG, PUT, MTAD and 2-KBA acid are shown. Values are means, with their standard errors. * P<0·05 and ** P<0·01, respectively, v. the control group. (b) Gene transcription levels of hepatic enzymes involved in TAU and HYP metabolism, methionine (Met) metabolism, and glycine (Gly), serine (Ser) and threonine (Thr) metabolisms were measured by real-time-quantitative PCR. Gene expression was normalised against lactate dehydrogenase expression, and expression levels in the control group were set to 100. Values are means, with their standard errors. * P<0·05 v. the control group. Ala, alanine; Asp, aspartic acid; Glu, glutamic acid; Gln, glutamine; Phe, phenylalanine; Pro, proline; Tyr, tyrosine; Val, valine; Cdo1, cysteine dioxygenase type 1; Csad, cysteine sulfinic acid decarboxylase; Mat1a, methionine adenosyltransferase Iα; Mat2a, methionine adenosyltransferase IIα; Mat2b, methionine adenosyltransferase IIβ; Gnmt, glycine N-methyltransferase; Sardh, sarcosine dehydrogenase; Amd1, adenosylmethionine decarboxylase; Srm, spermidine synthase; Sat1, spermidine/spermine N
1-acetyltransferase 1; Sds, serine dehydratase.
) diet. Rats were fed the control diet (n 5) or magnesium-deficient diet (n 6) for 8 weeks. (a) Metabolites in the liver were analysed by metabolomic analysis. The peak area of the metabolite was divided by that of 2-isopropylmalic acid, an internal control and DNA content. Metabolite content in the control group was set to 100. Relative levels for TAU, HYP, free amino acids, NMG, PUT, MTAD and 2-KBA acid are shown. Values are means, with their standard errors. * P<0·05 and ** P<0·01, respectively, v. the control group. (b) Gene transcription levels of hepatic enzymes involved in TAU and HYP metabolism, methionine (Met) metabolism, and glycine (Gly), serine (Ser) and threonine (Thr) metabolisms were measured by real-time-quantitative PCR. Gene expression was normalised against lactate dehydrogenase expression, and expression levels in the control group were set to 100. Values are means, with their standard errors. * P<0·05 v. the control group. Ala, alanine; Asp, aspartic acid; Glu, glutamic acid; Gln, glutamine; Phe, phenylalanine; Pro, proline; Tyr, tyrosine; Val, valine; Cdo1, cysteine dioxygenase type 1; Csad, cysteine sulfinic acid decarboxylase; Mat1a, methionine adenosyltransferase Iα; Mat2a, methionine adenosyltransferase IIα; Mat2b, methionine adenosyltransferase IIβ; Gnmt, glycine N-methyltransferase; Sardh, sarcosine dehydrogenase; Amd1, adenosylmethionine decarboxylase; Srm, spermidine synthase; Sat1, spermidine/spermine N
1-acetyltransferase 1; Sds, serine dehydratase.

We also measured the mRNA levels of some of the enzymes involved in metabolic pathways (Fig. 2(b)), but found no significant effects from the Mg-deficient diet, except for the expression of spermidine/spermine N 1-acetyltransferase 1 (Sat1), which catalyses the acetylation of spermidine/spermine to produce N 1-acetylspermidine/spermine (online Supplementary Fig. S1). Sat1 expression was significantly higher in the Mg-deficient group. Similar changes were detected when Hprt1 was used as a reference gene (online Supplementary Fig. S2).
Magnesium deficiency affects the hepatic metabolite content from glycolysis/gluconeogenesis, the pentose phosphate pathway and the citric acid cycle
Fig. 3(a) shows the relative metabolite levels in glycolysis/gluconeogenesis, the pentose phosphate pathway and citric acid cycle in the livers of rats fed the Mg-deficient diet. Four metabolites, that is, glucose 6-phosphate (G6P), citric acid, fumaric acid and malic acid, among the fourteen metabolites detected by the metabolomic analysis were significantly decreased by Mg deficiency. In addition, the hepatic contents of fructose 6-phosphate and succinic acid were numerically lower in the Mg-deficient group than in the control group, but were not statistically significant. In contrast, differences in the hepatic content of sedoheptulose 7-phosphate, phosphoenolpyruvic acid, pyruvic acid, aconitic acid and oxaloacetic acid between the dietary groups were within 20 %.
Relative metabolite content from glycolysis/gluconeogenesis, the citric acid cycle and pentose phosphate pathway, and expression levels of enzymes related to glycolysis/gluconeogenesis and the pentose phosphate pathway in the liver of rats fed the control diet (
![]() ) or the magnesium-deficient diet (
) or the magnesium-deficient diet (
![]() ). Rats were fed the control diet (n 5) or the magnesium-deficient diet (n 6) for 8 weeks. (a) Metabolites in the liver were analysed by a metabolomic analysis. The peak area of the metabolite was divided by that of 2-isopropylmalic acid, an internal control and DNA content. Metabolite content in the control group was set to 100. The relative metabolite contents from glycolysis/gluconeogenesis and the citric acid cycle are shown. Values are means, with their standard errors. * P<0·05 v. the control group. (b) Gene transcription levels of hepatic enzymes catalysing glycolysis/gluconeogenesis and the pentose phosphate pathway were measured by real-time-quantitative PCR. Gene expression was normalised against lactate dehydrogenase expression, and expression levels in the control group were set to 100. Values are means, with their standard errors. G6P, glucose 6-phosphate; 6PGA, 6-phosphogluconic acid; S7P, sedoheptulose 7-phosphate; F6P, fructose 6-phosphate; 3PG, 3-phosphoglyceric acid; PEP, phosphoenolpyruvic acid; PYR, pyruvic acid; CIT, citric acid; ACO, aconitic acid; 2KG, 2-ketoglutaric acid; SUC, succinic acid; FUM, fumaric acid; MAL, malic acid; OAA, oxaloacetic acid; Gck, glucokinase; G6p, glucose 6-phosphatase; G6pd, glucose 6-phosphate dehydrogenase; Pck1, phosphoenolpyruvate carboxykinase 1.
). Rats were fed the control diet (n 5) or the magnesium-deficient diet (n 6) for 8 weeks. (a) Metabolites in the liver were analysed by a metabolomic analysis. The peak area of the metabolite was divided by that of 2-isopropylmalic acid, an internal control and DNA content. Metabolite content in the control group was set to 100. The relative metabolite contents from glycolysis/gluconeogenesis and the citric acid cycle are shown. Values are means, with their standard errors. * P<0·05 v. the control group. (b) Gene transcription levels of hepatic enzymes catalysing glycolysis/gluconeogenesis and the pentose phosphate pathway were measured by real-time-quantitative PCR. Gene expression was normalised against lactate dehydrogenase expression, and expression levels in the control group were set to 100. Values are means, with their standard errors. G6P, glucose 6-phosphate; 6PGA, 6-phosphogluconic acid; S7P, sedoheptulose 7-phosphate; F6P, fructose 6-phosphate; 3PG, 3-phosphoglyceric acid; PEP, phosphoenolpyruvic acid; PYR, pyruvic acid; CIT, citric acid; ACO, aconitic acid; 2KG, 2-ketoglutaric acid; SUC, succinic acid; FUM, fumaric acid; MAL, malic acid; OAA, oxaloacetic acid; Gck, glucokinase; G6p, glucose 6-phosphatase; G6pd, glucose 6-phosphate dehydrogenase; Pck1, phosphoenolpyruvate carboxykinase 1.

We further measured the mRNA levels of glucokinase (Gck), glucose 6-phosphatase (G6p), glucose 6-phosphate dehydrogenase (G6pd) and phosphoenolpyruvate carboxykinase 1 (Pck1) in the livers of Mg-deficient rats (Fig. 3(b)); G6p, G6pd and Pck1 catalyse the reaction of G6P to glucose, G6P to 6-phosphogluconolacton, and oxaloacetic acid to phosphoenolpyruvic acid, respectively. The expression levels of Gck, G6p, G6pd and Pck1 were not significantly different between the groups; comparable results were obtained when gene expression was normalised against Hprt1 expression (online Supplementary Fig. S2).
The hepatic content for the other twenty-two and forty-eight metabolites, which were significantly different or not significantly different between the groups, is presented in the online Supplementary Fig. S3 and S4, respectively.
Discussion
Main findings
The present study explored metabolite content in the liver of rats fed a Mg-deficient diet. Consistent with previous findings( Reference Vormann, Günther and Höllriegl 7 , Reference Kimura and Yokoi 21 , Reference Sanchez-Morito, Planells and Aranda 22 ), plasma and bone Mg levels were decreased by a Mg-deficient diet, indicating Mg deficiency in rats. The results analysed by a metabolomic analysis revealed that (1) Mg deficiency induced the accumulation of TAU and its precursor HYP, (2) in addition to TAU/HYP metabolism, the Mg deficiency unexpectedly affected the levels of metabolites involved in methionine metabolism and glycine/serine/threonine metabolism, and (3) the metabolite content related to glucose metabolism was altered by the Mg deficiency. These results suggest that Mg deficiency causes disturbance in some metabolic pathways such as amino acid and glucose metabolism in the liver.
Methionine and glycine/serine/threonine metabolism
Methionine is converted to S-adenosylmethionine, the methyl group of which is transferred in numerous reactions to produce S-adenosylhomocysteine (SAH). SAH is subsequently cleaved to adenosine and homocysteine; the latter is converted either to methionine cycle or to cystathionine (CYSTA). CYSTA is cleaved to cysteine and 2-KBA, which are further metabolised to TAU and succinyl-CoA, a citric acid cycle metabolite, respectively (online Supplementary Fig. S1). The hepatic TAU and HYP contents were increased in Mg-deficient rats, whereas 2-KBA content was decreased. These results suggest that CYSTA is preferentially metabolised to cysteine rather than 2-KBA. 2-KBA is also produced through the catabolism of glycine/serine/threonine; the hepatic contents of glycine/serine/threonine were all increased by the Mg deficiency. Therefore, Mg deficiency may have depressed the production of 2-KBA from the catabolic pathway of these amino acids. However, serine dehydratase (Sds) expression level was comparable between the two groups. Enzyme activity is regulated through allosteric regulation as well as the expression level of the enzyme itself. It may be regulated through allosteric regulation of Sds activity.
Taurine/hypotaurine metabolism
The serum and muscle concentrations of TAU were increased in Mg-deficient rats, and this may be linked to the Mg deficiency-induced disorganisation of the sarcoplasmic reticulum( Reference Robeson, Martin and Friedman 23 ). A previous study also showed that Mg deficiency induced hepatic accumulation of TAU( Reference Watkins and Martin 24 ); however, its biological significance has not yet been discussed. In view of the increase observed in hepatic HYP and TAU contents due to Mg deficiency, the synthesis of TAU may be stimulated in the livers of Mg-deficient rats. TAU is involved in the regulation of diverse (patho)physiological processes including the maintenance of cell membranes and cell volume, the effective translation of mitochondrial proteins, antioxidative defences and reduced apoptosis( Reference Lambert, Kristensen and Holm 25 ). The hepatic accumulation of TAU may reflect a defensive reaction to Mg-deficiency-induced metabolic disturbances.
Polyamine metabolism
The propyl amino group of S-adenosylmethioninamine is transferred to PUT in order to synthesise spermidine (SPM). MTAD is formed during this reaction (online Supplementary Fig. S1). Hepatic MTAD and PUT levels were significantly and slightly decreased by Mg deficiency, respectively (Fig. 3(a)). This result suggests that the SPM/spermine hepatic content is also lower in Mg-deficient rats than in control rats. Furthermore, the hepatic expression of Sat1, a rate-limiting enzyme in the breakdown of SPM/spermine and an enzyme regulated by its expression level( Reference Casero and Pegg 26 , Reference Pegg 27 ), was significantly increased by Mg deficiency. Therefore, further decreases in SPM/spermine are possible. In view of the requirement of SPM for liver regeneration( Reference Alhonen, Räsänen and Sinervirta 28 ), decreased SPM may be involved in chronic liver damage induced by Mg deficiency( Reference Martin, Uring-Lambert and Adrian 9 ).
Glucose metabolism
The present study showed decreases in G6P hepatic content owing to Mg deficiency. Previous studies have shown that the expression and activity of enzymes involved in gluconeogenesis and the pentose phosphate pathway are altered by Mg status( Reference Barfell, Crumbly and Romani 10 , Reference McNeill, Herbein and Ritchey 29 – Reference Voma, Barfell and Croniger 31 ). In addition, the expression level of Gck, which produces G6P from glucose, is altered by modulations in glucose metabolism( Reference Yamada, Kawata and Shou 32 ). However, the expression levels of hepatic enzymes, which catalyse the reaction to produce (Gck) or metabolise (G6p and G6pd) G6P, were not changed by Mg deficiency in this study; previous studies have shown that the hepatic activity of G6p is enhanced in Mg-deficient rats( Reference Barfell, Crumbly and Romani 10 ), and that the activity of G6pd was also increased in HepG2 cells cultured in Mg-deficient medium( Reference Voma, Barfell and Croniger 31 ). Increases in the activities of G6p and G6pd are suggested to reduce G6P in the livers of Mg-deficient rats. Metabolic pathways may be modulated through allosteric regulation rather than the regulation of enzyme expression levels in the livers of Mg-deficient rats.
An adaptation to the Mg-deficiency-induced aberration of metabolism may also explain why the ingestion of the Mg-deficient diet for 8 weeks did not affect the expression level of hepatic Pck1 in the present study. A previous study revealed that the mRNA level of hepatic Pck1 in rats fed a Mg-deficient diet for 2 weeks was only 7 % of that in control rats( Reference Takaya, Iharada and Okihana 30 ). Differential responses to Mg deficiency depending on the feeding period of a Mg-deficient diet have been reported( Reference Kotani, Kim and Ishizaki 33 ).
The present study revealed that metabolite contents from the citric acid cycle such as citric acid, fumaric acid and malic acid were significantly decreased in the liver of Mg-deficient rats, and that of succinic acid was numerically decreased by the Mg deficiency. We speculate that these results relate to those of a study showing a decrease in the number of mitochondria in hepatocytes from Mg-deficient rats( Reference George and Heaton 34 ); the relationship between the cellular content of metabolites from the citric acid cycle and the morphological number should be examined in future studies. In adipocytes, insulin has been shown to induce cellular accumulation of citric acid, succinic acid, fumaric acid and malic acid( Reference Qiao, Tomonaga and Matsui 15 ). Therefore, the modulated metabolite content may reflect insulin insensitivity. The livers of Mg-deficient rats may be relatively resistant to insulin signalling. Insulin-mediated glucose uptake in the liver was previously reported to be impaired in Mg-deficient rats, suggesting insulin resistance( Reference Chaudhary, Boparai and Bansal 35 ).
Implications and future directions
In the present study, we propose that Mg deficiency modulated hepatic metabolism of some amino acids and glucose. These results provide an insight into the mechanisms underlying the diverse pathological features induced by Mg deficiency. In this study, all the metabolites in these pathways were not necessarily detected. Thus, the present results are fragmental in the evaluation of the complete pathways of metabolism. The present study was performed as the first step to understanding what metabolic pathways are affected by Mg deficiency; a metabolomic analysis enables metabolic pathways to be comprehensively evaluated. Future studies are needed in order to evaluate all the metabolites through the specific metabolic pathways that are affected by Mg deficiency.
Acknowledgements
This research received no specific grant from any funding agency or from commercial or not-for-profit sectors.
M. S., R. N. and T. M.: designed the study; M. S., R. N. and T. M.: performed the experiments; M. S., S. T., M. F. and T. M.: analysed the data and contributed to the interpretation of data; M. S. and M. F.: wrote the initial draft of the manuscript; M. S., S. T., M. F. and T. M.: contributed to critical review of the manuscript.
The authors declare that there are no conflicts of interest.
Supplementary material
For supplementary material/s referred to in this article, please visit http://dx.doi.org/doi:10.1017/S0007114516003676


