


Introduction
Protecting species with transboundary distributions is a significant conservation challenge (Lim, Reference Lim2016; Liu et al., Reference Liu, Yong, Choi and Gibson2020). Neighbouring countries often struggle to reach consensus regarding actions to address common conservation problems because of limited capacity or geopolitical and governance factors (Blair et al., Reference Blair, Le and Xu2022). Where biogeographical barriers coincide with political boundaries, a single country may contain the entire distribution of a threatened species. However, this is rarely the case for species with broad ecological niches or core habitats that extend beyond political borders (Liu et al., Reference Liu, Yong, Choi and Gibson2020; Mason et al., Reference Mason, Ward, Watson, Venter and Runting2020; Farhadinia et al., Reference Farhadinia, Rostro-García, Feng, Kamler, Spalton and Shevtsova2021). Where the ranges of threatened species cross international borders, effective conservation planning needs close coordination amongst managers, scientists and governmental authorities across all countries encompassing the species’ range (Blair et al., Reference Blair, Le and Xu2022). Such cooperation is essential to ensure that country-level actions align with broader regional conservation needs (Liu et al., Reference Liu, Yong, Choi and Gibson2020; Mason et al., Reference Mason, Ward, Watson, Venter and Runting2020).
International cooperation in planning and implementing transboundary conservation strategies makes a significant contribution to the global protection of threatened species and their habitats (Poufoun et al., Reference Poufoun, Abildtrup, Sonwa and Delacote2016; Kauffman et al., Reference Kauffman, ., Gagnacci, Chamaillé-Jammes, Hebblewhite, Hopcraft and Merkle2021). Although such initiatives often focus on particular, usually charismatic, target species (e.g. forest elephants Loxodonta cyclotis in Central Africa, Poufoun et al., Reference Poufoun, Abildtrup, Sonwa and Delacote2016; jaguars Panthera onca in the north-western Amazon, Mena et al., Reference Mena, Yagui, Tejeda, Cabrera, Pacheco-Esquivel, Rivero and Pastor2020), their actions usually prioritize protecting habitats, thus benefitting a multitude of other species sharing those ecosystems. Notably, these initiatives typically originate in and are carried out by transnational NGOs and conservationists from affluent countries that have the necessary funding to support international conservation endeavours (e.g. brown bears Ursus arctos in Europe, Mattsson et al., Reference Mattsson, Arih, Heurich, Santi, Štemberk and Vacik2019; rivers in Russia, China and Mongolia, Simonov et al., Reference Simonov, Nikitina and Egidarev2019). Initiatives led by experts from developing countries, where significant conservation threats often concentrate, are scarce (Titley et al., Reference Titley, Butchart, Joves, Whittingham and Willis2021).
Here we focus on the taruka Hippocamelus antisensis, a threatened deer species occurring in the Central Andes Ecoregion in South America. Taruka are confined to high-altitude ravines and gullies in Peru, Bolivia, northern Chile and north-western Argentina (Barrio, Reference Barrio2013). This deer is poorly known within the scientific community, with research and conservation efforts primarily focused on local populations, lacking regional coordination amongst specialists across range countries (Barrio, Reference Barrio2004; Rechberger et al., Reference Rechberger, Pacheco, Nuñez, Roldán, Martínez and Mendieta2014; Fuentes-Allende et al., Reference Fuentes-Allende, Vielma, Paulsen, Arredondo, Corti, Estades and González2016). International conservation of this species is hampered by a number of factors. The taruka is not widely known amongst the public, and there is little awareness of the need for its protection. Countries have not allocated funding for its conservation, and there is no established trading market that needs regulation (CITES, 2023). In addition, no information is available on the migratory or seasonal movements of the taruka (CMS, 1979). Although the IUCN Red List categorizes the taruka as Vulnerable globally (Barrio et al., Reference Barrio, Nuñez, Pacheco, Regidor and Fuentes-Allende2017), at the country level it is listed as Endangered in Argentina (Guerra & Pastore, Reference Guerra and Pastore2019), Bolivia (MMAyA, 2009) and Chile (RCE, 2007), but as Vulnerable in Peru (Barrio, Reference Barrio2018). Since 2016, collaborative efforts involving managers, researchers and governmental authorities from the four countries have explored ways to enhance taruka conservation throughout its distribution range. Here we present the outcomes of this first international endeavour aimed at the taruka, in which we modelled its current distribution range using sightings from the four range countries, compared model predictions with the technical and scientific knowledge of local researchers, wildlife managers and conservationists, assessed the proportion of the species’ distribution that is protected and discussed the threats and challenges that its conservation faces. We particularly highlight the importance of incorporating local knowledge from communities, researchers and conservationists in regional evaluations. Our primary aim was to identify areas with suitable conditions for the species, to guide stakeholders on where to focus monitoring and conservation efforts. We hope to motivate researchers and managers from the Southern Hemisphere to actively engage in international collaborations and contribute to the scientific information that underpins global conservation efforts.
Study area
The study area includes the Central Andes Ecoregion across the four taruka range countries (5–30°S, 65–80°W; Griffith et al., Reference Griffith, Omernik and Azevedo1998; Barrio, Reference Barrio2013; Fig. 1a). We considered the minimum elevation at which the taruka is likely to occur to be 1,800 m. Although the species has been observed at lower altitudes, such records are rare (Barrio, Reference Barrio2013; Mata et al., Reference Mata, Fuentes-Allende, Malo, Vielma and González2019). The study area encompasses the Central High Andes/Puna (Peru, Bolivia, Chile, Argentina), the Altiplano (Peru, Bolivia), the Yungas (Peru, Bolivia, Argentina) and the Sechura/Atacama deserts (Peru, Chile; Griffith et al., Reference Griffith, Omernik and Azevedo1998). The vegetation in these areas is characterized by montane grasslands, and xeric and montane shrublands (Olson et al., Reference Olson, Dinerstein, Wikramanayake, Burgess, Powell and Underwood2001). The seasonal precipitation regime features a long dry season, usually during April–November, followed by a short rainy season during December–March. According to the Köppen climatic classification the study area falls within the Arid, the Temperate, and the Polar climates (Peel et al., Reference Peel, Finlayson and McMahon2007).
Study area in South America, showing (a) historical and more recent (1972–2022) records of the taruka Hippocamelus antisensis and (b) the overlapped predictions of its distribution according to the MERRA–BIO models. Stars indicate the areas where collaborators disagreed with model predictions. (Readers of the printed journal are referred to the online article for a colour version of this figure.)

Methods
Incorporating knowledge from taruka researchers
We obtained information and local knowledge from researchers, managers, environmental authorities and conservationists from the four taruka range countries through formal and informal meetings, workshops and unstructured personal interviews, during 2016–2023 (Newing, Reference Newing2011). The need to model the species’ distribution in South America was first identified in 2016, during assessment of its conservation status for the IUCN Red List (Barrio et al., Reference Barrio, Nuñez, Pacheco, Regidor and Fuentes-Allende2017). In 2018, Bolivian collaborators organized a symposium on taruka conservation in South America (IV Latin American Congress of Mammalogy, 10–13 July, La Paz, Bolivia). Experts from the four range countries met and defined the short-, medium- and long-term goals for protecting this species in the region, and the steps needed to achieve international collaboration. Subsequently, we held periodic virtual meetings in which we shared taruka sightings and field information from our personal records and the available literature (including both peer reviewed and grey literature), discussed model construction, checked the quality of preliminary and final model predictions and discussed the current and future challenges facing taruka conservation in the region.
Building species distribution models
We used MaxEnt 3.3.3.k (Phillips et al., Reference Phillips, Anderson and Schapire2006), following the methodology outlined in Mata et al. (Reference Mata, Fuentes-Allende, Malo, Vielma and González2019), to construct species distribution models for the taruka. We based these models on taruka sightings and environmental variables and developed them at a spatial resolution of 1 km2 (Fourcade et al., Reference Fourcade, Engler, Rödder and Secondi2014). We collated 1,280 taruka locations, comprising 33 historical and archaeological reports and 1,247 sightings reported within the last 50 years (1972–2022), with 63% of these from the last 10 years (Fig. 1a). We used data from the last 50 years because this period was used previously to assess local extinctions in regional and country-level assessments (Akçakaya et al., Reference Akçakaya, Keith, Burgman, Butchart, Hoffmann and Regan2017) and because there are few taruka records overall, so each record is valuable to the modelling process. We sourced records from the literature, volunteer contributions and unpublished data from the authors (Supplementary Material 1, Supplementary Table 1). Archaeological records relate to pre-Columbian sites (> 500 years old) visited by author VM, stone paintings and petroglyphs. Historical records were obtained from literature covering the period 1800–1970. To mitigate spatial autocorrelation and pseudo-replication (Wellenreuther et al., Reference Wellenreuther, Larson and Svensson2012), and to reduce oversampling biases in a particular area (Fourcade et al., Reference Fourcade, Engler, Rödder and Secondi2014; Riquelme et al., Reference Riquelme, Estay, López, Pastore, Soto-Gamboa and Corti2018), we restricted the data to one presence record per 1 km2 grid cell, which resulted in a total of 624 effective points for building species distribution models.
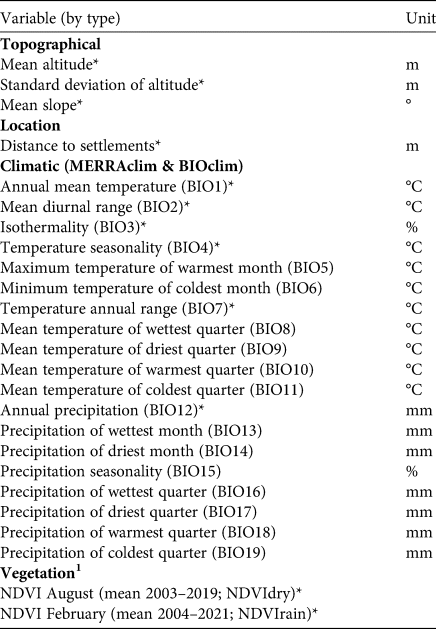
We initially selected 25 environmental variables, represented as raster layers of 1,856 × 3,201 grid cells (Table 1; Supplementary Material 1, Supplementary Table 2) to build species distribution models. Given the inconsistency of climatic measurements in the Central Andes Ecoregion (Morales-Barbero & Vega-Álvarez, Reference Morales-Barbero and Vega-Álvarez2019), we separately and concurrently built species distribution models using two distinct bioclimatic datasets: WorldClim (BIOclim models; Fick & Hijmans, Reference Fick and Hijmans2017) and MERRAclim (MERRAclim models; Vega et al., Reference Vega, Pertierra and Olalla-Tárraga2017). Both datasets encompass the same 19 bioclimatic variables and exhibit a similar spatial resolution. After excluding the variables with high autocorrelation from the MERRAclim and BIOclim models (R > 0.7, Elith et al., Reference Elith, Graham, Anderson, Dudík, Ferrier and Guisan2006; Table 1) we selected the same set of 12 variables to construct each model.
Environmental variables considered to be potential predictors of the distribution of the taruka Hippocamelus antisensis in South America (Fig. 1). Asterisks indicate variables that we selected for constructing the distribution model after excluding those with a correlation R > 0.7.

1 NDVI, normalized difference vegetation index.
We followed the protocol of Mata et al. (Reference Mata, Fuentes-Allende, Malo, Vielma and González2019) to select the best MERRAclim and BIOclim species distribution models (Supplementary Material 1). We then categorized the predictions of the selected MERRAclim and BIOclim models into two classes: the core distribution, using the mean value of the probability of species occurrence across all grid cells as a threshold (average predicted probability approach; Liu et al., Reference Liu, Berry, Dawson and Pearson2005), and the non-core distribution, applying the maximum value of the sensitivity–specificity sum as a threshold (sensitivity–specificity sum maximization approach; Liu et al., Reference Liu, White, Newell and Pearson2013). We used the average predicted probability approach for defining the core distribution because it imposes more stringent criteria compared to maximizing the sensitivity–specificity sum. After selecting the best BIOclim and MERRAclim models, we assessed prediction quality visually, comparing the models with the locations of historical and archaeological records, and requested feedback from taruka specialists regarding these predictions at global and country-level scales.
Finally, we assessed prediction similarity between the MERRAclim and BIOclim models using the niche overlap assessment provided by ENMTools (Schoener's statistic for niche overlap D; Hellinger's similarity statistic I; Warren et al., Reference Warren, Glor and Turelli2010). Indicators range from 0 (models have completely discordant predictions) to 1 (models produce identical predictions). Depending on their similarity, we examined whether it was appropriate to overlap both predictions and expand the estimated taruka distribution to include all areas that were predicted to be part of the species’ range by at least one of the models (MERRA–BIO prediction). We used this conservative approach to avoid omitting any relevant areas that were included in only one of the models. We restricted the extent of the core distribution in the overlapped MERRA–BIO prediction to areas classified as such by at least one of the models.
Area classification
We classified the overlapped distribution based on its type (core vs non-core) and protection status (protected vs unprotected). To assess the extent to which the distribution range benefits from conservation efforts (Fig. 1a), we used the World Database of Protected Areas (Protected Planet, 2024). We considered a distribution area to be protected when it overlapped with areas with a dedicated annual budget for conservation management, such as national parks, national reserves and private reserves. In contrast, we categorized as unprotected those areas overlapping with unprotected regions or marked for conservation but lacking the necessary infrastructure and budget (e.g. Ramsar sites, UNESCO Biosphere Reserves). This resulted in four categories of projected taruka distribution: protected core distribution, protected non-core distribution, unprotected core distribution and unprotected non-core distribution. We performed all spatial analyses using QGIS 3.4.6 (QGIS Development Team, 2019) and ArcGIS 10.7 (Esri, USA).
Results
Taruka distribution model
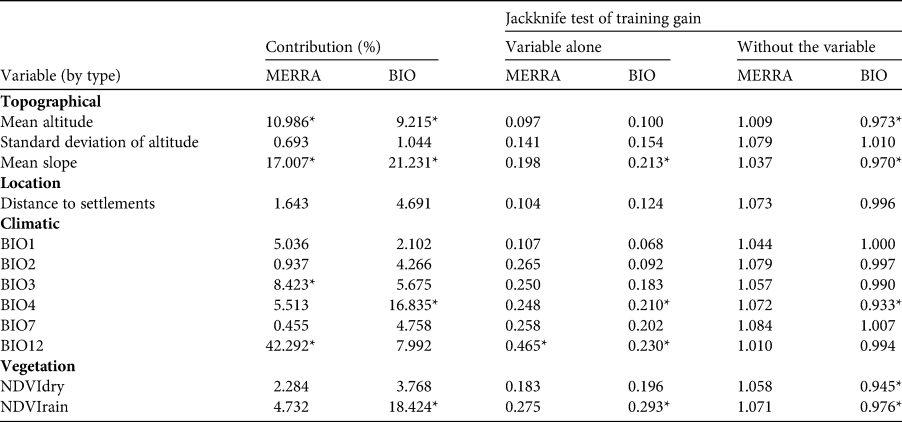
The mean values for the area under the receiver operating characteristic curve (AUCmean) of five models generated through cross-validation exhibited strong overall fits for MERRAclim (AUCmean = 0.879 ± SD 0.012) and BIOclim (AUCmean = 0.873 ± SD 0.013; Supplementary Fig. 1). The variables with the greatest contributions to the MERRAclim model were annual precipitation (Bio12; 42%), slope (17%), mean altitude (11%) and isothermality (Bio3; 8%; Tables 2 & 3; Fig. 2a–d). For the BIOclim model, the variables with the greatest contributions were slope (21%), normalized difference vegetation index (NDVI) during the dry season (August; 18%), temperature seasonality (Bio4; 17%) and mean altitude (9%; Table 2; Fig. 2e–h).
Per cent contributions and relative predictive powers of the environmental variables (see Table 1 for descriptions) assessed to determine their effects on the distribution of the taruka (Fig. 2). We calculated training gains for a single variable if we used it solely for the modelling procedure and additionally for the model with the remaining variables after dropping the focus variable. Values are means of five jackknife replicates of regularized training gain. Asterisks highlight the most relevant variables.

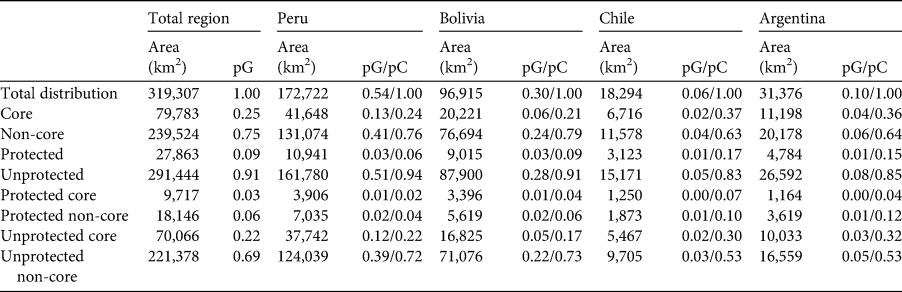
Spatial extent of the taruka distribution in South America, with values rounded to the nearest km2 and shown for total region and for each range country. The pG and pC values refer to the proportion of a specific category with regards to the global distribution and the distribution within each specific country, respectively.

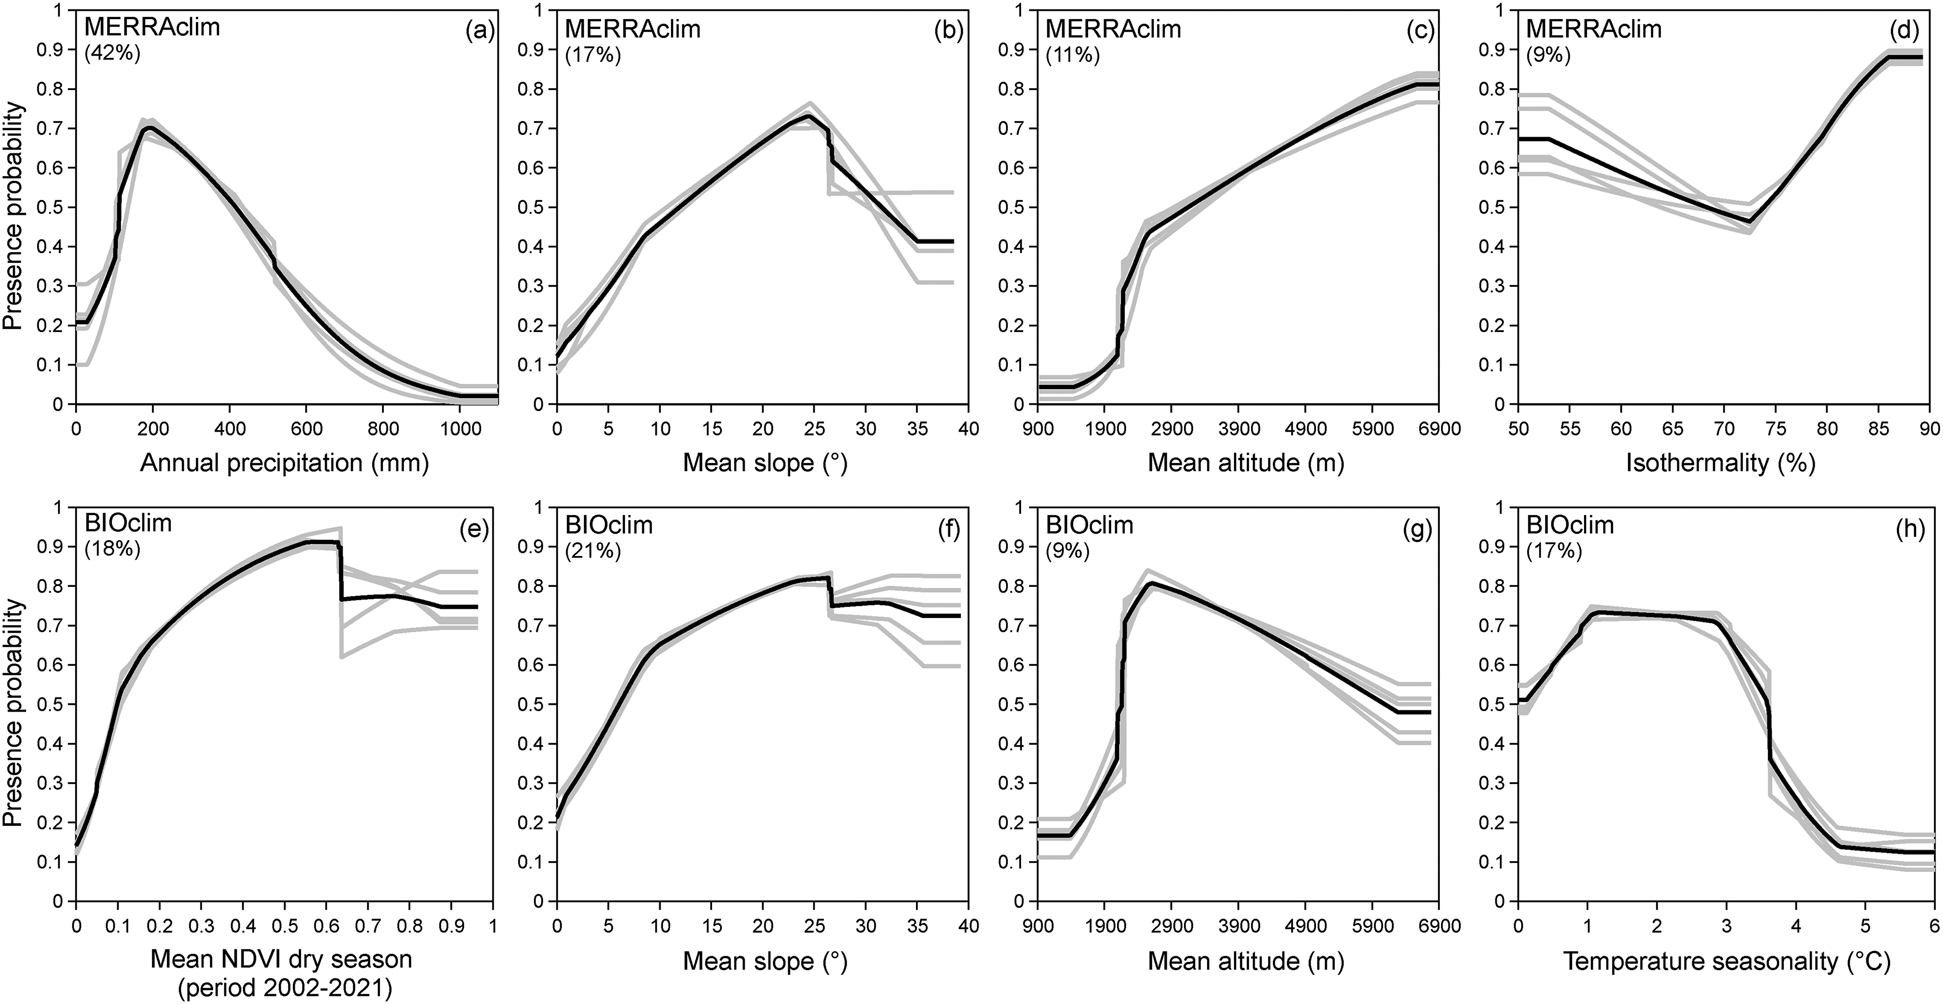
Most contributing variables (Table 2) in the (a–d) MERRAclim and (e–h) BIOclim species distribution models (SDMs) for the taruka in South America: (a) annual precipitation (BIO12), (b,f) mean slope, (c,g) mean altitude, (d) isothermality (BIO3), (e) mean normalized difference vegetation index (NDVI) during the dry season and (h) temperature seasonality (BIO4). Grey and black lines are single and averaged predictions, respectively, after five-fold cross-validation. See Table 1 for variable descriptions.

According to the variables with the greatest contributions, the probability of taruka presence is highest in areas with a mean slope of 25 ° (Fig. 2b,f), a mean NDVI during the dry season of 0.4–0.6 (Fig. 2e) and low daily and seasonal temperature variability (Fig. 2d,h). Although we also identified elevation and annual precipitation as variables with significant contributions, these model predictions did not agree with the knowledge of local specialists gained through field observations. The elevation with the maximum predicted presence probability was 6,500 m according to MERRAclim (Fig. 2c) and 2,600 m according to BIOclim (Fig. 2g), which agrees with records from Chile and Argentina. According to Peruvian and Bolivian collaborators, however, there are no taruka records above 6,000 m. With respect to annual precipitation, the MERRAclim model predicted maximum presence probability in areas with 180–300 mm of precipitation per year (Fig. 2a), but Bolivian collaborators stated that within their country, taruka are usually sighted in areas with precipitation close to 1,000 mm per year. Despite the disagreement of Peruvian and Chilean collaborators with the distribution categorizations in two specific areas within their countries (the highlands of Rio Abiseo National Park in Peru at 7.7°S, and the surroundings of Huatacondo in Chile at 20.9°S), the visual inspections of predicted distributions, historical–archaeological records and collaborators concurred with the global predictions of the taruka distribution range and indicated that the MERRAclim and BIOclim models yield similar results (Supplementary Fig. 1). We further confirmed this high level of agreement in predictions through niche overlap assessments using ENMTools (D = 0.935; I = 0.996), supporting our conservative approach of overlapping both predictions.
Regional distribution
The overlapped prediction covers an extensive area of 319,307 km2 (Fig. 1b), stretching from northern Peru (8°S, 76.9–78.6°W; Fig. 3a) to north-western Argentina (30°S, 66.7–69.1°W; Fig. 3d). Approximately a quarter of the predicted area corresponds to the core distribution (MERRA-BIO prediction = 25%, 79,783 km2; Fig. 1b). This core distribution is primarily limited to two continuous strips: one located at the western boundary of the Central Andes Ecoregion and the other at its eastern limit. Conversely, the non-core distribution is spread across this Ecoregion north of 18.2°S, and is restricted to the eastern portion in areas south of this latitude.
Predicted taruka distribution across its range countries: (a) Peru, (b) Bolivia, (c) Chile and (d) Argentina. The darker grey area represents the taruka distribution outside the focal country. GD, global distribution. (Readers of the printed journal are referred to the online article for a colour version of this figure.)

The western strip of the core distribution borders the Atacama Desert to the west and the High Andean Plateau to the east, extending from northern Peru (near Cabana, Department of Ancash, 8.3°S) to northern Chile (near Macaya, Tarapacá District, 20.2°S; Fig. 3c). The eastern strip of the core distribution is bounded by the High Andean Plateau to the west and the Yungas Forest to the east, covering an area from central Peru (near Cerro de Pasco, Department of Pasco; 10.4°S) to north-western Argentina (near Chilecito, La Rioja Province, 29.3°S). The western and eastern strips are completely isolated from each other throughout the distribution range, only being close to each other in the northern part (near Lima, Peru, 11.5°S).
Only 9% (c. 27,8632 km2) of the global taruka distribution falls within protected areas. This covers 12% of the projected core distribution (c. 9,717 km2) and 8% of the projected non-core distribution (c. 18,146 km2). The protected distribution area can be categorized into 31 units, scattered across central-western South America. Of these, eight units are located along the western strip of the core distribution, 14 units along the eastern strip of the core distribution and nine units are within the non-core distribution. There is no single transboundary protected area for the taruka that ensures international conservation within the core distribution.
Further details on the taruka distribution range within Peru, Bolivia, Chile and Argentina is available in Supplementary Material 2.
Discussion
This is the first instance in which researchers, conservation managers and governmental authorities from various South American countries have convened and shared their insights to model the distribution of the taruka. Although on a few occasions local researchers in South America have collaborated in international studies and conservation initiatives that aimed to protect threatened species, such endeavours have typically centred around more charismatic species such as the jaguar (Mena et al., Reference Mena, Yagui, Tejeda, Cabrera, Pacheco-Esquivel, Rivero and Pastor2020), Andean cat Leopardus jacobita (Marino et al., Reference Marino, Bennett, Cossios, Iriarte, Lucherini and Pliscoff2011) and huemul deer Hippocamelus bisulcus (Marín et al., Reference Marín, Varas, Vila, López, Orozco-Terwengel and Corti2013; Riquelme et al., Reference Riquelme, Estay, López, Pastore, Soto-Gamboa and Corti2018). We advocate for greater representation of local researchers and experienced managers in international initiatives (dos Santos et al., Reference dos Santos, Correia, Malhado, Campos-Silva, Teles, Jepson and Ladle2020). Their insights from field observations offer invaluable information, facilitating the design of more effective guidelines for studying and protecting threatened and lesser-known species at a regional scale (Lopez-Arevalo et al., Reference Lopez-Arevalo, Gallina, Landgrave, Martinez-Meyer and Muñoz-Villers2011). Furthermore, we emphasize the need for enhanced international conservation strategies targeting less charismatic umbrella species such as the taruka, as protecting these species can benefit entire ecological communities (Runge et al., Reference Runge, Withey, Naugle, Fargione, Helmstedt and Larsen2019).
As demonstrated here, data and field observations from local collaborators can enrich regional assessments of species distribution ranges (Lopez-Arevalo et al., Reference Lopez-Arevalo, Gallina, Landgrave, Martinez-Meyer and Muñoz-Villers2011). Such participation can help to improve the quality of model predictions because local experts contribute additional records to these regional evaluations. Furthermore, their technical and scientific knowledge can highlight model predictions that may be incorrect at the local scale, and increase representation of poorly prospected areas. In our study, for example, there was no agreement regarding the elevation with the maximum probability of taruka presence in the region. Despite the MERRAclim and BIOclim models predicting maximum presence probability at 6,500 and 2,600 m, respectively, local taruka specialists reported that the elevation of maximum presence probability is different for each country. Bolivian collaborators agreed with the prediction of the distribution range for their country, but they also noted that the value of annual precipitation at which presence probability is predicted to be highest based on this regional assessment does not match the reported information for Bolivia (Nuñez, Reference Nuñez2008). Similarly, Chilean and Peruvian collaborators agreed with the spatial extent of the predicted distribution for their countries, but both groups disagreed with the classification of the type of distribution for the southernmost population in Chile and northernmost population in Peru (Barrio, Reference Barrio2004; Fuentes-Allende et al., Reference Fuentes-Allende, Castro, Horta-Pizarro, Lassaga, Pastore and Squella2024). Contrary to the proposed classification in this regional assessment, specialists considered those areas as core rather than non-core distribution. In both cases, the regional assessment was improved by the local experience and field knowledge of taruka experts.
According to model predictions and collaborator experience from the field, slope could be one of the most relevant variables predicting taruka distribution. Steeply sloped areas with low daily and seasonal temperature variation and high NDVI during the dry season are commonly associated with gullies, ravines and other rugged areas in arid environments (Bindajam et al., Reference Bindajam, Mallick, AlQadhi, Singh and Hang2020). The topographical heterogeneity within gullies and ravines can create shaded conditions with stable local temperatures and humidity levels, distinct from other topographical structures within arid environments (Bindajam et al., Reference Bindajam, Mallick, AlQadhi, Singh and Hang2020). Furthermore, these features in the study area are often linked with watercourses, which affect local environmental humidity.
These specific environmental conditions may also influence NDVI values during the dry season and maximize biomass production of vegetation that is palatable and nutritious for large herbivores (Parker et al., Reference Parker, Barboza and Gillingham2009). Given the favourable conditions within gullies, ravines and similarly rugged terrain, we propose that taruka actively select such areas. Such habitat selection has been indirectly suggested previously through micro-histological studies of the taruka's diet (Nuñez, Reference Nuñez2008; Gazzolo & Barrio, Reference Gazzolo and Barrio2016; Castellaro et al., Reference Castellaro, Orellana, Escanilla, Fuentes-Allende and González2024), which reported a preference for particularly nutritious plant species over other, more abundant yet less nutritious, vegetation found in the same environment. The taruka is a medium-sized deer with a relatively small rumen, requiring it to feed mainly on high-quality vegetation to meet its nutritional needs (Müller et al., Reference Müller, Codron, Meloro, Munn, Schwarm, Hummel and Clauss2013). Additionally, its body morphology, which resembles that of a domestic goat (Pacheco et al., Reference Pacheco, Zapata and Arias2019), suggests it may be well adapted to rugged areas, with an ability to climb and traverse steep slopes, and less suited to sprinting across open landscapes (D. Jara, pers. comm., 2022). Future research using GPS collars could examine the movements of individual taruka at a finer spatial scale and assess their habitat use, confirming whether or not they prefer sloped areas in rugged terrain.
Threats to taruka conservation
According to model predictions and historical data, the distribution range of the taruka in Chile appears to have contracted over time. The model predicted non-core distribution in the coastal mountains of Paposo (25°00′S, 70°27′W; Antofagasta District, Chile) and in the Andean mountains between Copiapo (27°21′S, 70°19′W) and Vallenar (28°34′S, 70°45′W; Atacama District, Chile), areas that are located 450 and 700 km south, respectively, of the southernmost reported records for the species in this country during the last 50 years. These model predictions align with historical records from Paposo reported in the early 19th century (Mellet, Reference Mellet1908) and palaeontological records from Vallenar (Casamiquela, Reference Casamiquela1968). However, there have been no reported sightings in these areas for at least 200 years, suggesting that the species may be locally extinct there. Our models indicate that these sites still offer favourable climatic, vegetational and topographical conditions for the taruka, and although we cannot definitively ascertain the drivers of these local extinctions, interactions with local communities and mining activities could be contributing factors (Mellet, Reference Mellet1908).
The fragmentation of the taruka's core distribution throughout the region raises concern for its conservation. Our models depict this distribution as confined to two disconnected strips: one located at the eastern limit of the Central Andes Ecoregion and the other at the western boundary. Moreover, substantial range fragmentation exists within these strips, for example, in the northern part of the western strip (central Peru) and the central part of the eastern strip (southern Bolivia). Range fragmentation hampers species mobility, isolates local populations (Prugh et al., Reference Prugh, Hodges, Sinclair and Brashares2008; Kauffman et al., Reference Kauffman, ., Gagnacci, Chamaillé-Jammes, Hebblewhite, Hopcraft and Merkle2021), fosters inbreeding and genetic diversity loss, and renders individuals more vulnerable to diseases and unexpected environmental events in the short term and to local extinction in the medium to long term (Lino et al., Reference Lino, Fonseca, Rojas, Fischer and Ramos Pereira2019).
Our predictions indicate that the fragmentation of the taruka distribution in South America is influenced by climate, vegetation and topography, aligning with similar regional-scale studies (e.g. bird communities in Spain, Seoane et al., Reference Seoane, Bustamante and Díaz-Delgado2004; northern quoll Dasyurus hallucatus in northern Australia, Moore et al., Reference Moore, Dunlop, Valentine, Woinarski, Ritchie, Watson and Nimmo2019). Although proximity to human settlements was not a significant factor in our regional study, previous country-level assessments have demonstrated its importance in determining taruka presence (in Chile, Mata et al., Reference Mata, Fuentes-Allende, Malo, Vielma and González2019).
The impact of anthropogenic climate change on the fragmentation of the core distribution should not be underestimated. Climate change is shortening rainy seasons in arid environments, resulting in prolonged seasonal droughts (Trenberth, Reference Trenberth2011), as well as motivating land-use change for agricultural production in areas where taruka feed (Á. Nuñez & N. Fuentes-Allende, pers. obs., 2023). Longer periods of precipitation scarcity can drive local desertification (Huang et al., Reference Huang, Zhang, Zhang, Guan, Wei and Guo2020), leading to diminished habitat quality and size. It is crucial for managers to monitor the impacts of these changes on seasonality, focusing on indicators such as changes in nutritional condition (Fuentes-Allende et al., Reference Fuentes-Allende, Stephens, MacTavish, MacTavish and Willis2023) and survival rates (Parker et al., Reference Parker, Barboza and Gillingham2009).
Considering the fragmentation of the core distribution and the lack of comprehensive information on taruka genetic diversity, molecular studies are needed across the species’ range. Determining genetic diversity could aid managers and environmental authorities in identifying populations at higher risk of local extinction (Frankham, Reference Frankham2010). This becomes especially important when considering that today there are still open questions regarding these topics, such as how closely connected different populations are across its range, and whether there are any subspecies (Gutiérrez et al., Reference Gutiérrez, Helgen, McDonough, Bauer, Hawkins and Escobedo-Morales2017).
An urgent conservation concern is the limited coverage of protected areas within the taruka distribution, with only 9% of its total predicted distribution under protection (and only 3% being protected core habitat). In unprotected areas, the species is exposed to anthropogenic threats such as poaching, predation by domestic and feral dogs, fencing and disruption of natural feeding areas, overgrazing by livestock, disease transmission from domestic animals, burning of native vegetation for agricultural expansion, urban encroachment, mining expansion, road traffic and river channelling (Barrio et al., Reference Barrio, Nuñez, Pacheco, Regidor and Fuentes-Allende2017; authors, pers. obs., 2023).
Challenges facing taruka conservation
To counteract the identified threats, we recommend securing connectivity within the taruka's core distribution, fostering coexistence with local communities, formalizing international collaboration amongst taruka specialists and increasing the species’ appeal amongst policymakers and the public.
We identified fragmentation of its distribution range as the main threat to taruka conservation. To ensure connectivity amongst populations, it is necessary to create and maintain protected areas within the core distribution throughout the region. However, establishing protected areas for the taruka faces challenges, especially limited funding for their creation and management (Thornton & Branch, Reference Thornton and Branch2019), a high human population density within the taruka distribution (Barrio, Reference Barrio2013; Rechberger et al., Reference Rechberger, Pacheco, Nuñez, Roldán, Martínez and Mendieta2014), agricultural development encroaching upon feeding areas (Fuentes-Allende et al., Reference Fuentes-Allende, Vielma, Paulsen, Arredondo, Corti, Estades and González2016) and opposition from local communities (Knight et al., Reference Knight, Grantham, Smith, McGregor, Possingham and Cowling2011). We recommend increased budgets for improving the infrastructure and management of existing protected areas, and creation of new protected areas outside human-populated areas to safeguard against future development, such as mining and urban expansion (Mata et al., Reference Mata, Fuentes-Allende, Malo, Vielma and González2019). Protecting taruka habitat is especially important considering that climate change is amplifying human–wildlife conflicts worldwide (Abrahms et al., Reference Abrahms, Carter, Clark-Wolf, Gaynor, Johansson and McInturff2023).
Transboundary protected areas are crucial for ensuring population connectivity across political borders (Thornton et al., Reference Thornton, Branch and Murrya2020). However, their creation and management require joint planning and coordination between neighbouring countries (Lim, Reference Lim2016; Thornton & Branch, Reference Thornton and Branch2019; Liu et al., Reference Liu, Yong, Choi and Gibson2020), which is difficult when there is no consensus on how to address common conservation problems (Blair et al., Reference Blair, Le and Xu2022). According to our regional assessment, transboundary efforts should focus on ensuring connectivity throughout the western and eastern strips of the taruka core distribution. Existing national protected areas near country borders could serve as a foundation for creating transboundary protected areas in these crucial regions: Vilacota Maure Regional Conservation Area (Peru) and Lauca National Park (Chile) in the western strip at the Peruvian–Chilean border, Lago Titicaca Ramsar site (Peru) and Madidi National Park/Apolobamba Integrated Management Natural Area (Bolivia) in the eastern strip at the Peruvian–Bolivian border, and Cordillera de Sama Biological Reserve (Bolivia) and Las Yungas Biosphere Reserve (Argentina) in the eastern strip at the Bolivian–Argentinian border.
Implementing transdisciplinary programmes is vital to foster coexistence with local communities in rural and suburban landscapes. To be effective in ensuring both the protection of taruka and the well-being of local residents, such interventions need to be co-designed with active participation of local authorities, researchers, wildlife managers and local communities (Knight et al., Reference Knight, Grantham, Smith, McGregor, Possingham and Cowling2011; König et al., Reference König, Kiffner, Kramer-Schadt, Fürst, Keuling and Ford2020). Engaging local communities can transform their perceptions, from viewing wild animals as problematic to recognizing wildlife as an asset with the potential to enhance people's well-being (Killion et al., Reference Killion, Ramirez and Carter2021; Carmanchahi et al., Reference Carmanchahi, Lichtenstein, Gregorio, Panebianco, Marozzi, Leggieri, Carmanchahi and Lichtenstein2022). There are examples of successful human–wildlife coexistence programmes in rural and suburban settings in South America; e.g. livestock ranching coexisting with ecotourism and wildlife conservation in Venezuela and Brazil (Hoogesteijn & Hoogesteijn, Reference Hoogesteijn and Hoogesteijn2010) and with the sustainable management of guanacos in Patagonia (Carmanchahi et al., Reference Carmanchahi, Lichtenstein, Gregorio, Panebianco, Marozzi, Leggieri, Carmanchahi and Lichtenstein2022).
International collaboration amongst specialists, managers and environmental authorities from the four taruka range countries needs to be strengthened to improve the species’ protection in the region. Successful conservation depends on the various actors being coordinated, pursuing a common goal and agreeing on a single regional strategy (Kark et al., Reference Kark, Tulloch, Gordon, Mazor, Bunnefeld and Levin2015; Blair et al., Reference Blair, Le and Xu2022). The implementation of a regional plan allows conservationists to focus on identifying and addressing broad-scale threats (Kark et al., Reference Kark, Tulloch, Gordon, Mazor, Bunnefeld and Levin2015), increases the efficiency of conservation efforts and helps countries to allocate their limited resources effectively. Formalizing the international collaboration for protecting the taruka in South America could strengthen transboundary conservation efforts, but this is something yet to be agreed amongst the collaborators. If consensus can be achieved, a formal arrangement could take the form of a Task Force Group created under the IUCN Species Survival Commission Deer Specialist Group, or an independent and autonomous group (e.g. similar to the Andean Cat Alliance, Lucherini et al., Reference Lucherini, Palacios, Villalba and Iverson2012, or Darwin's Frog Alliance, Azat et al., Reference Azat, Valenzuela-Sánchez, Delgado, Cunningham, Alvarado-Rybak and Bourke2020).
We also consider it important to increase the taruka's appeal amongst policymakers and the general public. International conservation initiatives often do not prioritize species or environments that demand the most urgent attention but instead focus on charismatic ecosystems (e.g. the Benguela Ecosystem, Kirkman et al., Reference Kirkman, Holness, Harris, Sink, Lombard and Kainge2019; the Great Limpopo Transfrontier Conservation Area, Ntuli et al., Reference Ntuli, Jagers, Linell, Sjöstedt and Muchapondwa2019; the Amur River basin, Simonov et al., Reference Simonov, Nikitina and Egidarev2019; marine areas in East Africa, Tuda et al., Reference Tuda, Kark and Newton2019) and species (e.g. Amur leopards Panthera pardus orientalis, Vitkalova et al., Reference Vitkalova, Feng, Rybin, Gerber, Miquelle and Wang2018; large mammals in various regions, Liu et al., Reference Liu, Yong, Choi and Gibson2020; Asian leopards, Farhadinia et al., Reference Farhadinia, Rostro-García, Feng, Kamler, Spalton and Shevtsova2021) that capture the interest of the general public. One way to raise awareness of and generate interest in taruka conservation initiatives would be to shift the focus from the taruka as an individual species to a community of mammals that includes more charismatic species such as the Andean cat (Lagos et al., Reference Lagos, Fuentes-Allende, Sepúlveda, Gamboa, Hernández and González2017) and/or the Andean bear Tremarctos ornatus (Velez-Liendo et al., Reference Velez-Liendo, Strubbe and Matthysen2013). Although such an approach would focus less directly on the taruka, it could help to protect its habitat (Poufoun et al., Reference Poufoun, Abildtrup, Sonwa and Delacote2016; Mena et al., Reference Mena, Yagui, Tejeda, Cabrera, Pacheco-Esquivel, Rivero and Pastor2020). Additionally, awareness-raising campaigns could also increase the taruka's appeal by disseminating information about the species to the public and highlighting its uniqueness to the Central Andes landscapes and the role it plays in the region's ecosystem (Roll et al., Reference Roll, Mittermeier, Diaz, Novosolov, Feldman and Itescu2016).
Finally, equally important as the actions proposed above is the expansion of scientific research, both locally and regionally, on the ecology of the taruka and its interactions with people. Robust data are needed to support national and regional conservation strategies, explore areas of predicted taruka distribution where the presence of the species remains unconfirmed, and evaluate possible conservation threats. We recommend intensively prospecting the areas of Paposo and Vallenar in Chile, as well as other areas with historical records, to assess whether the taruka persists in these locations. Our group of international collaborators is planning further studies to assess the effects of anthropogenic factors such as human population and livestock density on the taruka distribution range.
Conclusions
International collaboration is necessary for the successful conservation of species with transboundary distributions. However, this is only possible if the relevant stakeholders collaborate, share information and delineate a single conservation strategy for the entire region. Our experience shows that regional assessments can be improved by incorporating the observations and knowledge of local specialists, which can highlight and address issues that may otherwise be overlooked in such large-scale evaluations. We found that the fragmentation of the taruka core distribution is the main threat facing the species’ conservation, and that this could be alleviated through creating protected areas in isolated regions and promoting taruka coexistence with local communities in human-modified environments.
Author contributions
Study conception: NF-A; data collection: all authors; analysis: NF-A, CM; writing: all authors.
Acknowledgements
NF-A is funded by the Chilean National Agency for Research and Development (ANID) in the framework of the programme FONDECYT Postdoctorado 3220370 ETAPA 2023, and by The Rufford Foundation through a Rufford Small Grant for Nature Conservation. NF-A's fieldwork in Chile is logistically supported by ENGIE Chile. CM is supported by the Comunidad de Madrid through the REMEDINAL TE-CM Research Network (P2018/EMT4338). We also thank M. Fisher, H.U. Wittmer and an anonymous reviewer for their critique of the text. This research is part of the surveys carried out by the Fundación Sudamérica Diversa and the IUCN Species Survival Commission Deer Specialist Group to improve taruka conservation in the Central Andes Ecoregion in South America.
Conflicts of interest
None.
Ethical standards
This research abided by the Oryx guidelines on ethical standards. We obtained the relevant permits to analyse and publish taruka location data, and all collaborators are nationals of the study countries. There was no animal capture or disturbance, nor habitat modification, in the course of this observational study.
Data availability
Data are available upon reasonable request from the corresponding author.


 Open access