


Introduction
Over the past decades, Ministries of Health, NGOs, and scientists have made substantial progress in reducing child mortality around the globe.(2,Reference You, Hug and Ejdemyr3) However, many children still do not reach the age of five.(4,5) According to UNICEF, an estimated 4.8 million children worldwide died before reaching the age of five in 2023.(6) More than 80% of these deaths occurred in low- and middle-income countries, with the overwhelming majority concentrated in sub-Saharan Africa and South Asia, regions that together account for the highest under-five mortality burden globally.(4) This stark geographic concentration underscores persistent and profound health inequalities, reflecting enduring disparities in access to nutrition, preventive care, timely treatment, and broader social determinants of health.
In the context of global health inequalities, the double and triple burden of malnutrition, as well as contextual struggles (e.g. wars, human displacements, and natural disasters associated with climate change), add new challenges for healthy child growth, particularly in low-resource settings.(Reference Popkin, Corvalan and Grummer-Strawn7,Reference Victora, Christian and Vidaletti8) Scientists and policymakers agree on the importance of multisectoral programmes to combat malnutrition and improve child morbidity and mortality,(Reference Ruel and Alderman9,Reference Escher, Andrade and Ghosh-Jerath10) but to achieve this goal, the design, implementation, and assessment of nutrition-specific and nutrition-sensitive interventions call for a multidimensional approach to child growth that goes beyond physical outcomes. A multidimensional assessment of child growth – aimed to understand child development beyond anthropometry – sheds new light on inequalities and helps design interventions better tailored to the needs of children in vulnerable situations.(Reference Black and Walker11) The capability approach and a rights-based multidimensional framework for children both contribute to the Sustainable Development Goals (SDG) agenda of leaving no one behind and could be extended to clinical practice for growth monitoring and assessment.(12)
The Task Force ‘Towards a multidimensional index to child growth’ of the International Union for Nutritional Sciences was launched at the International Congress of Nutrition in 2013. In a workshop attended by experts from different disciplines, multidimensional child growth was conceptualised as ‘the process of continuous physical, psychological, and social change that builds a child’s capacities to maximise life chances at the individual and societal level’.(Reference Haisma, Yousefzadeh and Boele Van Hensbroek13) This concept is grounded in theories from different disciplines, such as nutrition transition theory from demography, parent-offspring conflict theory, and life history theory from evolutionary biology.(Reference Haisma, Yousefzadeh and Boele Van Hensbroek13) After the conceptualisation of multidimensional child growth, in 2015, as part of the EXPO in Milan, scientists were invited to discuss the need and potential of a multidimensional approach for child growth. Building on Biggeri’s conceptual model for child wellbeing(Reference Biggeri and Trani14,Reference Biggeri and Cuesta15) and Bronfenbrenner’s ecological model,(Reference Bronfenbrenner16) the task force developed the Capability Framework for Child Growth. Following Nussbaum and Biggeri, a rights-based approach was further adopted to identify the dimensions for child growth.(Reference Yousefzadeh, Biggeri, Arciprete and Haisma17)
Since then, the Task Force has provided a platform for scientists to contribute to the development of the approach. In the first term (2013–2017) the focus was on the theoretical foundations and conceptualisations of the approach. In the second term (2017–2022), the focus was on the operationalisation and contextualisation with qualitative research in Tanzania and Bangladesh. In the third term (from 2022), a multidimensional index was calculated for an assessment of interventions and multidimensional comparisons between countries.
The IUNS-MICG project started with a conceptualisation of healthy child growth that is informed by the capability approach and the Convention on the Rights of the Child. The index of multidimensional child growth (MICG) identifies children who are deprived in the various dimensions of the MICG using the Young Lives Survey. Those children are being left behind in their biological, psychological and social development process and would benefit from tailor-made interventions targeted at specific dimensions of child growth, for example, economic exploitation, or exposure to domestic violence. The approach is relevant to the individual, population and health systems, at micro- (individual, household), meso- (subnational, regional), and macro country-level analysis.
Section 2 of this document describes the capability approach for children. Section 3 explains the operationalisation of the capability approach for children – that is, translating the theoretical framework into an empirical index of multidimensional child growth. Section 4 shows how MICG can be applied at macro-, meso-, and micro-levels. Section 5 concludes. Appendix A shows how a multidimensional approach helps to identify the worst-off children using Demographic and Health Survey (DHS) and Young Lives data. Appendix B provides a non-Euclidean Extension of Bronfenbrenner’s Bioecological Theory in which child growth is conceptualised as motion across a curved ecological manifold, not movement through fixed layers.
The capability approach for children
Several approaches and methodologies have been suggested to conceptualise and measure child wellbeing and child development. These approaches are rooted in different scientific disciplines, including nutrition science,(Reference Requejo, Strong and Agweyu18) philosophy,(Reference Hassoun19) psychology,(Reference Lippman, Anderson Moore and McIntosh20) and economics.(Reference Gibbons, Sprong and Chzhen21) Examples of these indices are the WHO’s D-Score(22,Reference McCray, McCoy and Kariger23) or the UNICEF Early Childhood Development Index, the Nurturing Care Framework,(Reference Wertlieb24,25) and the Child Flourishing Index.(Reference Clark, Coll-Seck and Banerjee26)
Within the field of nutrition science, child growth has been conceptualised as the change in weight and height, that is, reflecting only the physical dimension. Our IUNS Task Force advocates for re-defining the concept of child growth in the context of the capability approach,(Reference Haisma, Yousefzadeh and Boele Van Hensbroek13) to make it a multidimensional concept that includes the environmental context in which a child grows, since this context affects physical, social, and psychological child growth. Capabilities capture not only the actual situation of a child, but also their opportunities to grow in physical and non-physical dimensions, conditional on the status of their parents and caregivers and shaped by wider structural opportunities.
The capability approach guides researchers on how to build multidimensional indices. In capability theory, endowments are the resources or assets a person possesses, such as physical goods, personal traits, or social entitlements. These endowments can potentially be used to achieve various outcomes, called ‘functionings’. Functionings refer to a person’s achieved life outcomes, such as being healthy, having a good job, being safe, or being educated. However, simply possessing endowments does not guarantee the realisation of desired outcomes. There must be supportive social conditions, and the ability to convert resources into actual achievements depends on conversion factors – which can be personal (like physical ability or knowledge), social (such as cultural norms or discrimination), or environmental (including infrastructure or climate conditions).
In the original capability approach proposed by Sen,(Reference Sen27) people are free to choose their functionings by converting their commodities into a vector of characteristics. For example, a bicycle is a commodity and ‘playful’ and ‘transportation’ are its characteristics. A bicycle can have a playful characteristic for a child that uses the bicycle only to play, but for children that use the bicycle to go to school, the bicycle also has a transportation characteristic. Capabilities refer to the practical possibility of individuals to achieve functionings. Sen and all capability approach advocates assert that focus should be on addressing capability deprivations and protecting and expanding capabilities.
In the capability approach for children, it is important to consider that (1) the capabilities of children are age-dependent (among other factors such as sex), that is, the capabilities change depending on the age of a child, and (2) there exists an inter-generational transfer of capabilities from parents and caregivers to children, and hence parents and caregivers influence the capabilities of children. For example, recent evidence indicates that there is an increased risk of a child not attaining expected educational standards at age 5 if their mothers were anaemic at 28 weeks of pregnancy.(Reference Olga, Sovio and Wong28) In terms of age-dependency, changing historical environments and cohort effects imply that the capabilities of children and the conversion of commodities are different from those of adults, and evolve with age.
Thus, in the case of children, capability theory must be adjusted to account for the endowments and capabilities of their parents and caregivers and the structural opportunities or shortcomings that shape parents’ and caregivers’ endowments. The achievements of children – as being well-nourished – are termed functionings, and capabilities are defined as the opportunities to achieve these functionings; for example, the opportunity to have a nutrient-diverse meal is a capability that enables being well-nourished. Additionally, the conversion factors affecting children are influenced by those of their parents and caregivers. For example, if parents/caregivers are constrained in utilising their endowments (e.g. due to wars, economic sanctions, or the fact that natural disasters reduce food availability), providing a nutrient-diverse meal for their child could be extremely difficult. To incorporate the insight that children’s conversion factors are nested within or influenced by those of their parents (shaped by the contextual and structural factors), we expanded the original formalisation of capability theory. In its basic form, the capability set of a child ${Q_i}\left( {{E_i}} \right)$
is defined as the set of possible achieved functionings
${Q_i}\left( {{E_i}} \right)$
is defined as the set of possible achieved functionings ${a_i}$
, where each
${a_i}$
, where each ${a_i}$
is the result of applying a choice function
${a_i}$
is the result of applying a choice function ${f_i} \in {F_i}$
to the outcome of a conversion function
${f_i} \in {F_i}$
to the outcome of a conversion function $c\left( \cdot \right)$
acting on the child’s endowments
$c\left( \cdot \right)$
acting on the child’s endowments ${e_i} \in {E_i}$
. Formally, this is written as:
${e_i} \in {E_i}$
. Formally, this is written as:
 $${Q_i}\left( {{E_i}} \right) = \left[ {{a_i} = {f_i}\left( {c\left( {{e_i}} \right)} \right),\;{\rm{for\;}}{f_i}\left( \cdot \right) \in {F_i}\;{\rm{and}}\;{e_i} \in {E_i}} \right]$$
Here, ${Q_i}\left( {{E_i}} \right)$
represents the capability set of child
${Q_i}\left( {{E_i}} \right)$
represents the capability set of child $i$
,
$i$
, ${a_i}$
is the achieved functioning,
${a_i}$
is the achieved functioning, ${f_i}$
is the function representing the child’s choice,
${f_i}$
is the function representing the child’s choice, $c\left( \cdot \right)$
is the conversion function, and
$c\left( \cdot \right)$
is the conversion function, and ${E_i}$
is the set of endowments available to the child.
${E_i}$
is the set of endowments available to the child. ${F_i}$
denotes the set of functionings that are available to be realised by the child. This basic structure assumes a direct transformation from endowments to functionings through conversion and choice.
${F_i}$
denotes the set of functionings that are available to be realised by the child. This basic structure assumes a direct transformation from endowments to functionings through conversion and choice.
However, when considering children, this framework needs to be expanded to reflect that children’s abilities to convert endowments into functionings are deeply dependent on their parents or caregivers. The capability sets of children are not formed in isolation, but rather through a nested system of dependencies. In this expanded model, the child’s conversion function itself becomes dependent on the conversion outcomes of the parent, and functionings of parents and caregivers become endowments for children, which children in turn can transform into capabilities through conversion factors.
Moreover, the capability approach not only includes the agency of parents/caregivers, but also recognises the agency of children and, that is, the child’s voice, choice, and participation in matters affecting their lives (e.g. education, play, relationships, cultural expression). This approach shifts policy from a top-down model (what adults think children need) to one that includes children’s perspectives (e.g. participatory methods in education, child-inclusive surveys, rights-based approaches). Thus, children are not only passive recipients of care and protection but active agents in shaping their environments, families, schools, and communities.
Formally, if parental endowments are denoted by ${E_p}$
, and the parental conversion function by
${E_p}$
, and the parental conversion function by ${c_p}$
, the parental endowments
${c_p}$
, the parental endowments ${e_p} \in {E_p}$
will be transformed into enabling conditions for the child. The child’s own conversion function,
${e_p} \in {E_p}$
will be transformed into enabling conditions for the child. The child’s own conversion function, ${c_i}$
, now takes two arguments: the child’s own endowments
${c_i}$
, now takes two arguments: the child’s own endowments ${e_i}$
, and the converted parental conditions
${e_i}$
, and the converted parental conditions ${c_p}\left( {{e_p}} \right)$
. The resulting achieved functioning
${c_p}\left( {{e_p}} \right)$
. The resulting achieved functioning ${a_i}$
is now represented as a composite:
${a_i}$
is now represented as a composite:
 $${Q_i}\left( {{E_i},{E_p}} \right) = \left[ {{a_i} = {f_i}\left( {{c_i}\left( {{e_i},{c_p}({e_p})} \right)} \right),\!\!\;{\rm{for\;}}{f_i}\left( \cdot \right) \in {F_i},{e_i} \in {E_i}} ,{e_p} \in {E_p}\right]$$
This formulation acknowledges that the effective capabilities of children emerge from a layered structure in which parental capacities, resources, agency, and choices directly shape the child’s context. The child’s own conversion factors, and ultimately their functionings, are embedded within and shaped by the prior conversion of parental endowments. This recursive logic highlights the structural interdependence at the core of capability formation in early life and aligns with the real-world observation that children’s wellbeing and opportunities are fundamentally mediated through the conditions created by those who care for them.
Additionally, functionings in multidimensional child growth depend heavily on the child’s age, as functionings represent realised wellbeing and quality of life. For example, a bicycle, an endowment, can be used by a child for play (increasing leisure) or to enable the functioning of commuting to school efficiently. However, if the parents are not available for teaching the child to ride a bike, or if the child lives in an area without safe roads, or faces societal discouragement, these conversion factors may hinder this functioning. Another example is access to vaccinations: if the child or their parents and caregivers’ distrust medical institutions, cannot take time off work, or face logistical barriers, the functioning of being vaccinated may not be achieved. Thus, the actual functionings depend on the interplay of conversion factors affecting both children and parents.
The diagram below presents a multidimensional capability framework for child growth, illustrating how physical and non-physical child growth is shaped by interactions across ecological systems and contextual structures. At the centre lies the child, whose achieved functionings at a given time reflect their current wellbeing. These functionings are influenced by direct interactions within the micro-system (family, caregivers, teachers, peers), which are embedded within broader meso-, exo-, and macro-systems encompassing neighbourhood dynamics, institutional structures, and human rights frameworks (Figure 1).
Theoretical framework for multidimensional child growth that combines an eco-biological perspective with the capability approach. Adapted from Yousefzadeh et al.(Reference Yousefzadeh, Biggeri, Arciprete and Haisma17)
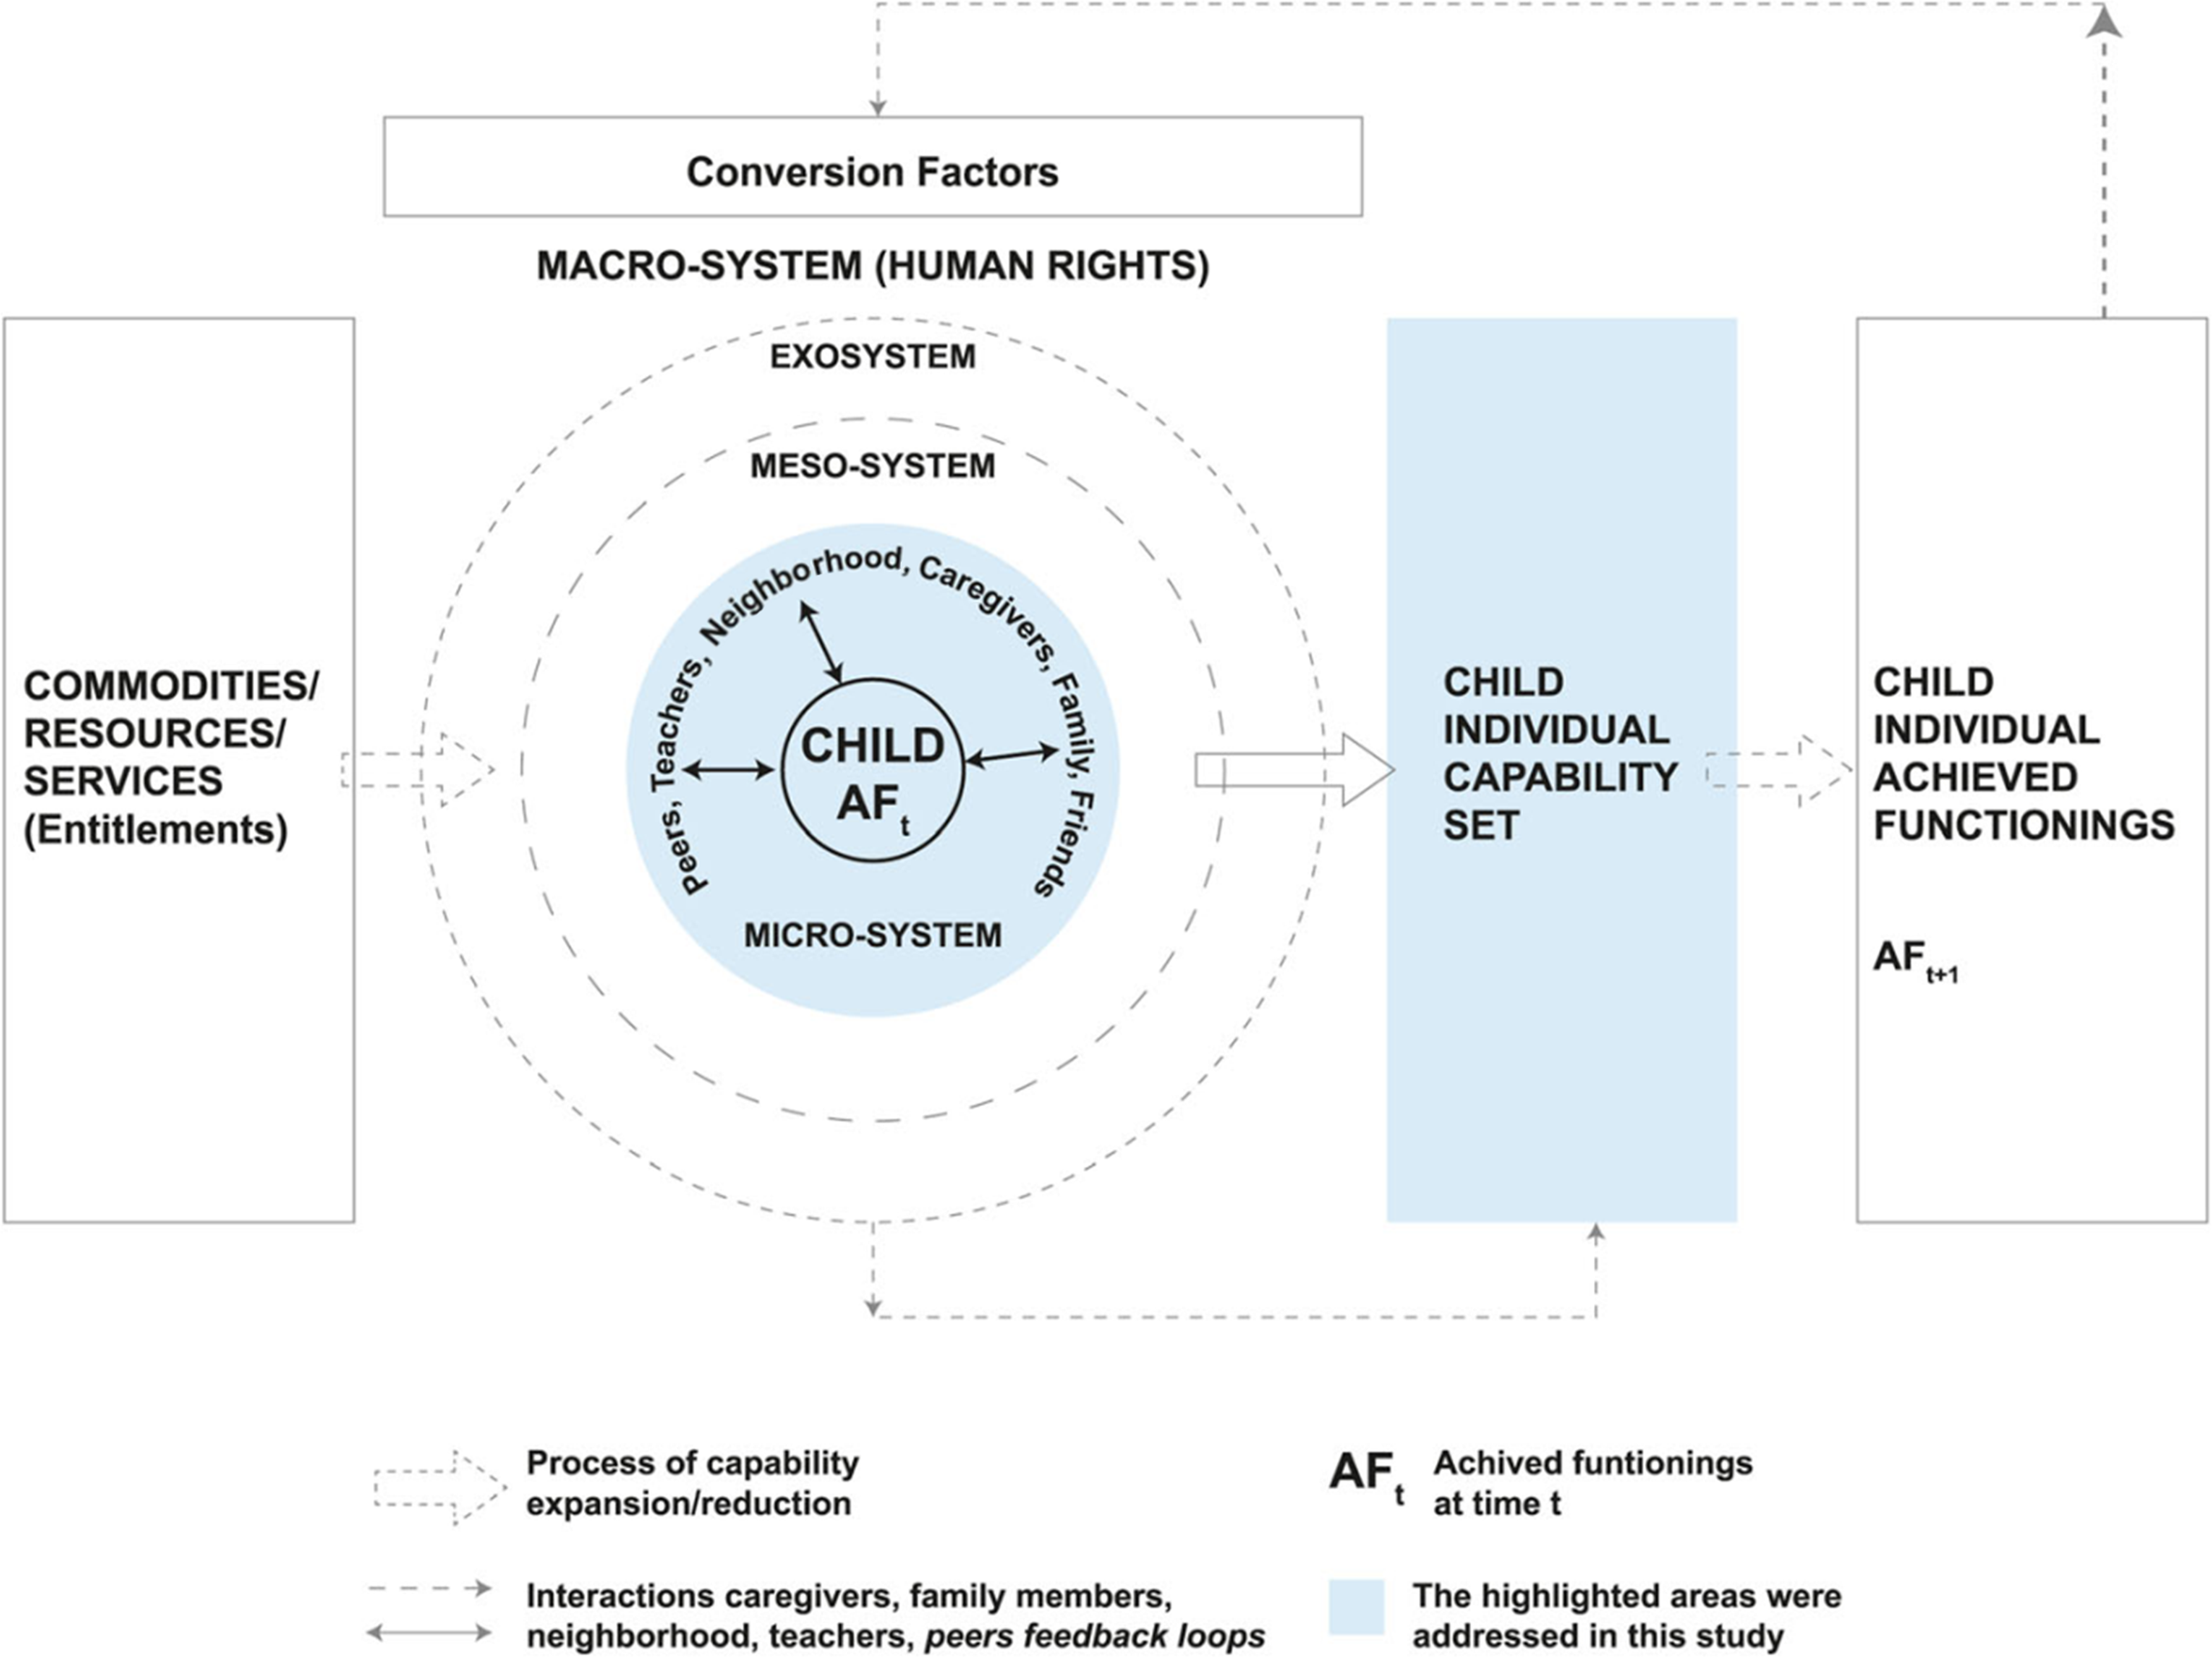
Commodities, resources, and services (entitlements) flow into this system, but their effectiveness depends on conversion factors – such as caregiver education, social norms, and local infrastructure – that influence how entitlements are transformed into real opportunities, or capability sets. These sets represent the genuine opportunities available to a child, which may or may not be realised as achieved functionings in the future. The framework emphasises that physical and non-physical child growth is a dynamic process, with feedback loops and reciprocal interactions continuously shaping capability expansion or reduction.
Operationalising the capability approach for children
Operationalising the capability approach for children implies translating the theoretical framework of the TMICG-IUNS into an empirical index. This can be challenging due to the uncertainty over which dimensions should be selected, and the fact that capabilities (opportunities) cannot be observed directly. In particular, the ‘unobservability’ of capabilities implies that statistical methods are needed to estimate the real opportunities that children have in multiple inter-related dimensions. The levels of achievement or deprivation for each of the capabilities and their associations with other factors would be instrumental to estimate the real opportunities that children have in multiple inter-related dimensions.
At the first step of operationalisation of CFCG, we aimed to identify the capabilities for child growth in a climate vulnerable setting, namely, Haor areas of Bangladesh.(Reference Chakraborty29–Reference Chakraborty, Darak and Haisma32) Haor areas are geographically vulnerable due to long-term flooding. We investigated how the contextual factors related to ecological aspects, social barriers, and gender issues affected the capabilities that parents had to prioritise in their context to achieve healthy child growth outcomes. We conducted our fieldwork in two rounds. In the first round (conducted from December 2016 and January 2017), we conducted in-depth interviews and focus group discussions (FGDs) with the parents of children 2 years of age. Then in the second round, (February 2019) we used visual methods to co-create knowledge in our discussions with the parents to validate the list of capabilities that emerged from the first round. The analysis was done using an iterative process of inductive and deductive reasoning with the constitutive elements of the CFCG.(Reference Hennink, Hutter and Bailey33) The findings generated a validated set of capabilities for child growth at the child, mother, father, and household level employing the emic perspectives of the parents living in Haor.
At the child’s level, the parents discussed the capability to stay away from disease and to eat well, the capability to stay happy and to be playful, and the capability to be born with God’s blessings and with the hereditary traits needed to grow. At mothers’ level, they mentioned the capability of staying healthy and nourished, the capability of staying away from violence, and the capability of practicing autonomy in allocating time for childcare. At fathers’ level, they described their struggles to save the lives of their wives and children, particularly during periods of pregnancy and delivery. At the household level, the parents discussed the capability to live in a safe shelter, the capability to be mobile, the capability to overcome their struggles with the earth, and the capability to have a source of safe drinking water. However, maternal and child survival were found to be at the core of the concept of child growth in the Haor context.(Reference Chakraborty29,Reference Chakraborty, Darak and Haisma32) A range of external factors, such as poor communication between the spouses about the mother’s health condition, fear of a caesarean birth, inadequate advice by local doctors, underdeveloped infrastructure, and seasonal extremities contributed to late admissions to health care facilities. This interfered with the capability of fathers to save the lives of their wives and children. Mothers also lack the autonomy to seek health care by themselves due to insufficient access to financial resources, or to women-friendly social arrangements for health care after a caesarean delivery, limited knowledge about how to find the location of the health facility, and their gendered roles that restrict them to indoor activities. Thus, the findings of our operationalisation of CFCG generated insights regarding the capability deprivations of the parents that are relevant for child growth. Through our research, we explained how capabilities can be identified in a democratic or a participatory way by combining different methodologies from literature review and expert consultations to community-based participatory approaches.(Reference Chakraborty29,Reference Chakraborty, Darak and Hinke30) At the community level, our data collection approaches focused on different interviewing techniques to draw a valid and complete list of capabilities for child growth in the context of Haor, Bangladesh. For example, in the first round of data collection, we employed a ‘doxastic interviewing technique’(Reference Berner-Rodoreda, Bärnighausen and Kennedy34,Reference Kvale35) by one-way discussions in which the interviewer mainly asks questions to the participant. However, in the second round we applied an ‘epistemic interviewing technique’ using visual tools that involves a two-way interaction between participants and researchers to co-construct knowledge.(Reference Berner-Rodoreda, Bärnighausen and Kennedy34,Reference Brinkmann36,Reference Curato37) The findings emphasised the importance of further assessment of the levels of achievement or deprivation for each of the capabilities and their associations with other factors to estimate the real opportunities that shaped the design of the quantitative research for the operationalisation of MICG in other contexts.
The application of the capability lens in southeastern Tanzania showed that capabilities for child growth emerge from parents’ emic understandings of what it means for a child to grow well in their context.(Reference Mchome38) Drawing on ethnographic enquiry, in-depth interviews, and participatory approaches, these studies identify locally valued dimensions of growth and the contextual factors shaping them.
At the child level, parents emphasised the capability to remain free from serious illness – while accepting that ‘normal fevers’ form part of everyday childhood – as well as the capability to eat well, stay cheerful, and engage in play.(Reference Mchome, Bailey and Darak39) Bodily appearance, including chubbiness (‘bonge’), skin and hair quality, and general liveliness, served as indicators of healthy growth. Parents assessed growth holistically, combining weight, height, appetite, energy levels, and developmental milestones. This multidimensional view became especially visible in their conceptualisation of height. While height was recognised as one aspect of growth, caregivers distinguished between hereditary shortness and a broader set of signs associated with stunting. A child could be tall yet considered ‘stunted’ if thinness, delayed milestones, poor hair or skin, or reduced activity were present.(Reference Mchome, Bailey, Darak and Haisma40) Thus, linear growth alone did not capture the capability set associated with child wellbeing.
At the mother’s level, the capability to feed the child, maintain personal health, and secure adequate nutrition emerged as central.(Reference Mchome, Yousefzadeh, Bailey and Haisma41) Mothers reported that heavy workloads, seasonal agricultural demands, and limited rest affected breastfeeding practices and the time available for childcare. Their capabilities were also shaped by constraints around decision-making power, limited access to income, and restricted autonomy in seeking healthcare. Gender norms and household structures played key roles in shaping these capability deprivations. Mothers who lacked control over food resources or support from spouses described difficulties in consistently providing the forms of care they valued.
At the father’s level, the studies highlight the capability to support maternal and child health by providing financial resources, facilitating access to medical services, and contributing to household food security.(Reference Mchome38,Reference Mchome, Yousefzadeh, Bailey and Haisma41) Fathers’ behaviour – whether supportive or neglectful – acted as a conversion factor influencing mothers’ capability to feed, rest, and seek treatment for the child. When fathers struggled with unstable income, alcohol use, or divided commitments (e.g. in polygamous arrangements), maternal capabilities were reduced, limiting the opportunities available for children’s healthy growth.
At the household and community level, socio-cultural norms further shaped capabilities. The postpartum sex taboos explored by Mchome and colleagues revealed how growth is embedded within moral frameworks connecting parental behaviour with child wellbeing.(Reference Mchome, Bailey and Kessy42) Adhering to postpartum abstinence was perceived as essential for protecting child growth, and deviations were believed to result in growth-related harm requiring traditional forms of treatment. These norms operated as part of the local reasoning around growth, influencing how parents interpreted risk, sought care, and responded to early signs of growth problems.
Taken together, the studies of Mchome et al. illustrate that capabilities for child growth in southeastern Tanzania are distributed across multiple actors – children, mothers, fathers – and embedded within a broader socio-cultural and environmental context.(Reference Mchome38–Reference Mchome, Bailey and Kessy42) Child growth is evaluated through a composite of physical, behavioural, aesthetic, and developmental signs shaped through local knowledge systems, rather than through biomedical indicators alone. These insights highlight the value of identifying child growth capabilities through participatory and context-sensitive approaches and offer essential guidance for operationalising multidimensional child growth in capability-informed frameworks in other settings.
Extensive literature indicates which dimensions are relevant for a MICG. Nussbaum(Reference Nussbaum43) identified core physical and non-physical dimensions for adult wellbeing that should be considered in the capability approach. These dimensions include physical dimensions like life, body health and body integrity, and non-physical dimensions such as senses, imagination, thought, emotions, and playful activities. In the case of children, the synergy between physical and non-physical dimensions implies, for example, that children who are unable to attend school due to being malnourished will have lower opportunities to be adequately educated. Prior work by Biggeri et al.(Reference Biggeri, Libanora, Mariani and Menchini44) suggested 14 dimensions for child wellbeing based on the Convention of the Rights of the Child: life and physical health, bodily integrity and safety, love and care, leisure activities, respect, social relations, participation, mental wellbeing, education, freedom from economic and non-economic exploitation, environment (internal and external risks), religion and identity, time autonomy, and ease of mobility to education or health centres. These 14 dimensions were discussed and prioritised by children during the first ‘Children’s World Congress on Child Labor’ that was held in Florence (Italy) in May of 2004 (see Biggeri et al.(Reference Biggeri, Libanora, Mariani and Menchini44)). Children from all continents participated in discussions and activities at this conference. The children were selected with a balance of girls and boys aged between 10 and 17 years, and the selection of the participants was made by the children themselves through a fair and democratic process during national and regional consultations intended to avoid any kind of discrimination. The child delegates were not expected to be considered representative of all the world’s children, but the sample is considered both selective and of high quality, because children acquired a high level of consciousness through their participation in NGO activities and their life experiences as former child labourers and activists, which helped them to better understand children’s wishes concerning how their life should progress. For the operationalisation of MICG as an index, we included the 14 dimensions of child wellbeing. Data on relevant indicators for multidimensional child growth on each of those dimensions need to be either collected through primary data collection or selected from a suitable database. As children’s opportunities and achievements depend on parental attitudes and the children’s environment, these are included as part of the MICG indicators.
During the proof-of-concept prototype, the next step in the operationalisation of MICG was the identification of a suitable database to apply our approach at population level. In order to have variables that properly capture all the multiple dimensions of child growth, we identified the YLS as a database that is sufficiently rich to capture children’s opportunities in the 14 dimensions. The participants of the YLS were a younger cohort of 2000 children per country, aged 6–18 months in 2002, and an older cohort of 1000 children per country, aged 7.5–8.5 years in 2002. The YLS (Round 2) used in this study has cross-sectional information on a cohort of children aged 5 years old living in regions of Ethiopia, Peru, Vietnam, and Andhra Pradesh and Telangana in India, including contextual information of the children’s environment and parental attitudes that affect child growth in physical and non-physical dimensions. The Round 2 survey applied several questionnaires tailored for different age groups and contexts: a questionnaire applied to young children (aged 5 years old), a household questionnaire applied to parents and caregivers, and a community questionnaire applied to stakeholders. The questionnaire applied to young children included sections on parental background, household education, livelihoods, food and non-food consumption, social capital, socio--economic status, childcare, education, health, anthropometry, and caregiver attitudes, school activities, social networks, feelings and attitudes, and future perceptions. The household and community questionnaire captured general characteristics of the households where children live, the localities, social environment, access to services, and specific child-related modules on education and health services. The setting of the YLS was based on locating sentinel sites where surveillance systems were implemented to collect data about the development of children in Ethiopia, India (Andhra Pradesh), Peru, and Vietnam. The sentinel system was designed to gather high-quality, representative data over time, ensuring the sustainability and accuracy of the longitudinal study. Sentinel sites were chosen to ensure a balanced representation of regional diversity and rural/urban differences in heterogeneous agroclimatic areas, with a pro-poor bias aimed to reflect the plurality of socio-economic status. The aim was to analyse how the living standards and characteristics of the Young Lives children compare with other children, ensuring that different levels of living standards are represented within the dataset. The sampling methodology was based on a multi-stage, purposive sampling to select cohorts of children. Purposive sampling is a selective, subjective, non-probability sampling technique where locations are selected based on judgements about which elements will be the most useful for the goals of the study. This method is useful to gain specific insights and particular characteristics of a phenomenon that is not evenly distributed across the population. This sampling method is more useful when in-depth understanding is more considered valuable than generalisability.
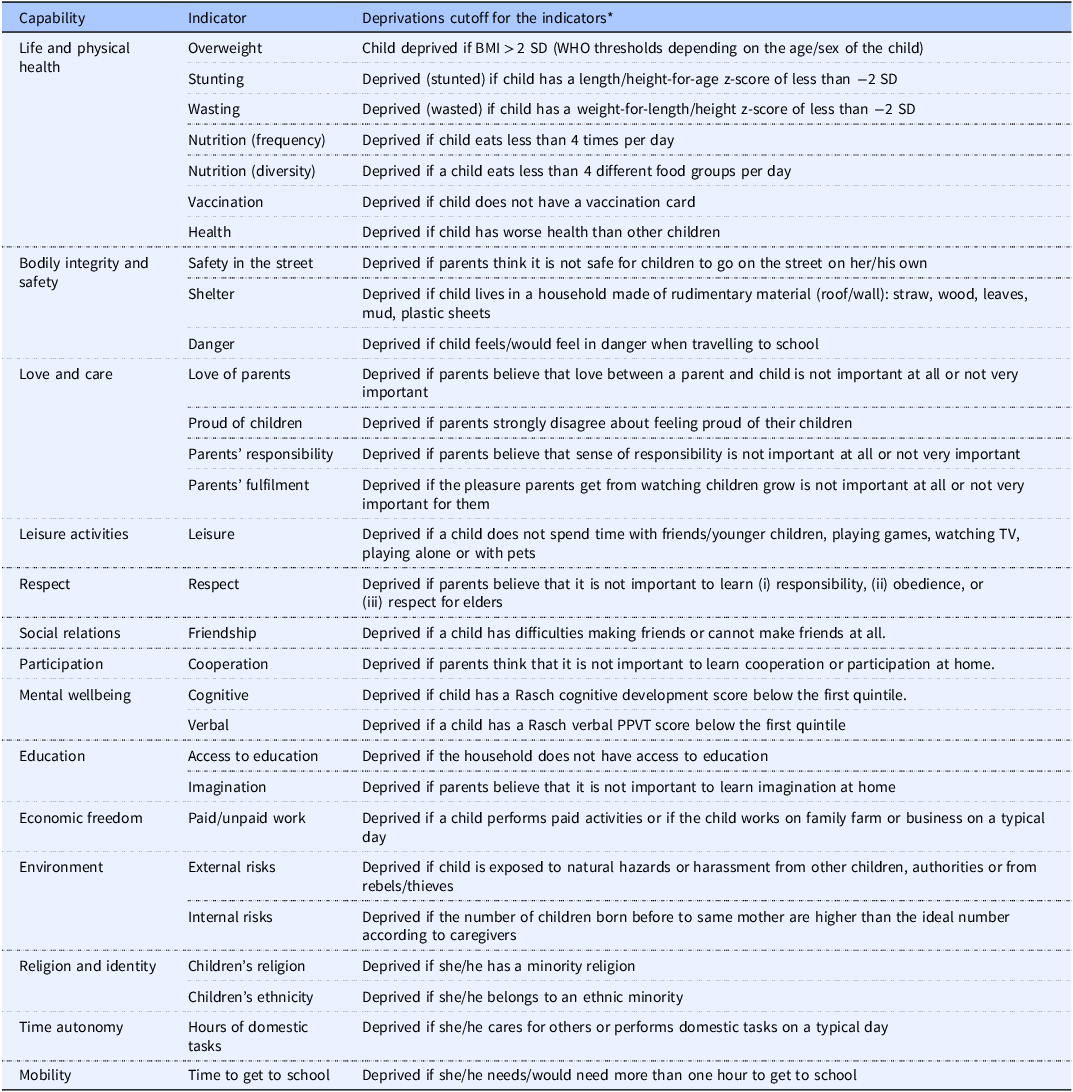
Table 1 below shows the 29 indicators used to measure the 14 dimensions of the MICG and provides the complete list of cut-offs that define a child as deprived for each indicator. To build these indicators, relevant questions from the Young Lives Survey (YLS) were first identified and matched to each dimension of the MICG. For instance, for the dimension of life and physical health, questions on anthropometry (height, weight, and age of the child) were used to derive stunting, wasting, and overweight indicators, while questions on dietary recall and food group consumption informed the indicators of nutrition frequency and diversity. Similarly, household survey items on shelter materials, access to education, time spent on domestic chores, and parental attitudes towards children were mapped to the respective dimensions of bodily integrity, access to education, time autonomy, and love and care. The non-physical indicators of MICG account for the attitude of parents towards caregiving, cognitive and verbal development of children, domestic tasks in the household, and the internal and external risks that affect a child’s safety, among other indicators.
Indicators included in the Multidimensional Index of Child Growth (MICG) based on the availability of information from the Young Lives Survey (Round 2)
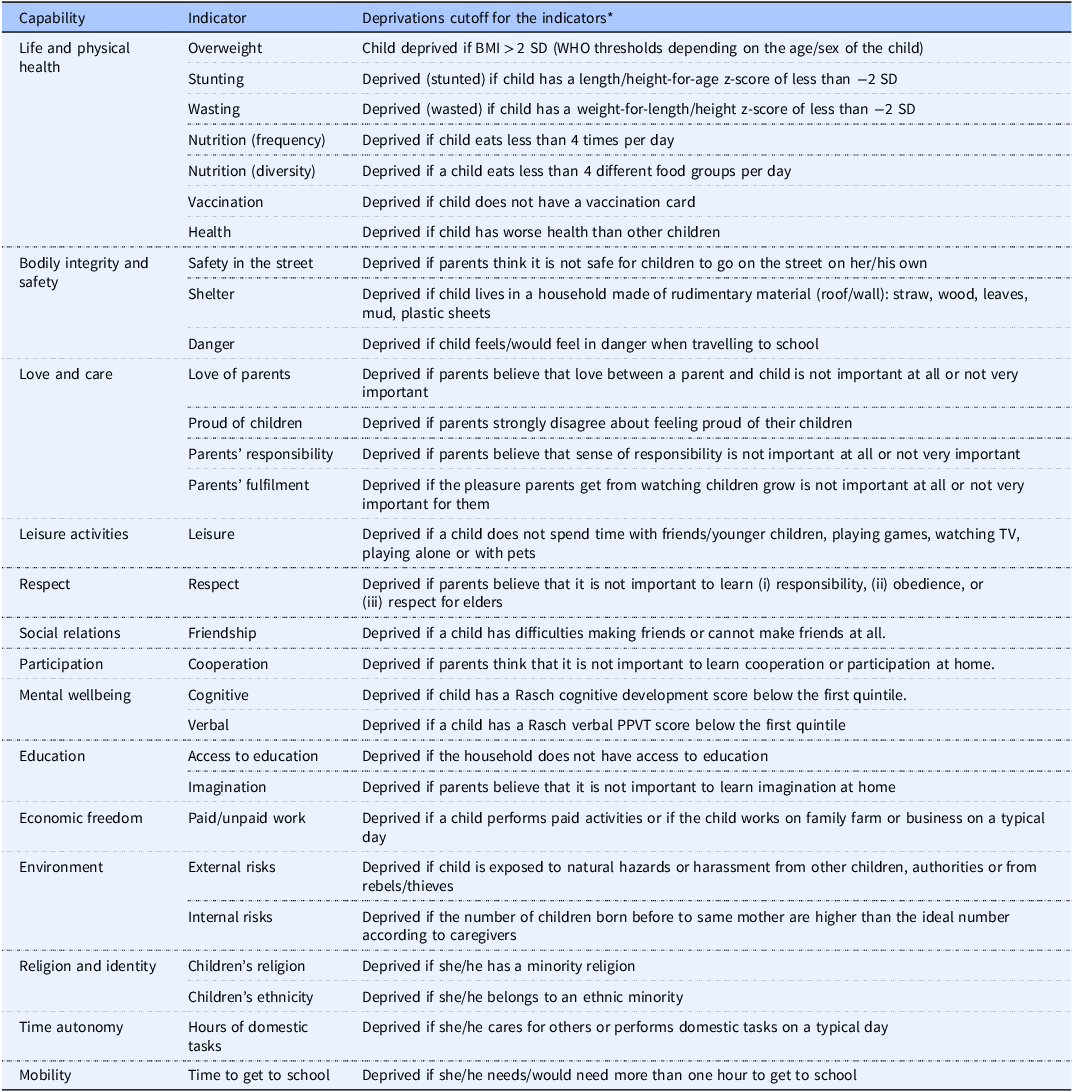
Table 1 Long description
Panel A: A table listing indicators and deprivation cutoffs for measuring child well-being across various dimensions. The table includes columns for Capability, Indicator, and Deprivations cutoff for the indicators. Each row details specific indicators such as Overweight, Stunting, Wasting, Nutrition (frequency and diversity), Vaccination, Health, Safety in the street, Shelter, Danger, Love of parents, Proud of children, Parents’ responsibility, Parents’ fulfillment, Leisure, Respect, Friendship, Cooperation, Cognitive, Verbal, Access to education, Imagination, Paid/unpaid work, External risks, Internal risks, Children’s religion, Children’s ethnicity, Hours of domestic tasks, and Time to get to school. Each indicator has a corresponding deprivation cutoff that defines a child as deprived.
(*) The cut-offs were chosen based on international standards (e.g. 2-standard deviations) and informative discussions with experts in nutrition and non-physical child growth.
Cut-offs used to identify deprived children were calculated based on international standards(25) and informative discussions with experts in nutrition and non-physical child growth. For example, a child is considered stunted if his or her height-for-age z-score is less than –2 SD, wasted if the weight-for-length/height z-score is less than –2 SD, and deprived of education if the household does not have access to schooling. Likewise, a child is classified as deprived of safety if parents report that it is not safe for the child to go to school or play on the street. These cut-offs combine international norms with context-specific questions from the YLS, ensuring that both physical and non-physical aspects of child growth are captured in a multidimensional framework.
After identifying and coding the 29 indicators, these were aggregated into the MICG following a counting approach inspired by the Alkire-Foster methodology.(Reference Alkire and Foster45) Each indicator was first coded as deprived (1) or non-deprived (0) using the cut-offs described in Table 1. Indicators were then grouped under their corresponding 14 dimensions, and within each dimension, indicators were equally weighted so that the dimension carried the same importance regardless of the number of indicators it contained. Subsequently, each dimension was assigned an equal weight in the overall MICG, reflecting the multidimensional nature of child growth and ensuring that non-physical aspects such as love and care or social participation contributed on par with traditional anthropometric measures. A child was classified as multidimensionally deprived if their weighted deprivation score crossed a specified cut-off (e.g. one-third of the total weighted deprivations), consistent with international practice in multidimensional poverty and child wellbeing research. This procedure allowed us to move beyond a narrow reliance on physical growth indicators and instead capture the multiple, intersecting deprivations that shape children’s development.
After identifying all deprivations, a deprivation score is calculated as the weighted sum of indicators. The MICG is then expressed as one minus this weighted deprivation score, representing the child’s overall achievements. The weights for each indicator can be determined either endogenously or exogenously. Endogenous weights are derived statistically from the covariance structure of the data, while exogenous weights are based on normative judgements regarding the relative importance of each dimension.
A comparative analysis was performed to evaluate how sensitive the results are to the use of endogenous weights versus exogenous weights. Endogenous weights were obtained with binary principal component analysis and exogenous weights were chosen by using two weighting schemes: equal weights, and weights based on the preferences of children, since when children were asked what the most important opportunities for a child during her/his life are, they prioritised education and love and care over physical health. Figure 2a shows the kernel density of the MICG of Ethiopia obtained with the 3 different types of weights. Endogenous weights calculated with data produced a more dispersed index of child growth compared to exogenous weights.
(a) Kernel density of the MICG for Ethiopia with different weighting schemes. (b) Correlation matrix between the MICG estimates for Ethiopia with different weights.
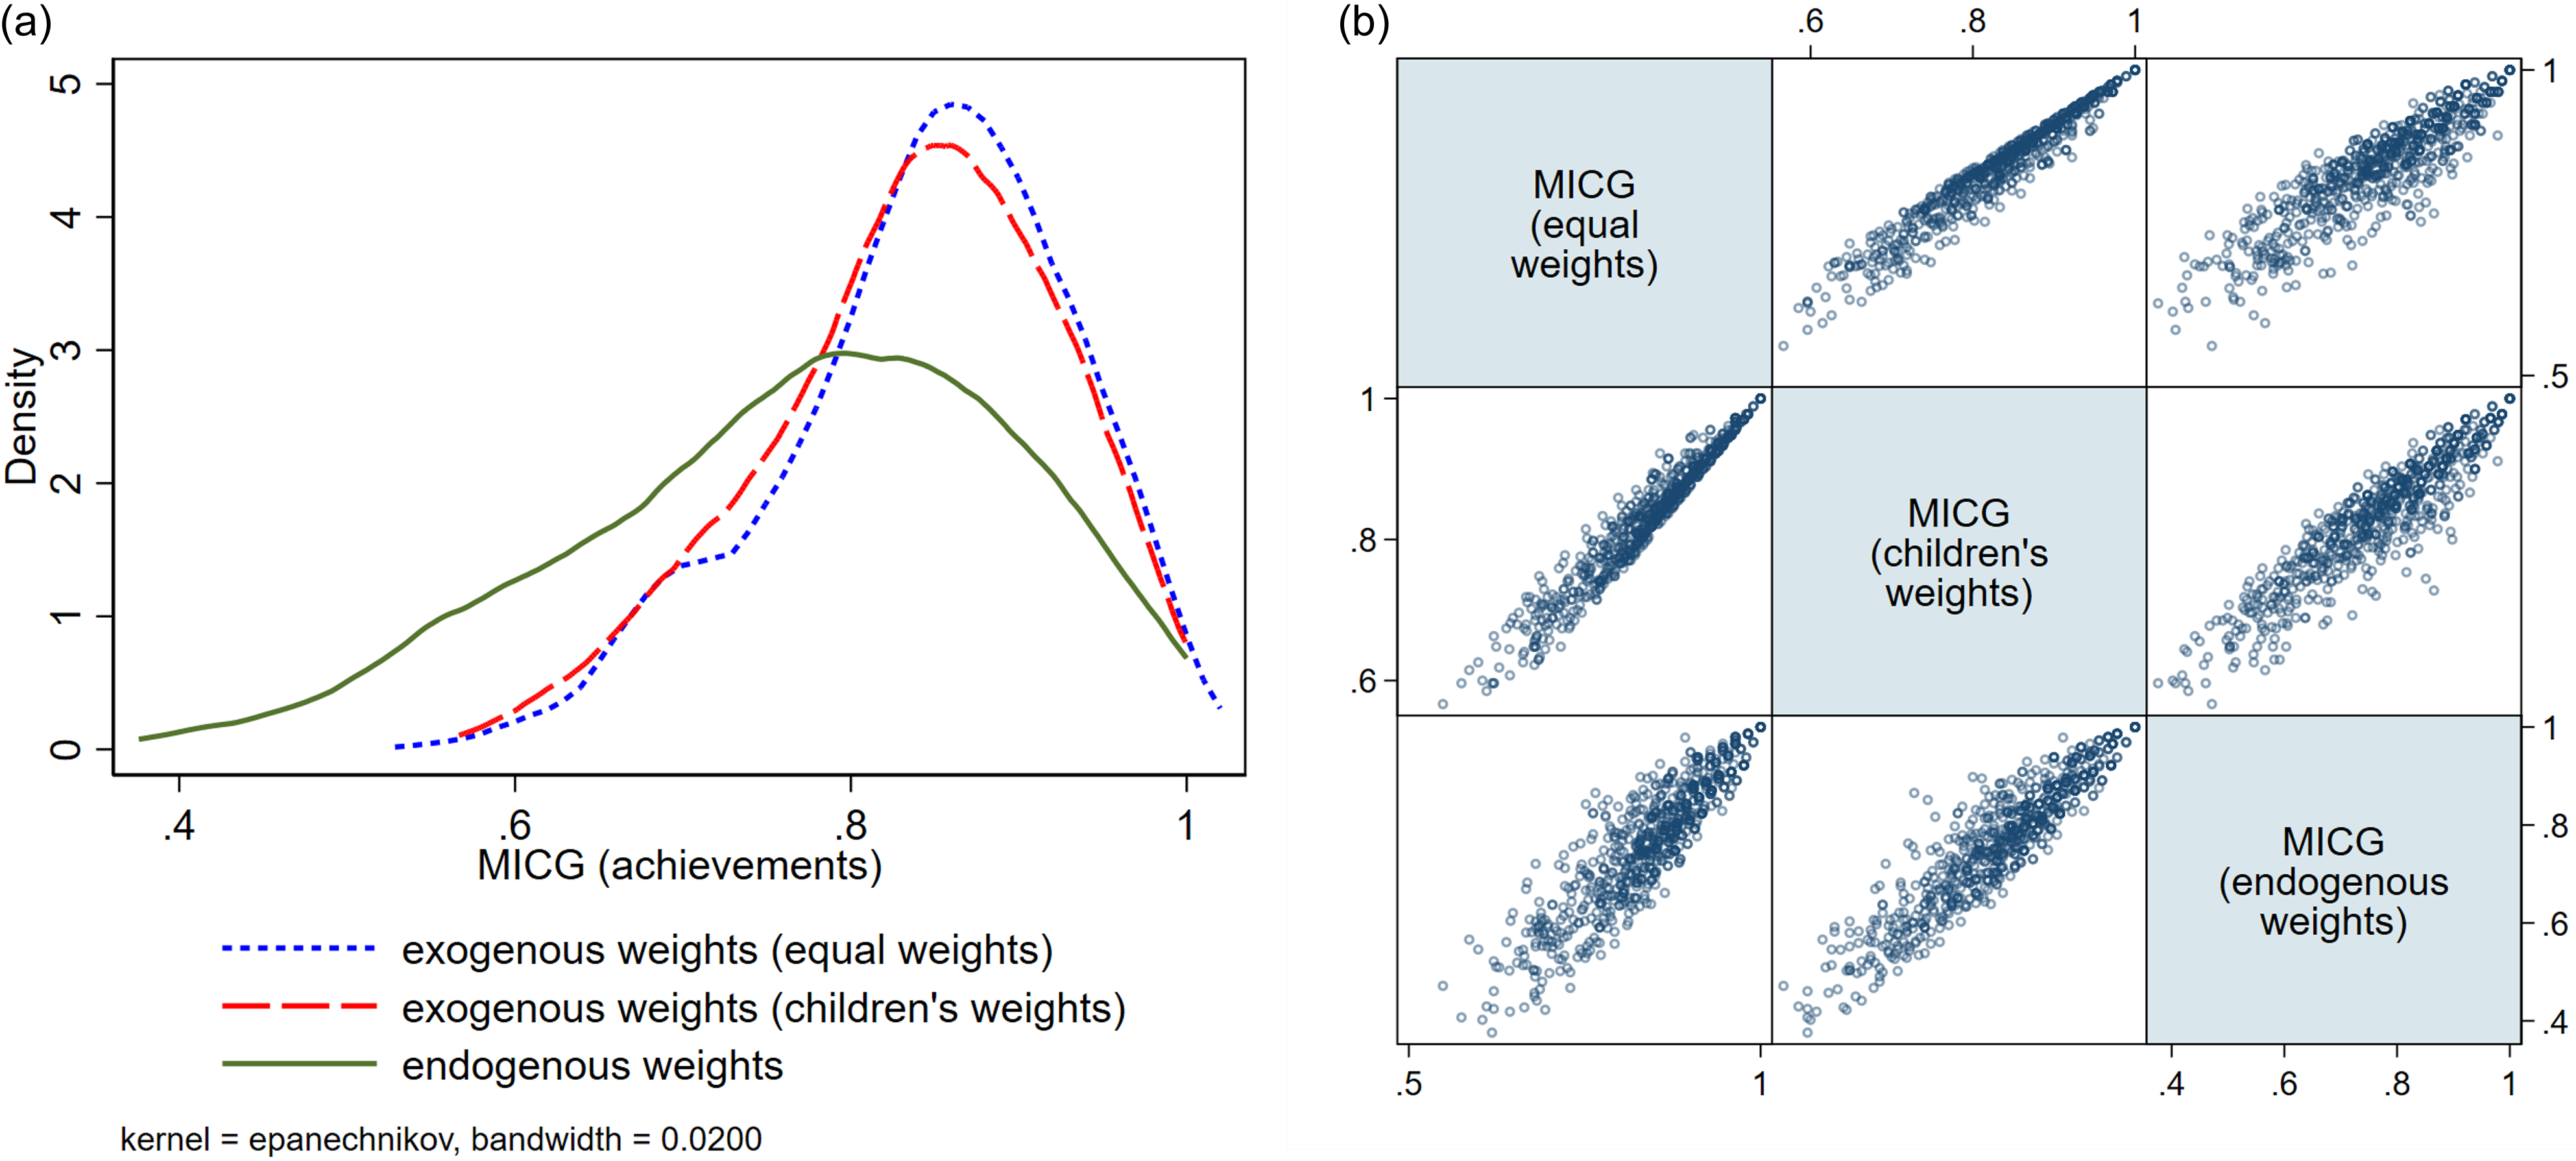
Figure 2b shows the correlation between the MICG estimates. The MICG calculated with endogenous weights is strongly correlated with the MICG calculated with exogenous weights chosen through a children’s participatory process (Spearman’s rank correlation = 0.91, P < 0.0001), but the highest correlation (Spearman’s rank correlation = 0.97, P < 0.0001) is obtained for a MICG calculated with equal weights and a MICG calculated with exogenous weights chosen by children. In consequence, applying equal weights is a robust strategy without a strong impact in the calculation of the aggregated index of child growth.
Additionally, since weights derived from statistical methods have been criticised for violating key properties of wellbeing indices such as monotonicity and subgroup consistency,(Reference Dutta, Nogales and Yalonetzky46) we assign equal (non-statistical) weights to each dimension in the results section. This choice is further justified by the fact that similar results were obtained when comparing endogenous weights derived from the data and exogenous weights informed by children’s perspectives. Because the 14 dimensions of the MICG are aligned with the United Nations Convention on the Rights of the Child, equal weighting reflects the principle that all children’s capabilities and rights are equally important. Consequently, dimensions with more indicators distribute their weight across several measures, while dimensions with fewer indicators allocate a larger share of weight to each indicator.
Figure 3 shows the spiderweb chart we designed to visualise the 14 dimensions of Multidimensional Child Growth (MICG). This framework, grounded in the work of Biggeri et al.,(Reference Biggeri, Libanora, Mariani and Menchini44) is informed by the Capability Approach and aligns closely with the Convention on the Rights of the Child (CRC). Additionally, the MICG framework aligns with international policy agendas such as the UN Sustainable Development Goals (SDGs), particularly SDG 3 (Good Health and Wellbeing), SDG 4 (Quality Education), SDG 10 (Reduced Inequalities), and SDG 16 (Peace, Justice, and Strong Institutions). It provides an actionable bridge between high-level human rights commitments and concrete, measurable outcomes that reflect child growth and the context in which a child thrives. We argue that this visualisation diagram can be used for monitoring multidimensional child growth at national level and individual level, in a similar way that WHO growth charts are used for monitoring the weight and length/height growth of children. The axes of the chart of multidimensional growth measure the percentage of achievements in each of the 14 dimensions of child growth, based on the indicators described in Table 1.
(a) Chart of anthropometric child growth from the WHO standards for monitoring physical child growth*. (*) The source of Figure 3a is the WHO child growth standards (see WHO, 2006, Figure 57, p. 124, weight-for-age percentiles for girls from birth to 60 months). (b) Multidimensional child-growth chart based on physical and non-physical dimensions.
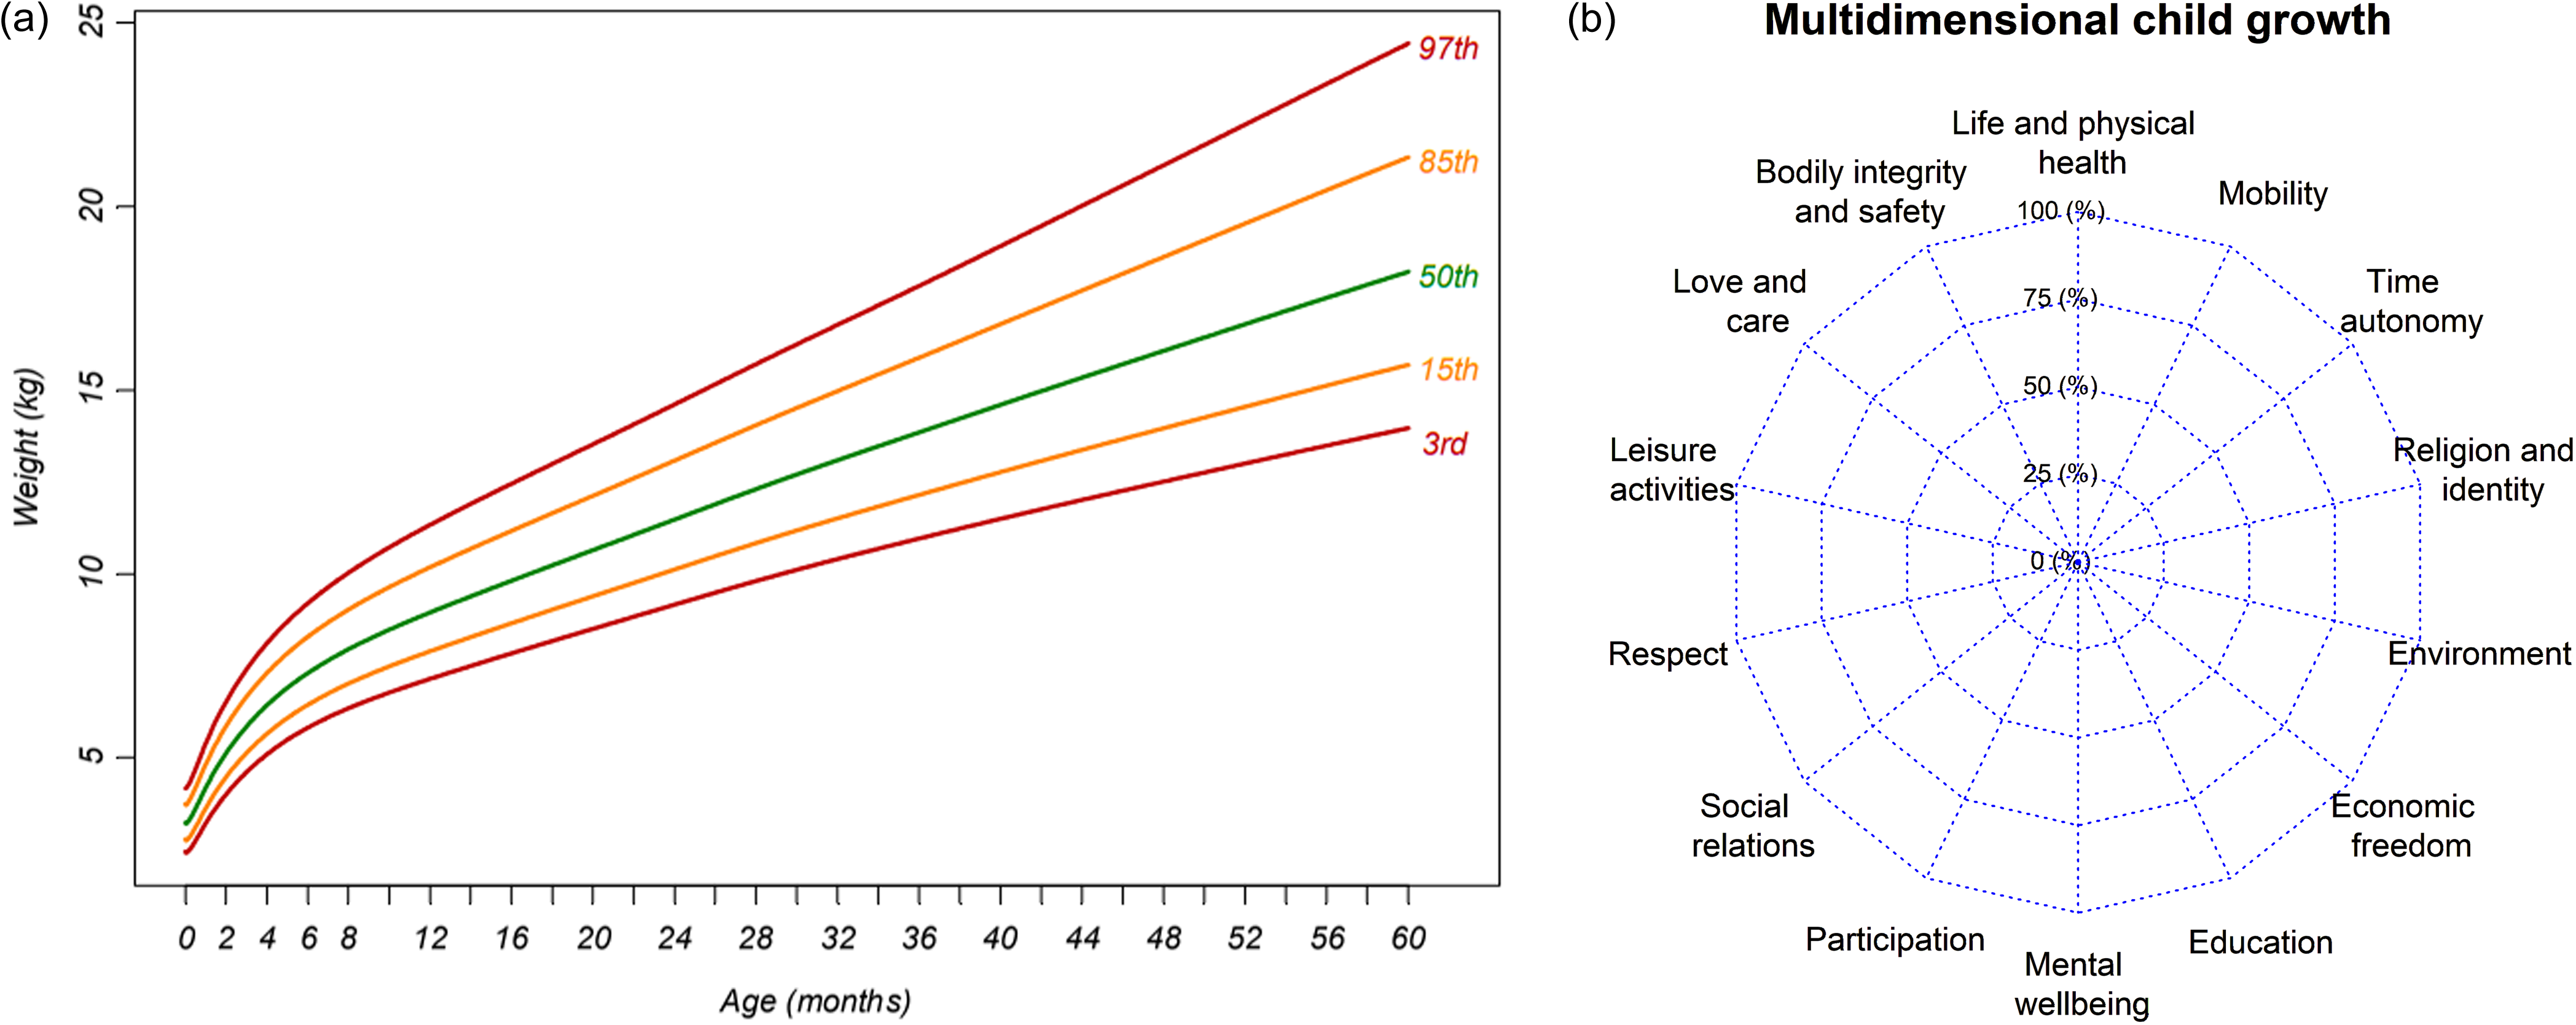
Figure 3 Long description
Panel A: A line graph displays weight in kilograms on the vertical axis and age in months on the horizontal axis. It includes multiple percentiles: 3rd, 15th, 50th, 85th, and 97th, each represented by differently colored lines. The lines show an upward trend, indicating that weight increases with age. Panel B: A radar chart illustrates multidimensional child growth, with axes representing various dimensions such as life and physical health, mobility, time autonomy, religion and identity, environment, economic freedom, education, mental wellbeing, participation, social relations, respect, leisure activities, love and care, bodily integrity and safety. Each axis is marked with percentage values ranging from 0 to 100 percent. The chart shows a balanced distribution across these dimensions.
Each axis in the spiderweb corresponds to a core dimension of child growth: Life and Physical Health, Mobility, Time Autonomy, Religion and Identity, Environment, Economic Freedom, Education, Mental Wellbeing, Participation, Social Relations, Respect, Leisure Activities, Love and Care, and Bodily Integrity and Safety. These dimensions reflect not only the instrumental conditions for physical and non-physical child growth but also intrinsic context-dependent environmental determinants of child growth. The values plotted along each axis are scaled from 0 to 100%, representing the degree of achievement or access in each domain, thereby enabling a comparative, profile-based interpretation.
From an academic standpoint, this visualisation addresses long-standing challenges in child development research, particularly the difficulty of integrating qualitative, experiential dimensions with measurable, policy-relevant indicators. The MICG framework moves beyond reductionist monitoring and evaluation of child growth based on anthropometrics and foregrounds children’s agency, subjectivity, and contextual embeddedness. It reflects an ontological shift from viewing children as passive recipients of goods and services to recognising them as active social agents with their own evolving capabilities.
The spiderweb visualisation also serves as a heuristic for identifying synergistic or compensatory relationships among dimensions. For instance, limitations in ‘Economic Freedom’ may co-exist with high ‘Love and Care’ or ‘Social Relations’, which may buffer some of the adverse effects. Conversely, deficiencies in ‘Respect’ or ‘Bodily Integrity and Safety’ may have cross-cutting implications for other dimensions, such as mental health or participation. Thus, the framework invites complex systems thinking, highlighting feedback loops and threshold effects that traditional linear models may overlook. Moreover, the inclusion of dimensions such as ‘Religion and Identity’ and ‘Time Autonomy’ expands the epistemic boundaries of dominant development paradigms by incorporating cultural, emotional, and temporal freedoms, which are often marginalised in both academic metrics and global indices. Contextualisation is needed to properly create questions and instruments that reflect and capture in a similar way the different concepts (such as love and care) in different contexts. Contextualisation is also crucial as the structural flaws could seriously limit parents and caregivers’ ability to fulfil children’s safety or dignity. For example, human-made famine or war are struggles that are often beyond parents’ ability to address and protect their children’s safety, dignity or nutritional needs.
For policymakers working on health and nutrition interventions, the spiderweb offers a strategic tool for diagnostic assessment, resource allocation, and monitoring. It enables stakeholders to visualise areas of underperformance and strength across a range of wellbeing domains and to identify where integrated interventions might yield the greatest impact, across multiple micro-, meso- and macro-levels. For example, persistent deficits in ‘Mobility’ or ‘Time Autonomy’ may suggest the need for child-friendly urban planning or more flexible schooling schedules, whereas gaps in ‘Mental Wellbeing’ might point to the urgency of scaling up psychosocial support services in schools and communities. It provides an integrative lens that bridges academic inquiry and policy implementation, empowering stakeholders to pursue holistic, context-sensitive, and justice-oriented interventions in support of children’s flourishing.
Finally, a methodological concern when assessing multidimensional child growth is the focus on realised and observable outcomes – such as being vaccinated – rather than on the underlying potentialities that are central to the concept of capability. This limitation makes it difficult to capture the full range of freedoms and opportunities that children may or may not have access to, since the MICG measures the achievements of children with observed indicators, with achievements being equal to the observed situation of children.
To address the previous limitation, and with the aim of properly measuring the opportunities available to children – that is, their potential child growth above or below their achievements –, Bayesian stochastic frontier analysis was applied to the MICG based on the approach of Henderson and Follett.(Reference Henderson and Follett47) The Bayesian model estimates potential alternative values of multidimensional child growth that could be negatively or positively affected by children’s observed characteristics. We chose to use geographical location and sex as discriminating characteristics, besides random circumstances that affect the achievements measured by the MICG. Specific children that could be left behind are those with the lowest opportunities for physical and non-physical growth; that is, those children that have the lowest estimated values of the potential MICG.
Figure 4 below illustrates the Bayesian extension of the Multidimensional Index of Child Growth (MICG), transitioning the focus from achievements (outcomes) to opportunities. The horizontal axis (MICG) represents the achievements of children based on their observed physical and non-physical conditions. These are direct measurements (e.g. health, cognitive scores, safety perception). Each curve in the vertical axes represents an individual child (in this case 10 children), and the probability density functions reflect their estimated opportunity of child growth, that is, the probability of achieving a specific outcome. Densities closer to a MICG equal to one reflects higher estimated opportunities for multidimensional growth, while density curves close to a MICG equal to zero indicate lower opportunities to achieve desired outcomes. These opportunities (i.e. capabilities) are derived using Bayesian stochastic frontier analysis.
Bayesian extension of the Multidimensional Index of Child Growth.
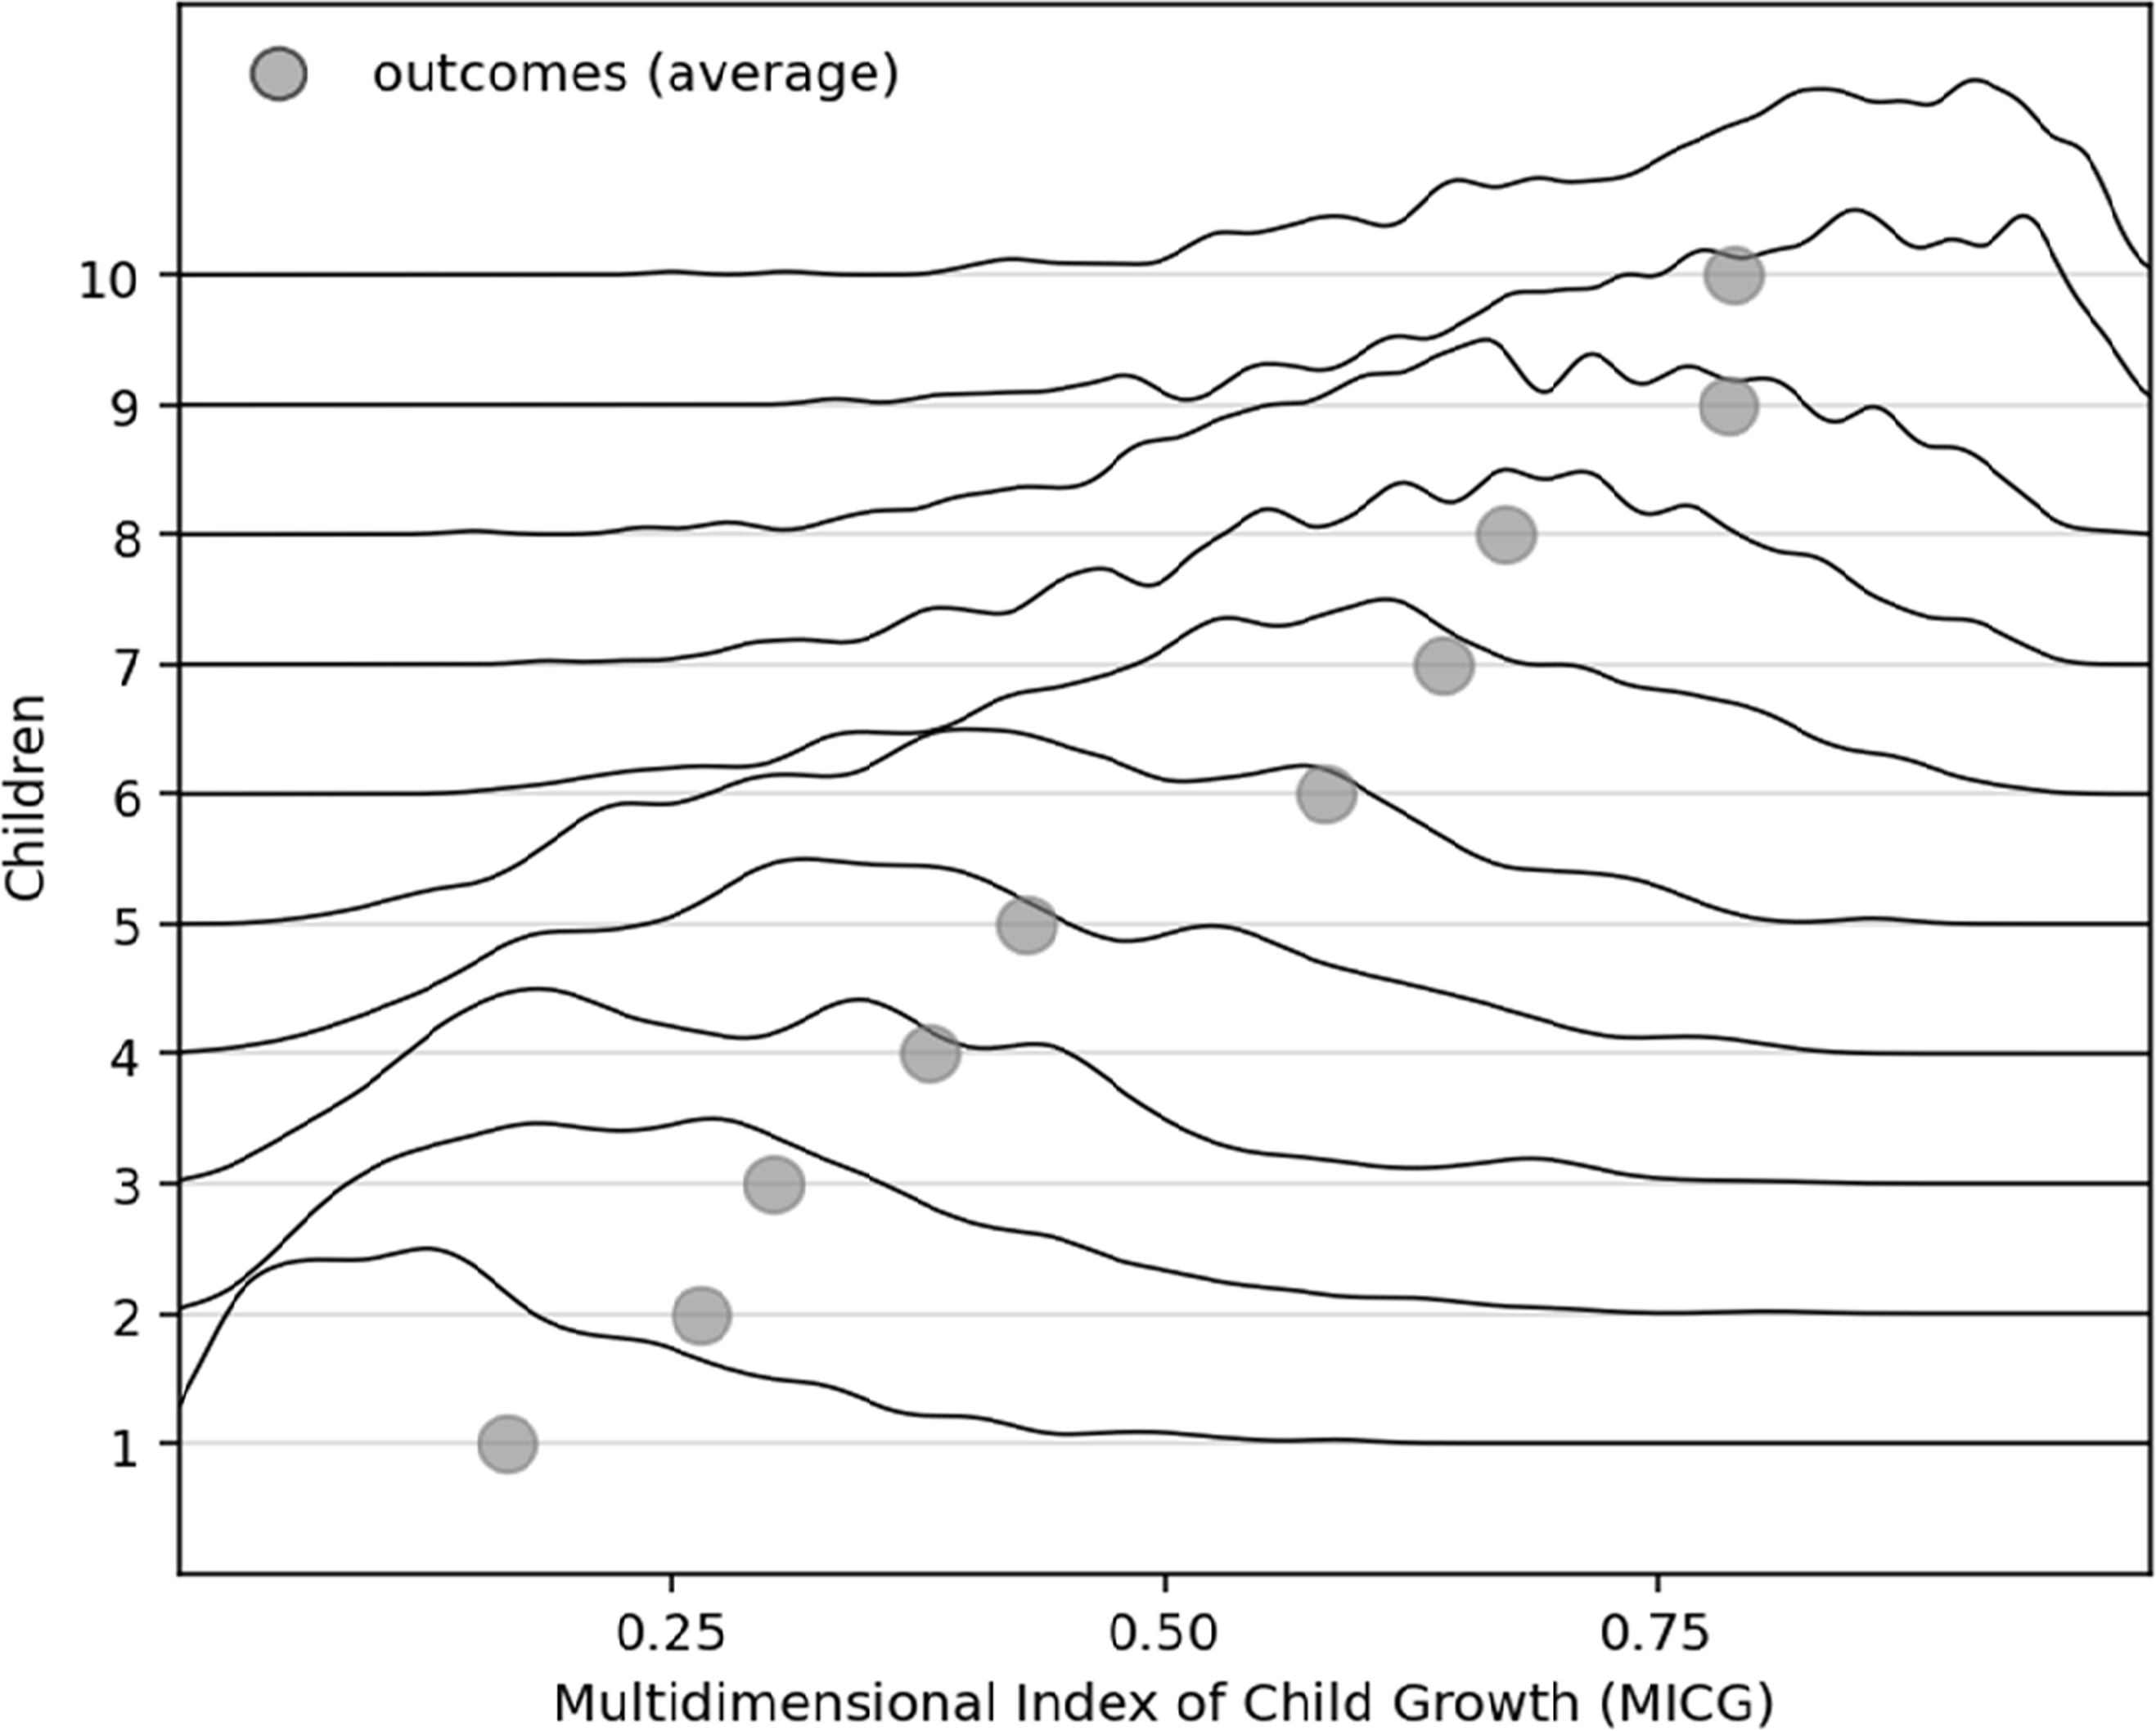
The grey dot on each curve marks the actual multidimensional achievement of each child. It’s where they currently stand in terms of growth. Compared to observed achievements, the Bayesian estimation of opportunities provides a counterfactual frontier that reflects the level of multidimensional growth each child could theoretically achieve under different circumstances. Based on the capability framework, the core idea of applying a Bayesian extension is that while two children might have the same achievements, their latent opportunities – their potential to grow physically, emotionally, and cognitively – may differ drastically. The Bayesian extension of the MICG thus allows identifying children that could be “left behind” not just in actual outcomes, but in unrealised potential.
Proof-of-concept: Prototypes of MICG at macro-, meso-, and micro-level
Macro-level: Using the MICG at population level for comparisons between countries
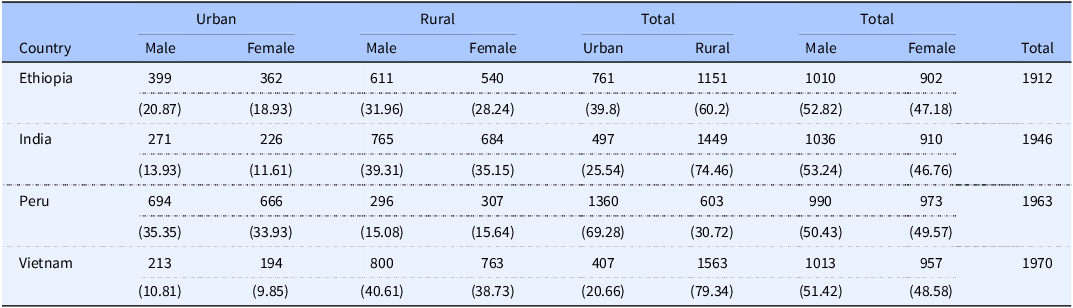
We calculated an MICG to identify physical and non-physical deprivations experienced by 5-year-old children living in Ethiopia, Vietnam, India, and Peru. In the YLS, the proportion of female and male children was similar in Ethiopia, Peru, Vietnam and Andhra Pradesh and Telangana in India (Table 2), but the percentage of rural children was higher in Ethiopia (60%), Andhra Pradesh and Telangana in India (74%) and Vietnam (79%), compared to Peru (31%).
Frequency distribution of children in the Young Lives Survey, by sex and region (urban/rural)*
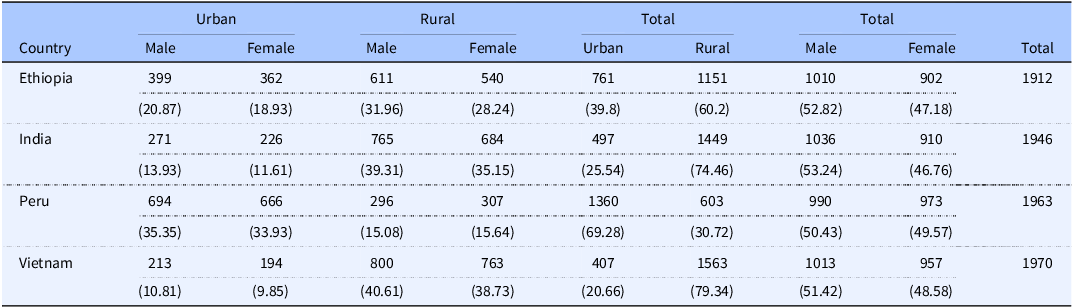
Table 2 Long description
The table presents the frequency distribution of children in the Young Lives Survey, categorized by sex and region (urban/rural) for Ethiopia, India, Peru, and Vietnam. It includes data for male and female children in urban and rural areas, as well as totals for each category. The table has 4 rows and 13 columns. Column headers are: Country, Urban Male, Urban Female, Rural Male, Rural Female, Total Urban, Total Rural, Total Male, Total Female, and Total. Row labels are: Ethiopia, India, Peru, and Vietnam. Each row provides specific values for the respective country. For Ethiopia: Urban Male: 399, Urban Female: 362, Rural Male: 611, Rural Female: 540, Total Urban: 761, Total Rural: 1151, Total Male: 1010, Total Female: 902, Total: 1912. For India: Urban Male: 271, Urban Female: 226, Rural Male: 765, Rural Female: 684, Total Urban: 497, Total Rural: 1449, Total Male: 1036, Total Female: 910, Total: 1946. For Peru: Urban Male: 694, Urban Female: 666, Rural Male: 296, Rural Female: 307, Total Urban: 1360, Total Rural: 603, Total Male: 990, Total Female: 973, Total: 1963. For Vietnam: Urban Male: 213, Urban Female: 194, Rural Male: 800, Rural Female: 763, Total Urban: 407, Total Rural: 1563, Total Male: 1013, Total Female: 957, Total: 1970.
(*) Percentages of total below each frequency.
Figure 5 shows the multidimensional achievements of children in the 14 dimensions of physical and non-physical growth. Compared to their rural peers, children in urban areas of Ethiopia and Peru had more economic freedom from paid and unpaid work and more time autonomy from domestic tasks, as well as improved physical health. In Vietnam, urban children had higher achievements in cognitive and verbal development compared to rural children.
Percentage of children with achievements in each dimension of child growth.
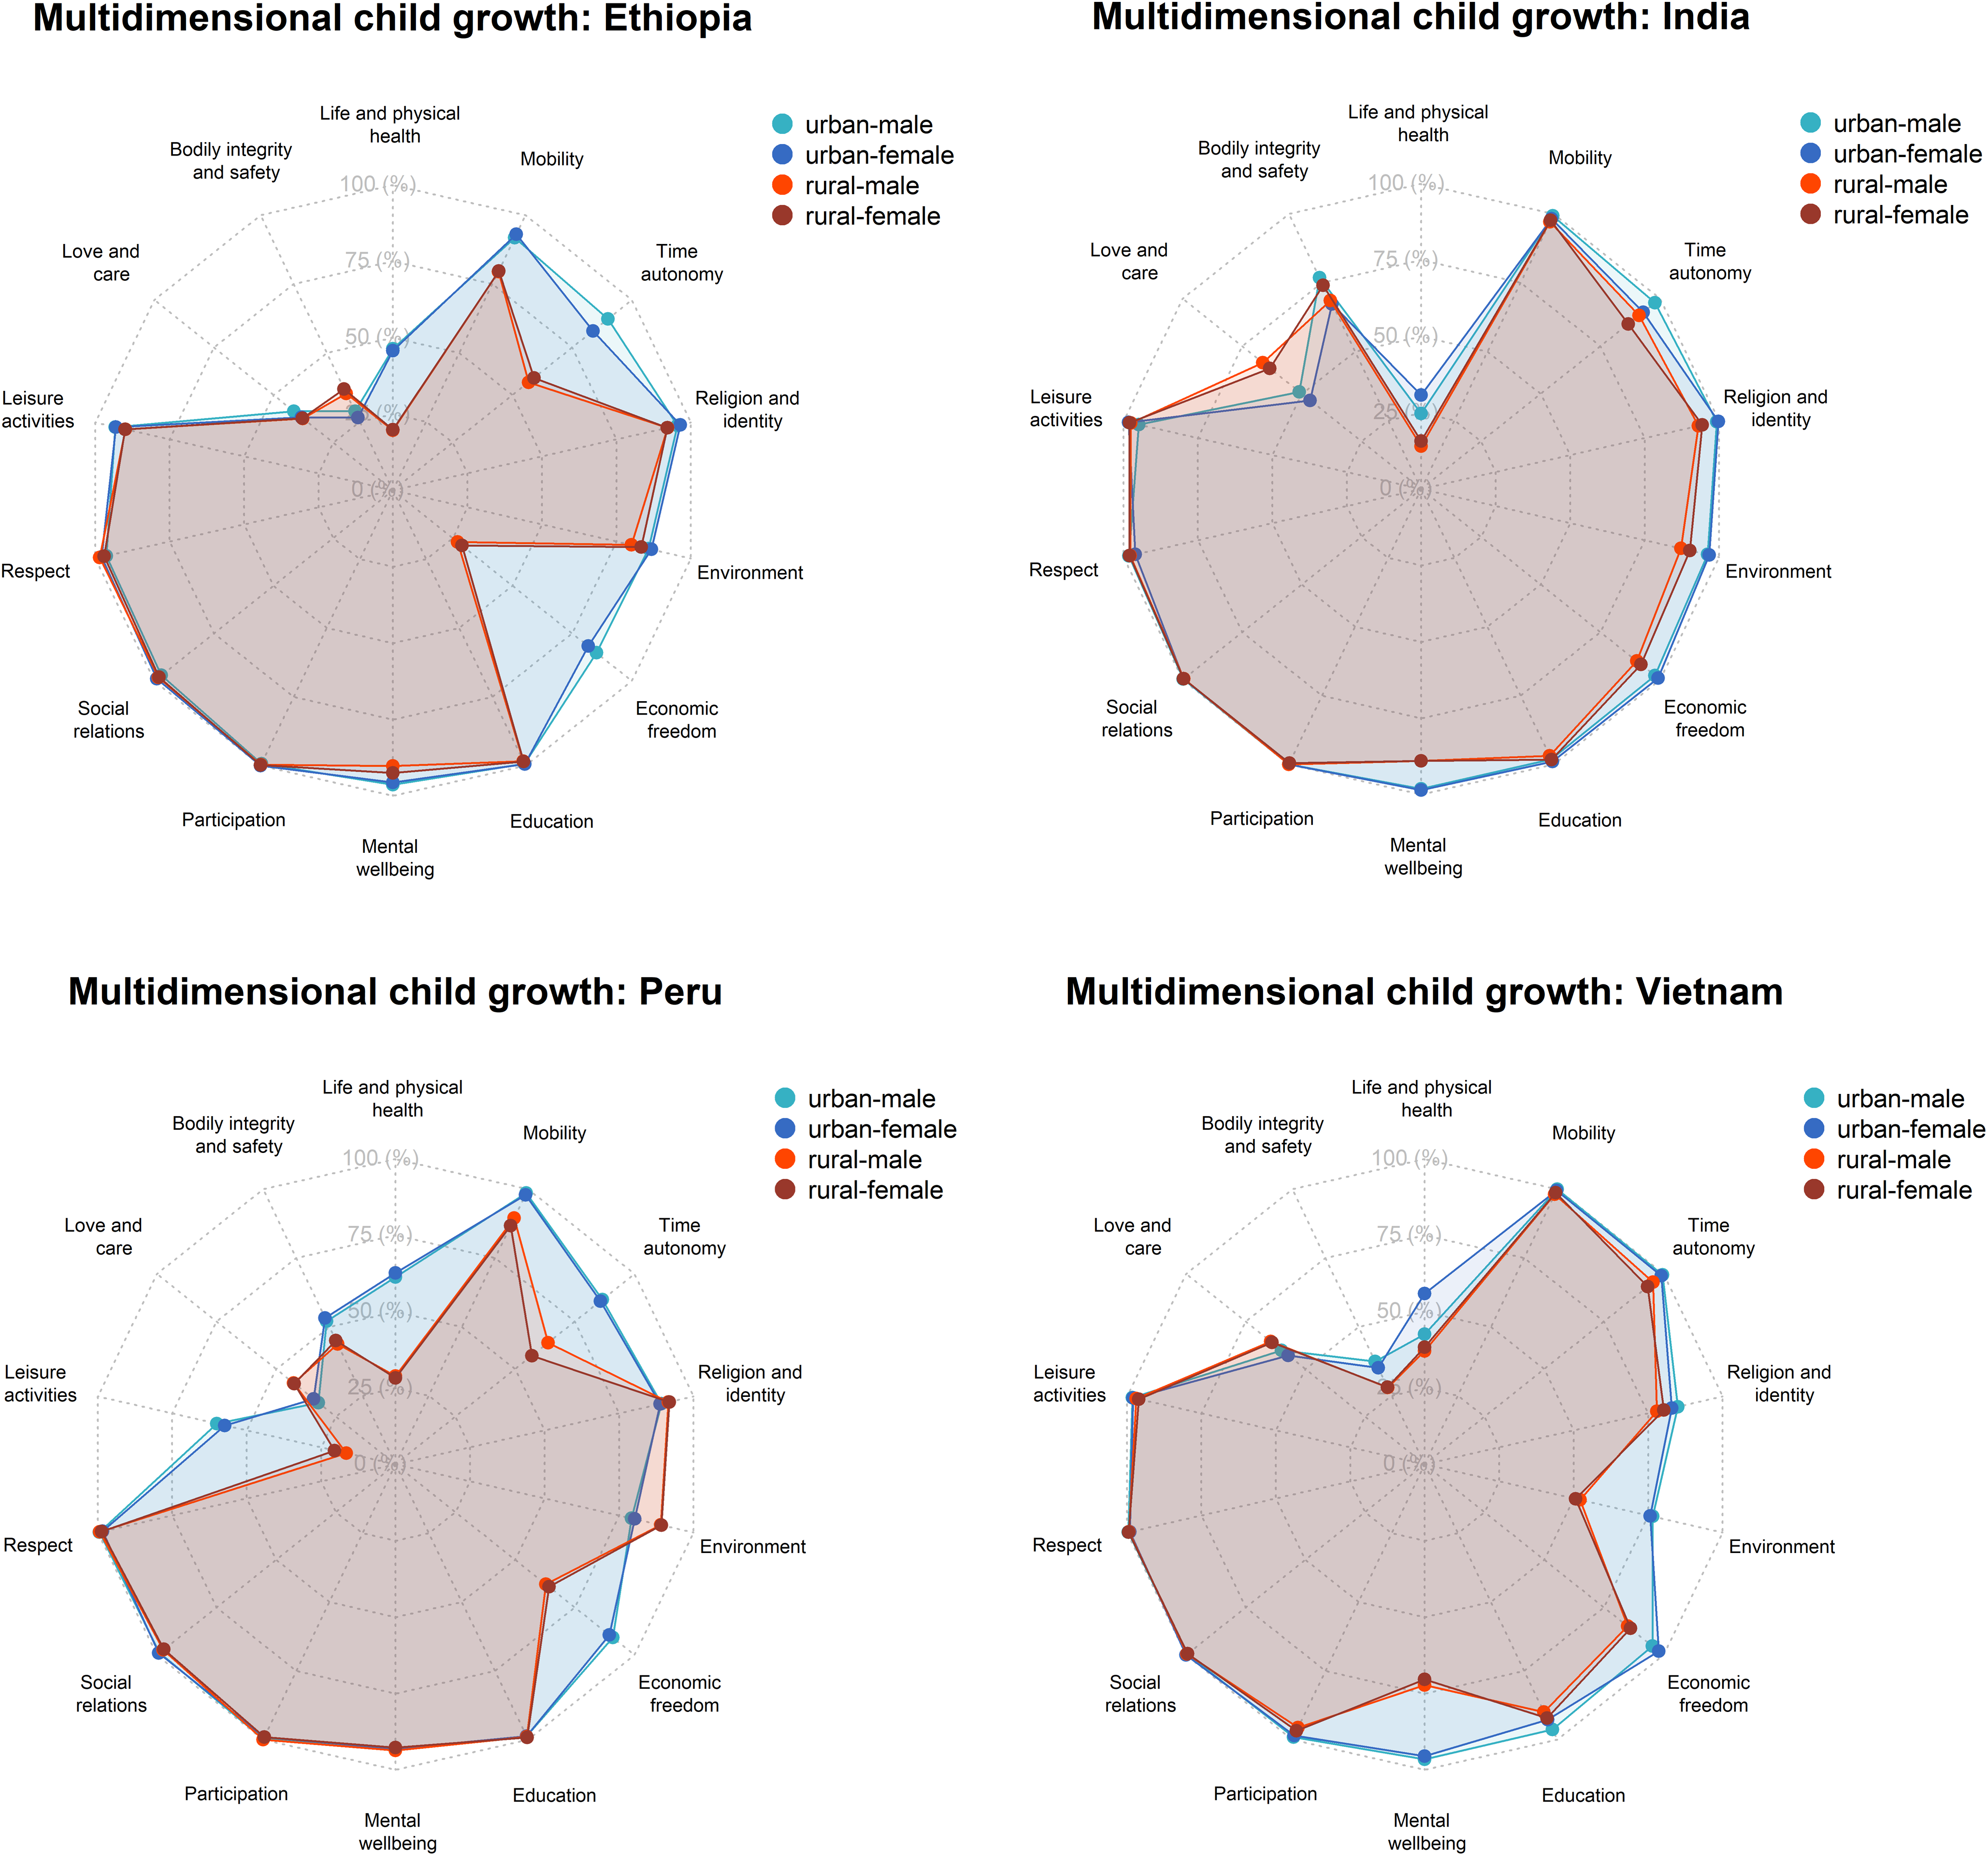
When comparing countries, children in Peru and Ethiopia were better off than their peers in Vietnam and India (Andhra Pradesh and Telangana), in the dimensions related to responsibility, obedience, and respect for elders, social relations with friends, mental wellbeing, and participation and cooperation at home. However, they were deprived of safety at home and in the streets, which can indirectly affect their survival. Compared to the other countries, children in Andhra Pradesh and Telangana of India were the most deprived in the life and physical health dimension, which includes anthropometric dimensions, nutrition, and health indicators.
In Peru, rural girls (red dots) experience the most acute deprivations across nearly all dimensions, particularly in education, mental wellbeing, economic freedom, and mobility. Their MICG profile shows the most contracted pattern, indicating a pervasive lack of opportunities and support. Rural boys (red triangles) show slightly better outcomes than rural girls but still fall significantly behind their urban peers. Notably, they also experience severe deficits in participation, social relations, and bodily integrity and safety. In contrast, urban boys (light blue circles) perform better across nearly all indicators, particularly in mobility, time autonomy, and education. Their overall MICG profile is more expanded, suggesting greater access to enabling environments and institutional support. Urban girls (light blue squares) show relatively high achievements in mental wellbeing, participation, and respect, though their scores in economic freedom and bodily integrity suggest that gender-based constraints persist even in urban settings.
These multidimensional patterns point to complex interactions between structural factors – such as urban infrastructure, access to education, economic opportunities – and cultural norms related to gender and childhood. The markedly low levels of participation, respect, and leisure activities for rural children indicate that children in these contexts may not only be materially deprived, but also excluded from social and civic life, with potential long-term consequences for their agency and development.
From an academic perspective, these results underscore the added value of multidimensional measures over traditional unidimensional indicators (e.g. stunting or income poverty). The MICG captures invisible or underrepresented aspects of deprivation, such as lack of autonomy, poor mental health, or absence of respect, which are vital for understanding children’s actual freedoms and capabilities.
Policy-wise, these findings demand targeted, intersectional interventions. For instance, addressing rural girls’ deficits requires more than just increasing school enrolment, and calls for integrated programmes that also promote mental health, bodily safety, and social inclusion. Likewise, policies that aim to reduce rural-urban gaps must be sensitive to gender-specific vulnerabilities, ensuring that improvements in infrastructure or service delivery are inclusive. In summary, the MICG framework reveals that in Peru – as in other countries – rurality and gender intersect to shape distinct patterns of child disadvantage. Only by recognising these multidimensional, overlapping forms of deprivation can we move towards more just, inclusive, and effective policies for childhood development.
This kind of evidence can inform child-centred planning in alignment with the SDGs (especially SDG 4 on education, SDG 5 on gender equality, and SDG 10 on reducing inequalities). Moreover, the spiderweb chart serves as a powerful communicative tool for stakeholders, policymakers, NGOs, and communities, as it can be used to visualise where deprivations are most acute and where resources should be prioritised.
Meso-level: improving the understanding of the impact of socio-economic policies at sub-national level
A MICG can also be used to improve the understanding of the impact of socio-economic policies at community level. In Gonzales Martinez et al.,(Reference Gonzales Martinez, Wells and Anand48) we investigate the role of community participation in child development. Drawing from the Vietnam Young Lives Study, we explore how collective engagement in child-rearing and nutrition programmes enhances multidimensional child growth. Our findings indicate that when communities are actively involved in health and nutrition initiatives, children benefit from better health outcomes, social support, and improved access to resources. This study was the first to develop and apply the MICG, grounded in the capability approach and constructed from 14 dimensions and 29 indicators spanning both physical (e.g. stunting, food diversity) and non-physical (e.g. cognitive development, emotional care, autonomy) dimensions, as discussed previously.
Using ordinary least squares and quantile regression models, we found that community participation during the design stage of water, sanitation, and hygiene (WASH) interventions was significantly associated with improvements in multidimensional child growth, particularly among the most deprived children. In contrast, participation in the implementation stage showed no significant effect, and participation in the design of health interventions was negatively associated with growth, possibly reflecting mismatches between institutional goals and community needs (Figure 6).
(A–D) Effects of community participation on multidimensional child growth: WASH intervention—design stage. (A) Marginal effects of community participation on multidimensional child growth calculated with the ordinary least squares regression. Panels B, C, and D show the fit of a kernel density to the distribution of MICG in rural and urban communities. The dotted lines represent the median of the empirical distribution. MICG, Multidimensional Index of Child Growth; WASH, water, sanitation, and hygiene. Source: Gonzales Martinez, et al.(Reference Gonzales Martinez, Wells and Anand48) Community participation and multidimensional child growth: evidence from the Vietnam Young Lives Study. Current Developments in Nutrition (6) 4, p. nzac022.
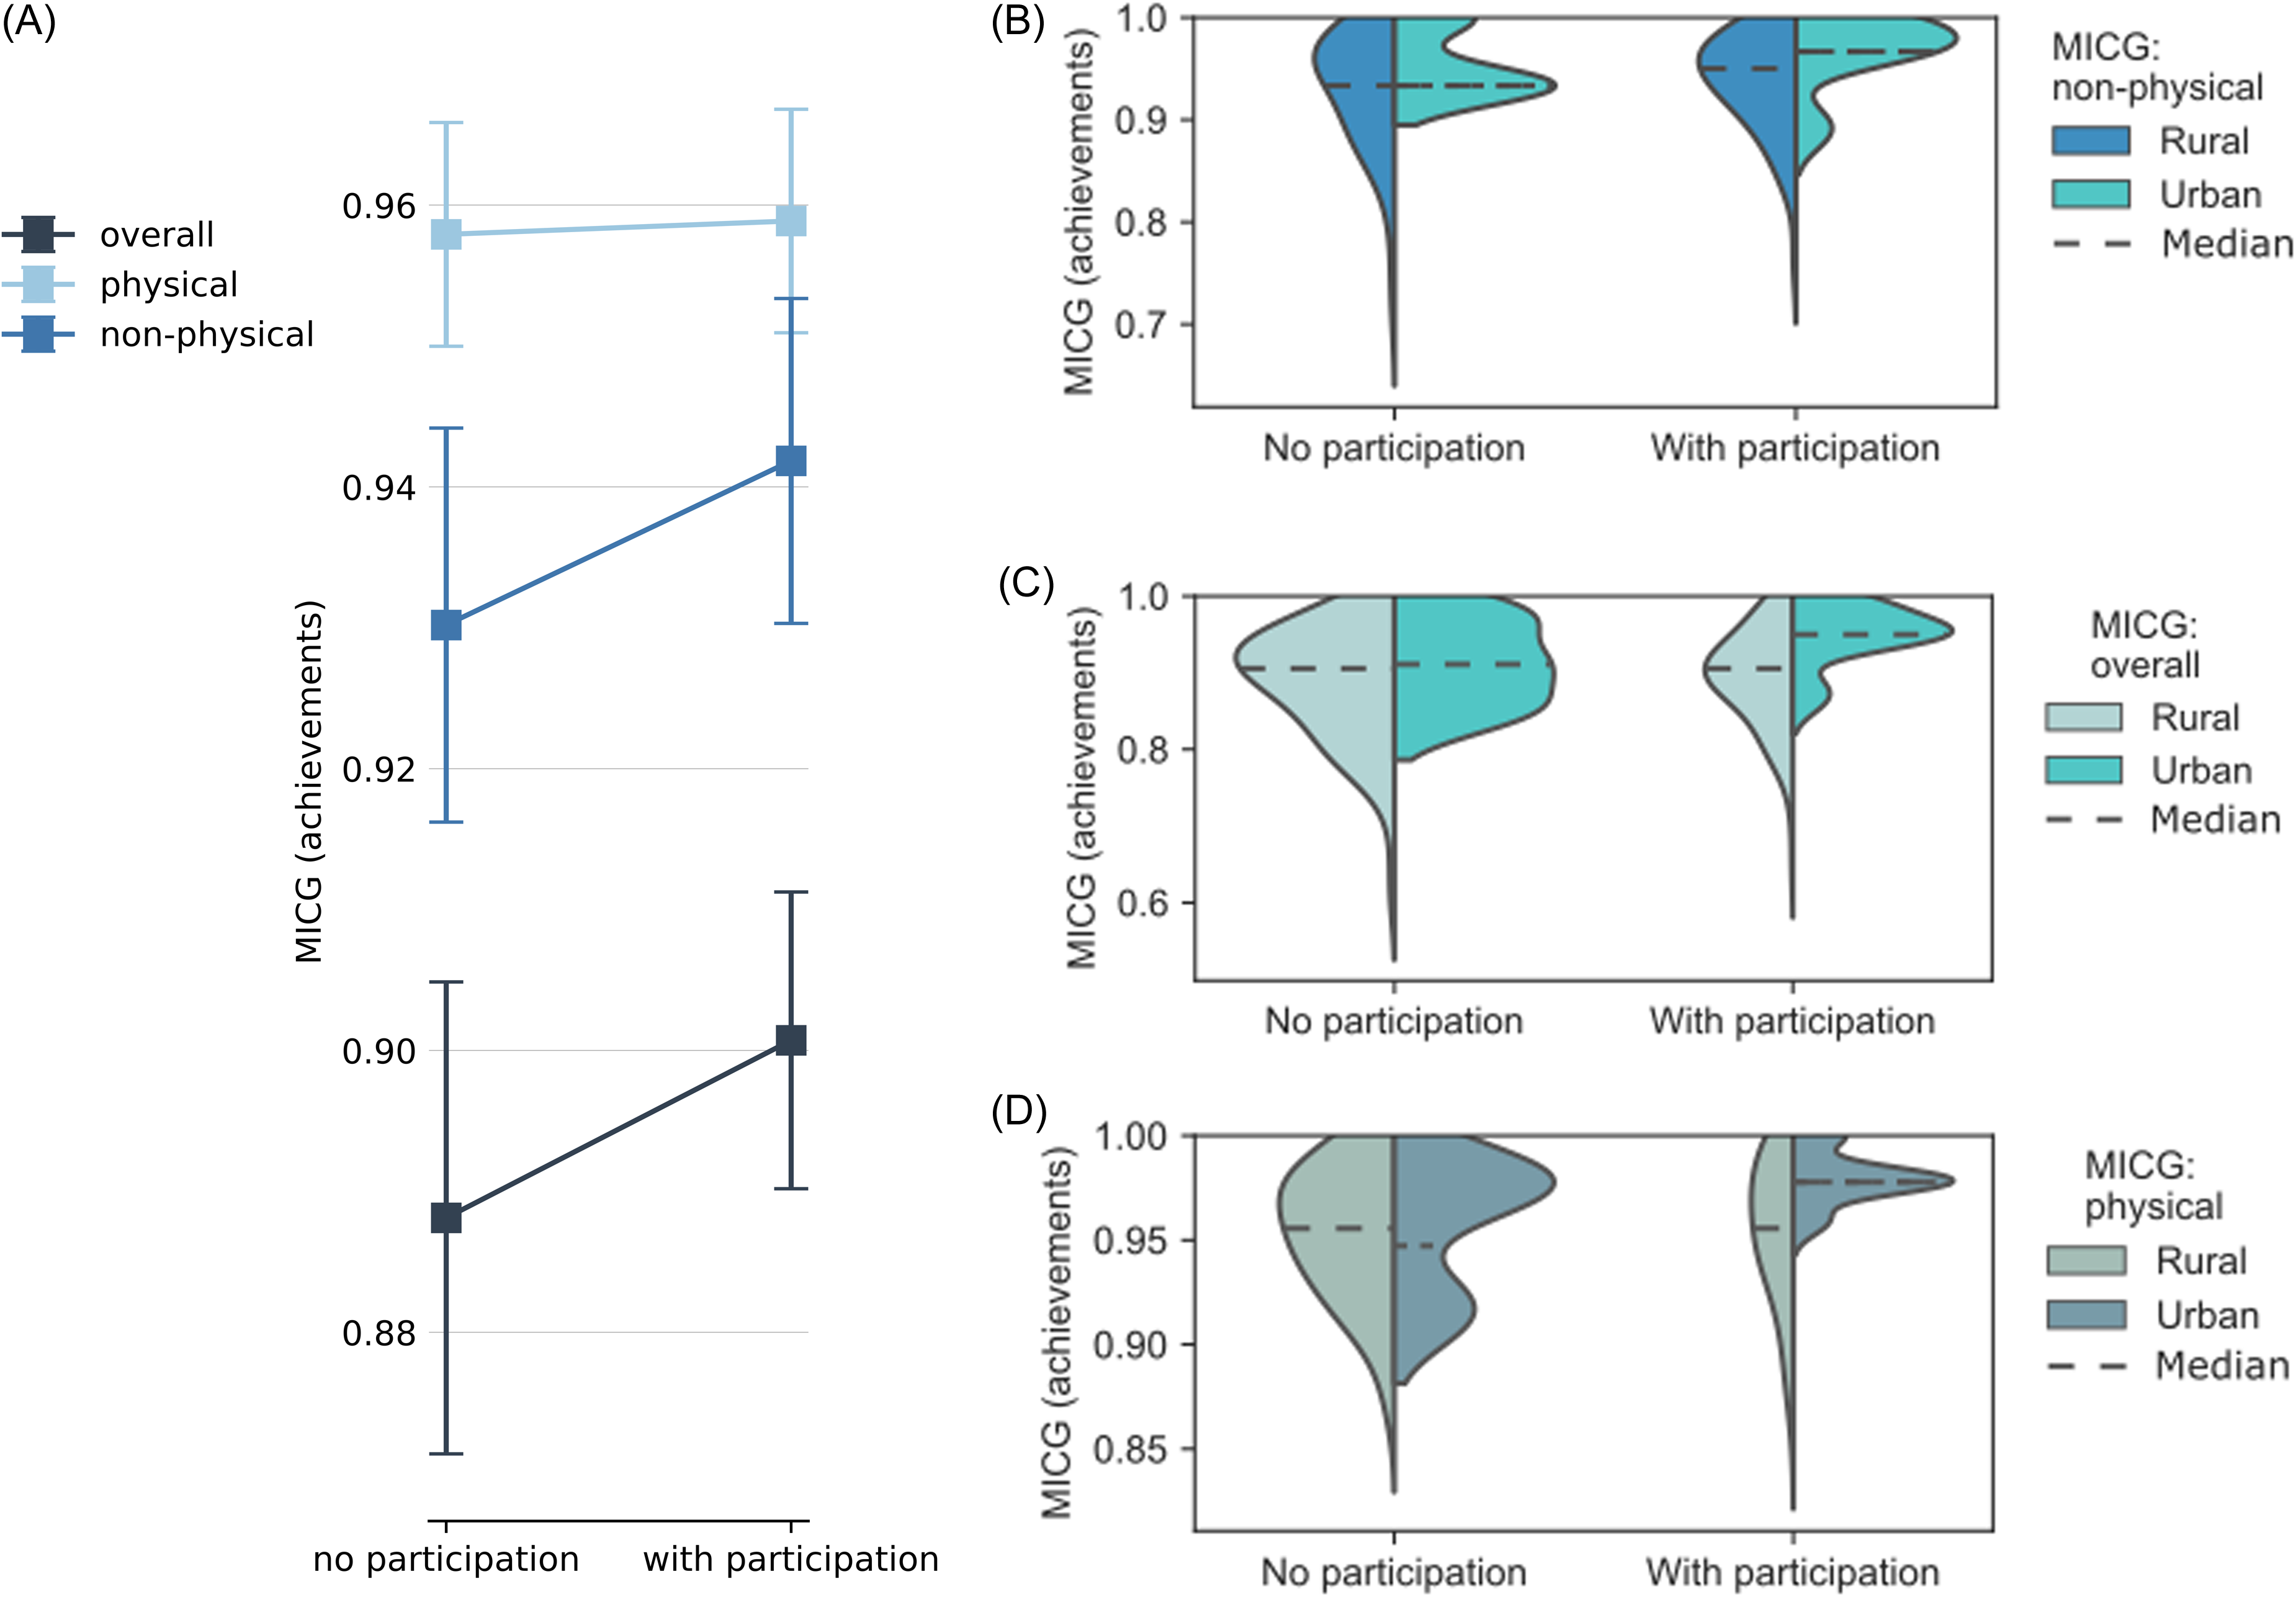
Importantly, the benefits of participation were concentrated in the non-physical dimensions of child growth – such as psychological wellbeing and social support – underscoring the inadequacy of using only anthropometric indicators in programme evaluations. Moreover, children in urban communities experienced more substantial gains from participatory interventions than those in rural areas, suggesting that local infrastructure and governance capacity may mediate the effectiveness of community involvement. Our study underscores the importance of fostering inclusive, context-sensitive participatory approaches during the early planning phases of public health strategies. By capturing the multidimensional nature of child wellbeing, such approaches not only enhance intervention effectiveness but also contribute to reducing inequality and promoting sustainable, community-driven development.
Micro-level: MICG as a tool for dialogue that can be used to identify children that could be left behind by interventions
The MICG and its visualisation through a spiderweb chart offer a multidimensional lens to interpret developmental risks beyond anthropometric measures, enabling a more holistic understanding of child growth as a composite of physical, cognitive, and emotional health within the child’s broader context. The spiderweb chart is particularly useful as a dialogue between parents/caregivers and health professionals, because it supports more targeted referrals, anticipatory guidance, and collaborative care planning with educators and social service providers. Spiderwebs can also be used as a diagnostic for tracking the evolution of children in multiple dimensions over time, since, for example, these dynamic spiderwebs allow health professionals to see changes in the achievements on the various dimensions and use that to interpret a child’s ‘growth’ at a certain point in time (e.g. when there are challenges in the life of a child) and also across growth trajectories.
The policy and clinical utility of the MICG at micro-level is further enhanced by its communicative clarity: it can be used not only for technical reporting but also for participatory planning processes involving children, caregivers, and community stakeholders. By making inequalities and multidimensional deprivation visible in an intuitive format, the MICG and the spiderweb chart contribute to evidence-informed, rights-based policymaking that is sensitive to both quantitative outcomes and qualitative life conditions. The MICG and the spiderweb visualisation of MICG operationalises a child-centred, capability-based, and rights-aligned approach to human development. It underscores the fundamental principle that child development must be understood not as a singular trajectory, but as a multidimensional unfolding shaped by intersecting freedoms, resources, relationships, and environments.
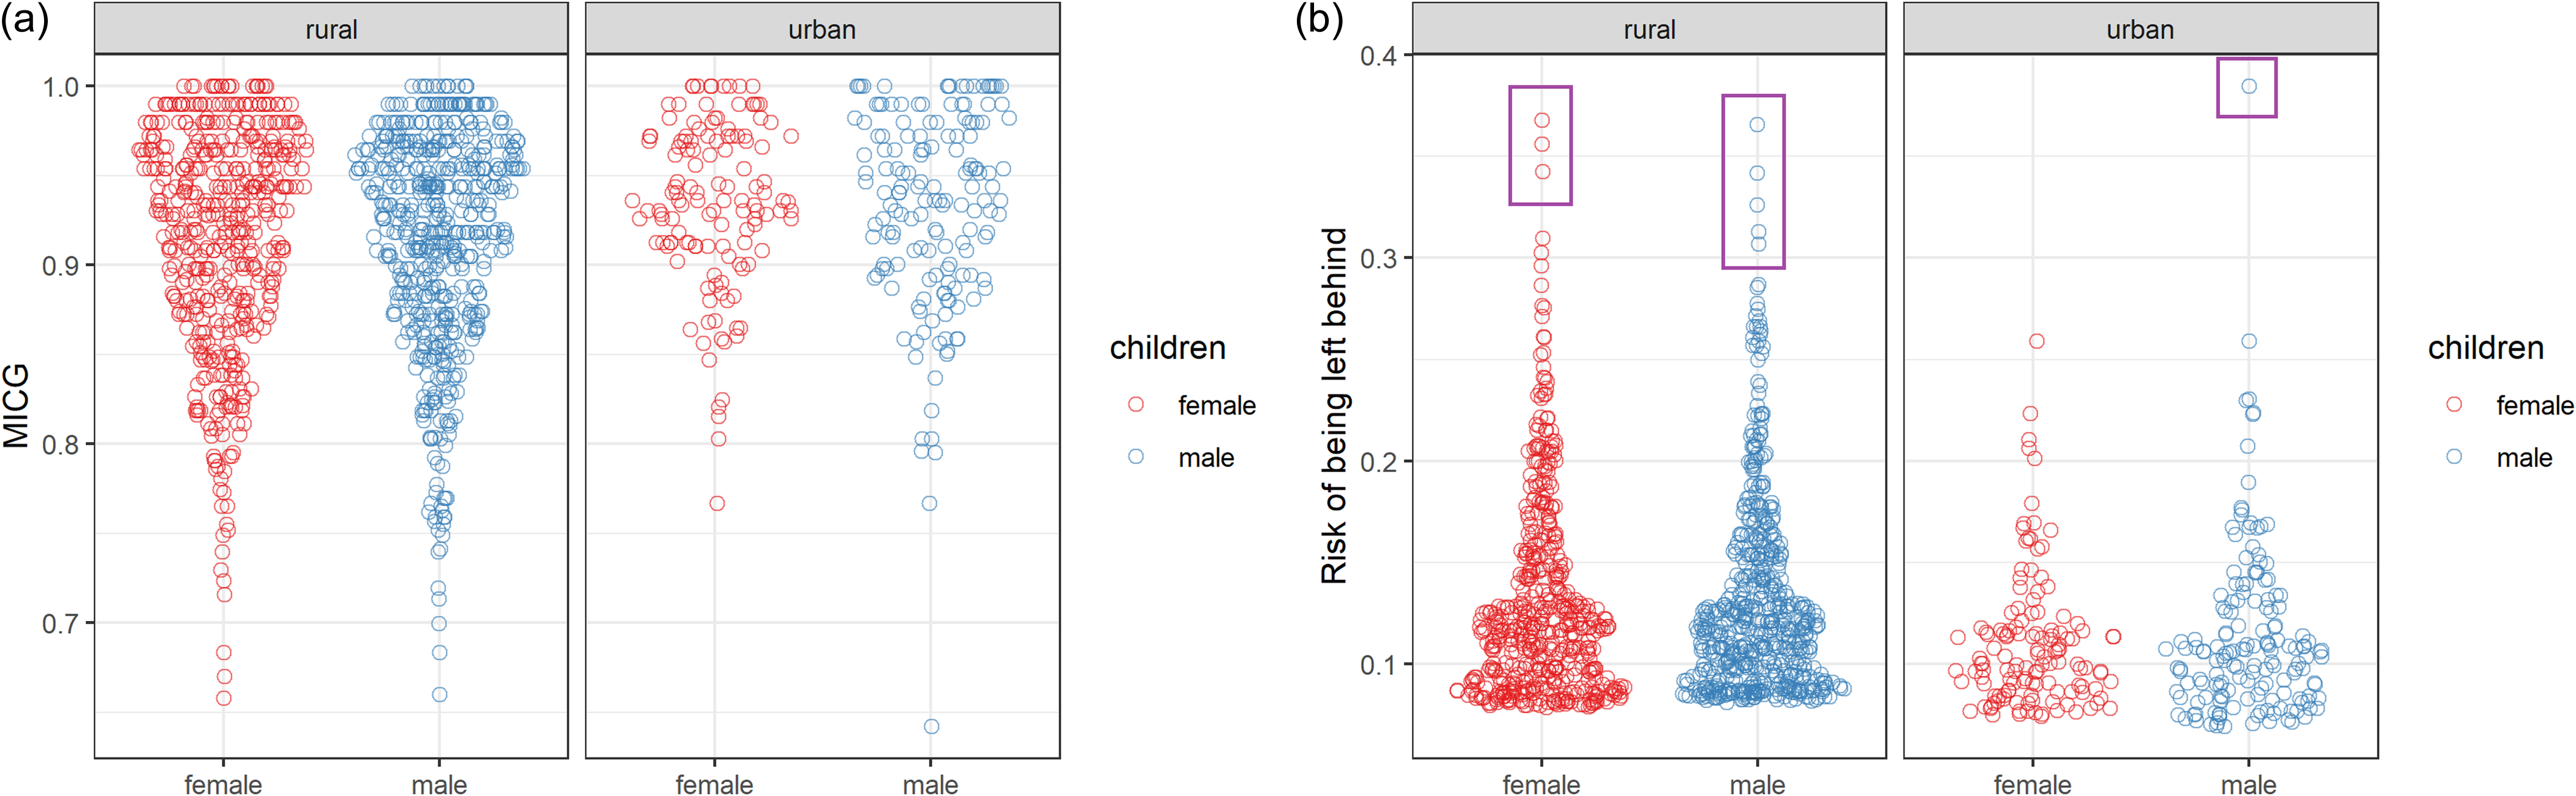
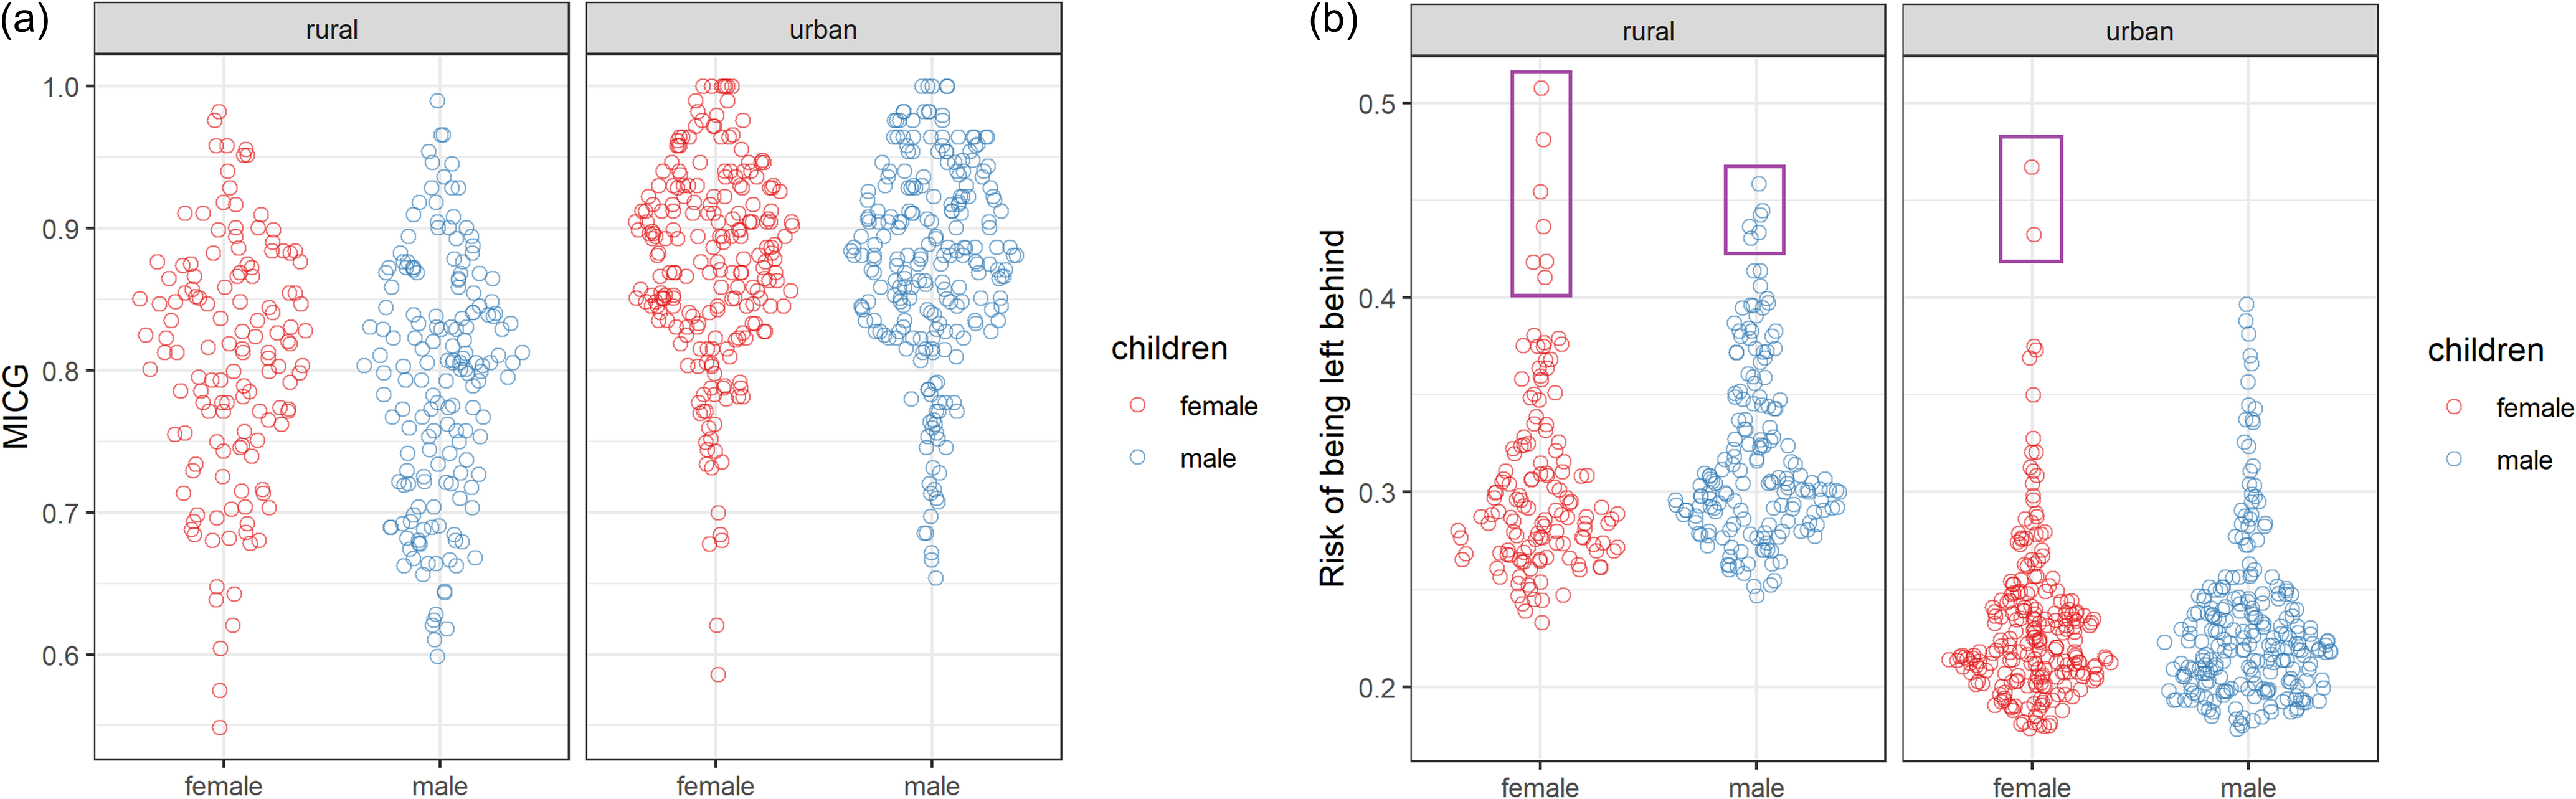
In terms of the application of MICG to identify individual children that could be left behind by interventions, Figures 7, 8, 9 and 10 show the results of estimating capabilities with Bayesian methods for Peru, India, Vietnam and Ethiopia. In the case of Peru, two children are highlighted for illustration: a rural girl and a rural boy, who both display low opportunity estimates and are at risk of being left behind in their multidimensional growth. Both children are exposed to structural and environmental vulnerabilities: they feel unsafe commuting to school, belong to minority ethnic groups, and live in areas prone to natural hazards. While the girl is stunted and scores low in both cognitive and verbal assessments, she is sociable and lives far from school, suggesting mobility deprivation. The boy, who is not physically stunted, struggles socially, has a low cognitive score, but lives closer to school and thus faces fewer constraints in mobility. Although their measured achievements might not differ dramatically, their opportunity distributions do – exposing subtle yet critical disparities in their developmental trajectories. The visual separation in the figure, marked by the different colours for male and female children across rural and urban contexts, underscores how these inequalities interact with geography and gender. By estimating potential growth capabilities with Bayesian methods, our analysis offers a powerful diagnostic for targeting policies where they are most needed, revealing that equality in outcomes may mask deep-rooted inequalities in opportunities.
Peru: (a) MICG (children’s achievements) and (b) the risk of being left behind by programmes/interventions, calculated as lower opportunities of child growth. Each dot represents a child. Children with the highest risk of being left behind during the development are highlighted in a purple box in figure (b).
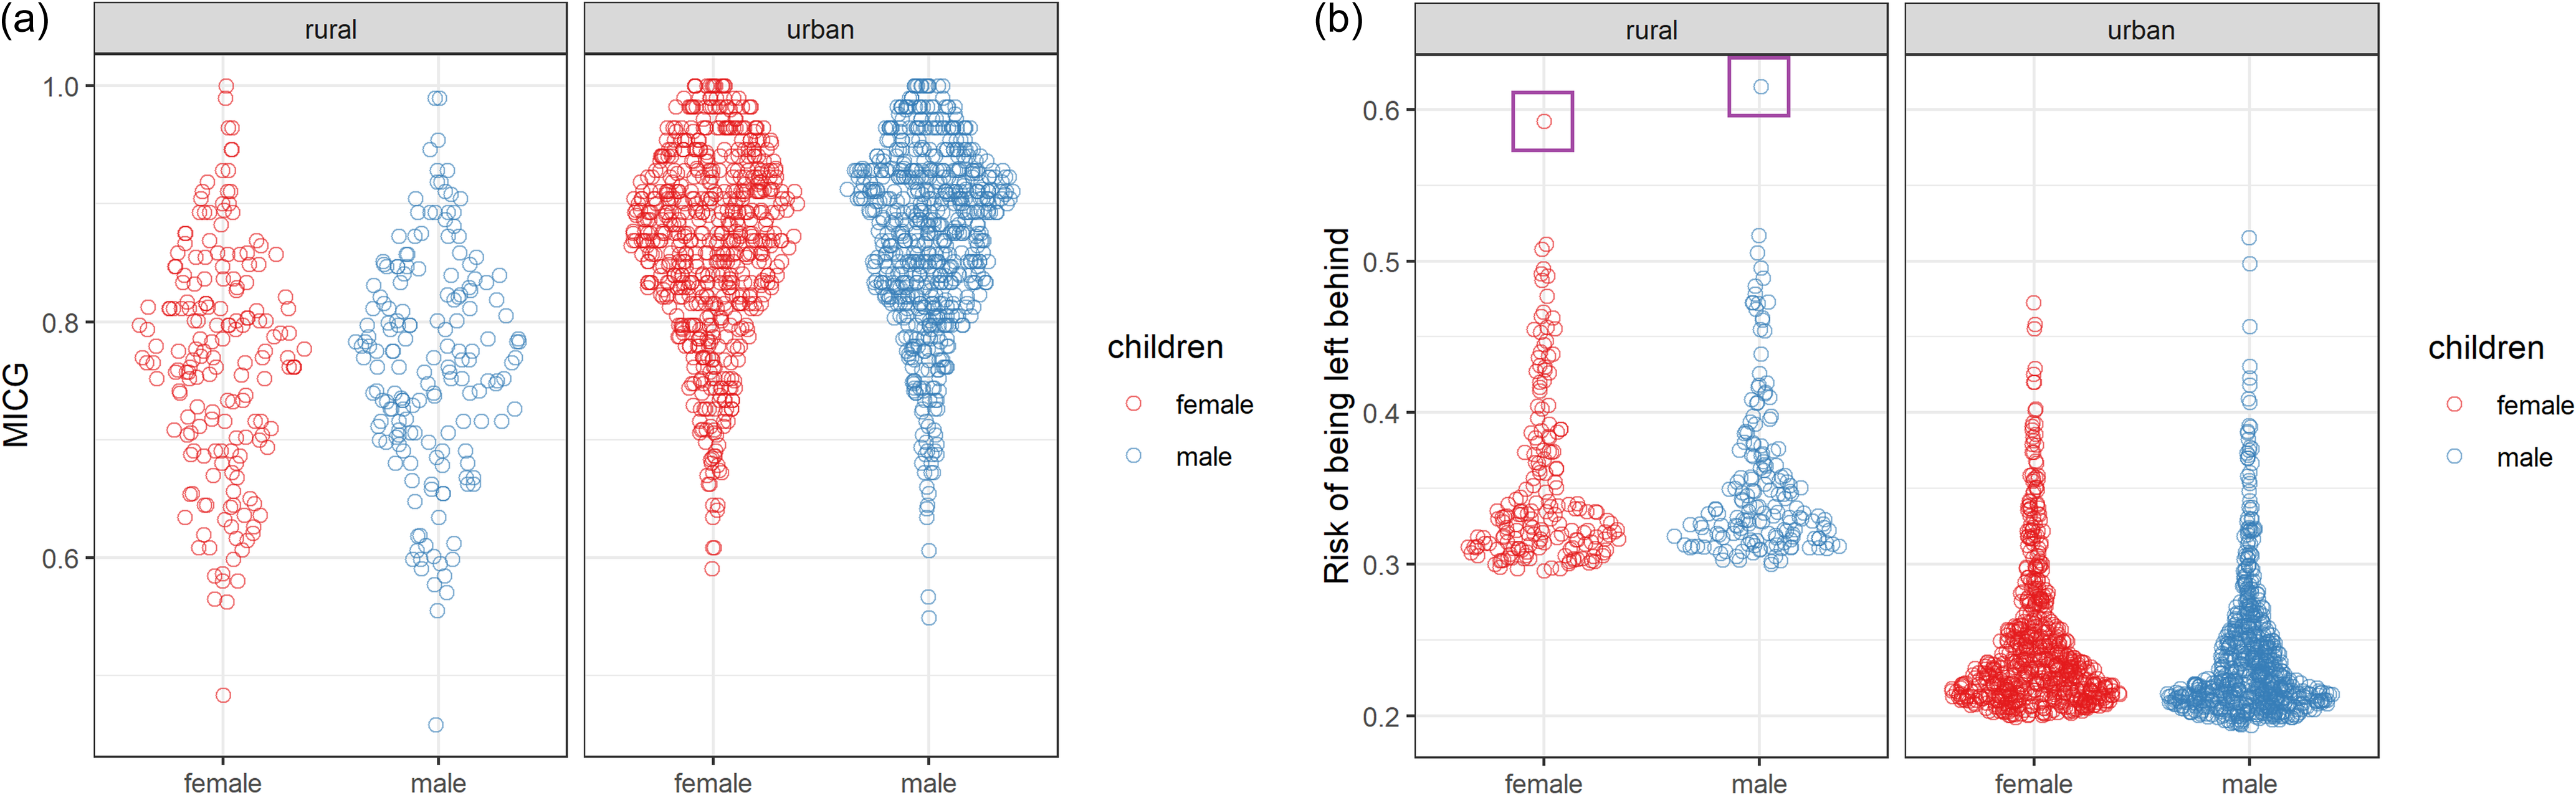
Figure 7 Long description
Panel A: Two scatter plots depict MICG (childrens achievements) for female and male children in rural and urban settings. The y-axis represents MICG, and the x-axis categorizes children by gender. Red circles represent female children, and blue circles represent male children. Panel B: Two scatter plots show the risk of being left behind by programs/interventions, with the y-axis representing the risk and the x-axis categorizing children by gender. Female children are represented by red circles, and male children by blue circles. Children with the highest risk of being left behind are highlighted in a purple box in the rural setting.
India: (a) MICG (children’s achievements) and (b) the risk of being left behind in the development process in India, calculated as lower opportunities of child growth. Each dot represents a child. Children with the highest risk of being left behind during the development are highlighted in a purple box.
Vietnam: (a) MICG (children’s achievements) and (b) the risk of being left behind in the development process in Vietnam, calculated as lower opportunities of child growth. Each dot represents a child. Children with the highest risk of being left behind during the development are highlighted in a purple box.
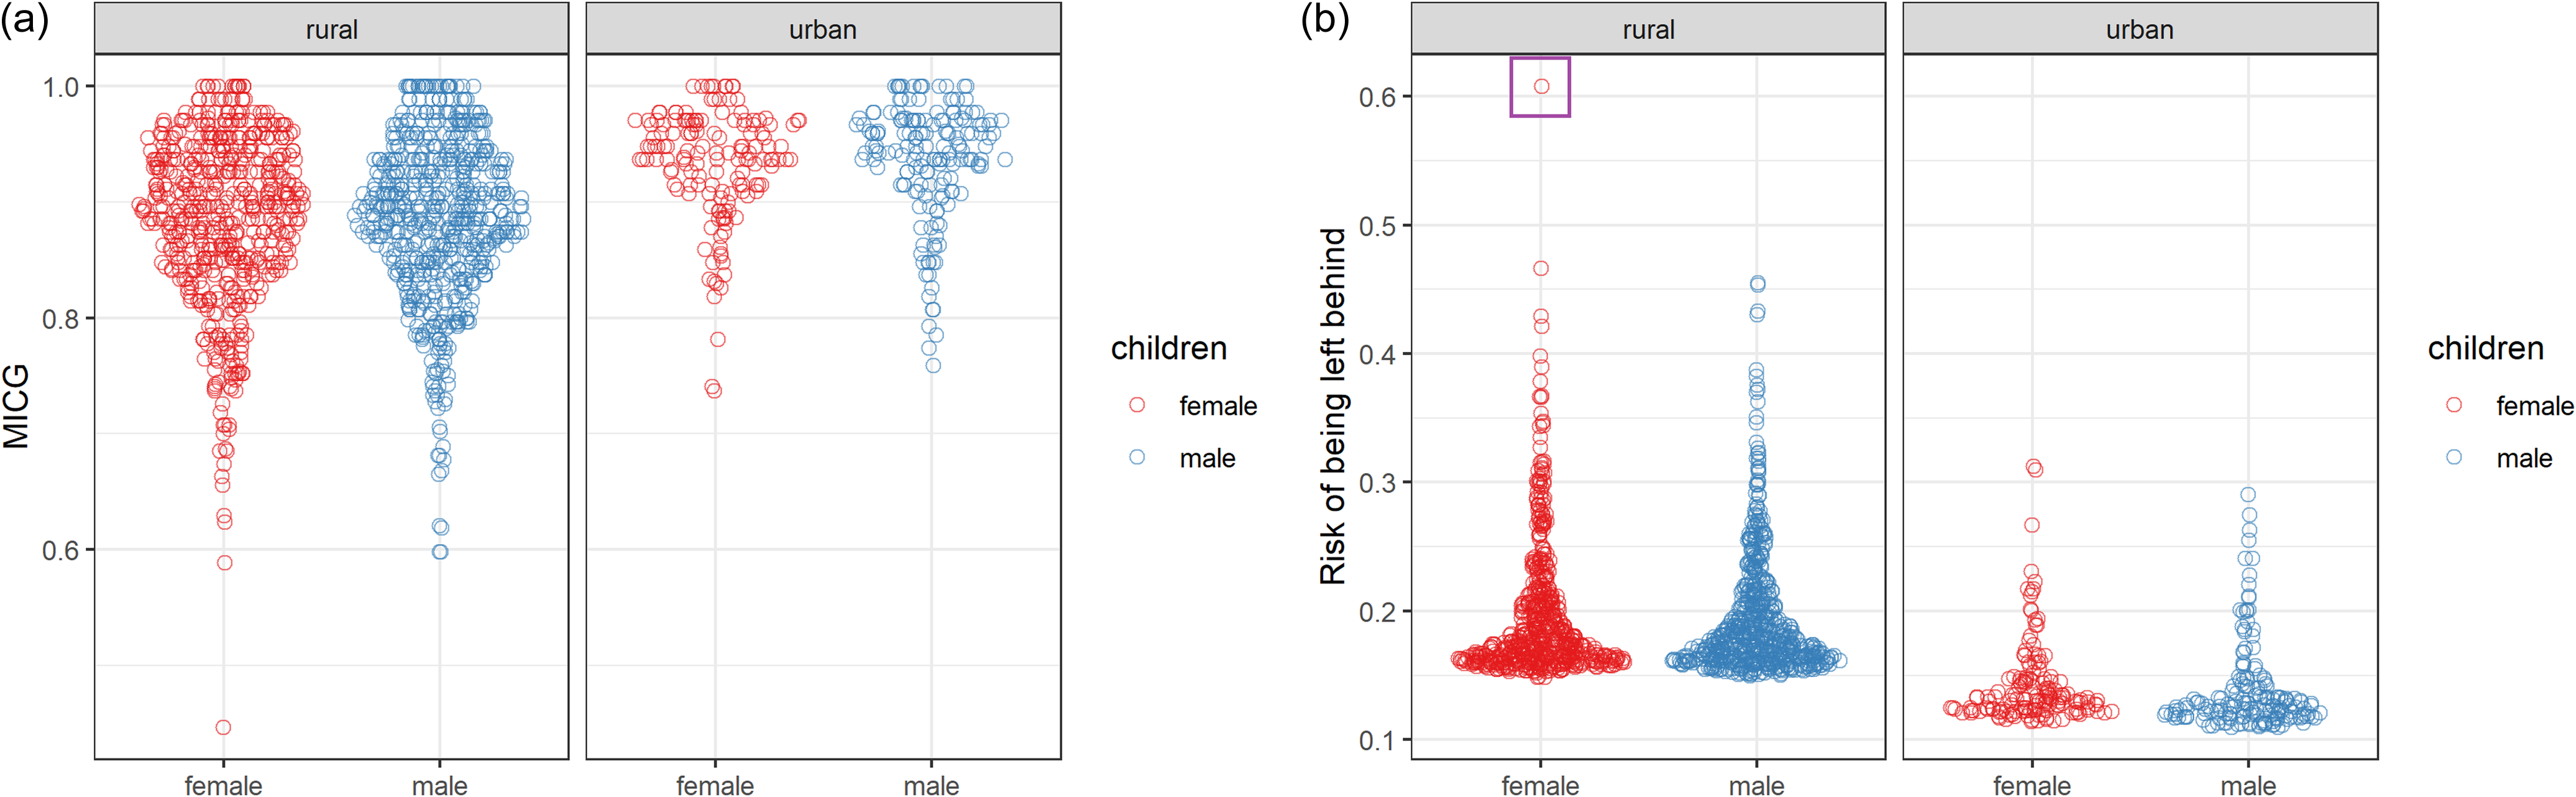
Figure 9 Long description
Panel A: Two scatter plots show MICG (children's achievements) for female and male children in rural and urban settings. The y-axis represents MICG, and the x-axis categorizes children by gender. Red dots represent female children, and blue dots represent male children. Panel B: Two scatter plots display the risk of being left behind in the development process for female and male children in rural and urban settings. The y-axis represents the risk of being left behind, and the x-axis categorizes children by gender. Red dots represent female children, and blue dots represent male children. A purple box highlights children with the highest risk of being left behind.
Ethiopia: (a) MICG (children’s achievements) and (b) the risk of being left behind in the development process in Ethiopia, calculated as lower opportunities of child growth. Each dot represents a child. Children with the highest risk of being left behind during the development are highlighted in a purple box.
Conclusions
To further reduce child mortality and its inequalities, the TMICG-IUNS developed a capability approach for child growth that goes beyond anthropometry and includes non-physical dimensions that promote multidimensional child growth, like the care received from parents, cognitive and verbal development, and children’s safety. We conceptualised, operationalised, and showed applications of the MICG, which can be used for policy formulation/evaluation and for clinical practice. In line with studies from the WHO–UNICEF–Lancet Commission,(Reference Clark, Coll-Seck and Banerjee26,Reference Dalglish, Costello, Clark and Coll-Seck49) our key empirical results highlight the importance of having data sets that capture multiple dimensions of physical and non-physical child growth. For children that are stunted or wasted, our approach provides insights into the potential causes of malnutrition that remain hidden if the environmental context of parents and households is not considered. Our multidimensional approach, as well, helps to understand development deprivations of children that are not malnourished.
Compared to previous child indicators at national level, our methodology is focused on the situation and opportunities of individual children, but at the same time our method allows us to compare results between countries. While child indicators based on large datasets – like the Multiple Indicator Cluster Surveys (MICS) and the Demographic and Health Surveys (DHS) – increase representativeness and facilitate cross-country comparisons, our findings show that suitable contextual and multidimensional information is needed to uncover social and psychological deprivations, which can help to further reduce child malnutrition and mortality, because complex multidimensional indicators at child level inform context-specific programmes and focalised interventions for health-care professionals and policymakers – governments, international donors, and non-governmental organisations – in line with the goals of the SDGs.
As part of the operationalisation of the MICG, we also proposed a visualisation diagram for monitoring multidimensional child growth that can be potentially applied to complement the traditional growth charts of weight and length/height by age and sex used by paediatricians worldwide. Our visualisation diagram of multidimensional child growth can be used for monitoring the social and psychological (verbal and cognitive) growth of children, as well as the influence of the environment on their physical growth.
Because the purpose of the IUNS-MICG project was to create a prototype of MICG that can serve as a proof-of-concept of methodologies to measure opportunities for child growth, the results were not aimed to be generalisable at country level and are not directly comparable to those obtained from other surveys, like DHS and MICS, because the YLS is based on purposive sampling with a pro-poor bias aimed at maximising regional and socio-economic diversity. Future research focused on expanding the IUNS-MICG approach to multidimensional child growth needs to have richer datasets, that is, contextualised datasets that allow the calculation of indicators to cover the multiple dimensions of physical and non-physical child growth. These richer datasets, however, are currently not available to the best of our knowledge.
Future research can incorporate the nurturing environment and social trajectories that inform opportunities for multidimensional child growth, based on a geometric-topological reformulation of Bronfenbrenner’s bioecological model using non-Euclidean differential geometry where the nested ecological systems (micro-, meso-, exo-, macro-, and chronosystem) are no longer idealised as concentric Euclidean spheres but as hyperboloidal manifolds embedded in a curved, anisotropic space. Appendix B at the end of this document explains in detail this potential future research line.
Supplementary material
The supplementary material for this article can be found at https://doi.org/10.1017/jns.2026.10085.
Acknowledgements
We gratefully acknowledge, in memoriam, the enduring contributions of Gretel Pelto, whose scholarship and generosity profoundly shaped the conceptual foundations of this work and whose insights into child nutrition and care continue to inform our thinking. We also acknowledge the intellectual inspiration and formative ideas of Jean-Pierre Habicht, whose critical engagement and visionary perspectives influenced the development of the framework underlying this research. We thank Paul Anand, Mario Biggeri, and Enrica Chiappero-Martinetti for their support of this project.
Author contributions
Prof. Dr. Hinke Haisma contributed to the conceptualisation of the study and oversaw the scientific approach and coordination during manuscript preparation. Dr. Barnali Chakraborty contributed to the qualitative operationalisation of the capability framework in Bangladesh. Dr. Zaina Mchome conducted an ethnography of child growth in southeastern Tanzania. Dr. Sepideh Yousefzadeh contributed to the early conceptualisation and operational development of the index of child growth and developed the Capability Framework for Child Growth. Dr. Rolando Gonzales Martinez conducted the quantitative analyses and prepared the initial draft of the manuscript. Dr. Sridhar Venkatapuram contributed to the work of the task force by applying a health justice perspective. Dr. Muhammad Ali Dhansay provided critical review and substantive feedback on earlier versions of the manuscript. All authors contributed to manuscript revision and approved the final version.
Financial support
This project received funding from the Netherlands Organisation for Scientific Research NWO/WOTRO/VIDI (H.H., Grant No. W01.70.300.002) and the International Union for Nutritional Sciences through the Task Force ‘Towards a Multi-Dimensional Index to Child Growth’.
Open access funding provided by University of Groningen.
Competing interests
The authors declare none.





 Open access

