


Introduction
As Ansell and Lindvall (Reference Ansell and Lindvall2020: 21) have pointed out, ‘in the long history of political conflicts over what we now call the welfare state, the question ‘By whom?’ has often been more important than the question ‘How much?’’ In recent decades, too, changes to the respective roles of public and private providers in service delivery have been a key battleground in the politics of social and economic policy (Gingrich, Reference Gingrich2011; Ledoux et al., Reference Ledoux, Shire, van Hooren, Ledoux, Shire and van Hooren2021; Powell, Reference Powell and Powell2019). While the appropriate extent of provision in different areas has been the central stake in many welfare reforms, who should provide and control services has been the key issue in many others. Who supports direct state provision of public services and who opposes it? An intuitive answer might seem to be largely the same people who support or oppose welfare more generally. After all, the very concept of the welfare state suggests a close relationship between the ‘by whom’ and the ‘how much’ aspects of social and economic policy, and strongly implies they should have similar underlying patterns of public support. However, despite a large literature on attitudes to different facets of welfare state activity, we still know very little about public opinion on the organisation and delivery of services, and even less about how it relates to other welfare attitudes.
In this article, we present analyses from an original survey that gathered data on public attitudes toward the state’s role in providing services (the ‘statism’ aspect) alongside attitudes towards benefit generosity and redistribution (the ‘welfarism’ aspect). We show that views about service delivery display less variation than attitudes towards welfare in general. We also find that public support for private sector involvement in service delivery is limited to certain areas, with even less support for outright privatisation. We show that, contrary to what might be expected, there is in reality very little congruence between attitudes to ‘statism’ and attitudes to ‘welfarism’, a further contribution to the growing appreciation of the complex, multi-dimensional nature of welfare state attitudes.
Our analysis focuses on the United Kingdom (UK), a particularly interesting case for a number of reasons. First, compared to many other countries the state was unusually dominant in UK welfare provision in the post-World War II heyday of the welfare state (Powell, Reference Powell and Powell2019: 16). If we would expect to observe close congruence between attitudes to statism and attitudes to welfarism anywhere, it would arguably be in the UK. Second, the promotion of enhanced competition and ‘user choice’ through increased private sector delivery of welfare has been an extremely salient aspect of UK welfare state restructuring since the 1980s, even if actual shifts in the share of public and private provision of core social policies have been gradual and modest, especially if housing is excluded (Reader and Burchardt, Reference Reader and Burchardt2023). Thirdly, the role of the state in public service delivery has been a particularly vexed issue of electoral strategy for the UK political left in recent years, with New Labour’s embrace of contracting out and quasi-markets - as part of its ‘modernisation’ agenda (Drakeford, Reference Drakeford and Powell2008) - giving way to a strident reaffirmation of public ownership and state provision during Jeremy Corbyn’s leadership (Goes, Reference Goes2018), which ended with Labour’s election defeat in 2019. Beyond its contribution to the welfare attitudes literature, our finding that welfarism and statism are weakly related aspects of UK public attitudes therefore also has implications for live British political debates that we return to in our discussion.
Statism as a hidden dimension of welfare state attitudes
Though welfare can in no way be reduced to a collective model of publicly financed and delivered social services and benefits (Titmuss, Reference Titmuss1963; Powell, Reference Powell and Powell2019; Béland and Morgan, Reference Béland, Morgan, Beland, Morgan, Obinger and Pierson2021), the latter has been central to the construction of the idea of the welfare state in the second half of the twentieth century, and in some countries especially. Understood in this way, the concept of the welfare state captures two quite distinct sets of ideas. On the one hand, it refers to a commitment to protect citizens against a range of contingencies and the promotion of some measure of social justice. On the other, it refers to confidence in the state (nationally or locally) to effectively deliver a range of services, complementing but also constraining the role of the market – and other actors, such as community organisations, the church, etc. ‘Welfarism’ and ‘statism’ are thus partially distinct, with some family resemblance to the notions of economic egalitarianism and economic interventionism in political science literature, which have traditionally been understood as being paired on an economic ‘left-right’ dimension in which citizens, ‘who favour a more egalitarian distribution of income also favour more government intervention in the economy’ (Otjes, Reference Otjes2018: 645).
However, in recent years political scientists have problematised the notion that egalitarianism and interventionism are paired in this way – indeed a study of voter preferences across the EU found public attitudes on the two issues do not necessarily align (Otjes, Reference Otjes, Bardi, Kriesi and Trechsel2014). Such findings have led to a broader questioning of the existence of a single left-right dimension. One of the biggest sources of that questioning is research on attitudes towards the welfare state. This literature has become ever more sophisticated in recent years, increasingly disaggregating the welfare state into its various activities and aspects, and problematising the assumption that public attitudes cohere in neat, predictable ways. Achterberg et al. (Reference Achterberg, Houtman and Derks2011) for example found that support for the welfare state and support for economic egalitarianism are best thought of separately. Attewell (Reference Attewell2021) has shown that attitudes to redistribution have two distinct and only weakly related dimensions; support for inequality reduction, on the one hand, and perceptions of the deservingness of welfare state beneficiaries, on the other. Garritzmann et al. (Reference Garritzmann, Busemeyer and Neimanns2018) found that distinct groups of the population favour social investment policies, ‘passive’ transfer policies, and workfare. Most ambitiously, Roosma et al. (Reference Roosma, Gelissen and Van Oorschot2013) analyse seven dimensions of welfare state activity, showing that most people have positive attitudes to some and negative attitudes to others, and that these dimensions relate in different ways in different countries. In short, all of the above studies (and others beyond the scope of this article to review) have contributed significantly to the wider questioning of the primacy of a single left-right organising dimension for public attitudes (see Mair, Reference Mair, Dalton and Klingemann2007; Jou and Dalton, Reference Jou and Dalton2017).
However, while we know an increasing amount about the complexity of public attitudes about welfare, we know surprisingly little about enduring levels of confidence in the role of the state to effectively deliver services. Statism is in many respects a hidden dimension of welfare attitudes. This is a serious omission. As Gingrich (Reference Gingrich2011) has shown, in many countries political actors from across the ideological spectrum have promoted market-oriented reforms of public services in recent decades, albeit in varying forms. The political right have typically done so in the context of their traditional concerns with competition, efficiency, and reducing the power of public sector providers. However, the left have also embraced such reforms, often in the name of increasing user choice and service responsiveness, as part of a broader strategy to defend the legitimacy of welfarism (Klitgaard, Reference Klitgaard2007). While there are many criticisms of the unintended consequences of market-oriented reforms in the varied welfare sectors where it has occurred – such as ‘cream skimming’ in employment policy (see Greer et al., Reference Greer, Breidhal, Knuth and Larsen2018) – possible solutions are often framed in terms of enhanced consumer voice and better market regulation (see, e.g., Le Grand, Reference Le Grand2007; Dickinson et al., Reference Dickinson, Carey, Malbon, Gilchrist, Chand, Kavanagh and Alexander2022). Calls for ‘statist’ counter-movements are rare within the political mainstream, where it appears to be assumed that these will command little public support. In the burgeoning scholarship on welfare state attitudes, the relative neglect of public preferences about which actors deliver public services is puzzling.
While questions about welfare orientations are common in major comparative social surveys, hardly any instruments exist that explicitly operationalise service delivery preferences in detail. One of the few examples is the International Social Survey Programme’s 2016 module on the role of government (also included in that year’s British Social Attitudes (BSA) Survey). Respondents were asked to say who they thought should provide ‘health care for the sick’, ‘care for older people’, and ‘school education for children’. Answer options distinguished government and private sector actors but not between for-profit and not-for-profit actors (ISSP, 2016). This gap in data availability means that service delivery preferences cannot usually be operationalised in comparative studies – especially not for a wider set of services that go beyond core welfare provisions.
In the UK context, the BSA survey has occasionally asked about whether private companies or charities/third sector actors would be better at running core public services than the state, finding considerably more people opposed to private companies running schools and hospitals than social care (Curtice and Heath, Reference Curtice, Heath, Park, Curtice, Thomson, Phillips and Clery2009). Polling companies have intermittently asked questions about this topic, typically when public debate is focussed on questions of public service ownership and delivery, for example, during the New Labour years and during Corbyn’s period as Labour leader. IPSOS Mori evidence from 2000, 2001, and 2008 revealed that large majorities supported the government or local authorities – rather than private companies – running public services, but the surveys did not ask about non-profit/third sector actors (Shaw, Reference Shaw, Callaghan and McIvor2009). In 2017, YouGov asked people who ought to run thirteen services. Respondents were especially keen for the police, the NHS, the armed forces, and schools to be in public hands, although nationalisation was the majority preference in most of the thirteen services, including railways and water (Smith, Reference Smith2017). While the poll did not parse types of service provider beyond the ‘nationalisation/privatisation’ dichotomy, Labour supporters were more likely than Conservatives to support nationalisation in each case, suggesting distinctive ‘left’ and ‘right’ positions. In neither this nor the earlier studies, though, were questions about service delivery asked alongside questions about other aspects of the welfare state. Exploring this link explicitly is the task of this article.
Data and methods
The data for this article comes from a UK-wide representative survey conducted between sixteenth and thirty first of July 2021. In total 4,428 respondents aged eighteen or older were interviewed. The survey was run online using a large panel provided by the company Bilendi. Such panel-based quota sampling can generate good-quality samples with careful management to mitigate potential biases (Couper, Reference Couper2017). Crucially, panels need to be large and of high quality (Baker et al., Reference Baker, Blumberg, Michael Brick, Couper, Courtright, Michael Dennis, Dillman, Frankel, Garland, Groves, Kennedy, Krosnick, Lavrakas, Lee, Link, Piekarski, Rao, Thomas and Zahs2010), including diverse parts of the population. Additionally, quota designs must be detailed to account for demographic and social status differences (de Rada and Martin, Reference de Rada and Martin2014). This survey was designed to have quotas matching the characteristics of the UK population overall, in terms of gender, age, socio-occupational class of the household, and geographic region. To ensure that the constitutive parts of the UK (England, Wales, Scotland, and Northern Ireland) were represented correctly, quotas for gender, age, and class were applied for each of them separately. Additionally, quotas were employed for sub-geographic area distributions (nine regions in England and groups of council areas for Scotland, Wales, and Northern Ireland). Scotland (n = 1160), Wales (n = 670), and Northern Ireland (n = 235) were intentionally oversampled. The analyses examine the UK as a whole, so weights are used to apportion respondents to the proportion of the actual population. Sampling was successfully done in a slow and balanced way, with only small deviations from population parameters in quotas and cross-quotas. Small deviations between sample characteristics and population parameters are accounted for by using raking weights.
Core variables
To address our goals outlined above, we distinguish two attitude dimensions: welfare orientation and service delivery preference. We operationalise the former using established questions from existing surveys, such as the BSA. We capture the second dimension with a dedicated new set of questions designed for this survey. To measure whether people are more or less supportive of principles behind a redistributive and supportive welfare state, we combine responses to five statements (replicated from the BSA) that address a variety of orientations. The questions examine people’s agreement or disagreement (on a five-point Likert scale running from ‘strongly agree’ to ‘strongly disagree’) with propositions on whether
-
i) Benefits disincentivise work or notFootnote 1 ;
-
ii) People can find work, if they wantedFootnote 2 ;
-
iii) Welfare cuts are too damagingFootnote 3 ;
-
iv) Welfare expenditure should be increased, even if taxes riseFootnote 4 ; and
-
v) Higher incomes should be redistributedFootnote 5 .
The statements have been used jointly in many BSA analyses and combine attitudes on policies with perceptions of underlying behavioural assumptions. To confirm the appropriateness of using all five items in one index, we conducted an exploratory factor analysis (adjusted for the ordinal nature of the variables). The results clearly suggested that a one-factor solution was appropriate.Footnote 6 The responses were recoded, so that they all pointed in the same direction, with higher values indicating stronger pro-welfare orientations. We combined the five items into one welfare orientation scale standardised between zero and one, where zero means a respondent always chose the most anti-welfare position on all statements and one means they always selected the most pro-welfare position.Footnote 7 A reliability analysis showed a strong connection if the five items are combined (Cronbach’s alpha = 0.836).
We also asked respondents how they preferred a range of different services to be delivered.Footnote 8 To develop a more comprehensive measure, we asked about a range of services that reflect what might be thought of as ‘core’ welfare provisions (e.g., health- or social care), but also infrastructure-focussed services (e.g., public transport) and financial support (e.g., support for people on low-incomes or business support). We wanted to elicit a range of responses that allowed us to differentiate between people who support state delivery in general and those who only do so for a narrower set of activities. We asked about the provision of:
-
i) Healthcare
-
ii) School education
-
iii) Public transport (such as bus services)
-
iv) Business support
-
v) Support for people on low incomes
-
vi) Childcare
-
vii) Social care
The answer options in each case were:
-
a. ‘Directly by government’.
-
b. ‘Through government payments to private, non-profit organisations (such as charities) that deliver them’.
-
c. ‘Through government payments to private firms that deliver them’.
-
d. ‘By private firms and organisations only, with no government involvement at all, but individuals paying for services’.
-
e. ‘Don’t know’.
To initially check the appropriateness of combining all seven items in one index, we ran an exploratory factor analysis adjusted for ordinal measures and found that a one-factor solution combining all measures was appropriate.Footnote 9 Accordingly, we combined the responses to form a service delivery preference scale based on the mean response to the items, standardised between zero and one where zero meant the respondent had selected each time that government should deliver the service directly and 1 meant that the respondent had selected each time that delivery should have been left solely to the private sector. A reliability analysis showed that it was meaningful to combine all seven items in one scale to form a comprehensive indicator covering a range of services (Cronbach’s alpha = 0.843).
Approach to the analysis
First, the descriptive findings for both scales are reported with an analysis of whether and how they are related. To identify which characteristics are associated with welfare orientations and service delivery preference,s respectively, we then conduct multivariate ordinal regressions.Footnote 10 This enables us to examine whether or not the profiles for both dimensions are the same in terms of demographic and socio-economic characteristics. If they are not, it would imply that it was unlikely that the same groups of people would have a tendency to hold more/less statist and welfarist views, implying that neither dimension operates on a singular (‘left-right’) continuum.
The demographic characteristics accounted for include gender, age, marital status, geography, and household size. Age is of particular interest as previous research suggests the experience of being socialised in a particular policy ‘era’ can shape political attitudes (Grasso et al., Reference Grasso, Farrall, Gray, Hay and Jennings2019). The socio-economic factors are education, socio-occupational class, economic activity status, tenure, household income, benefit receipt, and trade union membership. We incorporate a range of indicators as prior research has shown that political attitudes are not just shaped by general levels of affluence (as expressed by income), but also specific experiences shaped by one’s socio-occupational work context (Kitschelt and Rehm, Reference Kitschelt and Rehm2014) – although both do interact with each other (Edmiston, Reference Edmiston2018). Additionally, we examine the robustness of results by adding party preferences, thus checking whether any relationships we find are merely expressions of the propensity of certain groups to favour certain political parties or not.
Finally, to establish whether we can learn more about the attitude profiles of respondents by looking at both dimensions simultaneously, but without collapsing them into one, we complete our analyses with a set of multinomial regressions comparing four types of respondents depending on their position on both scales:
-
Welfarist and government-focussed
-
Welfarist and private sector-focussed
-
Anti-welfarist and government-focussed
-
Anti-welfarist and private sector-focussed
Results
Summary of the distribution of attitudes on the two dimensions
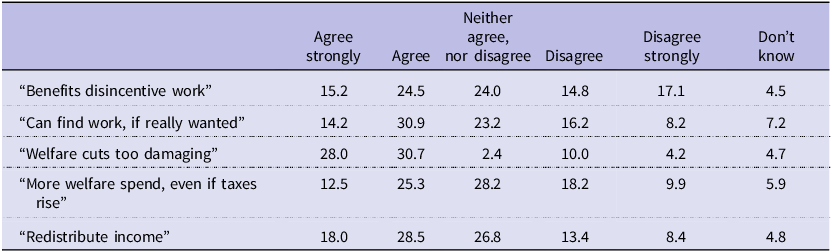
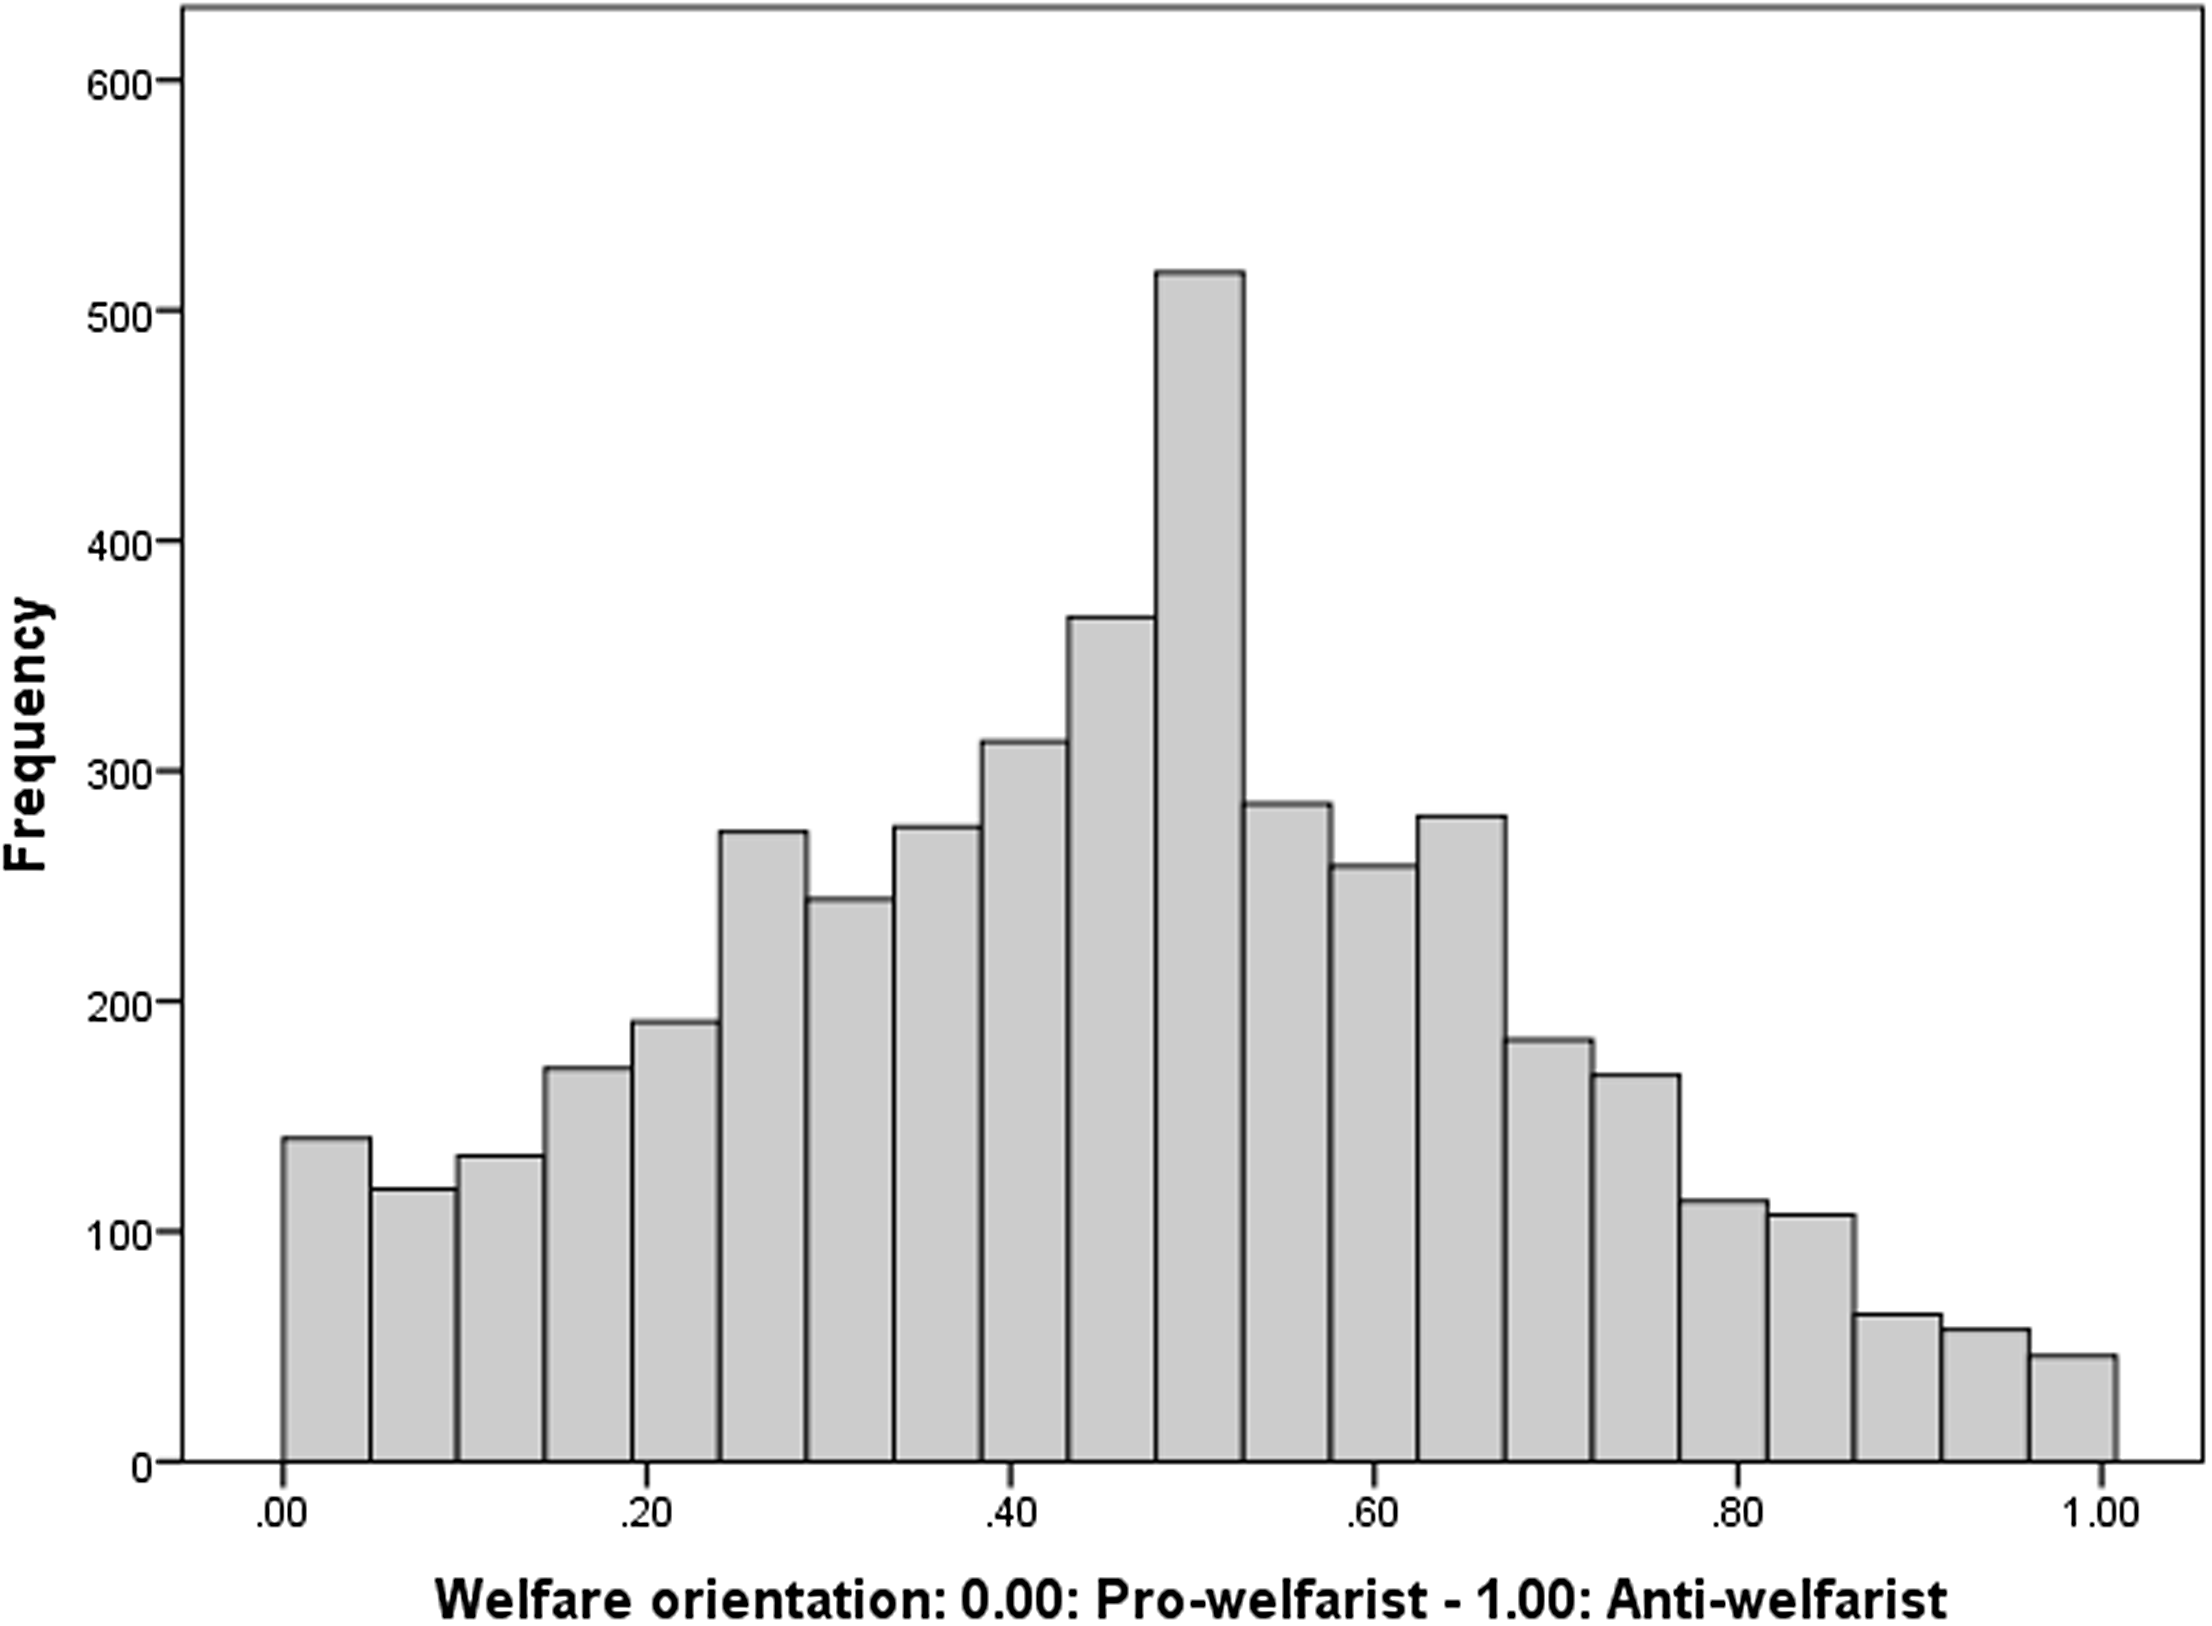
Welfare orientations range across a wide spectrum from very welfarist to very anti-welfarist. For each of the five statements, we find a significant number of respondents at either end of the spectrum (Table 1). There is some variation, with more people holding anti-welfarist positions on questions about incentivisation and motivation to work. Nearly half (45 per cent) agree that people could find work if they wanted and around 40 per cent feel that benefits are too generous and disincentivise work. On the other hand, only 14 per cent disagree that welfare cuts would be too damaging and only 28 per cent disagree with increasing welfare spending. Just over one in five (22 per cent) oppose redistributing higher incomes. So, we see some variation in views depending on how welfare questions are framed. However, across this range of questions, there are many people who hold strong views at either end of the spectrum (Figure 1). With a mean of zero point four five, we see a normally distributed scale. While there are some who strongly support redistributive welfare state principles, others strongly oppose them, with many falling somewhere in between those positions.
Responses to welfare attitude questions (Row %ages, N = 4428)

Table 1 Long description
The table presents responses to five welfare attitude questions, with percentages indicating levels of agreement or disagreement. The questions cover topics such as benefits disincentivizing work, the ability to find work, the damaging effects of welfare cuts, increasing welfare spending, and redistributing income. The table has five rows, each corresponding to a different question, and seven columns representing different levels of agreement: Agree strongly, Agree, Neither agree nor disagree, Disagree, Disagree strongly, and Don't know. Notable trends include a significant number of respondents agreeing that benefits disincentivize work and that people could find work if they wanted. Conversely, fewer respondents disagree with increasing welfare spending and the damaging effects of welfare cuts. The data highlights a range of opinions, with some respondents holding strong views at either end of the spectrum.
Distribution of welfare orientation scale (histogram, N = 4306).

Figure 1 Long description
A histogram displays the distribution of welfare orientation scale values. The x-axis ranges from 0.00 to 1.00, representing a spectrum from pro-welfarist to anti-welfarist orientations. The y-axis indicates frequency, with values ranging from 0 to 600. The histogram consists of 20 vertical bars, each representing a bin of welfare orientation values. The distribution shows a peak around the 0.40 to 0.50 range, indicating a higher frequency of individuals with moderate welfare orientation. The frequency gradually decreases towards both ends of the spectrum, with fewer individuals exhibiting extreme pro-welfarist or anti-welfarist orientations. The data appears to be continuous, and the bars are of consistent width. The histogram provides a visual representation of how individuals vary in their welfare orientation, highlighting the central tendency and spread of the dataset.
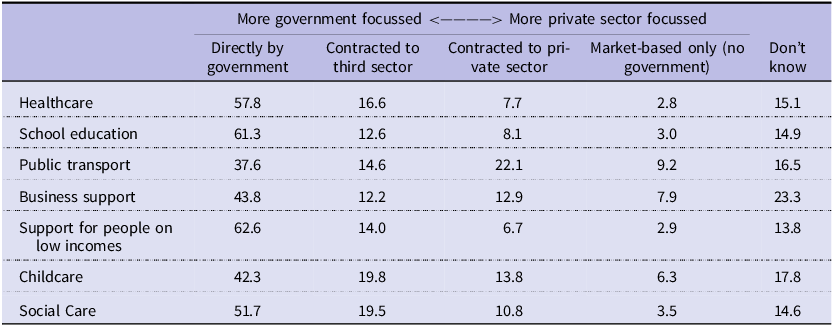
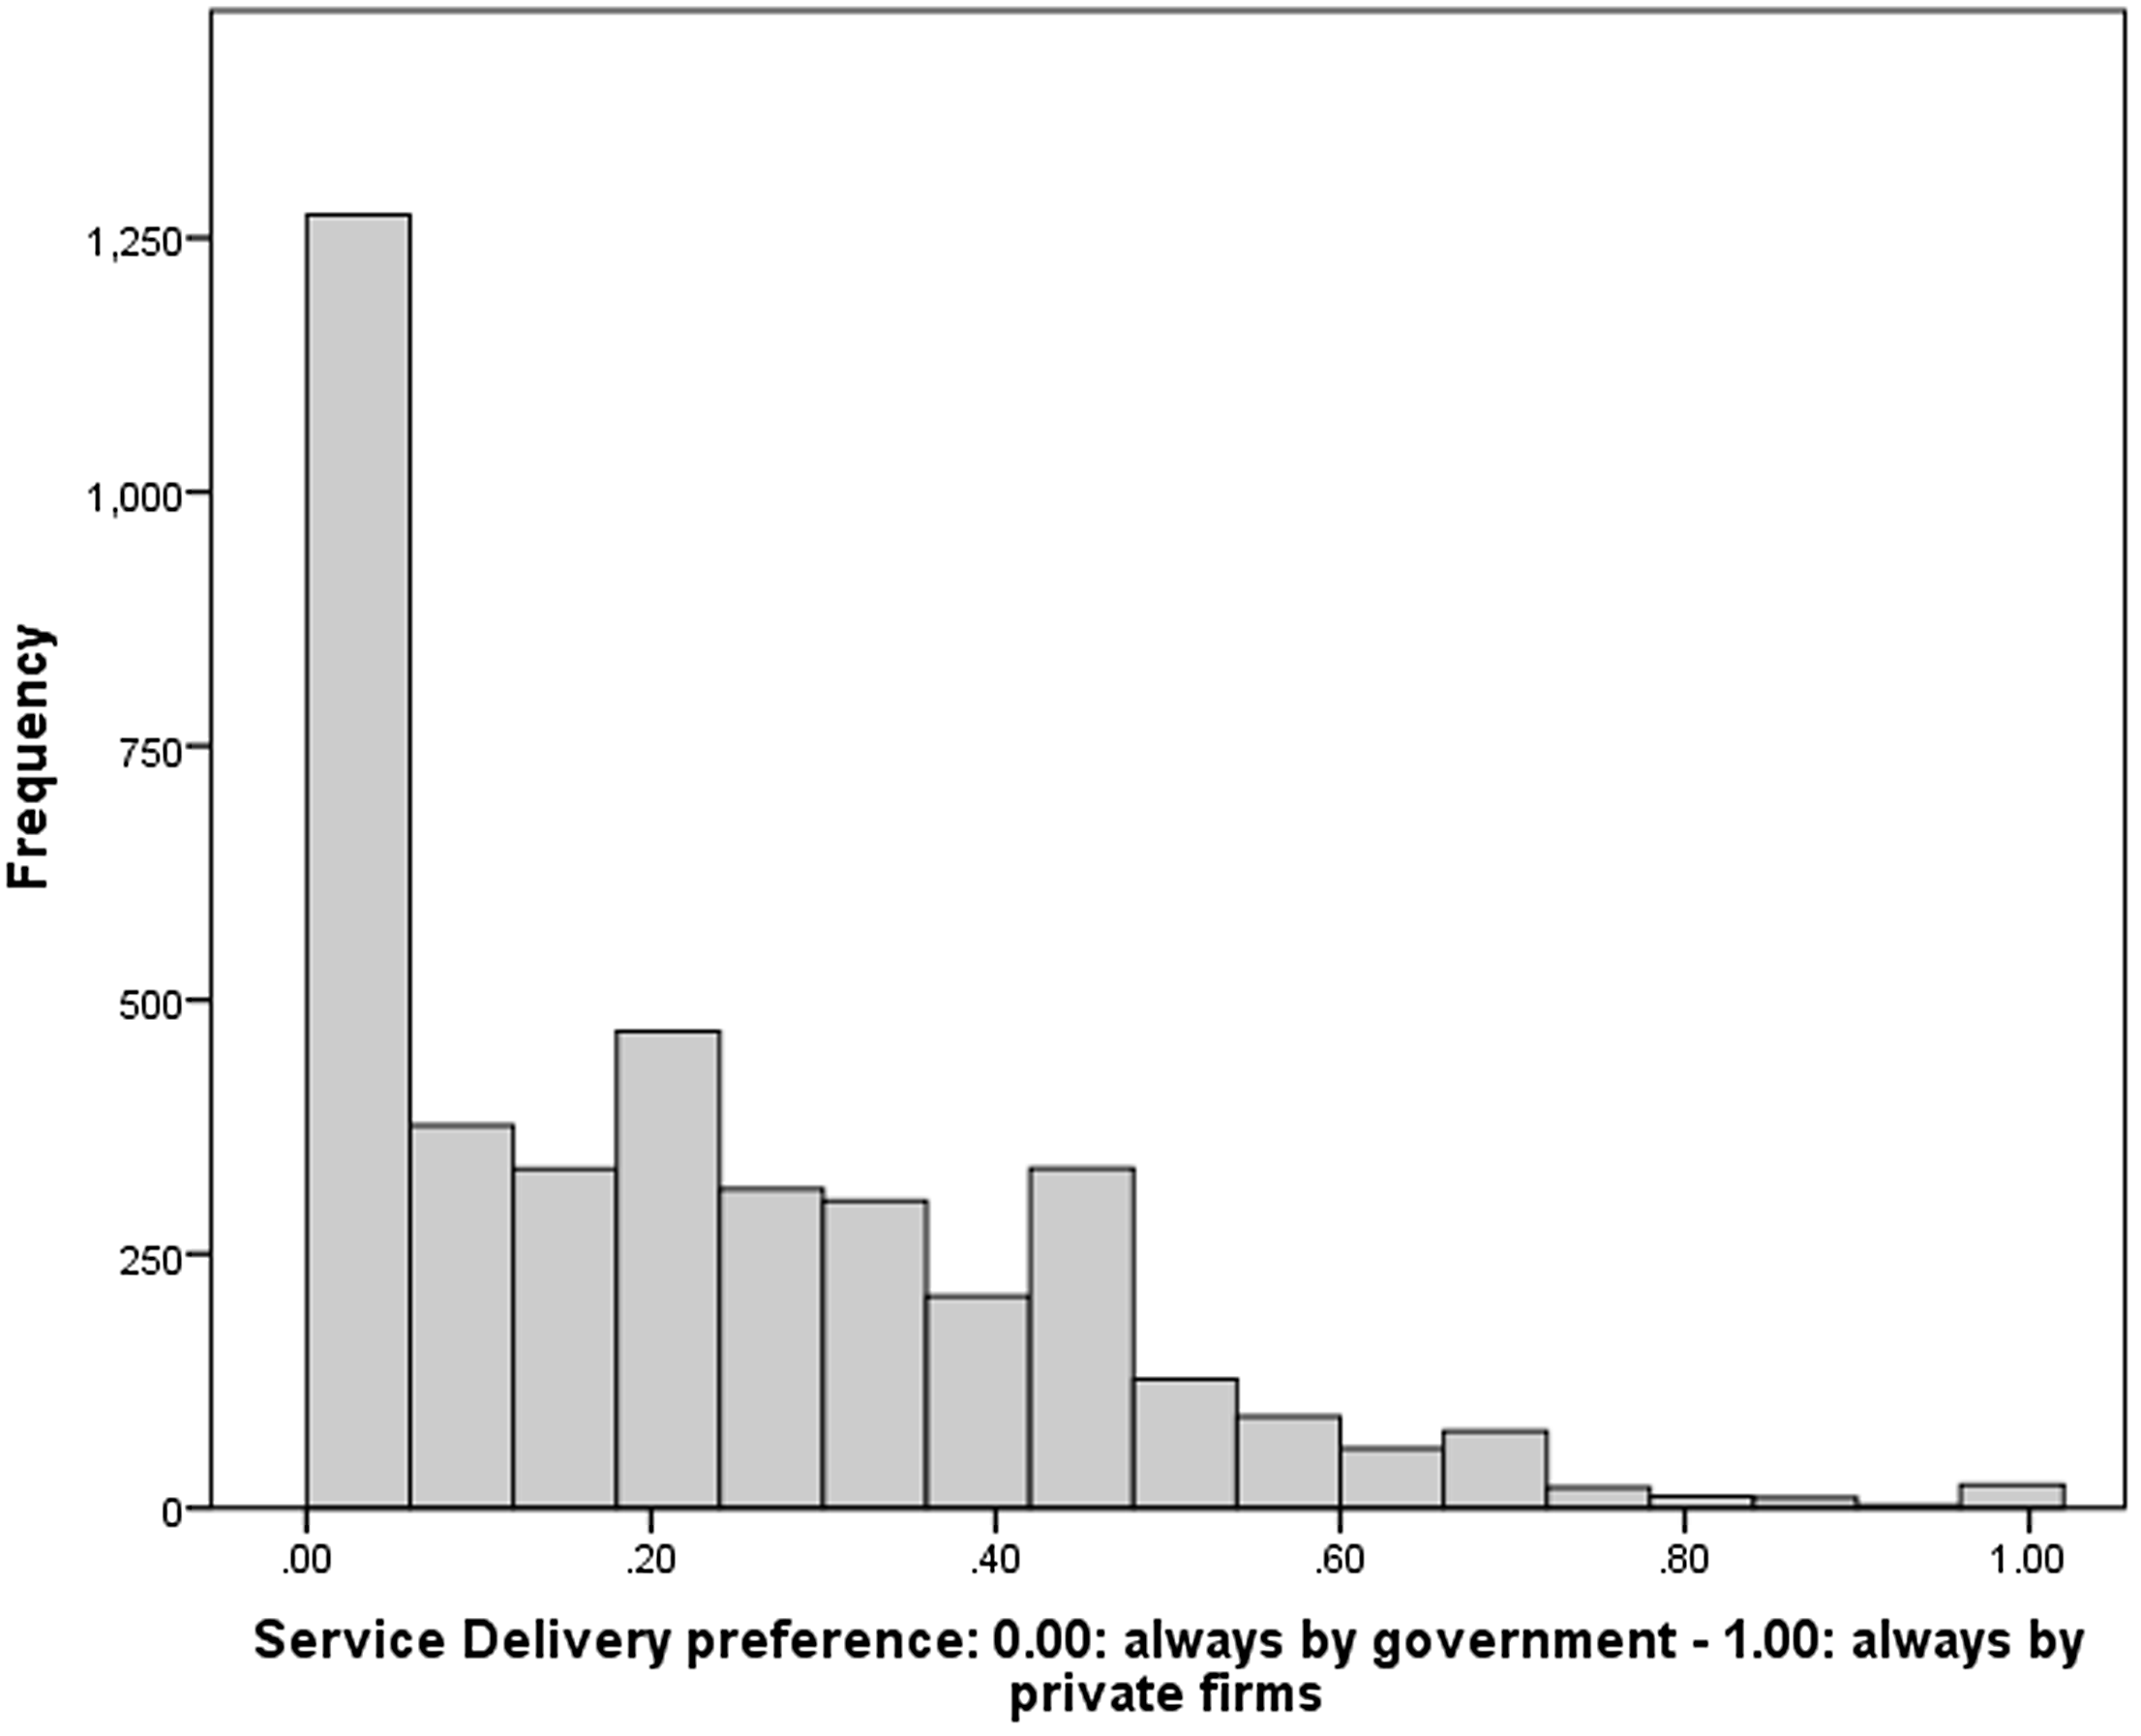
The picture is different when we look at service delivery. Overall, people rarely emphasise market-only solutions for any of the services asked about. It is highest for public transport, but still rather low at 9 per cent (Table 2). However, a variety of views emerge between public services being provided directly by government and being contracted out to either the private or the third sector. A majority of people think that support for people on low incomes, school education, healthcare, and social care should be delivered directly by government. A significant minority of people also favour direct government provision of public transport, business support, and childcare, but contracting out is also popular. One in five thinks childcare should be delivered by the third sector, with another fifth preferring the private sector as contractor or sole delivery agent. When it comes to public transport more people think it should be contracted to the private sector (22 per cent) than the third sector (15 per cent). While there is variation by service, the overall distribution of attitudes is quite distinct from overall welfare attitudes (Figure 2). A quarter of respondents want to see all services discussed to be delivered by government directly. Although some people are clearly more supportive of service delivery by the private-sector, for most this involves a significant amount of contracting out, rather than a purely market-based vision, thus resulting in a skewed distribution.
Responses to questions about service delivery preferences (Row %ages, N = 4428)

Table 2 Long description
The table presents data on public preferences for service delivery methods across different sectors, including healthcare, school education, public transport, business support, support for people on low incomes, childcare, and social care. The table has seven rows, each representing a different service, and six columns indicating the percentage of respondents preferring different delivery methods: directly by government, contracted to third sector, contracted to private sector, market-based only, and don't know. Notable trends include a majority preference for direct government provision in healthcare, school education, support for low incomes, and social care. Public transport and business support show more varied preferences, with significant support for contracting to the private sector. Childcare also shows a notable preference for third-sector involvement. The data highlights a general reluctance towards purely market-based solutions, with the highest support for such solutions being 9 percent for public transport.
Distribution of service delivery preference scale (histogram, N = 4028).

Figure 2 Long description
A histogram showing the distribution of service delivery preference scale with 10 vertical bars. The x-axis represents the service delivery preference ranging from 0.00, indicating a preference for government delivery, to 1.00, indicating a preference for private firms. The y-axis represents the frequency of responses, with values ranging from 0 to 1250. The highest bar, located at 0.00, indicates the most frequent preference for government delivery, with a frequency of approximately 1250. The frequency decreases as the preference shifts towards private firms, with the lowest bars around the 0.80 to 1.00 range. The distribution shows a right-skewed pattern, with most responses clustering towards the government delivery preference. All values are approximated.
The relationship between the two dimensions of attitudes
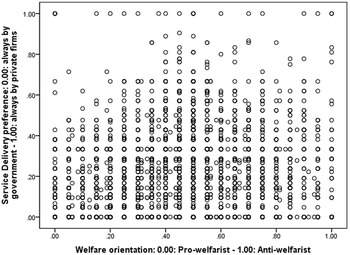
It is clear that the distributions of welfare orientations and service delivery preferences differ. But how do they relate to each other? Are those who hold pro-welfare views also consistently more likely to emphasise service delivery by government, suggesting a single underlying attitude dimension that might be considered politically as ‘left’? A scatterplot of the two scales reveals no obvious pattern (Figure 3). And at zero point one six seven, the Spearman’s rho correlation coefficient is statistically significant (p < 0.01) but substantially small. This suggests that there is some positive association between the two scales, but there are many people who do not fit a simplistic, one-dimensional account. This resonates with previous work by Roosma et al. (Reference Roosma, Gelissen and Van Oorschot2013), Garritzman et al. (Reference Garritzmann, Busemeyer and Neimanns2018), and Otjes (Reference Otjes2018).
Scatterplot of welfare orientations and service delivery preferences.

Figure 3 Long description
A scatter plot with hundreds of data points representing the relationship between welfare orientation and service delivery preferences. The x-axis ranges from 0.00 to 1.00, indicating welfare orientation from pro-welfarist to anti-welfarist. The y-axis ranges from 0.00 to 1.00, indicating service delivery preference from always by government to always by private firms. The data points are scattered throughout the plot with no clear clusters or outliers, suggesting a varied distribution of preferences across different welfare orientations. There is no visible trend or correlation between the two variables. All values are approximated.
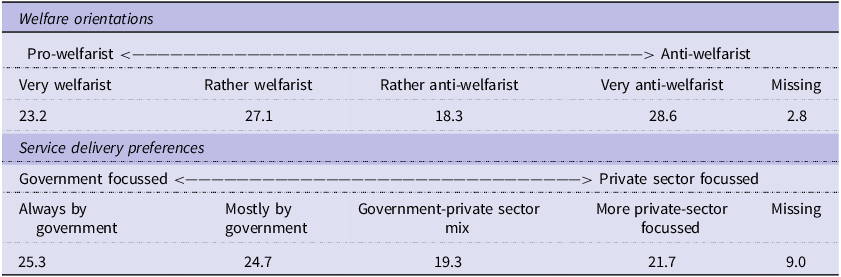
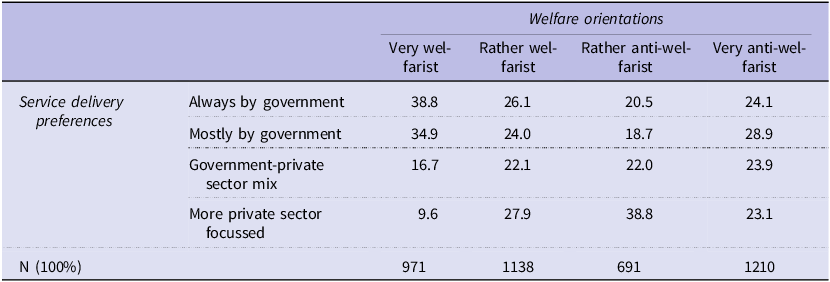
We gain a clearer picture by categorising the two scales and accounting for the different distributions. We split the welfare orientations scale into four groups, two on either side of the mean with categories ranging from very welfarist to very anti-welfarist (Table 3).Footnote 11 For service delivery preferences, we distinguish those who always select the government from those who select the government in most cases; those who tend to select a mix of government and non-government delivery options (mostly focussed on contracting out); and those who are more supportive of private sector delivery overall (typically a mix of contracting out and exclusively market-based mechanisms).Footnote 12 Putting the two dimensions together once again reveals fairly weak associations (Table 4). Those holding very welfarist views are more likely to also emphasise the government in service delivery. But those with rather welfarist views are roughly equally split in their views on service delivery. The same holds for those with rather or very anti-welfarist orientations. Except for those with rather anti-welfarist views being somewhat more likely to favour service delivery by the private sector, views on service delivery are rather evenly split.
Frequencies of welfare orientation and service delivery preference groups (Row %ages, N = 4428)

Table 3 Long description
A table with two sections: Welfare orientations and Service delivery preferences. Welfare orientations section has five categories: Very welfarist, Rather welfarist, Rather anti-welfarist, Very anti-welfarist, and Missing, with respective frequencies of 23.2, 27.1, 18.3, 28.6, and 2.8. Service delivery preferences section has five categories: Always by government, Mostly by government, Government-private sector mix, More private-sector focussed, and Missing, with respective frequencies of 25.3, 24.7, 19.3, 21.7, and 9.0.
Cross-tabulation of welfare orientation and service delivery preferences groups (Column %ages, excluding missing cases)

Table 4 Long description
The table presents a cross-tabulation of welfare orientation and service delivery preferences groups, displaying column percentages. It includes four welfare orientation categories: very welfarist, rather welfarist, rather anti-welfarist, and very anti-welfarist. Service delivery preferences are categorized into four groups: always by government, mostly by government, government-private sector mix, and more private sector focussed. The table shows that those with very welfarist views prefer government service delivery, while those with rather anti-welfarist views lean towards private sector delivery. The data reveals that views on service delivery are relatively evenly split among the other groups.
Such findings suggest that it would be a mistake to treat welfare orientations and service delivery preferences as reducible to a single attitudinal left-right dimension. There is little association between the two, mostly concentrated amongst those with strong pro-welfare views. Many people who are ‘welfarist’ share service delivery preferences with those who they disagree with in terms of welfare orientation. In the following section – maintaining the distinction between the two domains – we will explore what characterises people with these various attitude profiles.
Regression analyses
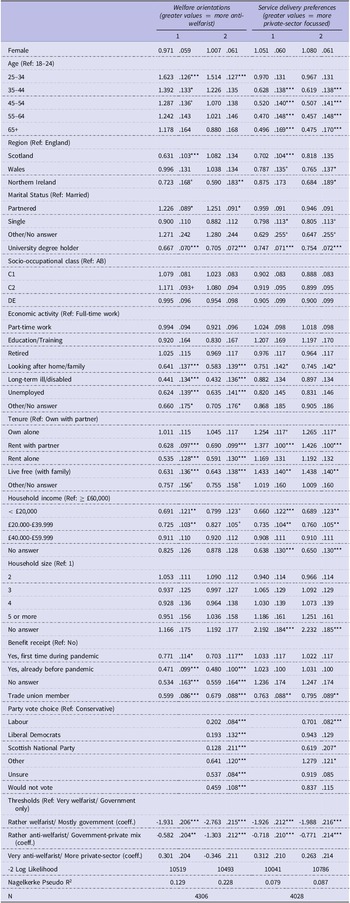
The multivariate analyses further demonstrate that it is essential to differentiate between welfare orientations and service delivery preferences, as the profiles associated with certain tendencies in each domain are not identical. A small number of factors, mostly reflecting socio-economic status, are associated in the same way for both: those with a university degree, those on lower incomes (below £40,000 household income), and those who are trade union members are more likely to hold pro-welfare orientations and government-focussed service delivery preferences (Table 5). However, beyond those factors, profiles differ extensively.
Ordinal regression models (with logit functions) for welfare orientations and service delivery preferences

Table 5 Long description
The table presents data on welfare orientations and service delivery preferences, segmented by gender, age, region, marital status, education, economic activity, tenure, household income, household size, benefit receipt, trade union membership, party vote choice, and thresholds of vote. The table includes columns for welfare orientations (greater values indicate more anti-welfare) and service delivery preferences (greater values indicate more private-sector focus). It lists various demographic categories such as age groups, regions, marital statuses, education levels, economic activities, tenure types, household incomes, household sizes, benefit receipt statuses, trade union memberships, party vote choices, and thresholds of vote. Each category is associated with specific values indicating the level of welfare orientation and service delivery preference.
Significance values: +p ≤ 0.10 *p ≤ 0.05, **p ≤ 0.01, ***p ≤ 0.001.
Displayed are exponentiated coefficients (odds ratios) with standard errors (except for thresholds which are shown as coefficients). Results are weighted to match UK population parameters
This is immediately apparent when we compare people’s economic activity status and their connection to the benefit system. There are differences in welfare attitudes between people who are employed or self-employed and those who look after family at home, are economically inactive due to long-term illness or disability, or are unemployed. Compared to them, those who work are significantly more likely to hold anti-welfarist views. Furthermore, people who receive benefits are more pro-welfarist than those who do not. But we do not find a similar relationship with service delivery preferences. Only those looking after family at home show somewhat more statist service delivery attitudes. While economic activity and benefit status relates to people’s attitudes about the welfare state, it does not appear to be related to their views on how services should be delivered.
The personal living situation affects both attitudinal dimensions – but in different ways. People who rent or live for free (for example with their parents) are more likely to have pro-welfare attitudes than people owning outright. But at the same time, they are also more likely to favour a stronger involvement of private actors in the delivery of services. Respondents’ relationship status also matters, but differently for certain groups. Compared to those who are married, partnered people are more likely to be anti-welfarist (but do not hold distinct service delivery views), while people who are single are more likely to favour government-focussed service delivery (without having distinct welfare attitudes).
Views at the same spot on the two dimensions are not held by the same groups of people. This becomes particularly evident when we compare age groups. On welfare attitudes, we find a U-shaped pattern. The youngest respondents (eighteen to twenty-four) are significantly more welfarist in their outlook than those in middle age ranges, especially those aged twenty-five to forty-four, while those in the oldest age ranges (fifty-five and older) are not significantly different from those young respondents. The pattern for service delivery preferences, however, is different: younger respondents are much more likely to favour greater involvement of non-government actors in service delivery. Compared to the youngest age group, people aged forty-five and above are much more likely to support stronger government involvement.
All these results are robust to controlling for which, if any, political party respondents would vote for. However, partisanship itself is strongly related to attitudes. Labour supporters are both more welfarist and more likely to support government involvement in service delivery than Conservative voters, with the effect being much greater for welfarism. The same applies to SNP (Scotish National Party) voters. For supporters of the Liberal Democrats, and those unsure or not voting, there is only an effect on welfarism. While they are more welfarist than Conservative voters, they do not differ significantly from Conservatives in their preferences on service delivery. Taking into account party preferences also alters the findings on comparisons between the constituent parts of the UK. On average, Scottish respondents are more welfarist and government-focussed than their English counterparts, but the effect disappears when we control for party preferences, suggesting that the difference is reflected in alternative political choices. In Northern Ireland, we find the opposite: once party support is controlled for, effects become more pronounced, with respondents tending to be more welfarist and government-focussed than those in England. Welsh respondents are also more government-focussed on average, but show no significant differences to England in their views on welfare.
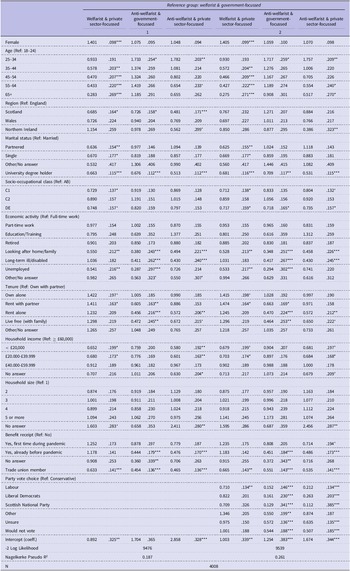
The findings demonstrate that we should not treat welfare orientations and service delivery preferences as synonymous but instead as each capturing different aspects of attitudes towards how the social policies should be organised and delivered. But if we do not collapse the two into one simplistic left-right continuum, can we learn more by looking at them jointly? Table 6 presents the results from multinomial regressions in which we compare our respondents according to which combination of welfare and service delivery views they have. Doing so provides us with insights we did not gain from looking at both sets of perspectives individually – or could have observed had the study reduced everything to one single dimension.
Multinomial logistic regression models for welfare orientations and service delivery preferences combined

Table 6 Long description
The table presents multinomial logistic regression models for welfare orientations and service delivery preferences combined. It includes data on various demographic groups such as age, region, marital status, education, economic activity, household income, household size, benefit receipt timing, trade union membership, and party vote choice. The table has 4008 rows and 37 columns, with each row representing a different combination of welfare and service delivery views. Key trends and comparisons are highlighted, such as the differences in preferences among different age groups, regions, and economic activities. The table provides insights into how these factors influence attitudes towards social policy organization and delivery.
Significance values: +p ≤ 0.10 *p ≤ 0.05, **p ≤ 0.01, ***p ≤ 0.001.
Displayed are exponentiated coefficients (odds ratios) with standard errors (except for the intercept which is shown as coefficient). Results are weighted to match UK population parameters.
While we did not see any gender patterns for each dimension separately, we find that women are more likely than men to be in the pro-welfare and private sector-focussed group (compared to the pro-welfare and government-focussed group). We also see greater nuance in the age relationships. Twenty-five- to thirty-four-year-olds are more likely to be found in either anti-welfarist group (regardless of service delivery preferences) compared to the youngest respondents. However, they are not more likely to be in the pro-welfare, private sector focussed group than eighteen- to twenty-four-year-olds. The distinction for them is largely on welfare attitudes. Beyond thirty-five-years-old, the older respondents get the less likely they are to be found in the group favouring welfare and more private sector delivery. Once party preferences are controlled for, the oldest respondents (the over sixty-fives) are just as likely as the youngest to be in the anti-welfare, pro-government group, but less likely to be in the anti-welfare, anti-government group (compared to being in the pro-welfare, pro-government group). In short, age patterns are multi-dimensional and non-linear.
These nuanced insights are not restricted to socio-demographic characteristics. While no major differences emerged on socio-occupational class variation for the analysis of each domain in its own right, we find noteworthy distinctions when comparing the combined attitude profiles. People in the D/E classes are significantly more likely than those in A/B to be in the welfarist and government-focussed group than any other. They have a greater tendency to hold both views simultaneously than the opposite views on both or one of the domains. This tendency is not visible if we study each domain by itself and we could not describe it adequately if we had collapsed all attitudes into one dimension.
Distinguishing between welfare orientations and service delivery preferences, and then investigating them jointly, provides us with a deeper understanding of attitudinal profiles about key issues in social policy debates. This is reflected again when comparing party preferences. Labour voters are the only supporters that are more likely to be in the welfarist, government-focussed group than any other one compared to Conservative voters. Liberal Democrat and SNP supporters, those unsure, and those unwilling to vote are, on the other hand, less likely than Conservatives to be in either of the two anti-welfarist groups, but not significantly less likely to be in the welfarist, private sector-focussed group.
Discussion
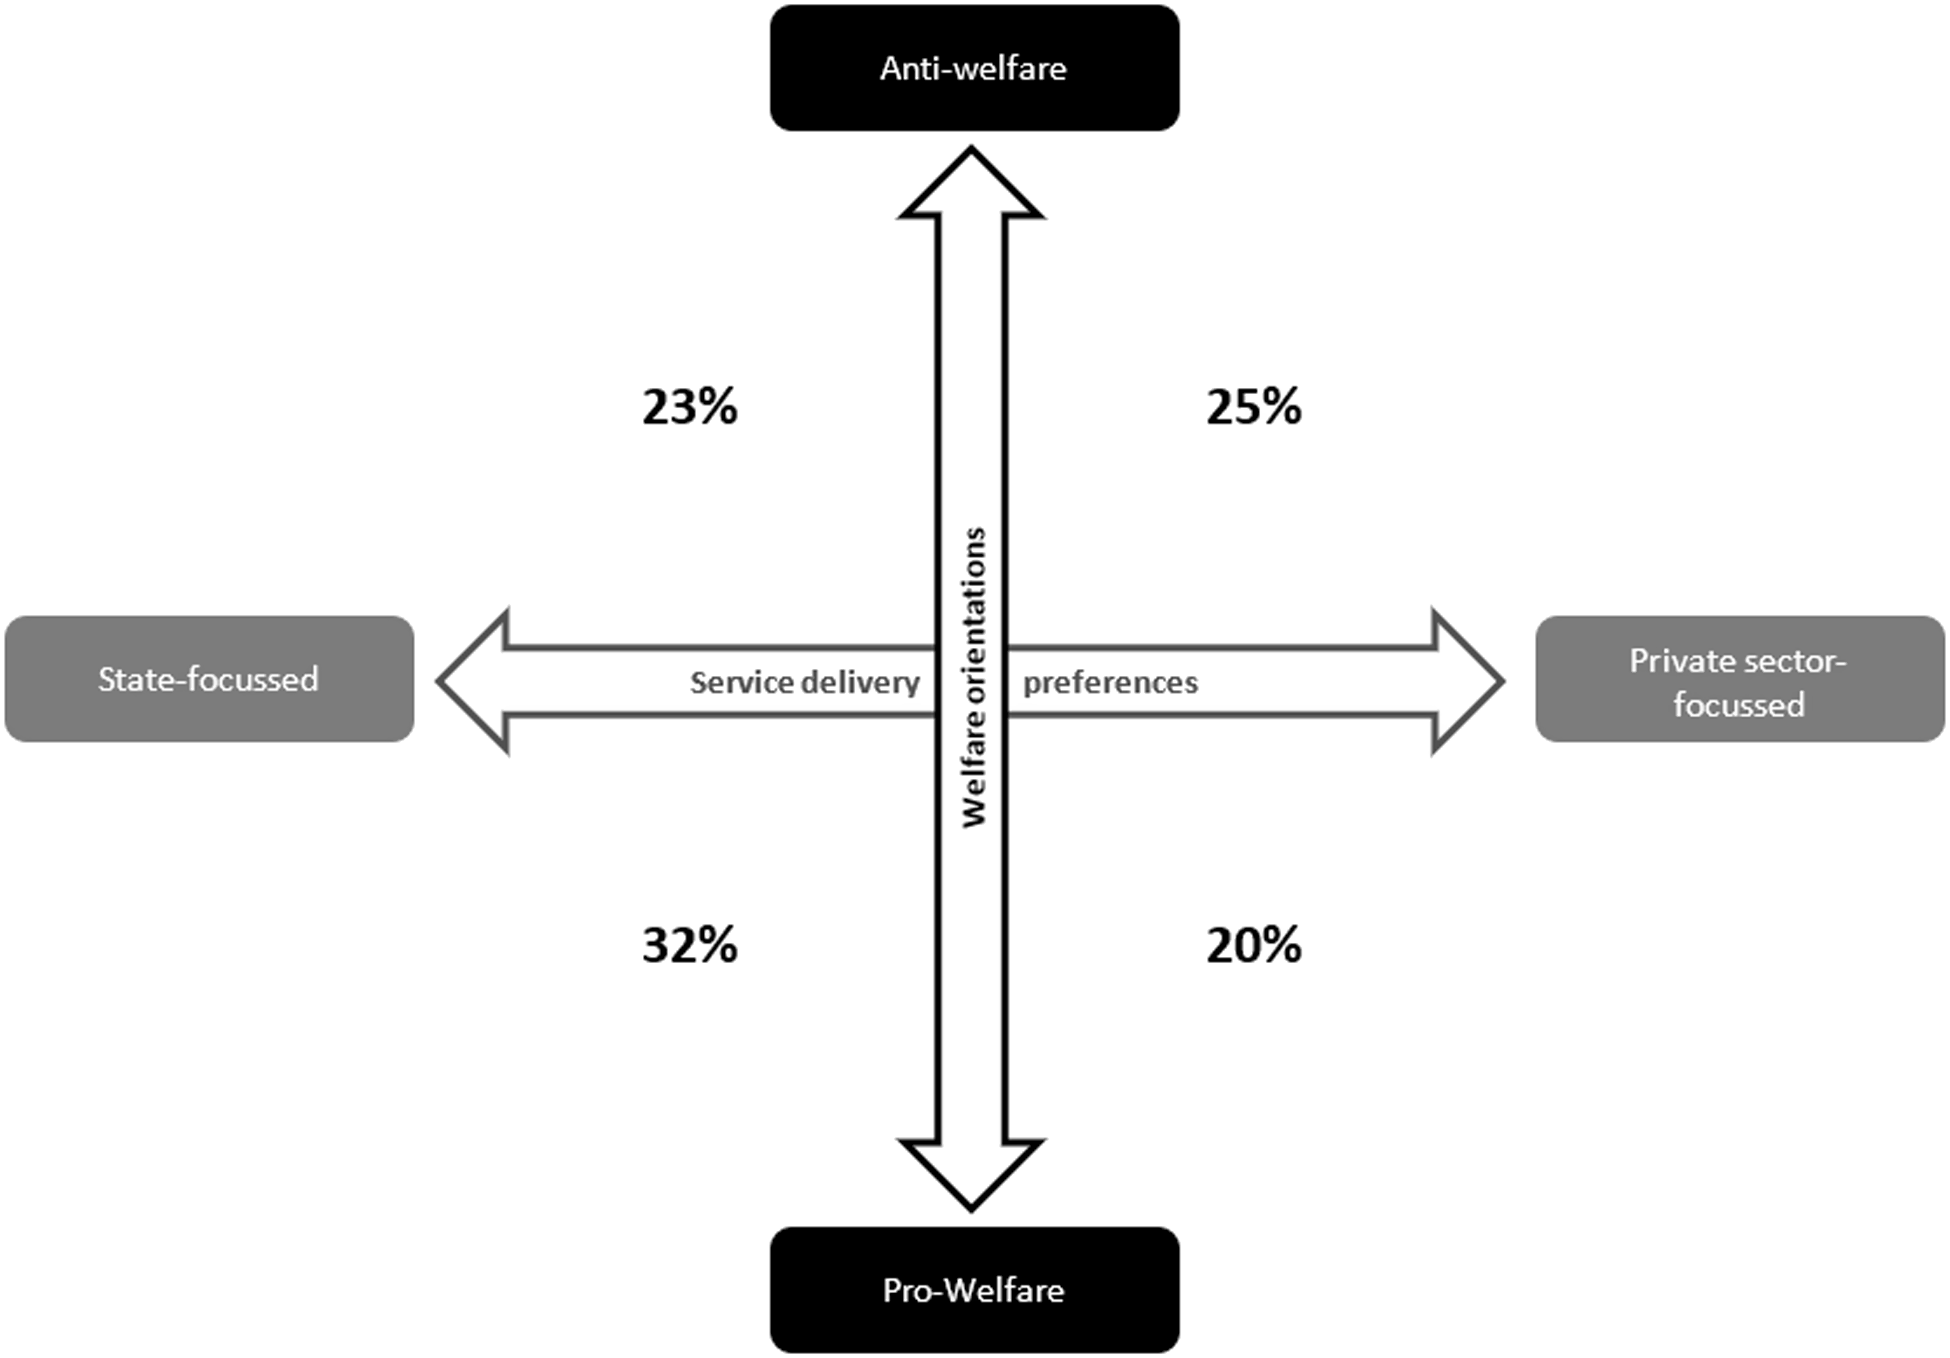
The results suggest a UK electorate that could be placed into four boxes (Figure 4). The first two boxes – pro-welfare and pro-state delivery of public services, anti-welfare and anti-state delivery of public services – chime with the idea of a single, higher-level, ‘left-right’ divide. The latter two boxes – pro-welfare and anti-state, anti-welfare and pro-state – are more intuitively confusing. Crucially, our findings show that attitudes across these two domains are not reducible to a single left-right orientation. That finding itself adds considerable weight to the existing literature that has sought to nuance how we understand public attitudes and how we construct and understand ‘the political left’ and ‘the political right’ (Otjes Reference Otjes, Bardi, Kriesi and Trechsel2014, Reference Otjes2018).
Overview of welfare and service delivery preference profiles of the adult UK public.

Figure 4 Long description
The diagram presents an overview of welfare and service delivery preference profiles among the adult UK public. It features a cross with four quadrants labeled 'Anti-welfare', 'Pro-Welfare', 'State-focussed', and 'Private sector-focussed'. Arrows connect these quadrants, indicating different orientations and preferences. The percentages 23 percent, 25 percent, 32 percent, and 20 percent are displayed along the arrows, representing the distribution of preferences. The horizontal axis represents service delivery preferences, while the vertical axis represents welfare orientations.
Our findings on age suggest that assumptions about specific population groups holding certain views should be avoided. Assertions about ‘left-leaning youth’ and ‘right-leaning older people’ are too simple. In line with broader findings on UK public attitudes to welfare, and how they have begun to shift in a more positive direction from the negative heights they reached during the New Labour years (Curtice, Reference Curtice2022; cf. Orton and Sarkar, Reference Orton and Sarkar2023), it is interesting that the youngest (eighteen- to twenty four-year-olds) – those who politically came of age during the period of austerity post-2010 – are more pro-welfarist than twenty five- to forty four-year-olds. However, the same pattern does not hold for service delivery preferences, with eighteen- to twenty four-year-olds less likely to support government delivery of public services. This suggests that, despite some headline catching scandals (House of Commons 2018, 2021), there has yet to be a similar backlash to the outsourcing or privatisation of public services as there has been to benefit cuts, at least amongst younger people. Beyond them potentially expressing dissatisfaction with public services that they have experienced in their lives (e.g., schools), this corresponds to arguments put forward by Grasso et al. (Reference Grasso, Farrall, Gray, Hay and Jennings2019) who identified a ‘political generation effect’. If neoliberalism, as a philosophy about the primacy of the market to deliver public services as commodities (see Spicker Reference Spicker2024), has become as pervasive as some suggest, it might not come as such a surprise that younger people have this outlook.
Overall, the findings suggest that the public are, at least intuitively, in favour of the state delivering key public services. This resonates with opinion polling conducted in the context of the 2019 UK general election showing that, ‘a substantial majority of UK voters’, supported, ‘nationalisation and public sector operation of post, water, energy, rail and buses’ (Hall, Reference Hall2020: 2). This could suggest that the turn to marketisation may have been elite-, not voter-led, shaped by attempts of political parties to respond to diffuse voter dissatisfaction with public services in a context of tighter public finances (see Gingrich Reference Gingrich2011). Beyond that, as Béland and Morgan (2020: 178) suggest, ‘the needs and tastes of a large, educated middle class also shaped scepticism towards state-heavy social programmes’. Offering some support for that contention, our findings suggest that those in the managerial and supervisory social classes were less likely than those in routine occupations to be in the pro-welfare/pro-state quadrant of Figure 4.
Our findings add further evidence to the argument that the public is open – and potentially receptive – to a broader narrative about the role of the state in delivering key public services beyond what are often thought of as the classic social services of health, education, and social security (Spicker, Reference Spicker2024: 281). This is perhaps unsurprising in light of opinion polling suggesting a public that is highly pessimistic about the future of public services (Ipsos, 2023). That pessimism is a product of a period, since the Thatcher government took office in 1979, of privatisations of various public services (under Thatcher and Major), the ongoing quasi-marketisation of public services (under New Labour), and a combination of both since 2010 (see Reader and Burchardt, Reference Reader and Burchardt2023). Considering a broader range of services such as water, energy, and buses – the sort of services that many of those who advocate for Universal Basic Services (see Coote, Reference Coote2022) argue ought to be under public control – Bayliss et al. (Reference Bayliss, Mattioli and Steinberger2021: 482) observe that, ‘the privatisation of essential services in Britain went considerably further than elsewhere in the world’ (see also Wilks, Reference Wilks, McBride and Evans2017). Such services are increasingly a focus of UK policy debates about how they should be delivered and whether indeed they should be (re)-considered as ‘public services’ rather than as commodities.
UK headlines have been filled with stories of private water companies discharging sewage into rivers (Newson, Reference Newson2024), while people in England and Wales face some of the highest water bills in Europe (Helm, Reference Helm2020). A period of soaring energy costs cast a spotlight on how the way that the British energy system is organised is a major contributor to cost-of-living issues (Hall, Reference Hall2022). Although some commentators continue to make the case for firmer regulation, rather than nationalisation (e.g., Economist, 2023), campaigns for public ownership and delivery of key services, ‘have won strong and growing public support because of the continuing real problems with the economics and operation of privatised companies’ (Hall, Reference Hall2020: 10).
The policy debate in the UK is shifting in a slow, meandering way. For progressive political parties such as Labour, building an argument that the control and delivery of key services by government in the public interest could be as viable as arguing for a more redistributive or generous welfare system. The Labour party has often been reluctant to enter debates about the service delivery aspect of public policy. The 2017 and 2019 Labour manifestoes contained numerous commitments to (re)-nationalise several industries – Royal Mail, railways, buses, water, and, at least partially, energy. It was this that most obviously set that manifesto apart from those of 2015 and 2024. Recently, elected Metro Mayors at the devolved level in England have taken steps in this direction, the most prominent example being Greater Manchester’s Mayor, Andy Burnham, taking buses back into public control (see Blakeley and Evans, Reference Blakeley and Evans2023: 74-97) – a policy subsequently adopted in other places. Following his re-election in May 2024, Burnham declared his intention to build 10,000 new council homes and suspend the ‘right-to-buy’ policy for new properties, a move that would shift the dial on housing policy in a more public direction (Burnham, Reference Burnham2024).
A narrative about public ownership in the interest of citizens rather than commodified services in the (supposed) interest of consumers would require Labour to engage in a deeper debate about the relationship between the state and the market, in other words a critique of the type of market economy that currently dominates in the UK. However, in the UK and beyond, Labour parties have often adopted a ‘thin Labourism’ that offers, ‘no critique of the market economy’ (Manwaring et al., Reference Manwaring, Duncan and Lees2024: 14). Developing a political narrative around the delivery of key services (in part directly by the state) would return the Labour party to a long-established narrative about how investment in social services and benefits in kind can create fairer market outcomes in the first instance, rather than mitigating the worst effects of market outcomes at the back-end through a more generous system of transfer payments (Sloman, Reference Sloman2018: 737-38) – in other words a shift back towards ‘statism’ from ‘welfarism’.
Perhaps most importantly, what our findings underscore is the need to further, and better, understand people’s attitudes to social policy and how they relate to broader understandings of the economy, public finances, and government. Our findings suggest that a lot can be uncovered through the development of more precisely crafted and nuanced surveys that explicitly aim to probe the complexity of public understandings. Our study is limited by the structure of the underlying survey. It would be fascinating, for example, to study how not only welfare attitudes, but service delivery preferences change over time across a broader range of policy areas, such as housing, energy, water, and digital connectivity. For this, the incorporation of such measures into recurring surveys, or the development of newly dedicated surveys utilising a panel structure, would be desirable.
In this study we looked at the profiles of people holding particular views on welfarism or statism. Doing so in-depth was necessary to demonstrate the distinction between both domains. In further research, it would be instructive to study in more detail how both dimensions relate to each other and intersect in their relationship to other attitudes – such as views about government and markets – using different analytical approaches, including, for example, structural equation modelling. Finally, an area not covered in our analyses is the factual knowledge people have about social policy and the economy. Existing research has shown that the UK public’s knowledge is moderate at best (Geiger, Reference Geiger2018). Engaging with the interplay between attitudes and knowledge is complex (see Eichhorn et al., Reference Eichhorn, Kenealy and Bennett2024) and beyond the scope of this paper. Nevertheless, it would be an important extension to address the extent to which attitudes are, or are not, related to substantial knowledge. Similarly, our analysis does not allow us to explore the construction of meaning people perform when answering survey questions. Qualitative work would be useful, especially in group settings (see Goerres and Prinzen, Reference Goerres and Prinzen2012) where the structure of discussions on various social policy topics would provide insights into the underlying mental models people draw on when engaging with such topics.
Competing of interests
There is no conflict of interest to be reported.
Funding
The data collection for this project was funded by the University of Edinburgh’s School of Social and Political Science.

 Open access

