


Hearing voices (also known as auditory verbal hallucinations) is common, with an estimated 13% of the population having this experience. Reference Beavan, Read and Cartwright1 It can be associated with mental illness, psychological trauma, hearing loss or neurological conditions, but can also be present for individuals with no specific illness or other ‘pathology’. Reference Beavan, Read and Cartwright1,Reference Farrugia and Grech2 Auditory verbal hallucinations can take different forms and these can be informative in relation to diagnosis and intervention planning. Reference Reddyhough, Locke, Badcock and Paulik3,Reference Johns, Kompus, Connell, Humpston, Lincoln and Longden4 Notably, many voice hearers do not experience distress or impairment related to voice hearing, and are therefore unlikely to seek out treatment services. Reference Johns, Kompus, Connell, Humpston, Lincoln and Longden4 However, those individuals who are distressed by voices or whose behaviours are influenced by voice hearing are more likely to come into contact with mental health services. Reference Johns, Kompus, Connell, Humpston, Lincoln and Longden4,Reference Løberg, Gjestad, Posserud, Kompus and Lundervold5
For some individuals, pharmacological treatment may be ineffective or undesirable, so other approaches to treatment are required. Even when other treatments are effective, many voice hearers appreciate and benefit from exploring their voice-hearing experiences. Reference Coffey and Hewitt6,Reference Holt and Tickle7 Over recent decades, newer understandings and approaches to exploring voice-hearing experiences have emerged. Reference Corstens, Escher, Romme and Longden8–Reference Romme and Escher10 These have moved away from more traditional approaches that typically discouraged the exploration of voice-hearing experiences. Reference Chadwick and Hemmingway11
A variety of approaches to exploring voice-hearing experiences have shown benefits in terms of lower levels of distress about voices, better management of and coping with voices, and overall enhanced sense of recovery. Reference Hall, Terry and Hayward9,Reference Corentin, Fitzgerald and Goodwin12 Despite these benefits, existing literature identifies that workers may hold stigmatised attitudes toward voice hearing Reference Reddyhough, Locke, Badcock and Paulik3 or lack confidence or feel uncertain about how to effectively provide this support. Reference Coffey and Hewitt6,Reference Jones and Jacobsen13–Reference White, Stein-Parbury, Orr and Dawson15 Negative or pathologising views can contribute to stigma, reduce therapeutic alliance and discourage open dialogue about voices, thereby impeding recovery. Reference Reddyhough, Locke, Badcock and Paulik3 Supporting staff to develop more positive attitudes and confidence in exploring voice-hearing experiences is likely to support enhanced trust, validate lived experience and support meaning-making, which are all associated with improved engagement and outcomes. Reference Reddyhough, Locke, Badcock and Paulik3 This need has led to calls for evidence-based resources and materials to be made available to support workers to develop skills in this area. Reference McCluskey and de Vries16,Reference Rammou, Berry, Fowler and Hayward17
One resource designed to improve mental health workers’ confidence and skills in exploring voice-hearing experiences is ‘Let’s Talk About Voices’. Designed based on principles from the Hearing Voices Movement, 18,19 it is a suite of short videos and worksheets that voice hearers can use independently or alongside mental health workers to explore their voice-hearing experiences. Our research team was tasked with evaluating the impact of Let’s Talk About Voices on health workers’ beliefs, attitudes, confidence and behaviours related to working with voice hearers. A literature search was undertaken to identify existing measures that could be implemented, but no suitable measure could be identified. Therefore, it was necessary to develop a new measure for use in this study. This new measure was named the Supporting Voice Hearers Measure (SVHM). The aim of this paper is to evaluate the measurement properties of the SVHM.
Method
Measure development
The SVHM was co-designed by a stakeholder group consisting of four researchers (including one lived experience researcher), four clinicians (including two developers of Let’s Talk About Voices), two consumer peer workers and three voice hearers who were not peer workers but were familiar with the voice hearing approach and Let’s Talk About Voices. Development was conducted through iterative cycles including three online workshops. At the first workshop, participants brainstormed the changes in mental health workers that they wanted and expected to occur as a result of interacting with Let’s Talk About Voices. Collectively, the group suggested a wide range of items. The researchers explained the Theory of Planned Behaviour Reference Ajzen20 and proposed using it to help structure the measure to ensure that the range of factors that influence actual behaviour were adequately covered. The Theory of Planned Behaviour has been used for similar assessments, Reference Rammou, Berry, Fowler and Hayward17 as well as in designing many other behaviour change interventions and studies. In this study, the Theory of Planned Behaviour was used to map items generated by the stakeholder group against components of the model to ensure that all aspects identified in the model as being important for behaviour change were included in the final measure.
After the first workshop, researchers mapped suggested items to constructs from the hearing voices literature Reference Holt and Tickle7,Reference Hall, Terry and Hayward9,Reference McCluskey, Watson, Nugent, O’Connor, Moore and O’Brien14,Reference McCluskey and de Vries16,Reference Rammou, Berry, Fowler and Hayward17,Reference Clements, Coniglio and Mackenzie21,Reference McMullan, Gupta and Collins22 and the Theory of Planned Behaviour to ensure coverage. An item was added to measure the ‘subjective norms’ construct of Theory of Planned Behaviour, which was missing from the initial set. Ideas generated were reviewed and similar items merged to construct a preliminary set of 31 possible items. These were presented to stakeholders at the second workshop. Stakeholders also sought to identify repetitive items to delete to make the measure as short as possible (preferably 20 items or fewer). Stakeholders identified items that measured similar enough concepts to merge or eliminate, added or split some items, and discussed and changed wording of a number of items, for example, to achieve a neutral and non-judgemental tone.
After the second workshop, a near-final list was written up and presented to the group at the next workshop. After several final minor changes, all stakeholders agreed to adopt the final measure. The SVHM consisted of 23 items, each rated on a five-point Likert scale from strongly disagree (1) to strongly agree (5).
Pilot testing suggested that it would take less than 7 min to complete. A full list of items, categorised by the domains of the Theory of Planned Behaviour, are listed in Box 1. A full copy of the SVHM is available in the Supplementary Material available at https://doi.org/10.1192/bjo.2026.11005.
Public and patient involvement
The research team included a researcher who had lived experience of voice hearing. The stakeholder group included three voice hearers and two consumer peer workers.
Data collection
Data reported in this study were collected as part of a randomised controlled crossover trial evaluating the impact of Let’s Talk About Voices on staff beliefs, attitudes, confidence and behaviours related to working with voice hearers. The authors assert that all procedures contributing to this work comply with the ethical standards of the relevant national and institutional committees on human experimentation and with the Helsinki Declaration of 1975, as revised in 2013. All procedures involving human patients were approved by the University of Sydney Human Research Ethics Committee (protocol #2023-819). All participants provided written informed consent.
Participants completed the SVHM at enrolment and were then randomised to either group A (received access to the resources straight away) or group B (placed in a waitlist control condition). After a month, participants completed the SVHM again, and group B were provided access to the resources. Participants completed the SVHM a third time 1 month following the second completion.
Analyses
Measurement properties of the SVHM
Analyses were completed to examine the measurement properties of the SVHM, using the Rasch analysis program Winsteps (version 5.6.2.0 for Windows; Winsteps, Portland, Oregon, USA; www.winsteps.com). Developed from Item-Response Theory, Rasch analysis is a well-recognised approach to exploring measurement properties of instruments used in educational and health service contexts. Reference Bond and Fox23 The Rasch measurement model Reference Rasch24 is based on two core assumptions. In the context of this study, these assumptions are: (a) all individuals will be more likely to affirm those items on the SWHM that are ‘easier’ to affirm and (b) those individuals who have higher beliefs, attitudes, confidence and behaviours related to supporting voice hearers will be more likely to affirm all items on the SVHM. Rasch analysis, using the Rating Scale Model, Reference Andrich25 converts ordinal measure scores (such as the Likert-sale items in the SVHM) and places people and items onto the same unidimensional scale. The specific measurement properties evaluated were rating scale validity, unidimensionality, statistical reliability, overall construct validity and person-fit statistics. Additionally, non-Rasch based analyses were conducted to evaluate concurrent validity, responsiveness and time taken to complete the SVHM. For all analyses, negatively worded items were reverse coded so that higher scores reflected higher levels of beliefs, attitudes, confidence and behaviours related to supporting voice hearers.
Rating scale validity
Rating scale validity is examined through several quality control criteria. First, average measure scores for each rating scale category should progress monotonically. This means that individuals who affirm ‘strongly agree’ on any item are more likely to have higher overall measure scores than people who affirm ‘agree’ or ‘neither agree nor disagree’. Reference Linacre26 If average measure scores do not progress monotonically, this may suggest that respondents cannot distinguish between adjacent categories or may interpret response options in varying ways. Second, Rasch–Andrich thresholds should progress monotonically. Reference Linacre26 Rasch–Andrich thresholds indicate where each item becomes modal (i.e. the person-ability level where it is most likely that individuals will affirm the particular category). Where Rasch–Andrich thresholds are misordered, this suggests that there is insufficient distinction between categories and some may be redundant. Where this is the case, conceptually similar rating scale categories should be collapsed together to enhance scale functioning. Where a scale is performing optimally, the Rasch-Andrich thresholds should progress by between 1.4 and 5.0 logits. Reference Linacre26 Third, in an optimally functioning scale, there should be fairly even distribution of responses across the different categories. Finally, the outfit statistics (a measure of unexpected variation in responses, presented as mean-square (MnSq) scores) should be <2.0 for optimal rating scale performance. Reference Linacre26
Unidimensionality
A well-functioning measure should demonstrate unidimensionality to accurately represent the underlying construct. To explore unidimensionality, a principal component analysis is conducted and results are examined. In a unidimensional measure, it is expected that the principal component will account for >50% of the variance and that the Eigenvalue associated with the first contrast will be <2. Reference Chien and Brown27
Additional indicators of unidimensionality are fit statistics for each item, which demonstrate how well the response data align with expectations of the Rasch model. Fit statistics are reported as infit and outfit measures. Infit statistics are weighted and are most influenced by people’s responses that are close to their overall level of ability, whereas outfit statistics are unweighted and are more influenced by outlier responses (e.g., where a person does not affirm an item which should be ‘easy’ for them to affirm). Reference Bond and Fox23 Infit and outfit statistics are presented as MnSq scores. Where item responses fit the expectations of the Rasch model perfectly, MnSq scores will be 1.0. The generally acceptable range of MnSq scores is from 0.5 to 2.0, with measures within the range of 0.7 to 1.4 being considered ‘very good’ and from 0.8 to 1.3 being ‘excellent’. Reference Fisher28 Where the MnSq scores for an item fall outside of the acceptable ranges, this could indicate that the item does not fit with the construct being measured, or could suggest that the item is ambiguous and is being interpreted differently by different respondents. In either case, the item should be considered for removal, particularly if the MnSq score is >2.0, which could corrupt the measurement model. Reference Linacre26
Statistical reliability
Conceptually similar to measures of internal consistency, the item reliability index is a measure of the consistency of the items in the instrument. Rasch analyses also generates person reliability indices, which reports on the consistency of respondents’ responses across different items. Reliability indices of 0.8–0.9 are considered ‘good’ and >0.9 are considered ‘very good’. Reference Fisher28 The person separation index indicates how many statistically distinguishable groups (strata) can be separated from the data. The number of strata can be calculated from the person separation index with the formula: (4PSI + 1)/3. Reference Wright and Masters29 The person separation index should be at least 2.0, suggesting that the measure can separate people into three statistically distinguishable groups. Reference Fisher28 As an additional measure of reliability, the internal consistency (Cronbach’s α) was also calculated with IBM SPSS statistics (version 28).
Overall construct validity
Each of the previously identified elements plays a role in establishing the overall construct validity of the measure. Beyond these elements, several additional factors are also taken into account. Point-measure correlations assess how individuals’ responses to each item align with their overall scores. Ideally, all point-measure correlations should be positive, as negative values indicate that an item might be measuring a different construct. Reference Bond and Fox23 Rasch analysis also generates an item hierarchy based on the difficulty level of each item. This hierarchy should reflect a logical progression consistent with the construct being measured. Additionally, the analysis produces a person-item map, which displays the hierarchies of people and items on the same scale. For an instrument to be well targeted, the means for items and people should be similar, and the overall distribution of items and people should be evenly matched. Reference Bond and Fox23 The map should also be reviewed for gaps in the item hierarchy and for ceiling and floor effects. Item gaps suggest that the instrument may lack precision in measuring person ability around the gap area. Ceiling and floor effects occur when scores cluster around extreme ends of the scale. Reference Fisher28
Person-fit statistics
Just as fit statistics are reported for items, they are also available to evaluate how well individuals’ responses align with the expectations of the Rasch model. Reference Bond and Fox23 If a significant portion of responses do not conform to these expectations, it suggests that individuals’ response patterns may be erratic and may compromise measurement precision. Reference Bond and Fox23 Ideally, infit and outfit MnSq scores should be <1.5, although scores up to 2.0 are considered acceptable because they do not significantly degrade the measurement model. Reference Linacre30
Additional measurement properties
In addition to the Rasch-based analyses describe above, several other analyses to explore measurement properties were also completed. These analyses were completing with IBM SPSS Statistics (version 28).
Concurrent validity
At enrolment, participants were asked to rate their level of confidence when working with voice hearers on a five-point scale from ‘not at all confident’ to ‘very confident’. It was anticipated that there should be a moderate correlation between overall confidence and total scores on the SVHM. This was tested by using a Pearson’s correlation.
Responsiveness
As an indicator of responsiveness, total raw scores were inspected before and after the exposure period in the randomised controlled trial. Change in scores was analysed with a paired t-test with an associated effect size calculated. A series of paired t-tests were also completed to analyse change in pre–post scores for each item. For the item-by-item comparisons, a Bonferroni correction was applied to account for the increased risk of type two errors in the context of multiple comparisons. For these comparisons, the significance value was set at α = 0.00227.
Time taken for completion
Data for the main trial were collected via a survey queue in REDCap. Reference Harris, Taylor, Thielke, Payne, Gonzalez and Conde31,Reference Harris, Taylor, Minor, Elliott, Fernandez and O’Neal32 The time elapsed between submission of the previous survey and submission of the survey containing the SVHM was calculated from the REDCap data export. Some durations were clear outliers, suggesting that the completer had left and returned to the survey at a later time. As a conservative approach, any time duration of >1 h was excluded; this resulted in nine (1.6%) completions being excluded from the calculation of average time taken for completion of the SVHM. Following this, the mean (and median) completion times were calculated.
Results
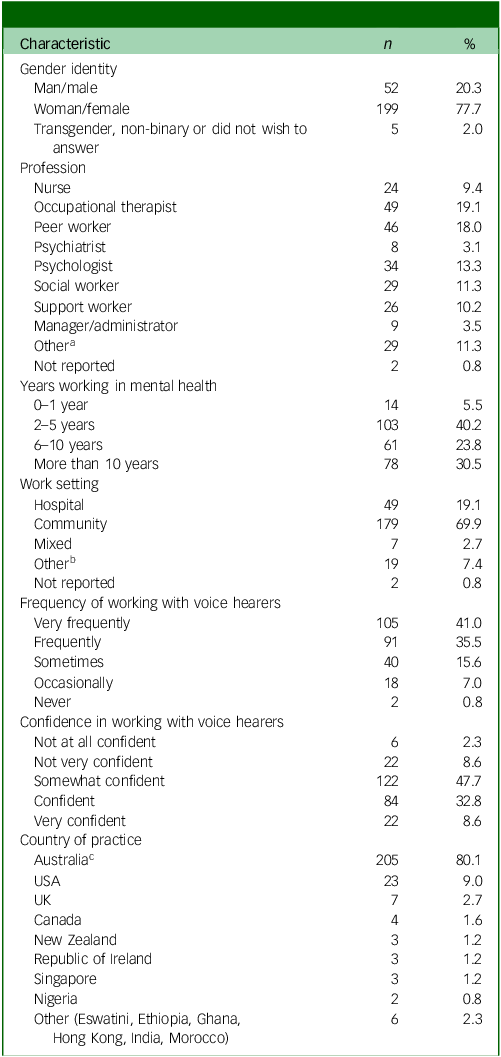
A total of 256 mental health workers participated in the broader study. Participant demographics are presented in Table 1. Participants completed the SVHM up to three times in the broader study, resulting a total of 548 completions. For analyses presented in this paper, each completion was treated as a separate response. In the text, where the term ‘person’ or ‘people’ are used, this should be considered as a response or a particular person at a particular time point.
Demographic characteristics (N = 256)

a Other professions include advocate, art therapist, case coordinator, counsellor, recovery coach, dietician, diversional therapist, psychotherapist and student.
b Other work settings include education, custody, housing, administration and unclear.
c Australian participants came primarily from New South Wales (n = 84), Western Australia (n = 29), Victoria (n = 28), Queensland (n = 21) and South Australia (n = 21).
Rating scale validity
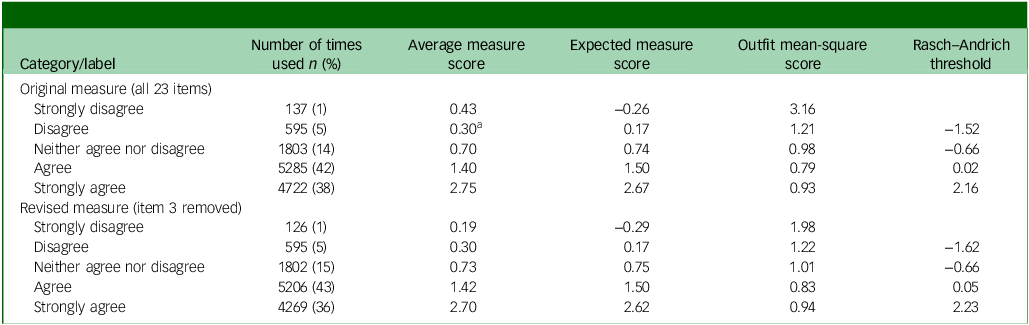
Rating scale statistics are presented in the top section of Table 2. Average measure scores were slightly disordered, with the average measure score for ‘disagree’ being lower than the average measure score for ‘strongly disagree’. Rasch–Andrich thresholds progressed monotonically. Step progressions across the ‘disagree’ and ‘neither agree nor disagree’ categories were slightly lower than the recommended 1.5 (being 0.96 and 0.68, respectively). Step progression across the ‘agree’ category was 2.18. The distribution of responses across categories was unbalanced, with ‘agree’ and ‘strongly agree’ being used more frequently than the other categories. Most outfit statistics were below the recommended 2.0, apart from ‘strongly disagree’, which was 3.16.
Rating scale statistics

a Average measure score does not progress monotonically.
Further analyses (presented in sections below), indicated that item 3 (‘It’s important to be non-judgemental when working with voice hearers’) should be considered for removal. Rating scale statistics following the removal of item 3 are presented at in the bottom section of Table 2. Following removal of item 3, the misordering of average measure scores was resolved, the outfit measure for ‘strongly disagree’ was <2.0 and all other features of rating scale validity improved.
Unidimensionality
Results from the original principal component analysis of residuals revealed that the principal component explained 39.1% of the variance. The Eigenvalue associated with the first contrast was 2.91. After removal of item 3, the principal component explained 38.5% of the variance and the Eigenvalue of the first contrast was 2.90.
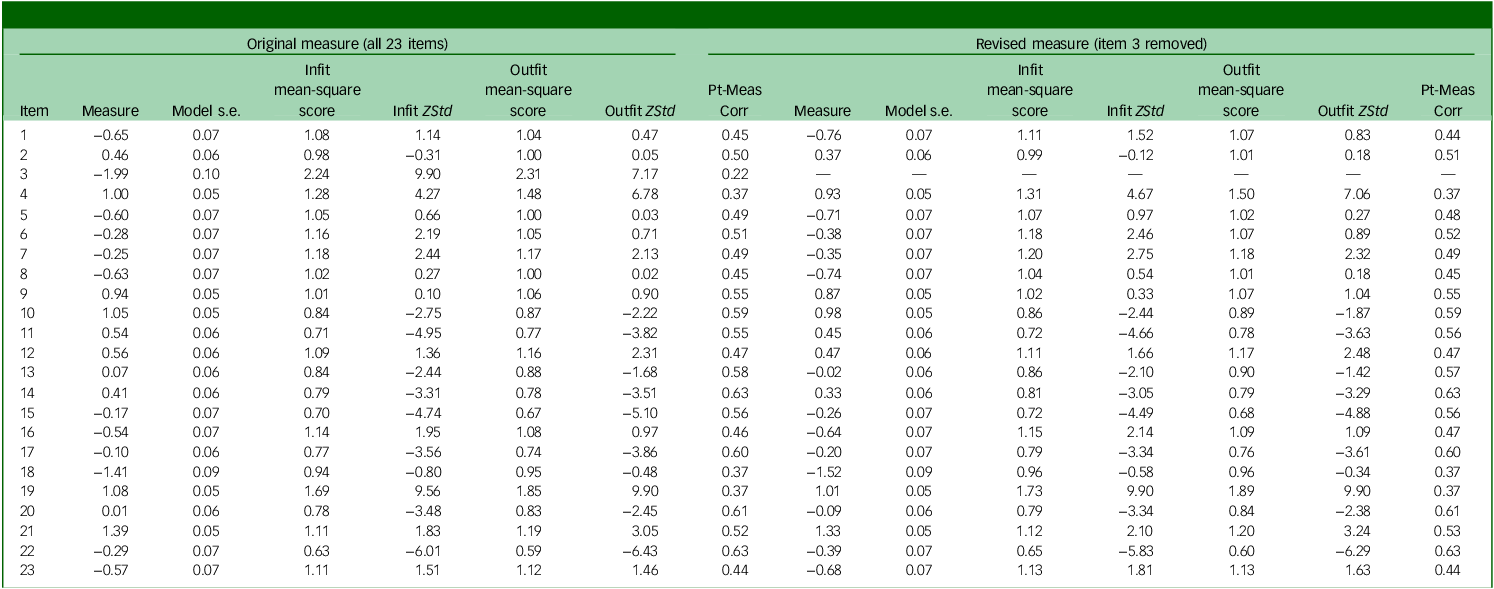
Item functioning statistics are presented in Table 3. Considering results from the first analysis with all items, infit and outfit MnSq scores for item 3 were 2.24 and 2.31, respectively, suggesting that this item had patterns of responses that were quite unexpected. The point-measure correlation, although positive, was also quite low at 0.22. These results suggested that this item was creating substantial imprecision in the measurement model. Therefore, the decision was made to remove this item. The remainder of results presented in this paper are based on the 22-item version of the SVHM (i.e. with item 3 removed).
Summary item statistics

ZStd, standardised Z-score; Pt-Meas Corr, point-measure correlation.
Item-functioning statistics following the removal of item 3 are presented on the right-hand side of Table 3. All infit and outfit MnSq scores fell within the acceptable range of 0.5 to 2.0. When considering the more restricted criterion of 0.7 to 1.4, only three items (items 19, 4 and 22) had fit statistics outside of this range.
Statistical reliability
The item reliability index was 0.99 and the person reliability index was 0.86. The person separation index was 2.50, suggesting that the people can be separated into at least three statistically distinguishable groups. The overall internal consistency of the scale (Cronbach’s α) was 0.88, indicating strong internal consistency.
Overall construct validity
As shown in Table 3, all point-measure correlations were positive suggesting all items are related to the construct. The person-item map (Fig. 1) shows that the mean of item measures is approximately 1.5 s.d. below the mean of people and there is a large number of people at the top of the map at a level above the average difficulty of the hardest item. Both of these aspects suggest that the items are not as targeted as would be optimal. The hierarchy of items followed a logical sequence from the easiest items related to beliefs, values and desired actions through to more applied, action-based statements describing what individuals actually do in their practice.
Person-item map. M, mean; S, one standard deviation; T, two standard deviations. Each ‘#’ is 4. Each ‘.’ is 1 to 3.

Person-fit statistics
Person-fit statistics revealed that 42 people (7.7%) had infit or outfit MnSq scores >2.0. A further 72 people (13.1% of the overall sample) had infit or outfit statistics that were >1.5.
Concurrent validity
The correlation between confidence in supporting voice hearers and total score on the SVHM was r = 0.49 (p < 0.001). This represents a moderate correlation and provides support for the concurrent validity of the SVHM.
Responsiveness
Results comparing total scores before and after exposure were significant, with a very large effect size (t(133) = 10.5, p < 0.001, d = 1.11). Results for item-by-item analyses ranged from t(132) = 9.1 (p < 0.001, d = 0.79) for item 12 (‘There are many helpful strategies to support voice-hearers’) to t(130) = 0.4 (p = 0.663, d = 0.04) for item 18 (‘I want to learn from voice-hearers to help me be a better support’). Fourteen of the 22 items met the Bonferroni-adjusted significance criterion of p < 0.00227 for change over time.
Time taken for completion
The mean time taken to complete the SVHM was 5 min 19 s (s.d.: 6 min 7 s). The median time was 3 min 39 s (interquartile range: 2 min 32 s to 5 min 33 s).
Discussion
This study was established to evaluate the measurement properties of a newly-designed measure of mental health workers’ beliefs, attitudes, confidence and behaviours related to working with voice hearers. Originally designed with 23 items, early analyses identified one item that should be removed from the measure, so the final measure included 22 items.
Key results indicate that the SVHM has many measurement strengths. Primarily, it is quick to complete, has the capacity to detect change, has concurrent validity with overall confidence to work with voice hearers and has several measurement strengths when evaluated against rating scale quality control criteria. Reference Linacre26,Reference Fisher28 However, some aspects that may require further exploration are discussed below.
The rating scale structure met most of the quality control criteria as set out by Linacre, Reference Linacre26 although two aspects should be considered further. First is the low rate of utilisation of lower categories of the rating scale and second is the relatively small progression of Rasch–Andrich thresholds at the lower end of the scale. Although these issues do not undermine the quality of ratings developed from the measure, they do suggest that consideration could be given to collapsing some of the categories together. For example, if the categories ‘strong disagree’, ‘disagree’ and ‘neither agree nor disagree’ were collapsed together, then this would create a more even distribution of responses across categories and would likely improve the distinction between categories. However, collapsing these categories may give respondents the feeling that they do not have sufficient options to match their opinion and the presence of predominantly ‘agree’ options may be considered leading. This could be further explored in future research.
Apart from item 22, which was overfitting, there were two items that had fit statistics that should be further explored. The first was item 19 (‘I worry that my professional colleagues would not approve of me encouraging people to explore their voices’). Fit statistics suggest that some individuals who score high overall, and therefore would be expected to disagree with this item, actually agree with it. There is some logic to this situation, as being concerned about the opinions of colleagues may be related to other factors not related to the individual’s own convictions about the importance of supporting voice hearers to explore their voices. It may be related to the organisational culture, the relative power of the mental health worker in the context or a range of other factors. In this context, one option would be to consider removing this item from the scale. However, as this is the only item included in the SVHM that relates to the normative beliefs component of the Theory of Planned Behaviour, its removal would mean that the SVHM has incomplete coverage of Theory of Planned Behaviour. From the data available, it suggests that this item does not interfere with measurement precision of the SVHM, so the decision was made to retain it. The second item showing a minor amount of misfit was item 4 (‘I advise people to ignore their voices or to try to distract themselves’). This may create misfit as, in some circumstances, ignoring voices or distraction can be helpful for some voice hearers, Reference Rufato, Corradi-Webster, Reis, Bien, Davidson and Bellamy33 and this may be reflected by respondents who have strong beliefs, attitudes, confidence and behaviours related to working with voice hearers agreeing with this statement. A more definitive statement, such as ‘I advise people that the best way to deal with their voices is to ignore the voices or try to distract themselves’, may be more precise in identifying those workers who default to only suggesting ignoring voices or using distraction techniques rather than considering a broader range of approaches. This revised version of the question could be tested in future research.
The match between item difficulty and person ability (‘targeting’) was lower than optimal, with all items being ‘easy’ for many respondents. Although this is important to note, it should also be considered in the light of other results reported in this paper. One of the issues with a poorly targeted measure is the risk that improvements may be more difficult to measure. However, given that the SVHM can demonstrate a large effect size of over 1.0 following a relatively modest intervention, this risk appears fairly minor. Additionally, as the participants in the study where these data were generated are likely to at least have a general interest in working with voice hearers, it may be that the measure would demonstrate better targeting when used with a broader mental health worker population. Development of ‘harder’ items to better capture changes in respondents with higher scores could be considered in future research. These harder items could be generated through qualitative exploration with mental health workers to identify which aspects of implementing hearing voices approaches were most challenging to master.
Results from the principal components analysis suggests that there may more than one dimension with the SVHM. Notably, responses from the Theory of Planned behaviour aspects of ‘Behavioural beliefs and attitudes’ clustered together, as did ‘Control beliefs and perceived behavioural control’. Although at this stage, there is insufficient evidence to suggest the need for splitting the SVHM into multiple domains, this should be explored further in future research. With additional data, it may be that dividing the SVHM according to the aspects of the Theory of Planned behaviour may assist in understanding changes at a more nuanced level.
The final consideration is the minority of respondents whose responses showed some misfit with the expectations of the Rasch model. As noted in relation to the misfit of item 4 above, these results may be related to workers who hold widely held views that encouraging people to engage with their voices is unhelpful, particularly before engaging with voice-hearing resources. As with many of the other considerations raised in this section, this issue should be explored in future studies.
A limitation of this research is that it did not incorporate evaluation of how changes experienced by mental health workers influenced the way they worked with voice hearers, and whether this led to enhancements in voice hearers’ engagement or outcomes. Additionally, it is not clear whether there are specific situations or types of voice-hearing experiences where the voice-hearing approach may be more effective. These aspects should be evaluated in future research.
Overall, this study has demonstrated that the SVHM has promising measurement properties and may make a valuable contribution to the evaluation of the impact of resources or other interventions designed to strengthen mental health workers’ confidence and capabilities to work with voice hearers. Further research should explore the feasibility and usefulness of this measure in other study contexts, as well as the validity of scores on the SVHM to predict subsequent relationships and outcomes achieved by voice hearers when being supported by mental health workers.
Box 1 Items included in the final Supporting Voice Hearers Measure
Behavioural beliefs and attitudes
-
1 People can live a good life while continuing to hear voices
-
3 It’s important to be non-judgmental when working with voice hearersa
-
7 People need to block out their voices because they are not realb
-
8 Hearing about the experiences of other voice hearers is likely to be beneficial for people who hear voices
-
12 There are many helpful strategies to support voice hearers
-
13 Discussing the meaning of voices is likely to make the problem worseb
-
16 The only effective approach to deal with hearing voices is medicationb
-
17 It is helpful for voice hearers to understand their voices as a meaningful experience to be explored rather than just a symptom of illness
-
22 Exploring voice-hearing experiences can offer enrichment, growth and development
-
23 To support voice hearers, it is important that I understand their individual voice-hearing experiences and what the voices mean to them
Normative beliefs and subjective norms
-
11 Voice hearers value being able to discuss their voice-hearing experiences with me
-
19 I worry that my professional colleagues would not approve of me encouraging people to explore their voicesb
-
20 Helping people to understand and engage positively with voices is an effective and evidence-based approach
Control beliefs and perceived behavioural control
-
2 I feel overwhelmed or out of my depth when people talk to me about their voicesb
-
6 I feel comfortable to raise the topic of voices with the people I work with
-
10 I have enough knowledge and understanding of voice hearing to work positively with voice hearers
-
15 I am able to validate people’s experiences of voice hearing (not necessarily what the voices say)
Behavioural intentions and behaviours
-
4 I advise people to ignore their voices or to try to distract themselvesb
-
5 I want to help voice hearers to develop a better relationship with their voices
-
9 I routinely talk with people about their voices, for example, their personas and what they say
-
14 I provide information about voice hearing to help people understand it as a common experience so they will feel less alone
-
18 I want to learn from voice hearers to help me be a better support
-
21 I work with family and friends of voice hearers to help them to better understand and support the voice hearer with their voices
a. This item was eventually removed from the measure.
b. Reverse-scored items.
Supplementary material
The supplementary material is available online at https://doi.org/10.1192/bjo.2026.11005
Data availability
The data that support the findings of this study are available from the corresponding author, A.H., upon reasonable request.
Acknowledgements
The authors would like to thank the stakeholder group of clinicians, peer workers and voice hearers for their contributions to this study.
Author contributions
J.N.S. conceptualised the study. A.H. led the development of the SVHM, with input from L.S., H.Z., K.W., J.N.S., N.H. and G.J. J.N.S. completed the analyses and drafted the original manuscript. A.H., N.H., L.S., H.Z., K.W. and G.J. reviewed the analyses and revised the manuscript.
Funding
This study was funded by a research grant from the Moyira Elizabeth Vine Fund for Research into Schizophrenia.
Declaration of interest
None.


 Open access
eLetters
No eLetters have been published for this article.