


1. Introduction
The ion acceleration by high-intensity laser beam is a subject of interest for a wide range of applications, such as tumour treatment (Bulanov & Khoroshkov Reference Bulanov and Khoroshkov2002), neutron generation (Mirfayzi et al. Reference Mirfayzi, Yogo, Lan, Ishimoto, Iwamoto, Nagata, Nakai, Arikawa, Abe and Golovin2020; Mori et al. Reference Mori, Yogo, Hayakawa, Mirfayzi, Lan, Abe, Arikawa, Golovin, Wei and Honoki2021; Yogo et al. Reference Yogo, Mirfayzi, Arikawa, Abe, Wei, Mori, Lan, Hoonoki, Golovin and Koga2021) and a driver beam for the fast ignition (FI) (Roth et al. Reference Roth, Cowan, Key, Hatchett, Brown, Fountain, Johnson, Pennington, Snavely and Wilks2001) used in inertial confinement fusion. The original concept of FI envisioned that the hot electrons produced by laser–fuel interaction work as the energy transport medium to ignite the deuterium–tritium fusion. The deuterium–tritium fuel is often attached with a hollow cone in order to effectively transport the laser light to the compressed core (Kodama et al. Reference Kodama, Norreys, Mima, Dangor, Evans, Fujita, Kitagawa, Krushelnick, Miyakoshi and Miyanaga2001; Azechi et al. Reference Azechi, Mima, Fujimoto, Fujioka, Homma, Isobe, Iwamoto, Jitsuno, Johzaki and Kodama2009). In the electron-driven FI research, the driver beam of hot electrons have a large divergence angle of approximately ${100^{\circ }}$ and some part of the hot electrons is scattered and absorbed by the guiding hollow cone, especially for a high-Z cone (Johzaki et al. Reference Johzaki, Sentoku, Nagatomo, Sakagami, Nakao and Mima2008). To resolve this issue, some approaches were proposed. One of the most effective methods is to utilize an extremely strong magnetic field driven by a laser to constrain the divergence angle of hot electrons (Sakata et al. Reference Sakata, Lee, Morita, Johzaki, Sawada, Iwasa, Matsuo, Law, Yao and Hata2018; Matsuo et al. Reference Matsuo, Higashi, Iwata, Sakata, Lee, Johzaki, Sawada, Iwasa, Law and Morita2020).
On the other hand, a concept of the ion-driven FI (Roth et al. Reference Roth, Cowan, Key, Hatchett, Brown, Fountain, Johnson, Pennington, Snavely and Wilks2001; Borghesi et al. Reference Borghesi, Mackinnon, Campbell, Hicks, Kar, Patel, Price, Romagnani, Schiavi and Willi2004) was proposed as an alternative to the electron-driven FI. It was shown in the simulation (Sakagami et al. Reference Sakagami, Johzaki, Sunahara and Nagatomo2016) that the core heating efficiency of an ion beam can be enhanced by 20 %–60 %, compared with the electron-driven FI (Borghesi et al. Reference Borghesi, Mackinnon, Campbell, Hicks, Kar, Patel, Price, Romagnani, Schiavi and Willi2004; Sakagami et al. Reference Sakagami, Johzaki, Sunahara and Nagatomo2016). Honrubia et al. revealed by the simulation that the driver protons are collimated by the electric and magnetic fields (EM-fields) induced on the inner surface of the guide cone.
In general, the ions accelerated by high-intensity laser–plasma interactions, including target normal sheath acceleration, are in time scale of the order of femtoseconds to picoseconds, which is close to the laser pulse duration. This feature of laser-accelerated ions provides a unique probing tool for diagnosing EM-fields in highly transient plasma (Mackinnon et al. Reference Mackinnon, Patel, Town, Edwards, Phillips, Lerner, Price, Hicks, Key and Hatchett2004), combining other features of laser-driven proton beams, such as the remarkable collimation, high cutoff energy and small transverse emittance. This technique, termed proton radiography (PR), has been used to measure the high-speed dynamics of EM-fields (Romagnani et al. Reference Romagnani, Borghesi, Cecchetti, Kar, Antici, Audebert, Bandhoupadjay, Ceccherini, Cowan and Fuchs2008) driven by lasers.
During the high-intensity laser irradiation of the cadmium (Cd) foil of the cone guide target, fast electrons are accelerated to nearly the speed of light and escape from the laser focal spot into vacuum. This will lead to a positive electrostatic potential growing up around the laser focus spot (Zhu et al. Reference Zhu, Li, Yuan, Li, Li, Liao, Zhao, Zhong, Xue and He2015). This positive potential drags the background cold electrons to the focus spot to neutralize the electric charges. The stream of these electrons along the target surface makes a current, called the return current, and this return current will create strong EM-fields (Quinn et al. Reference Quinn, Wilson, Cecchetti, Ramakrishna, Romagnani, Sarri, Lancia, Fuchs, Pipahl and Toncian2009). As for the cone guide target, we assume the return current would flow along the cone-wall surface and generate strong EM-fields around the cone wall which affects the propagation of ions throughout the gold cone.
In this paper, we experimentally study the ion transportation through a hollow gold cone, which is designed for ion-driven FI. We discuss the method to diagnose the EM-fields induced on the cone guide using the PR technique. We report the results of PR imaging in the time range of 1.5–38 ps after the laser injection, which is beyond the time region that can be accessed by particle-in-cell (PIC) simulations. With the assistance of particle tracing simulation, we evaluate the EM-fields and discuss the ion transportation through the cone guide targets.
2. Experiment
We measured the EM-fields with the PR method. The experiment was conducted on the LFEX laser at the Institute of Laser Engineering, Osaka University (Kawanaka et al. Reference Kawanaka, Miyanaga, Azechi, Kanabe, Jitsuno, Kondo, Fujimoto, Morio, Matsuo and Kawakami2008). The experimental set-up is schematically shown in figure 1. In order to perform the PR imaging, we fabricated the cone guide target as shown in figure 1(b): we made a gold cone target having an opening angle of $45^{\circ }$ , thickness of $7\ \mathrm {\mu }{\rm m}$
 and a length of $750\ \mathrm {\mu } {\rm m}$
 ; the cone was directly attached to the Cd foil. One of the laser beams was used as an interaction laser, which gave an on-target energy of 200 J with an intensity of $2\times 10^{18}\ {\rm W}\ {\rm cm}^{-2}$
 . Another laser beam with on-target intensity approximately $6\times 10^{18}\ {\rm W}\ {\rm cm}^{-2}$
 was used as the probe laser, and was focused onto a $10\ \mathrm {\mu } {\rm m}$
 Al foil to generate the proton beam with the cutoff energy of roughly 20 MeV for probing the interaction area. A 55 ps optical delay was set on the pump laser so as to envelop the entire interaction into the probe beam. The radiochromic films (RCF) (GAFChromic 2020a,b) were employed transverse to the probe beam as a proton detector. By stacking RCFs layer by layer, the proton deflection images resolved energetically. Since each RCF is related to a proton energy $E_{p}$
 by calculating the distance into the RCF stack where the Bragg peak occurs, the picosecond continuous observation of the evolution of EM-fields around the cone target was realized by calculating the time-of-flight of corresponding protons (Quinn et al. Reference Quinn, Wilson, Cecchetti, Ramakrishna, Romagnani, Sarri, Lancia, Fuchs, Pipahl and Toncian2009). It is important to note that the proton accelerated from the Al foil has an angular distribution of $60^\circ$
 . Hence, EM-fields were measured along the probe axis from which the accelerated protons have no horizontal velocity component.
(a) The experimental set-up. (b) The design drawing of the cone target. (c) The top view of the experimental set-up.

3. The results and analysis of the EM-fields measurements
The proton deflection images deposited on RCFs are shown in figure 2. Comparing the RCF images at different probe times, the evolution of the proton profile around the cone target is seen clearly. Since the flight trajectory of probe protons is deflected by the EM-fields around the cone target, the evolution of the proton profile is synchronous to the evolution of EM-fields around cone target. Around the cone walls in the images of $t = 8.7$ , 13.1 and 20.5 ps, one can recognize mesh patterns, which are not perturbed by the EM-fields. This is attributed to the fact that the reduction of the proton density reveals the hidden images of the mesh printed by the passing through of higher-energy protons, as detected by deeper layers of RCFs ($t = 1.5$
 , 3.2 ps).
The results of RCF measurements. The green line marks the probe axis. The energies of protons predominantly stopped at the RCF layer are shown below the images. The time $t$ indicates the relative time that the protons passed through the cone target after the laser irradiation onto the cone target. The inset shows the result with the glass stoke attached on the Cd foil, not on the tip of the cone.

In the frame of $t=5.6\ {\rm ps}$ , one can see the image of the EM-field arriving at the bottom of the cone. In the next frame ($t=8.7\ {\rm ps}$
 ), the EM-field reaches the tip of the cone, indicating that the front of the EM-field moved along the distance of the cone wall (0.82 mm) within 3.2 ps. Then, the speed of the EM-fields’ front is estimated to be $v_{f} \sim 0.9c$
 , where $c$
 is the speed of light in vacuum.
It is important to note that the EM-fields are induced predominantly in the temporal window of 15–30 ps, which is approximately 10 times longer than the laser pulse duration. It is experimentally found that the EM-field is induced by the return current, not by the hot electrons. The inset of figure 2 shows the RCF image measured when the glass stalk is attached to the Cd foil, not on the tip of the cone. In this case, the return current is generated only on the Cd foil, and the EM-fields were not induced on the cone wall. This is direct evidence that the EM-field is induced by the return current, not the hot electrons.
We performed a Monte Carlo simulation on the proton trajectory by a three dimensional particle tracing code, PRORAD (Wilks & Black Reference Wilks and Black2017), in order to reproduce the PR images. Here, we set static electric ($\boldsymbol {E}_{\boldsymbol {d}}$ ) and magnetic $\boldsymbol {B}_{\boldsymbol {r}}$
 fields, as shown in figure 3, for the each run of the Monte Carlo simulation, where the protons having same kinetic energy are generated from the source with a random divergence angle in the range of $0^{\circ }\unicode{x2013}20^{\circ }$
 . The protons are traced one by one until the accumulation is obtained with sufficient statistics. Considering that the 10 MeV probe protons, for instance, pass through the typical thickness of the EM-fields ($50\ \mathrm {\mu }{\rm m}$
 ) within 1 ps, it is reasonable to assume that the EM-fields are static during the time that the probe protons pass through. Assuming that $\boldsymbol {E}_{\boldsymbol {d}}$
 is the radial outside-directed electric field around the cone surface, we set the strength of $\boldsymbol {E}_{\boldsymbol {d}}$
 by applying Gauss's law: $E_{d}=E_{{\rm max}}(l_{c}/l)$
 , $l \geqslant l_{c}$
 and the continuity equation $I=2{\rm \pi} \epsilon _{0}l_{c}v_{f}E_{\max }$
 . Here, $E_{\max }$
 is the strength of the electric field at the cone outer surface, $l_{c}=3.5\ \mathrm {\mu }{\rm m}$
 is half of the cone-wall thickness and $l$
 represents the distance from any point outside to the centre of the cone wall. With the flow of return current inside the cone wall, an azimuthal magnetic field $\boldsymbol {B}_{\boldsymbol {r}}$
 is generated and its strength can be calculated using Ampere's law.
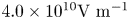
(a) The schematic diagram of electric field $\boldsymbol {E}_{\boldsymbol {d}}$ and magnetic field $\boldsymbol {B}_{\boldsymbol {r}}$
 generated by the return current induced on the cone wall. (b) The results of particle tracing simulation assuming the EM-fields induced by the return current of 2.1 kA. The left-hand side shows the cone target only with electric field of $4.0\times 10^{10}\ {\rm V}\ {\rm m}^{-1}$
 . The right-hand one shows the result assuming only the magnetic field of 120 T.

In general, it is quite difficult to distinguish the electric fields from the magnetic fields by using the images of the proton deflection. In our approach, we calculate the EM-fields separately in the PRORAD simulation and discuss which field is predominant in the present cone guide geometry. Figure 3(b) shows the PR images calculated separately for the electric (left-hand subpanel) and magnetic (right-hand subpanel) fields induced by assuming the return current of 2.1 kA inside the cone. While the proton image is drastically modified by the electric field of $E_{\max } = 4.0\times 10^{10}\ {\rm V}\ {\rm m}^{-1}$ , the magnetic field (120 T) makes no significant change on the image. Also, Quinn et al. discussed (Quinn et al. Reference Quinn, Wilson, Cecchetti, Ramakrishna, Romagnani, Sarri, Lancia, Fuchs, Pipahl and Toncian2009) that the proton deflection by the magnetic field is not significant as long as the magnetic field strength is smaller than 200 T. Hence, in this study we assume that the proton deflection by magnetic fields is negligible when the return current is of the order of $10^{10}\ {\rm V}\ {\rm m}^{-1}$
 , and evaluate the electric fields induced on the cone guide from the PR images.
The simulated results by the PRORAD code are compared with the experimental PR images in figure 4(a–d). In the simulation, we adjusted the electric fields on the cone wall to find agreements with the width of the proton-deflected zone, shown as the dashed lines in figure 4(b–d). The electric fields on the cone wall are evaluated for $t=8.7$ , 13.1, 20.5 ps and shown in figure 4(e). Considering that there is a clear difference between the PR images for $t=8.7$
 ps (figure 4b) and $t=13.1$
 ps (figure 4c), the errors of the measured electric fields seems to be smaller than 50 %. As a result, we find that the electric field reaches $E_{\max }=4.0\times 10^{10}\ {\rm V}\ {\rm m}^{-1}$
 at a maximum with $t=13.1$
 ps after the laser shot. The corresponding return current is estimated to be 2.1 kA, which generates the magnetic field around 120 T, which makes no significant change on the PR image, as shown in figure 3(b). Hence, the proton deflection on the PR images are attributed to the electric fields that reache ${\sim }10^{10}\ {\rm V}\ {\rm m}^{-1}$
 on the cone surface.
(a–d) Results of particle tracing simulation for the time (a) 1.5 ps; (b) 8.7 ps; (c) 13.1 ps; (d) 20.5 ps. (e) The maximum strength of the electric field ($E_{\max }$ ) obtained for (a–d) as a function of the time.

4. Two-dimensional PIC simulation
To discuss the evolution of the electric field by the interaction of an ultrahigh-intensity laser with the cone guide target, we performed two-dimensional PIC simulation using the EPOCH code (Arber et al. Reference Arber, Bennett, Brady, Lawrence-Douglas, Ramsay, Sircombe, Gillies, Evans, Schmitz and Bell2015). Considering the balance of computing resource consumption, the size of the cone target is scaled down to 25 % of the experiment, and the simulation was performed until $t = 1.5$ ps. The size of the simulation box was $250\ \mathrm {\mu } {\rm m} \times 210\ \mathrm {\mu } {\rm m}$
 and the incident laser pulse of $\lambda =1.05\ \mathrm {\mu } {\rm m}$
 wavelength, $6\times 10^{18}\ {\rm W}\ {\rm cm}^{-2}$
 peak intensity, 1.5 ps duration and $12.5\ \mathrm {\mu } {\rm m}$
 spot diameter, normally incident with a cone guide target. Note the thickness of the Cd foil and gold cone remains consistent with the diagnostic experiment which are still $5\ \mathrm {\mu } {\rm m}$
 and $7\ \mathrm {\mu } {\rm m}$
 , respectively. The irradiated Cd foil target plasma extends over $0\leqslant x\leqslant 5\ \mathrm {\mu } {\rm m}$
 and the laser pulse shot from the left-hand side at $x=0$
 , $y=0$
 . Figure 5 shows the distribution of $E_{y}$
 , $B_{z}$
 and $J_{x}$
 (the components of electric field, magnetic field and current density along the coordinate system) at the time of $T=1$
 ps (figure 5a,c,e) and $T=1.5$
 ps (figure 5b,f,e). It is obviously seen that the front of $J_{x}$
 moves towards the cone tip. This fact is the evidence that the current is induced as a return current, not as the flow of hot electrons generated from the focal spot. The speed of $J_{x}$
 front is estimated to be $0.85$
 –$0.9c$
 , which is almost the same as the speed of the EM-fields measured with the PR images discussed in § 3. The $J_{x}$
 flows along the inner and outer surfaces of the cone wall and simultaneously induce the electric field and magnetic field in the outwards and parallel direction of the cone wall, respectively. The directions of $E_{y}$
 and $B_{z}$
 are in agreement with the direction of EM-fields shown in figure 3(a).
The results of PIC simulation showing the of electric field ($E_{y}$ ), magnetic field ($B_{z}$
 ) and current density ($J_{x}$
 ) along the target surface at the time $T=1$
 ps (a,c,e) and $T=1.5$
 ps (b,d,f).

5. Discussion
Combining the results obtained with the EM-fields’ diagnostic experiment and simulations, we reported that the EM-fields are generated with a temporal window of 8–20 ps after the laser incidence. In this section, we discuss the relationship between the EM-fields’ generation around the cone, and ion propagation. We measured the ion transportation by using the targets shown in figure 6. Note the cone length is 1 mm, which is 33 % longer than those used in the PR measurements. The Cd foil was placed on a bridge of glass stokes (figure 6b), the materials of which are the same as with the stoke attached on the cone tip. The glass bridge is expected to work as the pathway of the return current. To measure the accelerated ion energies, a Thomson parabola (TP) ion analyser (Tosaki et al. Reference Tosaki, Yogo, Koga, Okamoto, Shokita, Morace, Arikawa, Fujioka, Nakai and Shiraga2017; Golovin et al. Reference Golovin, Mirfayzi, Shokita, Abe, Lan, Arikawa, Morace, Pikuz and Yogo2021) was placed on the laser incident axis at a distance of 0.95 m from the target. The ion energy spectra are shown in figure 6(d). For the reference shot using the $5\ \mathrm {\mu } {\rm m}$ Cd foil without the cone, the maximum proton and deuteron are accelerated up to 30.5 MeV and $8.8\ {\rm MeV}\ {\rm n}^{-1}$
 (17.6 MeV in total), respectively, with the laser intensity of $1.1\times 10^{19}\ {\rm W}\ {\rm cm}^{-2}$
 . The spectra of protons and deuterons were also observed in Mirfayzi et al. (Reference Mirfayzi, Yogo, Lan, Ishimoto, Iwamoto, Nagata, Nakai, Arikawa, Abe and Golovin2020), Mori et al. (Reference Mori, Yogo, Hayakawa, Mirfayzi, Lan, Abe, Arikawa, Golovin, Wei and Honoki2021) and Yogo et al. (Reference Yogo, Mirfayzi, Arikawa, Abe, Wei, Mori, Lan, Hoonoki, Golovin and Koga2021), with the mechanism of ion acceleration discussed in detail in Yogo et al. (Reference Yogo, Mima, Iwata, Tosaki, Morace, Arikawa, Fujioka, Johzaki, Sentoku and Nishimura2017) and Iwata et al. (Reference Iwata, Mima, Sentoku, Yogo, Nagatomo, Nishimura and Azechi2017). For the cone guide target, the maximum energy of protons and deuterons are decreased: 12.9 MeV for protons and $6.7\ {\rm MeV}\ {\rm n}^{-1}$
 (13.4 MeV in total) for deuterons. Especially, the energy decrease seen for the protons is severe.
(a) Photograph of normal Cd foil target. (b) Photograph of cone guide Cd foil target. (c) Drawing of the cone guide target's structure in detail. (d) The ions energy spectrum obtained by laser-axis TP for cone guide target and foil target. The results of cone guide target and foil target are drawn in solid and dashed lines, respectively. Blue and red lines represent proton and deuteron.

Considering the geometric size of the cone guide target, which was shown in figure 6(c), the flight time for a 30 MeV proton to travel from the Cd foil to the tip of the cone is approximately 13 ps. For the 10 MeV deuterons, the flight time is approximately 23 ps. The arrival time (around 13 ps) of protons at the cone tip is in agreement with the time that the EM-fields are predominantly induced. Hence, the protons are strongly influenced by the EM-fields during the transport process. On the other hand, since the arrival time for deuterons (>23 ps) is longer than the existing time of the EM-fields. This scenario indicates the reason why the protons were not measured at the position of the TP ion analyser, as shown in figure 6.
The EM-fields affect the ion propagation in two different ways (Honrubia, Morace & Murakami Reference Honrubia, Morace and Murakami2017) as follows: (i) the electric field induced in the perpendicular direction to the cone surface pushes and focuses the ions towards the centre axis of the cone; (ii) the magnetic field induced on the cone wall defocuses the ions, on the contrary. In our experimental condition with the laser intensity around $10^{18}\ {\rm W}\ {\rm cm}^{-2}$ , we have experimentally found that the effect of the electric field is more predominant than the magnetic field for the ion transportation. Hence, it is reasonable to consider that the trajectories of the higher-energy protons (15–30 MeV) were bent by the electric fields induced on the cone wall and focused at the exit of the cone, according to the scenario (i) mentioned above. As a result, the protons were again diverged after passing through the focal point, and not measured by the TP far from the target.
At the laser intensity around $10^{20}\ {\rm W}\ {\rm cm}^{-2}$ typically used for the ion-driven FI, the return currents should be much higher and the magnetic field may play an important role on the ion transportation. The PR method in this study will provide a powerful tool for further investigations at high laser intensities scalable to the FI conditions.
6. Conclusion
In this work, we demonstrated the ‘snapshot’ imaging of the EM-fields generated around the cone guide target designed for fusion FI research. With the help of the PR technique and particle tracing simulation, we measured the temporal evolution of the EM-fields. As a result, we found that the electric field reached $4.0\times 10^{10}\ \mathrm {V}\ {\rm m}^{-1}$ around 15 ps after the laser shot, while the magnetic field did not exceed 120 T. It should be emphasized that the EM-fields were evaluated experimentally in the time range that is difficult to simulate with PIC codes due to the limit of computing resources. At this stage, our scheme of diagnosing the EM-fields will lead to the new design of cone guide targets, which are scalable to the FI conditions. In addition, the PR scheme provides a powerful tool of high-speed diagnostics in the field of high-energy-density physics.
Acknowledgements
Editor V. Malka thanks the referees for their advice in evaluating this article.
Funding
The authors thank the technical support staff of ILE and the Cyber Media Center at Osaka University for assistance with the laser operation, target fabrication and plasma diagnostics. This study was performed under the Collaboration Research Program between the National Institute for Fusion Science and the Institute of Laser Engineering at Osaka University (A.Y., no. NIFS15KUGK096 and A.Y., no.NIFS18KUGK119) and by the Japanese Ministry of Education, Science, Sports and Culture through Grants-in-Aid, KAKENHI (M.M., grant no. 21H004454 and A.Y., grant no. 22H02007), Bilateral Program for Supporting International Joint Research by JSPS, (A.Y., grant no. JSJSBP120209922 and M.M., grant no. JSJSBP120204811).
Declaration of interests
The authors report no conflict of interest.


 Open access