


Statement of Research Significance
Research Question(s) or Topic(s):
-
This study investigates the impact of cultural differences on the Oxford Cognitive Screen (OCS), a stroke-specific screening tool, by comparing the performance of Surinamese and Belgian populations.
Main Findings:
-
Minimal differences were observed in OCS performance between the Belgian and Surinamese populations after controlling for age and education. Both groups showed similar age-related decline and education-related improvement in cognitive performance, except for the subtest Picture Naming, where the decline was more pronounced in the Belgian population.
Study Contributions:
-
This study demonstrates that the OCS, with minimal adaptation, is an effective tool for screening neurocognitive disorders across culturally diverse populations. These findings underscore the OCS’s potential for use in various cultural groups, particularly in settings where resources for developing new tests and normative data are limited.
Introduction
Post-stroke neurocognitive disorders
Each year over 143 million years of healthy life are lost due to stroke-related death and disability (Feigin et al., Reference Feigin, Brainin, Norrving, Martins, Sacco, Hacke, Fisher, Pandian and Lindsay2022; Steinmetz et al., Reference Steinmetz, Seeher, Schiess, Nichols, Cao, Servili, Cavallera, Cousin, Hagins, Moberg, Mehlman, Abate, Abbas, Abbasi, Abbasian, Abbastabar, Abdelmasseh, Abdollahi, Abdollahi and Dua2024). Eighty-nine percent of this loss occurs in low- to middle-income countries (Feigin et al., Reference Feigin, Brainin, Norrving, Martins, Sacco, Hacke, Fisher, Pandian and Lindsay2022). Post-stroke neurocognitive disorders, occurring in 7 to 73% of stroke patients (Barbay et al., Reference Barbay, Diouf, Roussel and Godefroy2018; Pendlebury & Rothwell, Reference Pendlebury and Rothwell2009; Sexton et al., Reference Sexton, McLoughlin, Williams, Merriman, Donnelly, Rohde, Hickey, Wren and Bennett2019), are strongly associated with stroke-related disability (Berrios et al., Reference Berrios, Deschle, Fariña, Gabriela, Marroquin, Cervino, Bustos, Saglio, Moreno and Povedano2019; Jokinen et al., Reference Jokinen, Melkas, Ylikoski, Pohjasvaara, Kaste, Erkinjuntti and Hietanen2015; Lawrence et al., Reference Lawrence, Coshall, Dundas, Stewart, Rudd, Howard and Wolfe2001; Nys et al., Reference Nys, Van Zandvoort, De Kort, Jansen, De Haan and Kappelle2007). Cognitive screening for early detection and rehabilitation is therefore important. However, for many populations, especially populations from low to middle-income countries and minority populations from high-income countries, adequate screening tools are not available to identify post-stroke cognitive impairments. Furthermore, migration trends show an increase in the cultural diversity of populations in several countries (McAuliffe & Oucho, Reference McAuliffe, Oucho, McAuliffe and Oucho2024; Van Mol & de Valk, Reference Van Mol and de Valk2016). Having a culture-fair post-stroke cognitive screening test, a test that offers valid insight into domain specific post-stroke cognitive impairments in populations with cultural diversity, is therefore important.
Cultural diversity and cognitive screening
Culture can be defined as “a dynamic process involving worldviews and ways of living in a physical and social environment shared by groups, which are passed from generation to generation and may be modified by contacts between cultures in a particular social, historical, and political context” (Whaley & Davis, Reference Whaley and Davis2007, p. 564). Cultural differences can impact the validity of neuropsychological assessment (Ardila, Reference Ardila2007; Franzen et al., Reference Franzen, Pomati, Papma, Nielsen, Narme, Mukadam, Lozano-Ruiz, Ibanez-Casas, Goudsmit, Fasfous, Daugherty, Canevelli, Calia, van den Berg and Bekkhus-Wetterberg2021). For instance, studies have shown that cognitive screening tests such as the Mini-Mental State Examination (MMSE; Folstein et al., Reference Folstein, Folstein and Mchugh1975) and the Montreal Cognitive Assessment (MoCA; Nasreddine et al., Reference Nasreddine, Phillips, Bédirian, Charbonneau, Whitehead, Collin, Cummings and Chertkow2005), which have been developed in populations that are Western, Educated, Industrialized, Rich and Democratic (WEIRD; Henrich et al., Reference Henrich, Heine and Norenzayan2010), may be susceptible to cultural differences (e.g., Cova et al., Reference Cova, Nicotra, Maestri, Canevelli, Pantoni and Pomati2022; Khan et al., Reference Khan, Mirza and Waheed2022; Ng et al., Reference Ng, Chiew, Lim, Rosa-Neto, Kandiah and Gauthier2018; Shim et al., Reference Shim, Yang, Kim, Park and Kim2017; Steis & Schrauf, Reference Steis and Schrauf2009). Some tasks in the MMSE and MoCA are affected by differences in features of the spoken language (e.g., sentence repetition, word spelling, letter tapping, letter fluency, trail making), familiarity (e.g., object or picture naming, word recall), geographical nomenclature (e.g., orientation) or cultural norms (e.g., command task, fluency). It was thus evident that adaptations to the screening tests were necessary. Despite adaptation, however, the tests have continued to demonstrate differences in performance and optimal cut-offs when diagnosing mild cognitive impairment and dementia across culturally diverse populations (e.g., Mitchell, Reference Mitchell2009; Naqvi et al., Reference Naqvi, Haider, Tomlinson and Alibhai2015; Nielsen & Jorgensen, Reference Nielsen and Jorgensen2020; O’Driscoll & Shaikh, Reference O’Driscoll, Shaikh and Chopard2017). One factor that has been consistently associated with performance differences across cultures is education (Fernández, Reference Fernández, Fernandez and Evans2022a). Education influences test performance in several ways, such as by increasing test-wiseness, the ability to utilize the characteristics and formats of the test and test-taking situation (Ardila et al., Reference Ardila, Bertolucci, Braga, Castro-Caldas, Judd, Kosmidis, Matute, Nitrini, Ostrosky-Solis and Rosselli2010; Lövdén et al., Reference Lövdén, Fratiglioni, Glymour, Lindenberger and Tucker-Drob2020; Morris et al., Reference Morris, Dorling and Davey Smith2016; Parisi et al., Reference Parisi, Rebok, Xue, Fried, Seeman, Tanner, Gruenewald, Frick and Carlson2012; Sarnacki, Reference Sarnacki1979). It is therefore recommended that education, as well as age, should be controlled when examining cultural differences in performance. Consequently, to minimize the impact of cultural differences on the validity of test scores, population-based age- and education-adjusted cut-offs have been created for the MMSE and MoCA (e.g., Borland et al., Reference Borland, Nägga, Nilsson, Minthon, Nilsson and Palmqvist2017; Han et al., Reference Han, Jo, Jo, Kim, Park and Kang2008; Kessels et al., Reference Kessels, de Vent, Bruijnen, Jansen, de Jonghe, Dijkstra and Oosterman2022; Kochhann et al., Reference Kochhann, Cerveira, Godinho, Camozzato and Chaves2009; Larouche et al., Reference Larouche, Tremblay, Potvin, Laforest, Bergeron, Laforce, Monetta, Boucher, Tremblay, Belleville, Lorrain, Gagnon, Gosselin, Castellano, Cunnane, Macoir and Hudon2016; Sachs et al., Reference Sachs, Chelune, Rapp, Couto, Willard, Williamson, Sink, Coker, Gaussoin, Gure, Lerner, Nichols, Still and Wadley2022).
The Oxford Cognitive Screen across populations
The OCS is a cognitive screening test, which in contrast to other screening tests such as the MoCA and the MMSE, was specifically developed for stroke patients. The test is designed to be inclusive for patients with aphasia and spatial neglect (Demeyere et al., Reference Demeyere, Riddoch, Slavkova, Bickerton and Humphreys2015, Reference Demeyere, Riddoch, Slavkova, Jones, Reckless, Mathieson and Humphreys2016). It comprises several subtests intended to assess five cognitive domains commonly impaired after stroke. Language is measured using subtests (Picture) Naming, Semantics (Picture Pointing) and Reading, Numerical cognition using Number Writing and Calculation, Praxis using Gesture Imitation, Memory using subtests Orientation, Verbal Memory and Episodic Recognition, and Executive Functions/Attention using a Trail Making Test encompassing three parts (i.e., Circle or Triangle Trails, Mixed Trails) and a cancellation task (i.e., Hearts Cancellation).
The OCS has been adapted and validated in various countries, requiring cultural and linguistic adaptations for some subtests (Bormann et al., Reference Bormann, Kaller, Kulyk, Demeyere and Weiller2024; Cho et al., Reference Cho, Choi, Demeyere, Hwang and Kim2024; Gangaram-Panday et al., Reference Gangaram-Panday, Zhou and Gillebert2023; Hong et al., Reference Hong, Tao, Wong, Yang, Leung, Lee, Demeyere, Lau, Chien, Chan and Chen2018; Julio-Ramos et al., Reference Julio-Ramos, Foncea-Gonzalez, Farias-Ulloa, Inostroza-Rojas, Conejeros-Pavez, Gutierrez-Vasquez, Soler-Leon, Saez-Martinez, Solinas-Ivys, Demeyere, Martinez-Ferreiro and Mendez-Orellana2024; Kong et al., Reference Kong, Lam, Ho, Lau, Humphreys, Riddoch and Weekes2016; Mancuso et al., Reference Mancuso, Varalta, Sardella, Capitani, Zoccolotti and Antonucci2016; Porrselvi et al., Reference Porrselvi, Venkateswaran, Vijayanand, Webb, Ramkumar, Sneha and Demeyere2023; Ramos et al., Reference Ramos, Amado, Borges, Bergamaschi, Nitrini and Brucki2018; Robotham et al., Reference Robotham, Riis and Demeyere2020; Sanctuary et al., Reference Sanctuary, Hewitt, Demeyere, Kankkunen, Oxenham, Simpson, Stolwyk, Synn, Webb and Marsden2022; Shendyapina et al., Reference Shendyapina, Kuzmina, Kazymaev, Petrova, Demeyere and Weekes2019; Valério et al., Reference Valério, Almeida, Demeyere, Lima, Nogueira and Santana2022). Although these studies involved populations differing in the degree of cultural diversity and WEIRD characteristics and report varying cut-off scores (see Supplemental Table 1 and 2), none of the previous studies have explicitly investigated the relation between OCS performance and culture. A comparison between populations situated at opposite ends of the spectrum of any given cultural variable allows for a more nuanced understanding of the impact of cultural differences on performance (Fernández, Reference Fernández2022b).
The primary aim of the current study was to investigate the impact of cultural differences on the OCS, a stroke-specific screening tool, by comparing the performance of Surinamese and Belgian neurotypical populations. To this end, we first culturally adapted the Belgian Dutch version of the OCS for use in a Dutch-speaking culturally diverse population in Suriname, South America. Suriname is less WEIRD (Henrich et al., Reference Henrich, Heine and Norenzayan2010; Klein et al., Reference Klein, Vianello, Hasselman, Adams, Adams, Alper, Aveyard, Axt, Babalola, Bahník, Batra, Berkics, Bernstein, Berry, Bialobrzeska, Binan, Bocian, Brandt, Busching and Nosek2018) and has a higher cultural diversity (Gören, Reference Gören2013) than Belgium and the other countries for which the OCS was adapted (Supplemental Table 2). The ethnic composition of the Surinamese population reflects the country’s complex historical experiences of colonialism, migration and trade, exhibiting a high degree of diversity with no dominant majority (Menke, Reference Menke2016). This diversity encompasses Hindustani, Javanese and Chinese descendants of indentured laborers from British India, Java (Indonesia) and China; Creole and Maroons, descendants of African slaves; and Indigenous people, the native inhabitants of Suriname from various villages. In addition to these ethnic groups, there are also smaller groups, including those of European descent (Dutch, Portuguese, and other European ancestry), Jews and Lebanese. All these ethnic groups maintain distinct cultural and linguistic traditions, contributing to a multifaceted cultural landscape where at least twenty different languages are spoken.
When comparing the performance of populations that differ in cultural diversity, it is important to control for age and education to minimize the potential confounding effects of these variables and achieve a more accurate understanding of the impact of cultural differences on each OCS subtest. Several studies with varying degrees of cultural diversity and WEIRD characteristics have reported effects of age and education on OCS performance (Hong et al., Reference Hong, Tao, Wong, Yang, Leung, Lee, Demeyere, Lau, Chien, Chan and Chen2018; Huygelier et al., Reference Huygelier, Schraepen, Demeyere and Gillebert2019; Julio-Ramos et al., Reference Julio-Ramos, Foncea-Gonzalez, Farias-Ulloa, Inostroza-Rojas, Conejeros-Pavez, Gutierrez-Vasquez, Soler-Leon, Saez-Martinez, Solinas-Ivys, Demeyere, Martinez-Ferreiro and Mendez-Orellana2024; Mancuso et al., Reference Mancuso, Varalta, Sardella, Capitani, Zoccolotti and Antonucci2016; Robotham et al., Reference Robotham, Riis and Demeyere2020; Shendyapina et al., Reference Shendyapina, Kuzmina, Kazymaev, Petrova, Demeyere and Weekes2019; Valera-Gran et al., Reference Valera-Gran, López-Roig, Hurtado-Pomares, Peral-Gómez, García-Manzanares, Sunyer Catlla, Más Sesé, Navarrete-Muñoz and Sánchez-Pérez2019). However, while most studies observed an age-related decline and an education-related improvement for similar OCS subtests, there were some notable inter-study discrepancies (Supplemental Table 3), suggesting that the effects of these demographic variables may vary across cultural populations. Despite these findings, no studies have statistically compared the patterns of association across different populations. Therefore, the secondary aim of the study was to examine whether the relationships between age and performance, as well as education and performance, differ between the two populations (Belgium vs. Suriname). This analysis may provide valuable insights into how cultural differences impact the effects of age and education on performance, and whether population-specific age and education-adjusted cut-offs are necessary for culturally diverse populations, such as the Surinamese population.
Methods
Participants and their cultural diversity
Neurotypical participants were recruited from regional health centers, elderly care homes and local communities in Suriname, South America, between January to July 2020 and January to September 2022. Participants with a history of neurological or severe psychiatric disorders were excluded. Additionally, participants who did not have Dutch as their primary or secondary language, who were unable to communicate in Dutch or understand the instructions, or who had hearing or vision problems, even with correction, were also excluded.
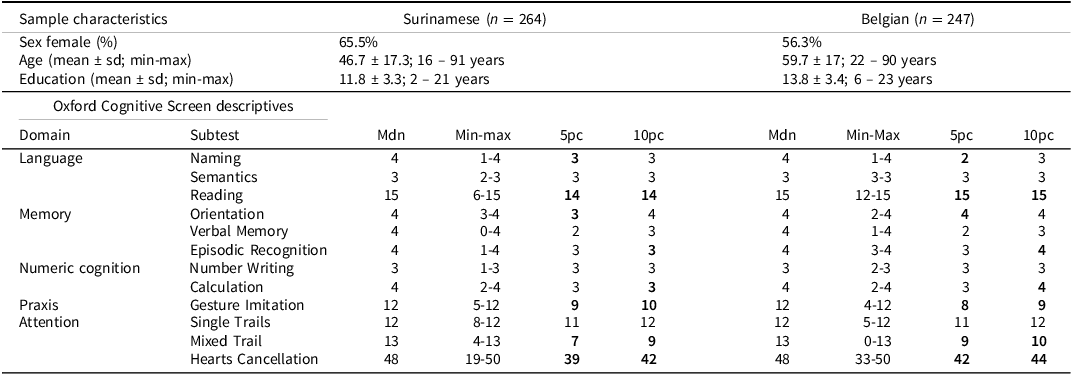
The study included a total of 264 participants, with 173 (65.5%) females and 91 (34.5%) males. The average age of the participants was 46.7 ± 17.3 years (range 16 to 91 years), and their average education level was 11.8 ± 3.3 years (range 2 to 21 years). The sample was ethnically diverse, consisting of Indian-Surinamese (Hindustani-Surinamese; 34.1%), Javanese Surinamese (20.1%), Afro-Surinamese (16.7%), mixed (23.9%), and other minority ethnicities (5.3%). Additionally, we registered the linguistic diversity in a subsample of 181 participants. Of these participants 70.2% were native Dutch speakers (32.6% monolingual, 37.6% multilingual), while others were non-native Dutch speakers. Among the 67.4% multilingual participants, a variety of other languages were reported, both native and non-native, including Sranan Tongo (38.9%), English (36.1%), Sarnámi (19.4%), Javanese (14.4%), Spanish (6.7%), Portuguese (3.3%), Aukaans (1.1%), Chinese (0.6%), French (0.6%), and Greek (0.6%).
Data from the Surinamese sample were compared with previously acquired data (Huygelier et al., Reference Huygelier, Schraepen, Demeyere and Gillebert2019) from a Belgian sample (N = 247) consisting of 139 (56.3%) female participants and 108 (43.7%) male participants, with an average age of 59.7 ± 17.0 years (range 22 to 90 years) and an average education of 13.8 ± 3.4 years (range 6 to 23 years). Mother tongue was recorded in a subsample of 222 participants, of whom 98.4% identified themselves as native Dutch speakers, while others were raised bilingual Dutch-French.
Cultural adaptation of the Dutch Oxford Cognitive Screen for Suriname
The OCS-NL, which is the Dutch version of the OCS, underwent a cultural adaptation process. This process involved gathering feedback from various sources, including a local multidisciplinary team, a small group of neurotypical individuals from Suriname, and the research team of the OCS-NL.
First, the OCS-NL was reviewed independently by a local multidisciplinary team comprising a neuropsychologist, an anthropologist, a remedial educationalist, and psychology students. This team possessed a deep understanding of the cultural diversity within the Surinamese population. Through their evaluation, they identified four key areas where cultural differences were expected. These areas included the choice of words, the selection of pictures, and the level of Dutch language proficiency required to comprehend the instructions. To address these differences, a cultural adaptation was developed, that is, the OCS-NL(SU).
In the next stage, the OCS-NL and OCS-NL(SU) were piloted on a small group of neurotypical individuals from Suriname. This group consisted of individuals from various age groups, educational backgrounds, and socioeconomic statuses. The purpose of this pilot testing was to assess the performance of the participants and gather their feedback. Based on the performance and feedback received from the pilot participants, further adaptations were made to the OCS-NL(SU). These modifications aimed to enhance its cultural appropriateness and ensure its effectiveness in assessing cognitive abilities within the Surinamese population.
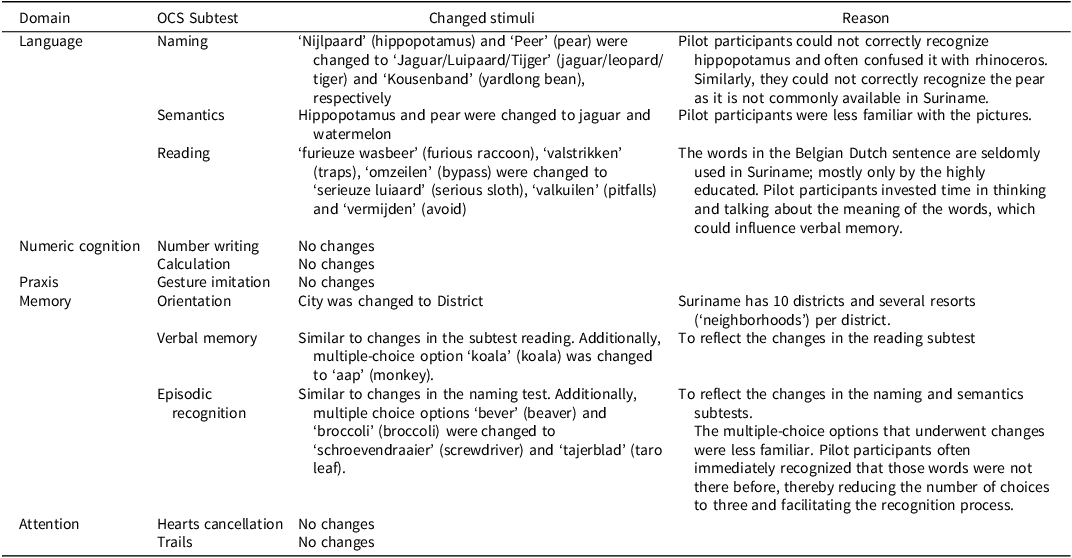
Finally, the OCS-NL(SU) underwent a review for construct equivalence across versions and received approval from the research teams of the OCS and OCS-NL. As part of the cultural adaptation process, changes were made to the words and pictures used in the subtests of Naming, Orientation, Reading, Verbal Memory, and Episodic Recognition (Table 1). These changes were made to ensure that the materials were familiar and relatable to the Dutch-speaking Surinamese population.
Modifications to the Dutch Oxford Cognitive Screen for the Surinamese population

The adaptation process initially followed the OCS development team’s protocol for translation and cultural adaptation. Subsequently, efforts were made to align the process with the International Test Commission guidelines (Gangaram-Panday et al., Reference Gangaram-Panday, Huygelier, Kromosemito, Demeyere and Gillebert2022; Hernández et al., Reference Hernández, Hidalgo, Hambleton and Gómez-Benito2020; Nguyen et al., Reference Nguyen, Rampa, Staios, Nielsen, Zapparoli, Zhou, Mbakile-Mahlanza, Colon, Hammond, Hendriks, Kgolo, Serrano, Marquine, Dutt, Evans and Judd2024). The International Test Commission guidelines checklist is provided in Supplemental Table 4.
Procedure
Ethical approval was obtained from the Research Ethics Committee of the Ministry of Health of Suriname. The research was conducted in accordance with the World Medical Association Declaration of Helsinki. Data collection was conducted by the first author and a team of trained research assistants. Prior to their involvement, the participants were provided with comprehensive information regarding the study and willingly provided their consent. First, a semi-structured interview was conducted to gather sociodemographic and health-related data. Afterwards, the visual and hearing capabilities of the participants were assessed by referring to their medical records or by employing the Snellen chart and Whisper test, respectively. This step was crucial to ensure that no visual or hearing impairments would hinder the accuracy of the subsequent assessments. Lastly, the participants underwent the administration of the OCS.
Statistical analysis
First, descriptive statistics, namely the median, the minimum, the maximum, and the fifth and tenth percentiles, were calculated for the Surinamese and Belgian populations, respectively. Fifth and tenth percentiles were defined as the percentage of scores that fall below the score of interest, with half of those obtaining the score of interest included in the percentage (Crawford et al., Reference Crawford, Garthwaite and Slick2009; Hyndman & Fan, Reference Hyndman and Fan1996). Additionally, the fifth percentiles from the Surinamese population were compared to published cut-offs from other versions and populations. However, since studies employed disparate methodologies to derive their cut-off values, statistical testing was not conducted.
Second, a Bayesian hierarchical logistic regression model was used to predict the accuracy on the OCS subtests (i.e., the number of correct items divided by total items) as a function of population (Belgian vs. Surinamese), age (years), education (years), OCS subtests and the two-way interactions of these variables. A Bayesian framework was selected because it offers several important advantages for this analysis. In particular, Bayesian methods allow us to model complex hierarchical structures (such as repeated measures within participants) and produce full posterior distributions that reflect uncertainty in a more intuitive and interpretable manner than traditional frequentist approaches. This is particularly valuable in cross-cultural neuropsychological research, where sample sizes can be modest, and the effects of interest may vary across groups. Unlike frequentist approaches that rely on p-values, the Bayesian method quantifies uncertainty through credible intervals, which directly represent the range of values within which the true effect lies with a given probability (e.g., 95%). This allows us to make more interpretable probabilistic statements about population differences, rather than relying on arbitrary significance thresholds.
Age and education were included to control for potential confounding effects and to gain a more accurate understanding of the differences between the populations. A dummy coded predictor was defined for each OCS subtest. This implies that an interaction between an OCS subtest and another variable represents the difference in the effect of the variable for this specific OCS subtest relative to all other OCS subtests. The predictor subtest was a within-subject factor (i.e., as participants completed each OCS subtest). A random intercept for each participant was also included in the model to account for differences between participants. Following the guidelines of Gelman et al. (Reference Gelman, Jakulin, Pittau and Su2008), we scaled our categorical and continuous predictors such that all predictors were comparable. Population was recentered to have a mean of 0 and min-max range of 1. Age and education were rescaled to have a mean of 0 and a standard deviation of 0.5. We used weakly informative prior distributions following the recommendations by Gelman et al. (Reference Gelman, Jakulin, Pittau and Su2008). A Cauchy prior distributions with a center of 0 and a scale of 2.5 for each predictor and a Cauchy prior with center of 0 and scale of 10 for the intercept (Gelman et al., Reference Gelman, Jakulin, Pittau and Su2008). Model fit was inspected using density and trace plots of each parameter and model convergence was evaluated by inspecting the R-hat values. All parameters except the interaction of the Semantics subtest and population showed good convergence. We therefore excluded this predictor from the model and refitted the model without this term. The latter model converged with all R-hat values lower than 1.05. To investigate the impact of cultural differences, we compared the accuracy on each OCS subtest between the two populations, while age and education were held constant at the sample average. We calculated the difference in average accuracy between Belgian and Surinamese participants to demonstrate the population differences for each subtest. To assess the significance of these differences, we report posterior predictive intervals. These intervals represent the range of expected values in the future. Thus, if these intervals include zero, it indicates that zero (no) difference may be observed in future data.
To examine the similarities and differences in the association between age and accuracy between the two populations, we calculated the difference in accuracy between 90- and 20-year-old participants with education held constant at the average of 12.7 years. Subsequently, we compared these differences between Belgian and Surinamese participants. To examine similarities and differences in the association between education and accuracy, we calculated the difference in accuracy between participants with 6 and 16 years of education, with age held constant at the average of 52 years. Subsequently, we compared these differences between Belgian and Surinamese participants and report their posterior predictive intervals. For subtests with maximum scores of 4, 12, 13, 15, and 50, accuracy differences of at least 25%, 8.3%, 7.7%, 6.7%, and 2%, respectively, correspond to a 1-point difference in raw test scores.
All statistical analyses were performed using the brms, rstan, marginaleffects, tidyverse, tidybayes packages in R version 4.4.2 (Arel-Bundock et al., Reference Arel-Bundock, Greifer and Heiss2024; Bürkner, Reference Bürkner2017; Kay et al., Reference Kay, D., M. and A.-B.2021; R Core Team, 2024; Rstan Development Team, 2022; Wickham et al., Reference Wickham, Averick, Bryan, Chang, McGowan, François, Grolemund, Hayes, Henry, Hester, Kuhn, Pedersen, Miller, Bache, Müller, Ooms, Robinson, Seidel, Spinu and Yutani2019).
Results
Descriptive statistics for the Oxford Cognitive Screen subtests
A ceiling effect, whereby the median scores equaled the maximum scores, was observed in both populations for all subtests except the Hearts Cancellation (Table 2). Ninety-five percent of all Surinamese participants achieved a maximum score on the subtests Semantics and Number Writing and 95% of all Belgian participants achieved a maximum score on the subtests Semantics, Reading, Orientation, and Number Writing. The fifth percentiles cut-offs for the subtests Semantics, Episodic Recognition, Number Writing, Calculation, and Single Trail were comparable between Surinamese and Belgian participants. The fifth percentiles cut-offs for Naming and Praxis (Gesture imitation) were lower for the Belgian participants, whereas the percentile cut-offs for Reading, Orientation, Mixed Trail, and Hearts Cancellation were lower for the Surinamese participants.
Subtest descriptives for Surinamese and Belgian participants

Sd = standard deviation, Mdn = Median, Min = Minimum, Max = Maximum, pc = percentile. The 5th percentile and 10th percentile cut-offs that differ between the two groups are in bold.
Association of OCS performance with population
To address our primary aim — to investigate the impact of cultural differences on the OCS by comparing the performance of Belgian and Surinamese populations — we examined differences in performance on each OCS subtest using Bayesian hierarchical regression analysis. In line with our secondary aim, we also assessed whether the associations between age and performance, as well as education and performance, differed between the two populations through two-way interaction terms. All regression coefficients are reported in Supplemental Table 5. The results are discussed in more detail in the next paragraphs.
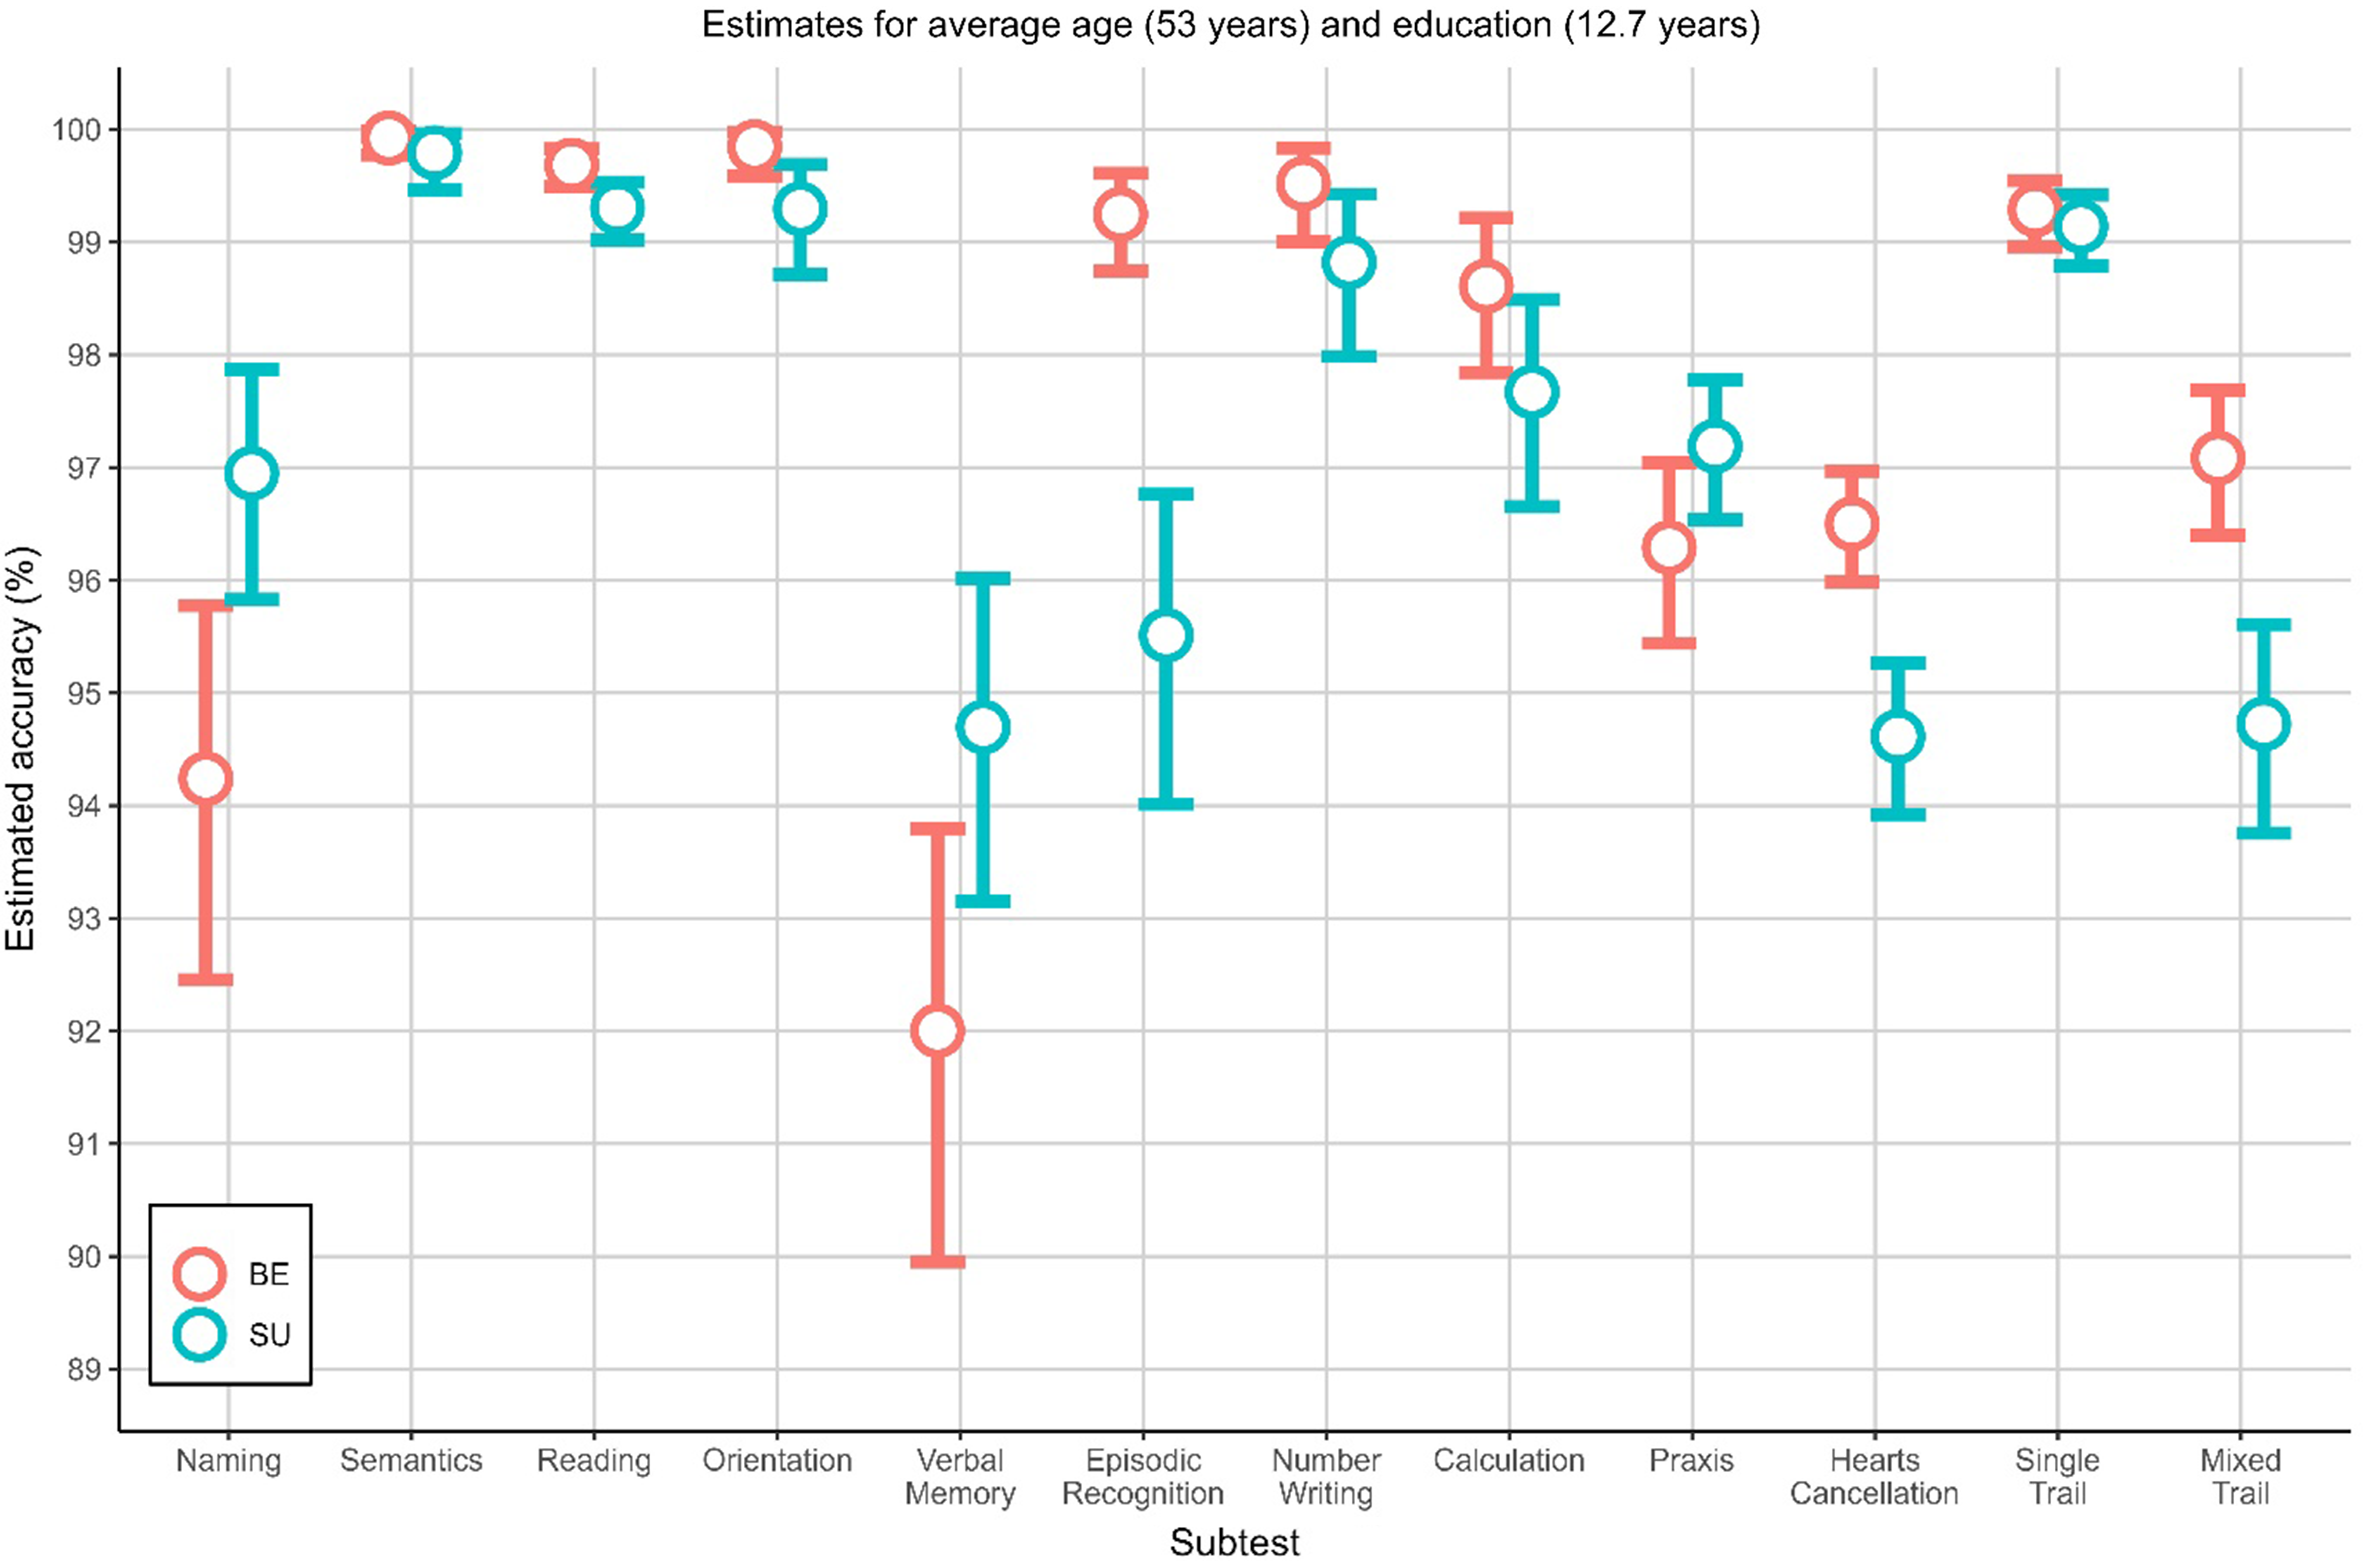
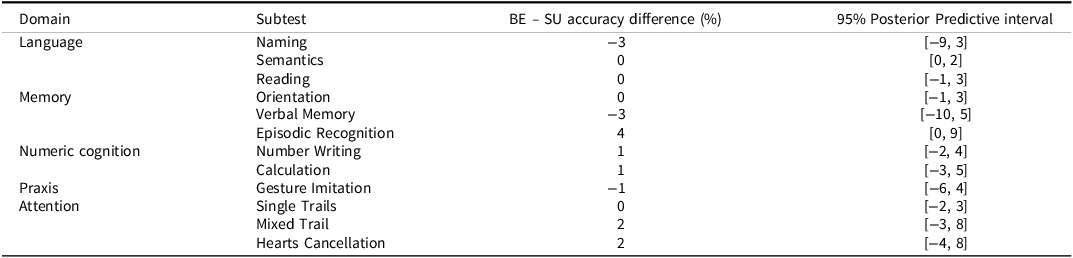
First, there was a significant main effect of population on OCS performance (Supplemental Table 5). Belgian participants had 2.86 times higher odds to obtain a correct response than Surinamese participants (95% CI of odds = [1.01, 8.84]). In addition, there was a significant interaction between Population and three subtests: Naming, Verbal Memory and Praxis. Surinamese participants performed better on average than Belgian participants on these three subtests (Figure 1). Although the model indicated that the difference between populations varied significantly across subtests, the population differences were small (ranging from 0 to 4%), and the posterior predictive intervals suggest that no differences will be present in new samples (Table 3).
Estimated accuracy on the Oxford Cognitive Screen per subtest for the Belgian (BE) versus Surinamese (SU) population, while keeping age and education constant at the average. The error bars represent the 95% posterior predictive intervals (expectations for new observations given the observed data).

Difference in accuracy on the Oxford Cognitive Screen subtests between Belgian versus Surinamese participants, while keeping age and education constant at the average (53 years and 12.7 years, respectively)

Association of age with OCS performance in both populations
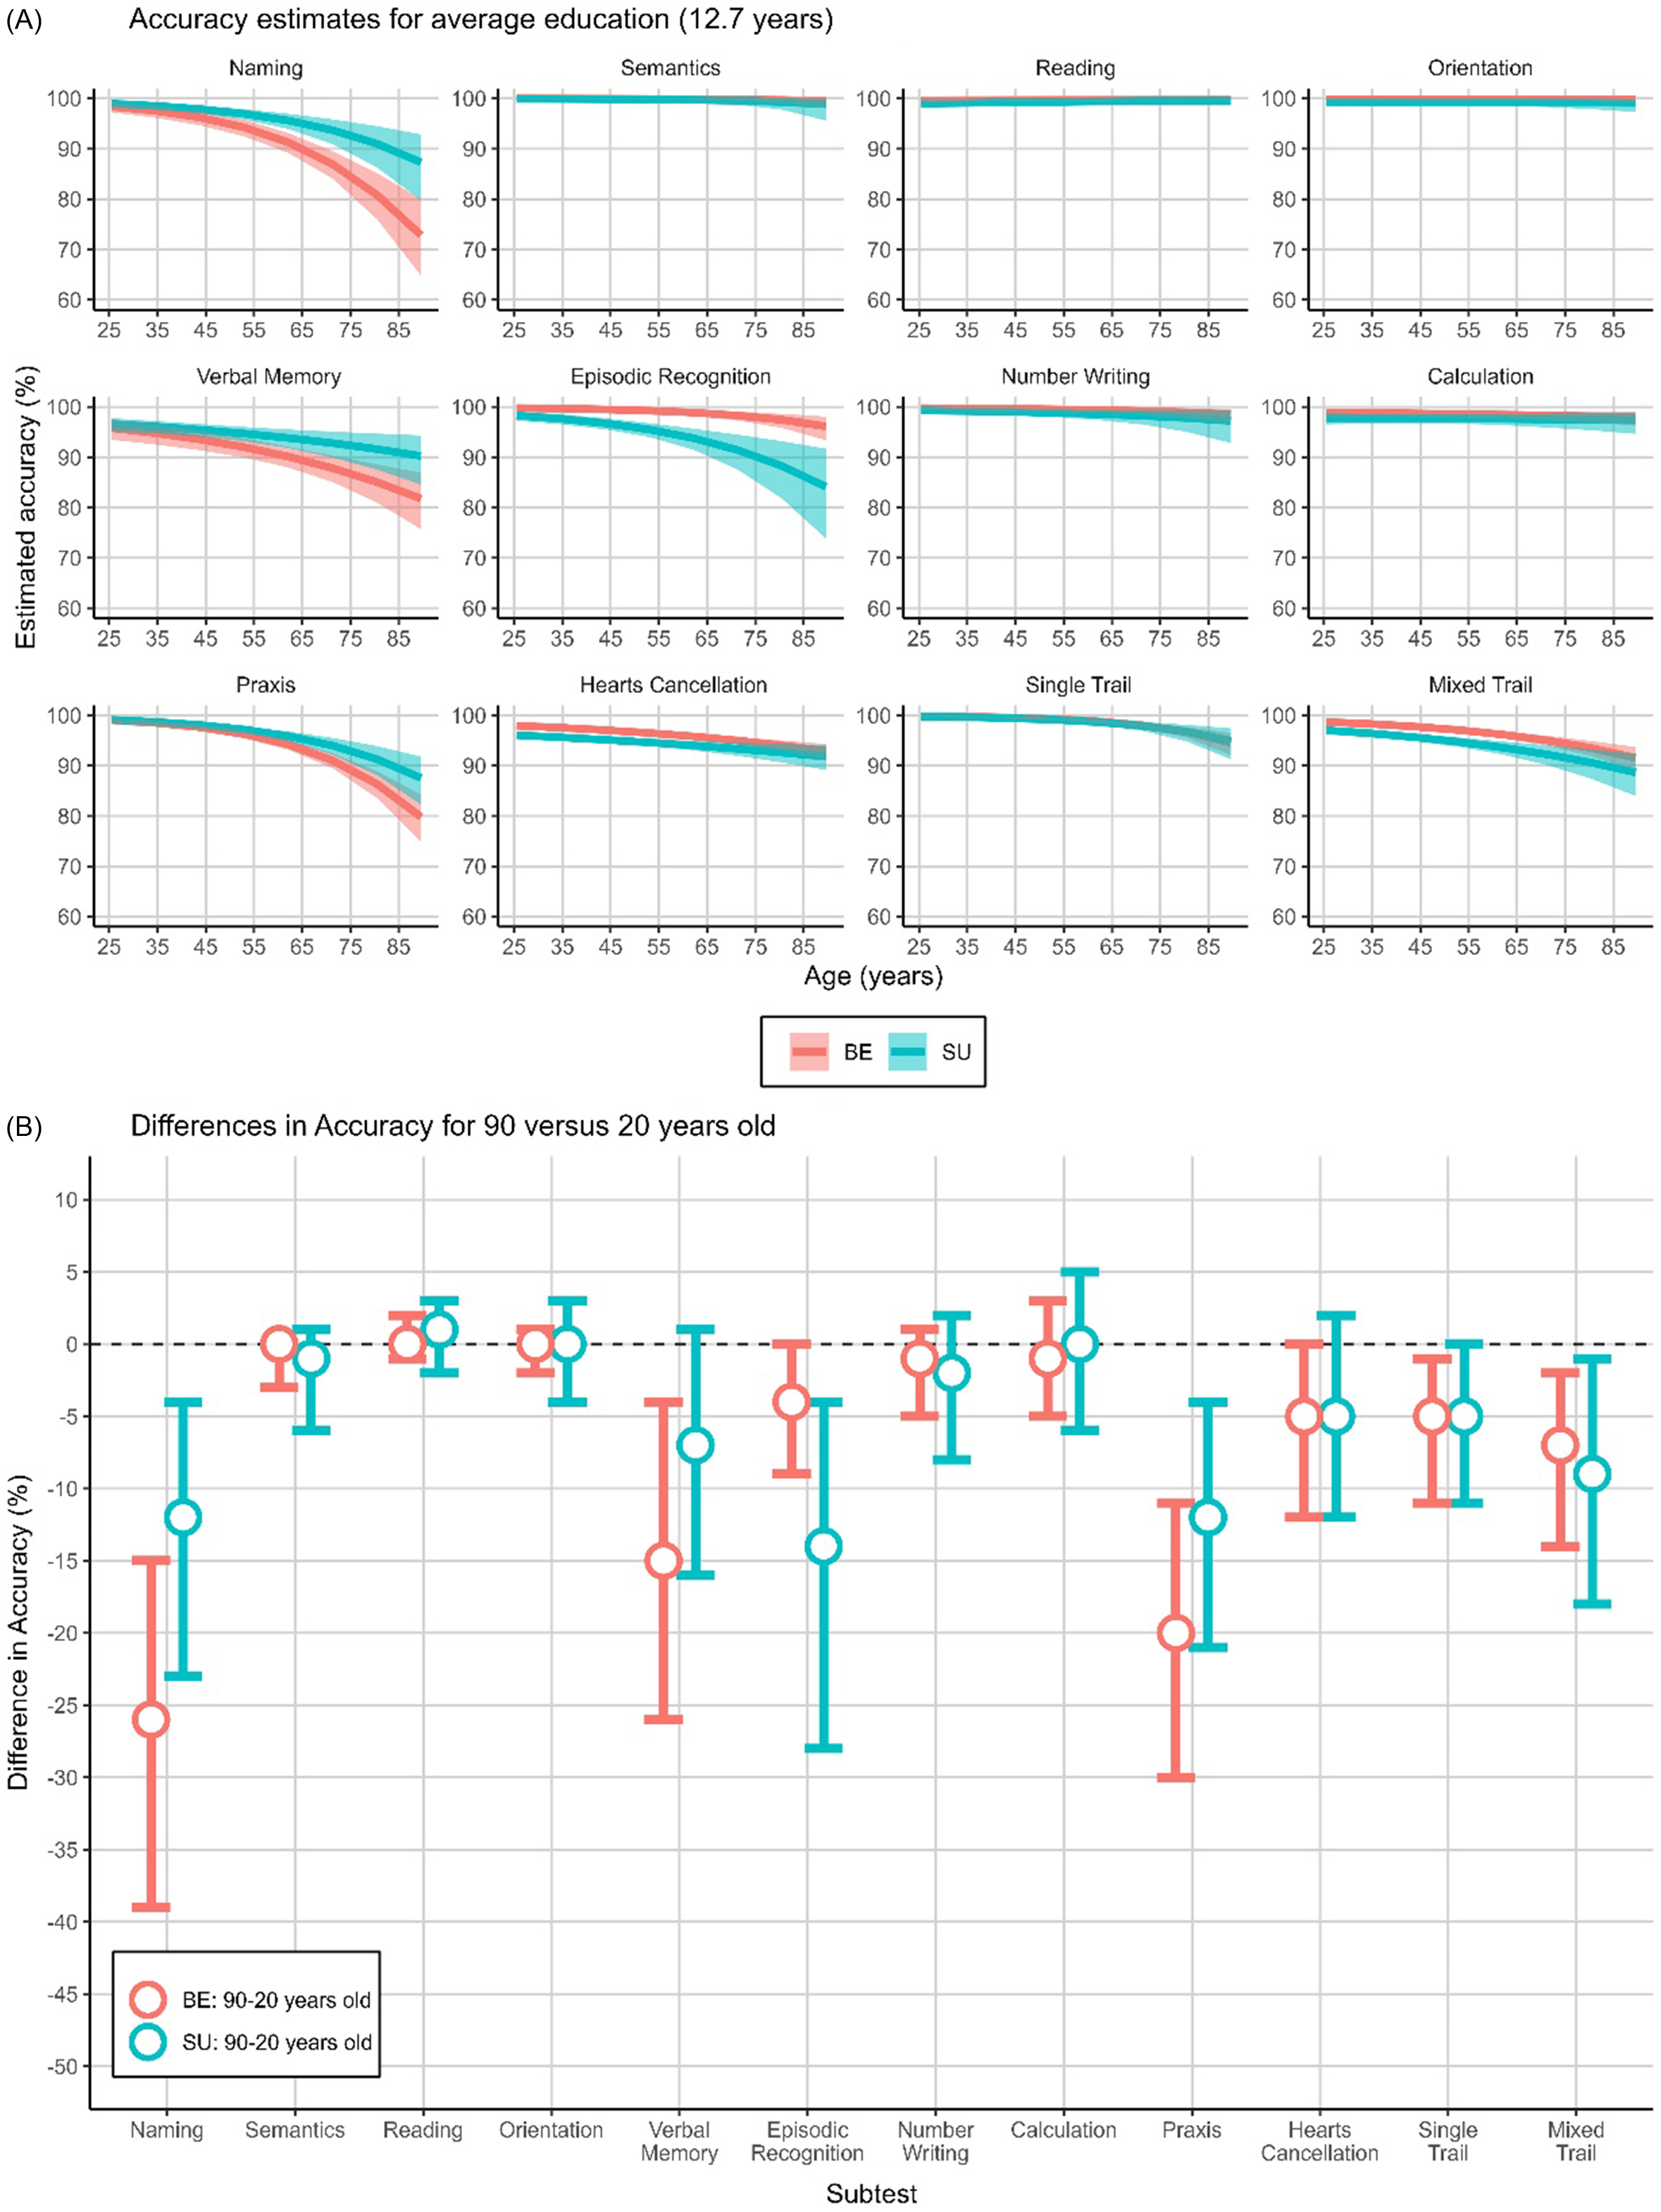
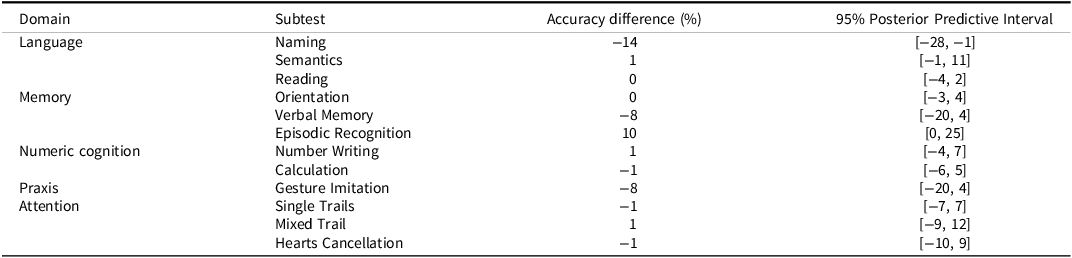
Regarding age, there was no significant main effect of age on OCS performance, nor a significant interaction with Population (Supplemental Table 5, Supplemental Figures 1a and 1b). Indeed, for several subtests (i.e., Semantics, Reading, Orientation, Number Writing and Calculation), the expected accuracy on the OCS remained close to 100% across all age groups in both populations, when keeping education constant (Figure 2A). For these subtests, the estimated difference in performance between a 90- and 20-year-old participant was close to zero for Belgium and Suriname (Figure 2B). For other OCS subtests, expected performance differences between 90- and 20-year-olds were more pronounced, ranging from 5% (for Hearts Cancellation and Single Trails) to 26% (for Picture Naming) (Figure 2B). The differences in performance of a 90- and 20-year-old were similar between the Belgian and Surinamese population for all subtests, except Picture Naming. These differences ranged from 0% (for Reading and Orientation) to 14% (for Picture Naming), with the posterior predictive intervals suggesting that only the difference in Picture Naming will be present in new samples (Figure 2B, Table 4).
The association between age and accuracy in Belgian (BE) and Surinamese (SU) participants. In panel A the accuracy estimates are shown for both populations. In panel B the differences in accuracy between a 90 versus a 20-year-old with 12.7 years education are shown or both populations. The area around the line and error bars represent the 95% posterior predictive interval (expectations for new observations given the observed data).

Differences in the 90–20 years accuracy gap between Belgian versus Surinamese participants

Association of education with OCS performance in both populations
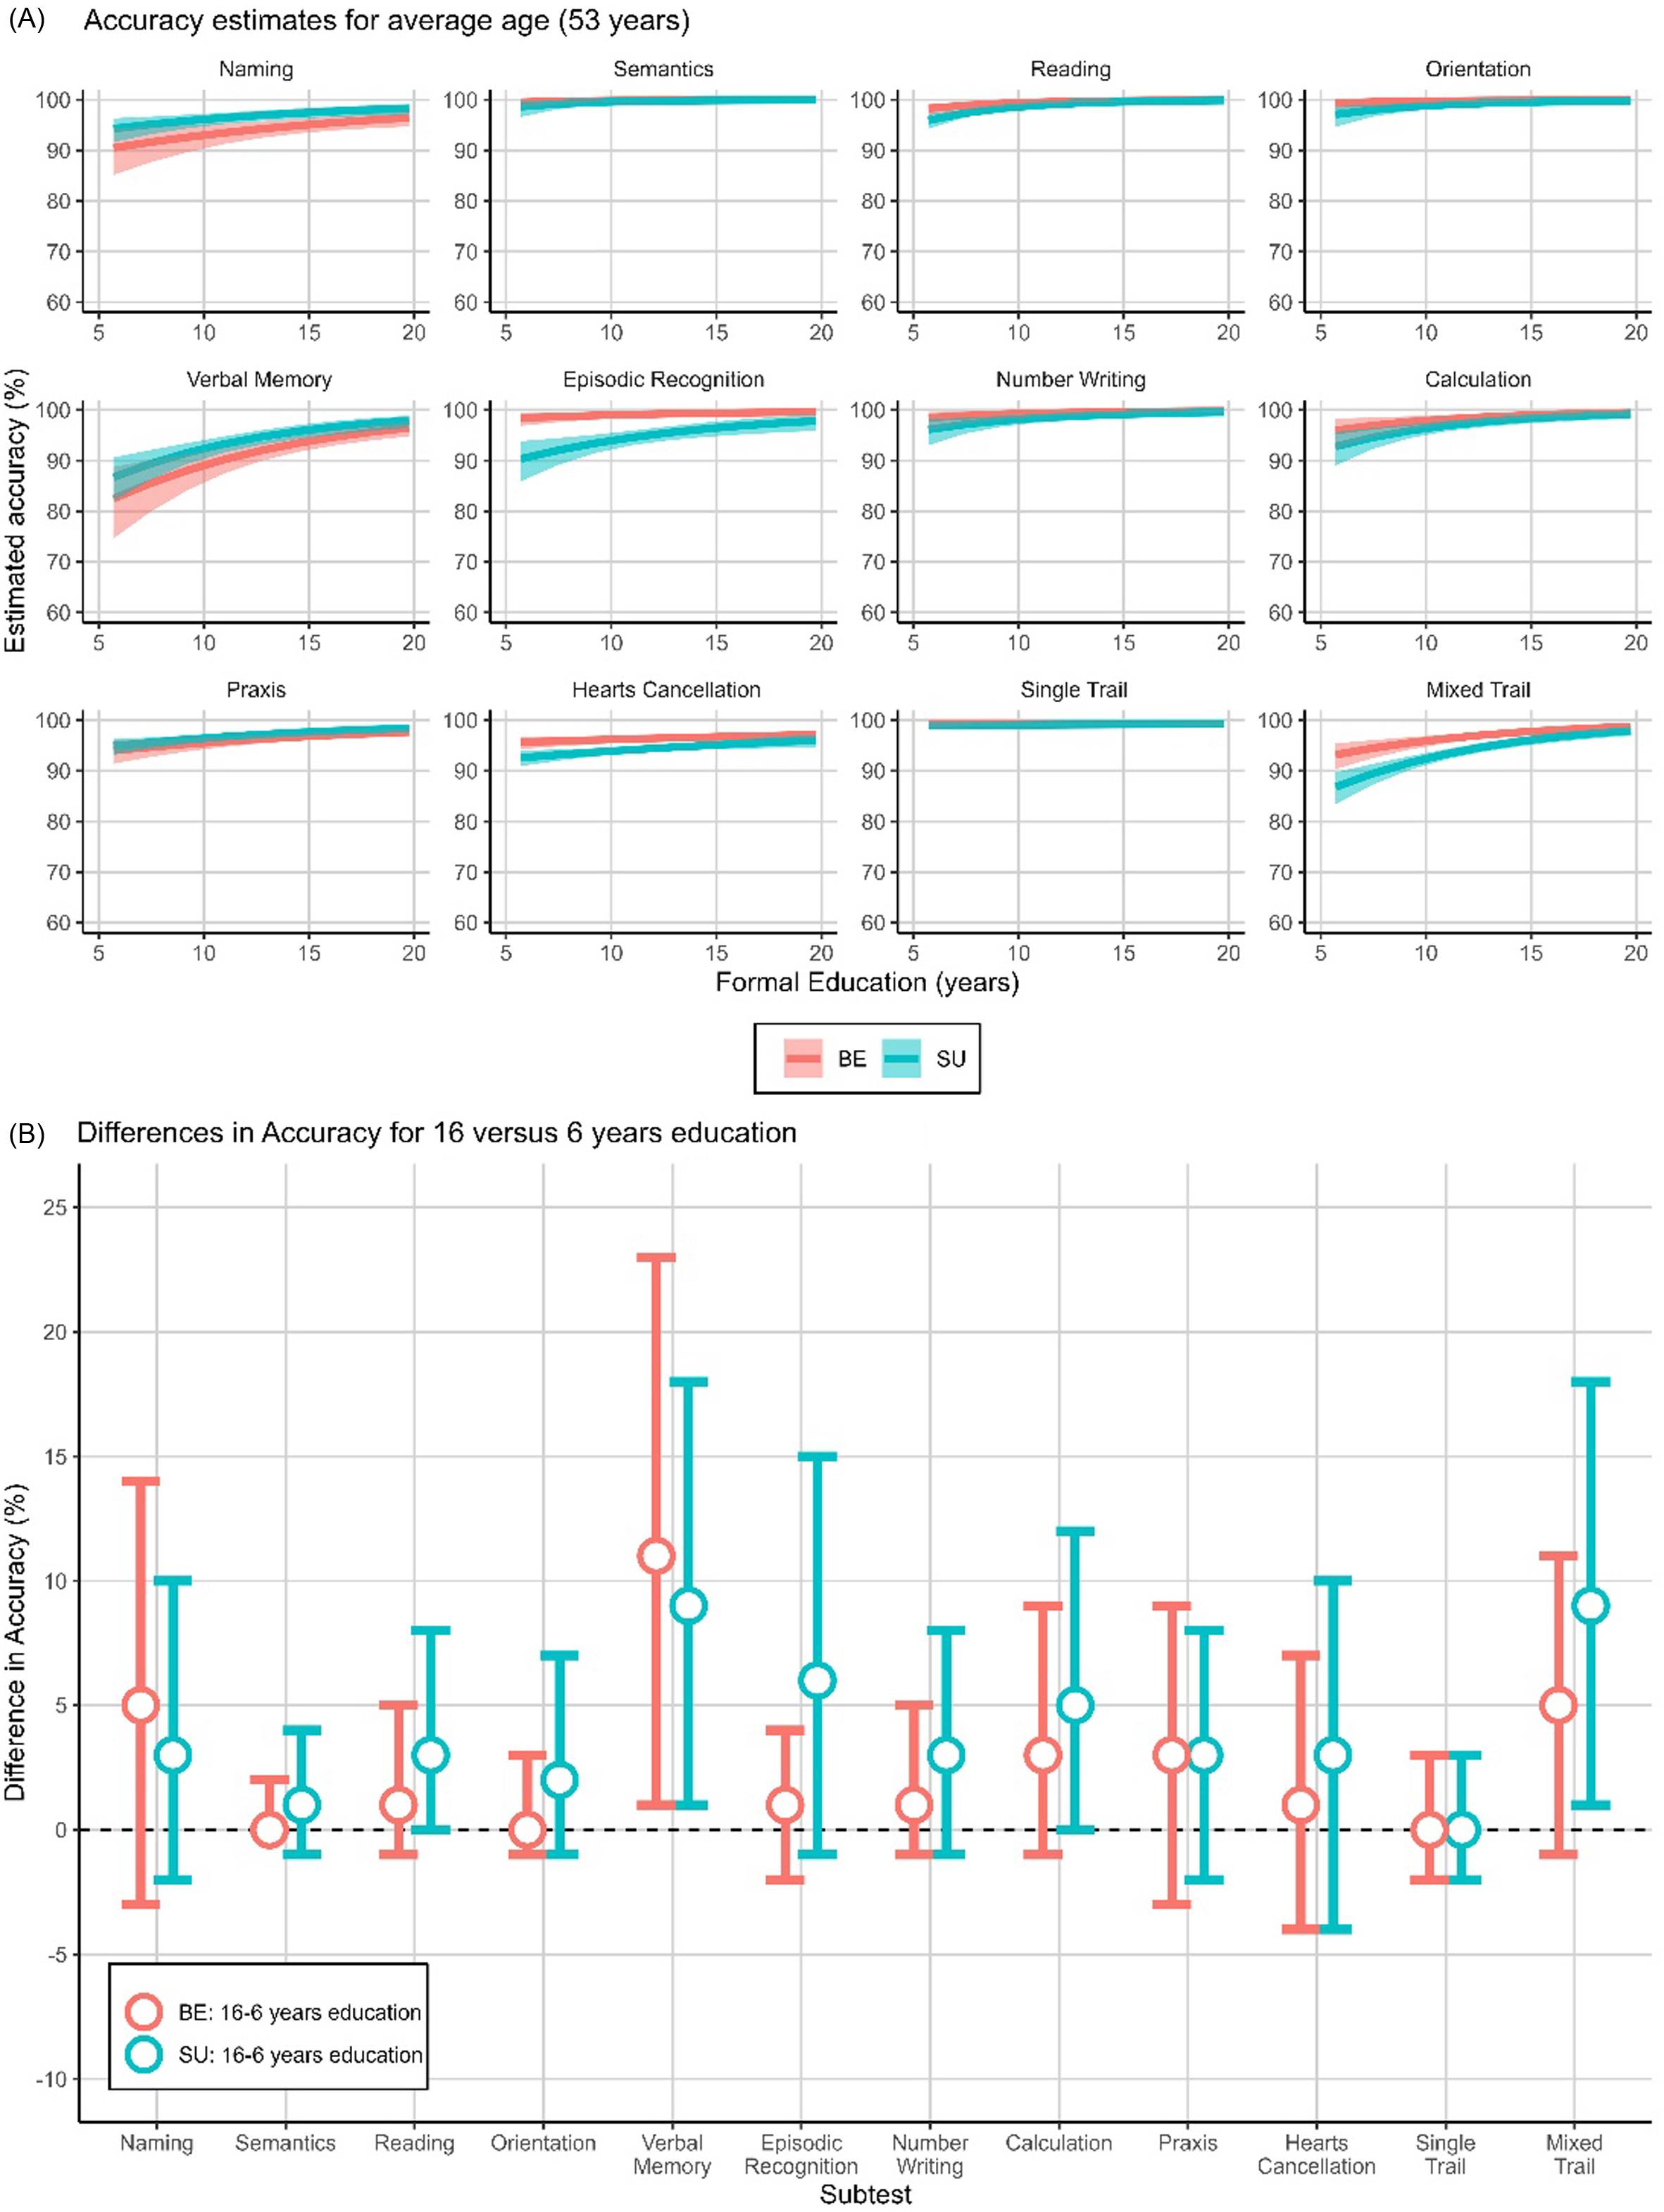
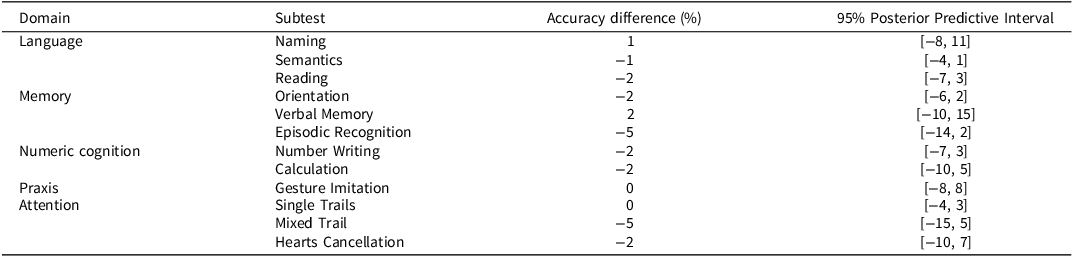
There was no significant effect of education on OCS performance nor an interaction with subtests or population (Supplemental Table 5, Supplemental Figures 1a, 1b, and 1e). Indeed, the expected accuracy remained high across all education levels for many OCS subtests (except Verbal Memory and Mixed Trails) (Figure 3A). The expected difference in performance between participants with 16 versus 6 years of formal education ranged from 0% (for Semantics, Orientation, and Single Trails) to 11% (for Verbal Memory), with those with more years of education performing better. However, except for Verbal Memory and Mixed Trails, the 95% posterior predictive intervals included zero (Figure 3B). Moreover, the differences in performance of a person with 16 versus 6 years education were comparable between Belgium and Suriname. All estimated differences ranged between 0 (for Praxis and Single Trail) and 5% (for Episodic Recognition and Mixed Trail) and for all estimates zero was not excluded from the 95% posterior predictive intervals (Table 5).
The association between education and accuracy in Belgian (BE) and Surinamese (SU) participants. In panel A the accuracy estimates are shown for both populations. In panel B the differences in accuracy between participants with 16 versus 6 year education aged 53 years are shown for both populations. The area around the line and error bars represent the 95% posterior predictive interval (expectations for new observations given the observed data).

Differences in the accuracy gap between Belgian and Surinamese participants with 16 versus 6 years education

Discussion
This study compared performance on the OCS between a more WEIRD, less culturally diverse Belgian population and a less WEIRD, more culturally diverse Surinamese population. The Surinamese group was assessed using an adapted version of the Dutch OCS, while the Belgian group completed the standard Dutch version. We found that the cut-offs were similar across the Belgian and Surinamese population for subtests Semantics, Episodic Recognition, Number Writing, Calculation and Single Trails. However, differences in the cut-offs were observed for the subtests Naming, Reading, Orientation, Praxis, Mixed Trails and Hearts Cancellation.
Comparing the cut-offs for the Surinamese population with those from other populations revealed that most of the differences between the Surinamese population and other populations were also present for Naming, Praxis, Reading, Orientation, Mixed Trail and Hearts Cancellation (Supplemental Table 1). However, no clear trend was observed per subtest. In some instances, the cut-offs were higher for the Surinamese population, while in others they were lower. Yet, as the Belgian and Surinamese populations, as well as other populations, differed in terms of age and education, these cut-off differences may not necessarily indicate true population differences. Despite some initial variations in OCS performance between the Surinamese and Belgian populations, the differences were minimal after controlling for age and education, with participants in both populations performing near ceiling on the majority of the OCS subtests. These findings suggest that although cultural background may still have some effect, the impact of cultural differences on OCS outcomes was minimal.
Another key aspect of this study was to examine whether performance on the OCS showed similar associations with age and education in both populations. There was evidence for an age-related performance decline on several OCS subtests (Picture Naming, Verbal Memory, Episodic Recognition, Gesture Imitation, Hearts Cancellation and the Single and Mixed Trails of the Executive Task) and an education-related improvement on two subtests (Verbal Memory and Mixed Trails). The age-related decline and education-related improvement were generally similar between the Surinamese and Belgian Dutch-speaking populations, except for the Picture Naming subtest, where the age-related decline was more pronounced in the Belgian population.
While previous studies (e.g., Julio-Ramos et al., Reference Julio-Ramos, Foncea-Gonzalez, Farias-Ulloa, Inostroza-Rojas, Conejeros-Pavez, Gutierrez-Vasquez, Soler-Leon, Saez-Martinez, Solinas-Ivys, Demeyere, Martinez-Ferreiro and Mendez-Orellana2024; Mancuso et al., Reference Mancuso, Varalta, Sardella, Capitani, Zoccolotti and Antonucci2016; Robotham et al., Reference Robotham, Riis and Demeyere2020) have examined age and education effects on OCS performance, none of them have explicitly contrasted the patterns of association across culturally distinct populations. By doing so, we not only replicated some findings (e.g., an age-related performance decline for subtests Picture Naming, Verbal Memory, Episodic Memory, Gesture Imitation, Hearts Cancellation and Single Trails and an education-related performance improvement for subtest Verbal Memory and Mixed Trails), but also provided new insights how cultural context may interact with cognitive aging and educational background. More specifically, our findings suggest similar effects of age and education in both Belgian and Surinamese populations for the majority of the subtests. This contrasts with the inter-study discrepancies we observed in previous research. For example, higher education was paradoxically associated with lower rather than higher reading scores in the Danish and Spanish populations (Robotham et al., Reference Robotham, Riis and Demeyere2020; Valera-Gran et al., Reference Valera-Gran, López-Roig, Hurtado-Pomares, Peral-Gómez, García-Manzanares, Sunyer Catlla, Más Sesé, Navarrete-Muñoz and Sánchez-Pérez2019), and lower rather than higher verbal memory scores in the Cantonese population (Kong et al., Reference Kong, Lam, Ho, Lau, Humphreys, Riddoch and Weekes2016). Similarly, older age was associated with higher rather than lower mixed trail scores in the Danish population (Robotham et al., Reference Robotham, Riis and Demeyere2020) and better rather than worse executive scores in the Russian and Cantonese populations (Kong et al., Reference Kong, Lam, Ho, Lau, Humphreys, Riddoch and Weekes2016; Shendyapina et al., Reference Shendyapina, Kuzmina, Kazymaev, Petrova, Demeyere and Weekes2019).
For the Picture Naming subtest, we did observe differences in age-related declines between Belgium and Suriname. The age-related decline for Picture Naming may be more pronounced in the Belgian population due to the differences in item familiarity and difficulty between the two OCS versions. It is possible that the objects included in the Surinamese adaptation were easier to name for this population, thus leading to a less marked age-related decline.
The similarities in performance between the OCS-NL and OCS-SU normative groups and similar relations between OCS performance and the demographic characteristics (age, education) suggest that the OCS-NL(SU) is suitable for cognitive screening in the culturally diverse Surinamese population. However, further investigations in clinical populations are important. This normative study does clarify that clinicians should not expect large effects of age nor education on the OCS-NL(SU) performance for the majority of the subtests. However, they should account for the impact of age when interpreting the Picture Naming test. To aid clinical application, we therefore provide age-stratified normative data for the Surinamese population (Supplemental Table 6), allowing clinicians to apply age-appropriate cut-offs in practice.
Despite the valuable insights gained, this study has several limitations. Although we controlled for age and education, other confounding factors such as sex, socioeconomic status and acculturation (e.g., Franzen et al., Reference Franzen, Pomati, Papma, Nielsen, Narme, Mukadam, Lozano-Ruiz, Ibanez-Casas, Goudsmit, Fasfous, Daugherty, Canevelli, Calia, van den Berg and Bekkhus-Wetterberg2021) were not accounted for, limiting the ability to examine their influence on OCS performance. Furthermore, in culturally diverse populations, years of education may not fully capture the quality or type of education received, which can vary significantly across and within countries (Ardila et al., Reference Ardila, Bertolucci, Braga, Castro-Caldas, Judd, Kosmidis, Matute, Nitrini, Ostrosky-Solis and Rosselli2010; Fernández, Reference Fernández, Fernandez and Evans2022a). The Surinamese sample also included relatively few participants with low education and few aged 75 years or older, which may restrict the generalizability of the findings to these subpopulations. Moreover, while the OCS was minimally adapted for the Surinamese population, the adaptation may have resulted in differential item functioning between the two cultural adaptations. Finally, this study compared only two countries — Belgium and Suriname — which, while representing WEIRD and less WEIRD populations, may be insufficient to generalize the findings to other culturally diverse contexts (Milfont & Klein, Reference Milfont and Klein2018; Muthukrishna et al., Reference Muthukrishna, Bell, Henrich, Curtin, Gedranovich, McInerney and Thue2020; Nosek & Errington, Reference Nosek and Errington2020). Expanding future research to include a broader range of populations and confounding factors will offer a more comprehensive understanding of how the OCS performs across culturally diverse populations.
Conclusion
This study aimed to investigate the impact of cultural differences on cognitive screening outcomes by comparing the performance of Belgian and Surinamese stroke populations on the OCS. Our findings suggest that the adapted Dutch OCS version for the Surinamese population (OCS-NL(SU)) performs comparably to the standard version used in Belgium. After accounting for differences in age and education, only minimal differences in subtest performance were observed between the two populations, with most participants performing near ceiling.
In line with our secondary aim, we also examined whether the relationships between demographic factors (age and education) and OCS performance differed between the populations. The patterns of age-related decline and education-related improvement were largely similar across both groups, with the exception of the Picture Naming subtest, where a more pronounced age-related decline was observed in the Belgian group.
Together, these findings highlight the importance of culturally adapting cognitive screening tools and accounting for demographic factors when interpreting test results.
Supplementary material
The supplementary material for this article can be found at https://doi.org/10.1017/S1355617725101173.
Funding statement
Hanne Huygelier received funding from the Flemish Fund for Scientific Research (FWO; 1249923N). Céline R. Gillebert was supported by an Odysseus research grant from FWO (G0H7718N). Nele Demeyere (Advanced Fellowship NIHR302224) is funded by the National Institute for Health Research (NIHR). The views expressed in this publication are those of the author(s) and not necessarily those of the NIHR, NHS, or the UK Department of Health and Social Care. Shonimá Gangaram-Panday received no funding.
We would like to express our gratitude to the multidisciplinary team, particularly Dr Manon Sanches and Dr Pam Zuurbier, for their review of the OCS-NL for cultural adaptation for Suriname. We extend our thanks to the regional health centers, the elderly care homes, and governmental organizations for allowing us to conduct data collection at their facilities. We also appreciate the support of Tiffany Kromosemito, Shanuska Sewsahai, Akshatha Mahabir, Naomi Moespar, Genaro Bhagwandin, Pooja Moesai, Lucretia Holter, Jaylen Somodiwongso, Christy Veux, Darshini Benarsie, and other psychology students for their assistance in data collection and entry. Finally, we would like to thank all the participants for their participation in this study.
Competing interests
We declare no conflicts of interest. Nele Demeyere is a developer of the OCS but does not receive any remuneration from its use.


 Open access