


I. Introduction
One of the fundamental roles of the stock market is to incorporate relevant information into stock prices, with the salutary outcome that capital is allocated to its highest and best use (Tobin (Reference Tobin and Johnson1989), Wurgler (Reference Wurgler2000)). However, not all relevant information is publicly available. Some information relevant to the pricing of publicly traded stocks resides in the folds of nonpublicly traded firms. Such firms, like their publicly traded brethren, are constantly searching for new products, new processes, and new technologies. When that search leads to a novel finding that has implications for the pricing of publicly traded stocks, the implications may not be immediately incorporated into prices because nonpublicly traded firms are not generally followed by analysts and other information providers.
We propose that a conduit through which the implications of innovations developed by nonpublicly traded firms become embedded into publicly traded stock prices is institutional investors who hold positions in the shares of both publicly traded and nonpublicly traded firms. The prediction is that these institutional investors will achieve superior returns by investing in publicly traded stocks that are best able to take advantage of the innovations developed by the nonpublicly traded firms.
We investigate this prediction by analyzing the returns of institutional investors’ active investment decisions in publicly traded stocks, who also hold positions in venture capital (VC) funds. VC funds are often actively involved in overseeing the nonpublicly traded firms in their portfolios, providing them with the opportunity to learn about the innovations developed by these firms. In turn, institutional investors, who invest in VC funds, often have access to this information through formal information channels, such as quarterly reports provided by VC funds, annual meetings, investment committee meetings, and advisory committee meetings. For example, Abuzov, Gornall, and Strebulaev (Reference Abuzov, Gornall and Strebulaev2025) show that limited partnership agreements require VC fund managers to include information on investments made by the VC fund in their reports. Additionally, institutional investors have access to informal information channels, such as social interactions with VC fund managers and managers of the nonpublicly traded firms in their portfolios. We confirm that these formal and informal information channels exist through a small survey and interviews with VC fund managers. In fact, a VC fund manager revealed that institutional investors are interested in being informed about “… what’s coming” to “cherry pick” stocks in public markets.
We label “connected industries” as industries that the institutional investor is connected to by virtue of its investment in a VC fund that invests in nonpublicly traded firms in that industry. We label institutional investors’ investments in publicly traded stocks within connected industries as “connected investments” and investments in publicly traded stocks in other industries as “nonconnected investments.” We propose that innovations developed by nonpublicly traded firms have implications for publicly traded firms, and such information is not fully and immediately incorporated into publicly traded stock prices. Indeed, the literature documents that there is cross-firm learning even among publicly traded firms, where information is likely to disseminate more rapidly (Foster (Reference Foster1981), Cohen and Frazzini (Reference Cohen and Frazzini2008), Tookes (Reference Tookes2008), Menzly and Ozbas (Reference Menzly and Ozbas2010), and Ben-Rephael, Carlin, Da and Israelsen (Reference Ben-Rephael, Carlin, Da and Israelsen2021)). We expect industry information to be most useful in selecting publicly traded stocks within the same industry; therefore, we focus on institutional investments that are in the same industry as the nonpublicly traded firms.
Our analysis shows that, within the same industry, investments by connected institutions yield higher returns compared with those by nonconnected institutions. Specifically, connected investments outperform by approximately 15–26 BPS per quarter, even after adjusting for various risk factors. This indicates that the superior performance of institutional investors in connected investments is not simply a result of investing in stocks from the same industries as their VC funds, but rather of their enhanced ability to select high-performing stocks within those connected industries. Additionally, the within-industry approach helps address concerns about the endogeneity of connection formation or dissolution. For example, VC fund managers may strategically time their exits, which could both sever institutional investors’ connections and predict lower future overall industry returns, but would not impact within-industry differences in returns (Gompers, Gornall, Kaplan, and Strebulaev (Reference Gompers, Gornall, Kaplan and Strebulaev2020), Gredil (Reference Gredil2022)).
Moreover, controlling for institution-quarter fixed effects reveals that an institution’s connected investments generate risk-adjusted excess stock returns of approximately 40–130 BPS per quarter compared with its nonconnected investments. This finding rules out the possibility that institutional investors with VC fund holdings simply possess superior stock-picking abilities. Instead, the findings suggest that institutional investors gain an information advantage when investing in connected industries. Results remain robust when simultaneously controlling for institution-quarter and industry-quarter fixed effects, with connected investments generating risk-adjusted excess stock returns of approximately 9–16 BPS.
One remaining concern is that there could be institution–industry–time-level omitted variables that lead to investments in both publicly traded stocks and VC funds in the same industry. For example, institutional investors may time hiring industry experts who select both stocks and VC funds in the same industry, leading both to connections with industries and to higher returns from connected investments. While such scenarios are theoretically possible, they are unlikely, given the long-term nature of VC investments, with the average duration of connections in our sample being approximately 7 years. Nevertheless, to address such concerns, we use a quasi-natural experiment that disrupted the information flow between VC funds and public institutional investors. This experiment provides evidence that the results are due to information flow.
Several state court rulings at the end of 2002 and the beginning of 2003 substantially increased uncertainty about the type of information that public institutional investors were required to disclose about their VC funds’ investments via Freedom of Information Act (FOIA) requests (Hurdle (Reference Hurdle2005)).Footnote 1 Before these rulings, VC fund managers had an incentive to provide information about nonpublicly traded firms in their portfolio and to report interim fund performance with the expectation that doing so would increase the likelihood of future investments from the institutional investors (Chung, Sensoy, Stern, and Weisbach (Reference Chung, Sensoy, Stern and Weisbach2012)). However, these court rulings made VC fund managers aware that information transcribed in writing to public institutional investors could possibly be subject to FOIA requests and, thus, could become available to competitors of portfolio firms or, in the extreme, be published in a widely circulated newspaper (Hurdle (Reference Hurdle2005)).
We use these court rulings as an exogenous shock to the transmission of information from VC funds to public institutional investors. Using a difference-in-differences specification, we find that after these court rulings, the returns of public institutional investors’ connected investments decreased relative to the returns of private institutional investors’ connected investments. We obtain similar results in a triple-differences test that controls for a change in institutional investors’ returns from their nonconnected investments. These results eliminate the possibility that other events coincide with the court rulings and had different effects on the returns of public and private institutional investors. The results also rule out that state court rulings affected information flow from sources other than VC funds to public institutional investors, leading to lower returns for both connected and nonconnected investments by public institutional investors.
Abuzov et al. (Reference Abuzov, Gornall and Strebulaev2025) demonstrate that public institutional investors’ connections to certain elite VC firms’ consecutive funds were severed following the FOIA rulings. If institutions experience significant changes in their connections to a number of VC funds and industries, they may also lay off in-house experts. These shifts complicate identification, as observed effects could stem from changes in connections or personnel rather than from variations in information sharing. This concern is mitigated by robustness tests showing that the results hold in subsamples with stable connections and among institutions that did not experience a decline in the number of VC funds they invested in.
After the initial court rulings, many states passed laws that exempted public institutional investors from FOIA requests for detailed VC fund-level information or confidential written communication from VC funds. While these changes in state laws are less likely to be exogenous and could have been anticipated by VC fund managers, they provide another opportunity to test whether the results are due to information flow. In a stacked difference-in-differences setting, we find that the returns to public institutional investors’ connected investments increased relative to private institutional investors’ connected investments after the enactment of these state regulations.
Furthermore, our results are stronger in situations wherein institutional investors are likely to have a greater information advantage in connected investments. Specifically, we show that institutional investors’ stock returns from connected investments are higher when i) the institution receives better information as proxied by whether the VC fund specializes in the connected industry, ii) there is less publicly available information about the connected investments as proxied by analyst coverage or firm size, iii) the information is likely to be more relevant to the connected investment as proxied by whether the publicly traded firm operates only in one industry, and iv) connected investments experience large information events as proxied by large stock price movements in the connected investments.
Several additional findings using alternative specifications further support our proposition. Institutional investors allocate a larger portion of their portfolios to connected industries after a connection is established, and their decisions to over- or under-weight stocks within these connected industries predict future returns. When institutional investors lose their connections to an industry, such as when private firms in VC portfolios go public, they also lose their investment advantage in the previously connected industries.
Moreover, publicly traded stocks that receive more connected investments from institutional investors within an industry tend to experience higher subsequent returns. Returns from connected investments are particularly higher in industries with greater variation in the ratio of connected investments across stocks. These industries, where innovation is critical for firm success and VC investments are common, include sectors such as computers, data processing services, pharmaceuticals, medical instruments, and electronic components.
Our results are relevant to the literature that analyzes institutional investors’ returns from investments in VC funds (Sensoy, Wang, and Weisbach (Reference Sensoy, Wang and Weisbach2014), Korteweg and Nagel (Reference Korteweg and Nagel2016), Ang, Chen, Goetzmann, and Phalippou (Reference Ang, Chen, Goetzmann and Phalippou2018), and Cavagnaro, Sensoy, Wang, and Weisbach (Reference Cavagnaro, Sensoy, Wang and Weisbach2019)). We show that the benefit of investing in VC funds is not limited to cash flows generated by these funds. Institutional investors also gain information from their VC funds and use this information to better allocate capital to publicly traded stocks. These connected investments, amounting to over 6 trillion USD by the end of 2017 and representing approximately 18% of institutional investors’ actively managed stock portfolios, are likely to have a substantial impact on institutions’ portfolio performance. These connected investments deliver returns ranging from 1.2% to 5.4% higher per year compared with the same institutional investors’ nonconnected investments.
A parallel literature documents that institutional investors gain access to private information about specific publicly traded stocks from various sources and use this information to trade those stocks (Bodnaruk, Massa, and Simonov (Reference Bodnaruk, Massa and Simonov2009), Ivashina and Sun (Reference Ivashina and Sun2011) Massoud, Nandy, Saunders, and Song (Reference Massoud, Nandy, Saunders and Song2011), Gao and Huang (Reference Gao and Huang2016), and Ozmel, Trombley, and Yavuz (Reference Ozmel, Trombley and Yavuz2019)). In contrast, institutional investors in our sample do not trade based on insider information. There are examples of institutional investors investing both in public and private markets (Iliev and Lowry (Reference Iliev and Lowry2020) and Kwon, Lowry, and Qian (Reference Kwon, Lowry and Qian2020)). We focus on the information flow between markets. It is already documented that information flows from public to private markets. VC funds use public market information in their exit decisions (Gompers et al. (Reference Gompers, Gornall, Kaplan and Strebulaev2020)) and in their stage financing and syndication decisions (Liu and Tian (Reference Liu and Tian2022)). Our contribution to this literature is providing evidence that information flows in the opposite direction as well.
Our findings indicate that institutional investors use information from nonpublicly traded firms to improve their capital allocation in publicly traded stocks. This may result in publicly traded stock prices reflecting innovations from nonpublicly traded firms, thereby benefiting managers and capital providers by incorporating more information into stock prices in public markets (Durnev, Morck, and Yeung (Reference Durnev, Morck and Yeung2004), Edmans (Reference Edmans2009), and Bond, Edmans, and Goldstein (Reference Bond, Edmans and Goldstein2012)).
II. The Presence of Information Channels
In this section, we provide survey and anecdotal evidence that VC fund managers share information about their portfolio firms with institutional investors and that such information could be helpful to institutional investors when investing in publicly traded stocks. We first discuss our survey evidence and then provide an example of such a connection from our sample.
A. Evidence from VC Fund Managers
We conducted telephone interviews with three VC fund managers and asked them about their communication with their institutional investors. One VC fund manager said that their quarterly reports are “administratively thorough.” The reports include the valuation of each portfolio firm at each round of funding, any write-offs, and a 1-page summary for each portfolio firm, giving a brief history of important developments. The VC fund manager stated that the firm has annual meetings: “VC firms do different things, but in their meetings, institutional investors and a lot of the entrepreneurs are included. We have panel sessions, and the institutional investors get to talk to the entrepreneurs.”
As part of the telephone interview, we requested feedback about our idea. One of the VC fund managers responded “I don’t know the data you’re working with, but a lot of our investors, that’s what they’re interested in is information that they can cherry pick” for their investments in public markets. Institutional investors are interested in being informed, so they can “see what’s coming.” This information will “drive some of their decisions in the public market.”
We supplement the telephone interviews with a small survey of VC fund managers who participated in the VC alumni symposium at Purdue University. All participants in the symposium participated in the survey, and six were managers at VC funds that manage capital for institutional investors. All VC fund managers confirmed that institutional investors learn about the nonpublicly traded firms in which the VC fund invests. The majority of VC fund managers selected quarterly reports (5/6), institutional investors sitting in investment committees (4/6), and informal gatherings of institutional investors with firms in their portfolio (4/6) as channels through which information is transmitted to institutional investors. Some of them also added channels that were not included in the survey: annual meetings with institutional investors and portfolio firms (2/6) and an institutional investor advisory committee (1/6).
Finally, we asked whether the information that institutional investors learn about portfolio firms, such as information about emerging technologies, could help institutional investors in their investment decisions in publicly traded stocks. All participants (6/6) responded “Yes.” Two of the participants elaborated: “Understanding the thesis around specific technology and competitive landscape would be a benefit.” Another mentioned that VC funds invest in companies that are 7–10 years ahead in technology compared to currently available public companies, and institutional investors can learn this information prior to the public.
Overall, our interactions with VC fund managers and survey evidence indicate that there is information sharing between VC funds and their institutional investors about nonpublicly traded firms in which VC funds invest, and that this information can be useful for institutional investors when investing in publicly traded stocks.
B. Example of Connected Investments
An example may be useful in visualizing how connections between institutional investors and industries are formed and whether information acquired from nonpublicly traded firms can be useful in investing in publicly traded stocks. Kabbage was a nonpublicly traded firm in our sample. It was an online financial technology and data company founded in 2008, which pioneered a new, automated way for small businesses to access working capital. An advantage of Kabbage’s technology was that it made credit decisions quickly compared with brick-and-mortar financial institutions that also focus on lending to small businesses. Kabbage was eventually acquired by Amex in 2020. The purported motive of Amex was to obtain access to Kabbage’s technology.Footnote 2
We argue that institutional investors who invested in the VC funds that financed Kabbage could potentially learn about Kabbage’s technology prior to other investors and could use this information to predict which financial institutions would be affected (either negatively or positively) by the technology introduced by Kabbage. The timing of the connected investment is as follows: BlueRun Ventures IV fund made an early-stage investment in Kabbage, which was classified in the industry “personal credit institutions” in March 2012. California State Teachers Retirement System (CalSTRS) is an investor in the BlueRun Ventures IV fund. Therefore, CalSTRS established a connection to “personal credit institutions” after the BlueRun Ventures IV fund invested in Kabbage. After this connection was formed, CalSTRS had connected investments in 11 firms in the personal credit institutions industry out of 68 potential firms in 2013. These connected investments outperformed the average industry return by about 1.6% per quarter in 2013. This anecdotal evidence is consistent with CalSTRS obtaining information about the personal credit institutions industry and using that information to better allocate capital within the industry. Our goal in the next section is to test whether such anecdotal evidence can be generalized across connected versus nonconnected investments and, if so, identify whether the results are due to the conjectured information flow from VC funds to institutional investors.
III. Data and Summary Statistics
A. Data Set Construction
To identify institutional investors’ connected investments, we require three sets of data: i) institutional investors’ investments in publicly traded stocks, which we obtain from Thomson Reuters Institutional (13F) Holdings and WRDS SEC Analytics Suite; ii) institutional investors’ investments in VC funds, which we obtain from Thomson One’s VentureXpert and Preqin; and iii) VC funds’ investments in nonpublicly traded firms, which we obtain from VentureXpert.
The Thomson Reuters 13F data provide quarterly information on the publicly traded stock holdings of institutional investors from 1986 to 2017. Institutional investors with publicly traded stock holdings exceeding $100 million are required to submit a 13F form to the SEC every quarter. The 13F filings include information on institutional investors’ investments in all publicly traded stocks in which the institution has investment discretion and an investment greater than $200,000 or 10,000 shares. Institutional investors’ publicly traded stock holdings through delegated asset managers are not reported in their 13F filings (Bradley, Pantzalis, and Yuan (Reference Bradley, Pantzalis and Yuan2016)). We observe institutional investors’ holdings at the end of each quarter, but we do not observe their trades or short positions. We use the Thomson Reuters data until 2012 and complement these data with WRDS SEC Analytics Suite data for 2013–2017.Footnote 3 We use quarterly investments of institutional investors in publicly traded stocks as the unit of observation.
Because many institutions have similar names, we hand-match the names of institutional investors between Thomson Reuters Institutional Holdings, VentureXpert, and Preqin. We are able to match 423 institutional investors across the data sets after consolidating institutional investors with the same parent organization as one entity.Footnote 4 Institutions in the Thomson Reuters Institutional Holdings database that do not match with VC databases are included in the study as a part of the nonconnected group. Brown, Harris, Jenkinson, Kaplan, and Robinson (Reference Brown, Harris, Jenkinson, Kaplan and Robinson2015) and Begenau, Robles Garcia, Siriwardane, and Wang (Reference Begenau, Robles-Garcia, Siriwardane and Wang2020) provide a more detailed description of the data collection process and coverage in private equity databases. These databases rely on public information, FOIA requests, and voluntarily reported data from both institutional investors (limited partners) and VC fund managers (general partners). Consequently, our coverage is more likely to be comprehensive for large public institutional investors.
We use the Private Equity Investments module in VentureXpert to identify VC funds’ investments in the stock of nonpublicly traded firms. VentureXpert gives the date of the VC fund’s initial investment, the industry of the nonpublicly traded firm, and the VC fund’s exit date. We exclude investments in which VentureXpert reports that the investment was made by an “unspecified fund” of a VC firm. Consequently, we likely overlook some connections. These omissions reduce the likelihood of finding a significant difference in returns between connected and nonconnected investments even when one exists. We end up with 2,453 VC funds and 23,692 nonpublicly traded firms in which these VC funds invest.
By combining the three data sets, we identify, each quarter, whether there is a connection between an institutional investor and an industry. The assignment of nonpublicly traded firms to specific industries is not always straightforward. For example, one can debate whether a firm with a new technology of lending capital, such as Kabbage (as discussed above), should be in “personal credit institutions” or in a technology-based industry. We use 3-digit SIC code industries from VentureXpert, which are defined by experts and easily replicable (we use 2-digit SIC codes in robustness tests). While it may be better to classify firms into industries using textual analysis, as in Hoberg and Phillips (Reference Hoberg and Phillips2010), (Reference Hoberg and Phillips2016), such information is not available for private firms. There could also be cross-industry information flow; however, our ability to map the information obtained from nonpublicly traded firms across industries is limited.
A connection is established between an institutional investor and an industry when the institution’s VC fund invests in the stock of a nonpublicly traded firm in that industry. We designate the start of a connection as the quarter in which the VC fund first invests in the stock of the nonpublicly traded firm. We rely on exit dates and exit types from VentureXpert to determine the end of a connection. If the exit type is an initial public offering (IPO), we set the exit date to the stated exit date plus 1 year because VC funds often continue to hold stock and board seats in the IPO firm until the end of the lock-up period or later (Krishnan, Ivanov, Masulis, and Singh (Reference Krishnan, Ivanov, Masulis and Singh2011)). If the exit type is a share buyback by the nonpublicly traded firm, a secondary sale, a trade sale, a write-off, or other, we use the stated exit date. If the exit date is not available in VentureXpert, we use the initial investment quarter plus 5 years as the exit date, which is the average duration of an investment in our sample. An institutional investor is connected to an industry in all quarters between and including the first investment quarter and the exit quarter. An institutional investor may be connected to an industry through multiple VC funds.
Finally, publicly traded stock data are obtained from CRSP, Compustat, and IBES. We omit stocks with a price less than $1 at the time of analysis. We use the Historical Segments data in Compustat to identify the number of segments in which a firm operates. If a firm operates in more than one industry, it is classified as diversified. We obtain data on VC-backed IPOs from Jay Ritter’s website.
We use VentureXpert’s categories, whenever available, to classify institutional investors as financial institutions, public institutions, nonfinancial corporations, private endowments, and nonprofit corporations. Public institutional investors include public pension funds, pension funds of various state employees, and public university endowments. We manually classify the institutional investors with no VC investments and whose types are missing in the database. Graph A of Figure 1 shows the frequency of observations by type of institution. Financial institutions make up 93% of the observations, and public institutions account for 5%. Graph B of Figure 1 shows the composition of institutional investor types within connected investments. Financial institutions comprise the vast majority of observations, though public institutions’ share is increased to 28.6%.
Graphs A and B of Figure 1 display the composition of institutional investors across different types of institutions. These classifications are from VentureXpert, Thomson Reuters, and hand-sorted. We manually categorized the institutional investors whose type is missing in the database. The sample is at the institution × stock × quarter level.

B. Summary Statistics
Some institutional investors specialize in stocks with certain characteristics (Gompers and Metrick (Reference Gompers and Metrick2001), Bennett, Sias, and Starks (Reference Bennett, Sias and Starks2003)). Table 1 reports the characteristics of publicly traded stocks in which institutional investors have connected investments (Panel A), stocks in which institutions have nonconnected investments (Panel B), stocks in which institutions do not invest (Panel C), and all stocks in the CRSP universe (Panel D). The table reports summary statistics of raw returns, industry-adjusted returns, the characteristics included in the Fama–French 5-factor model (Fama and French (Reference Fama and French2015)), the number of IBES analysts following the stock, and an indicator of whether the publicly traded firm is diversified.

As reported in Panels A and B of Table 1, institutional investors’ connected investments yield roughly 100 BPS per quarter industry-adjusted returns. Moreover, the industry-adjusted return in connected industries is 50 BPS higher than the industry-adjusted return in nonconnected industries. However, the characteristics of the two sets of stocks are also different. Stocks with connected investments by institutional investors exhibit larger market capitalizations, lower book-to-market ratios, higher profitability, and greater analyst following compared with stocks with nonconnected investments.
Graph A of Figure 2 shows the top 10 industries with the highest percentage of observations within connected investments. The highest are data processing services (24.1%), drugs (11.9%), and electronic components (11.6%). In contrast, as shown in Graph B of Figure 2, nonconnected investments are more diversified across industries.
Graphs A and B of Figure 2 display the top 10 3-digit SIC code industries for connected and nonconnected investments in the sample.

VC funds’ exit decisions are closely correlated with stock market valuations (Gompers et al. (Reference Gompers, Gornall, Kaplan and Strebulaev2020) and Gredil (Reference Gredil2022)). This introduces the possibility that connections change with market fluctuations. However, the average duration of a connection between an institutional investor and an industry is 26.7 quarters (or about 7 years) in the sample. This is because VC funds’ investments take a long time to be liquidated, and institutional investors could be connected to an industry through multiple VC funds. In other words, connections do not switch on and off depending on short-term market fluctuations.
Graphs A and B of Figure 3 show that the amount of funds allocated to connected investments increased dramatically from essentially nothing in 1986 to over 6 trillion USD by the end of 2017, accounting for a consequential fraction, around 18%, of institutional investors’ portfolios of publicly traded stocks.
Graphs A and B of Figure 3 display the time series of connected investments between 1986 and 2017. Graph A shows the total amount of connected investments in USD, whereas Graph B shows the USD amount of connected investments as a percentage of total investments.

IV. Returns from Connected Investments
A. Primary Specification
As a first step in addressing our conjecture that institutional investors have information about connected investments in publicly traded stocks, we examine returns to connected investments using the regressions:
 $$ {R}_{i,j,l,t+1}=\beta \times \mathrm{Connectio}{\mathrm{n}}_{j,l,t}+{\Gamma}_{\mathrm{FE}}+{\varepsilon}_{i,j,l,t+1}, $$
where $ {R}_{i,j,l,t+1} $
is the return in quarter t + 1 for stock i in industry j held by institutional investor l at the end of quarter t, and
$ {R}_{i,j,l,t+1} $
is the return in quarter t + 1 for stock i in industry j held by institutional investor l at the end of quarter t, and $ \mathrm{Connectio}{\mathrm{n}}_{j,l,t} $
denotes whether a connection exists between industry j and institution l at the end of quarter t.
$ \mathrm{Connectio}{\mathrm{n}}_{j,l,t} $
denotes whether a connection exists between industry j and institution l at the end of quarter t. $ {\Gamma}_{\mathrm{FE}} $
represents institution-quarter fixed effects, industry-quarter fixed effects, or institution-quarter and industry-quarter fixed effects as mentioned in the tables. Error terms are 2-way clustered at the institution and industry level.
$ {\Gamma}_{\mathrm{FE}} $
represents institution-quarter fixed effects, industry-quarter fixed effects, or institution-quarter and industry-quarter fixed effects as mentioned in the tables. Error terms are 2-way clustered at the institution and industry level.
To control for institutional investors’ skill, we compare an institutional investor’s returns from connected investments to the same institution’s returns from nonconnected investments in the same quarter using institution-quarter fixed effects. As discussed above and shown in Figure 2, the connected and nonconnected investments are concentrated in different industries, which may explain why institutional investors’ connected investments have higher returns. Thus, we also compare connected institutional investors’ returns with those of nonconnected institutional investors in the same industry-quarter.
As we noted, the characteristics of connected investments are different from the characteristics of nonconnected investments. To control for differences in risk that are associated with these characteristics, we use alphas with respect to the Fama–French 3-factor model (Fama and French (Reference Fama and French1993)), the Carhart 4-factor model (Carhart (Reference Carhart1997)) that includes momentum, the Fama–French 5-factor model (Fama and French (Reference Fama and French2015)), and 25 matched portfolios based on 5 sizes and 5 book-to-market classifications (Fama and French (Reference Fama and French1993)) as the dependent variable. We also use industry-adjusted returns when we use institution-quarter fixed effects to control for return differences across industries. Industry-adjusted returns are calculated by subtracting the value-weighted return of all stocks within the same 3-digit SIC industry. The quarterly alphas are calculated by regressing daily stock returns within a quarter on daily factors.
B. Primary Results
Table 2 reports the results of the regressions in equation (1). As reported in the table, regardless of whether we consider raw returns (column 1), risk-adjusted returns (columns 2–5), or industry-adjusted returns (column 6), and with no fixed effects (Panel A) or including institution-quarter (Panel B) or industry-quarter (Panel C) fixed effects or both institution-quarter and industry-quarter fixed effects (Panel D), connected investments yield significantly higher returns than nonconnected investments. For example, in Panel A, the return differences are about 44 BPS per quarter using raw returns (t-stat = 3.3) and increase up to 131 BPS per quarter (t-stat = 9.19) with Fama–French 5-factor alphas.

Within a column, the coefficients are very similar as we move from Panel A to Panel B. This result implies that the differences in returns between connected and nonconnected investments are not explained by institutional investors’ time-varying stock picking abilities or by other institution- or institution-quarter-specific omitted variables. The magnitude of the coefficients gets lower when we move from Panel A to Panels C and D; however, they remain statistically significant. Panel D is the most restrictive, where the effect of connections is identified only from those investors with both connected and nonconnected investments, and industries with both connected and nonconnected investors in a given quarter.
These results confirm that institutional investors do not outperform simply by investing in the same industries in which their VC funds invest. Institutional investors can better allocate capital within connected industries than within nonconnected industries. However, the drop in magnitudes from Panel A to Panels C and D indicates that industry timing contributes to institutional investors’ returns from connected investments.
Figure 4 shows how excess returns to connected investments vary over time. The figure displays the time-series coefficient of connection (i.e., $ \unicode{x03B2} $
, from equation (1)), with industry-quarter fixed effects, for the Fama–French 5-factor-adjusted alphas. There is no significant time trend, but the coefficient is always positive after 2005. The coefficient of connection is high during 1999, which coincides with the dot-com bubble buildup and the subsequent stock market crash. However, as we subsequently show, the results are robust to omitting this time period.
$ \unicode{x03B2} $
, from equation (1)), with industry-quarter fixed effects, for the Fama–French 5-factor-adjusted alphas. There is no significant time trend, but the coefficient is always positive after 2005. The coefficient of connection is high during 1999, which coincides with the dot-com bubble buildup and the subsequent stock market crash. However, as we subsequently show, the results are robust to omitting this time period.
Figure 4 plots the coefficient on connection for each year between 1986 and 2017 using equation (1) and Fama–French 5-factor-adjusted alpha with industry-quarter fixed effects. The blue line represents the 95% confidence interval.

For the remainder of the article, we report the raw returns and the Fama–French 5-factor-adjusted alphas, with institution-quarter or industry-quarter fixed effects. We choose to report Fama–French 5-factor-adjusted alphas in addition to raw returns because stocks in connected industries differ from stocks in nonconnected industries along the characteristics included in Fama–French 5-factors, as shown in Table 1.
C. Are the Positive Excess Returns Due to Information?
The results above are consistent with institutional investors using the information they obtain from VC funds to better allocate capital among publicly traded stocks. We have established that the higher returns for connected investments are not solely due to i) differences in stock picking abilities among institutional investors, ii) higher industry returns in connected industries compared to nonconnected industries, iii) higher risk of stocks in connected industries compared to nonconnected industries, and iv) institutional investors or VC funds timing industries.
However, there could be omitted variables at the institution-industry level that drive institutional investors’ investment in VC funds and publicly traded stocks. In such scenarios, the higher returns reported in Table 2 would not be due to information flow between VC funds and institutional investors. We use exogenous shocks to the transmission of information through connections to address such concerns. In this section, we use two quasi-natural experiments that alter the information flow between VC funds and public institutional investors. First, we use court rulings that, by requiring public institutional investors to disclose information about their private equity investments via FOIA requests, constrain information flow from VC funds to public institutions. Second, we use the staggered passage of state laws, which provided exemptions from FOIA requests for public institutional investors, as positive shocks to the transmission of information between VC funds and public institutions. We supplement these tests by showing that returns from connected investments change as we vary the institutional investors’ information advantage.
1. Court Rulings About Freedom of Information Act Requests
Institutional investors receive information from VC funds as a part of their fiduciary duty to monitor their investments. VC fund managers have an incentive to provide information to institutional investors, especially when raising follow-on funds. VC fund managers usually raise follow-on funds well before the previous funds’ performance is known with any accuracy (Barber and Yasuda (Reference Barber and Yasuda2017)), and therefore information about VC funds’ current investments is an important determinant of future fundraising success (Hochberg, Ljungqvist, and Vissing-Jørgensen (Reference Hochberg, Ljungqvist and Vissing-Jørgensen2014)) and constitutes a substantial portion of VC fund managers’ expected future earnings (Chung et al. (Reference Chung, Sensoy, Stern and Weisbach2012)).
Prior to 2002, VC fund managers were not overly concerned with institutional investors leaking information that the VC fund managers considered to be private. Institutional investors have no apparent incentive to leak information, and VC funds often ask institutions to sign nondisclosure agreements to mitigate leakage risk. However, several court rulings at the end of 2002 and the beginning of 2003 required public institutional investors to disclose detailed information about their private equity investments in response to FOIA requests. Even a nondisclosure agreement does not protect written information from a FOIA request. The requested information varied greatly, from measures of investment performance, such as a VC fund’s internal rate of return, to information on individual nonpublicly traded firms in a VC fund’s portfolio (Hurdle (Reference Hurdle2005)).
The rulings greatly increased uncertainty about the information that may have to be disclosed (Hurdle (Reference Hurdle2005), Abuzov et al. (Reference Abuzov, Gornall and Strebulaev2025)). The broad interpretation of FOIA laws by judges meant that there was a risk of disclosure of all written communications between a VC fund and public institutional investors, including e-mails, quarterly reports, and annual reports (Hurdle (Reference Hurdle2005)). While not every state had an FOIA court ruling, judges often adopt the reasoning from rulings in other states (Posner and Sunstein (Reference Posner and Sunstein2006)), especially when the statutes are similar (as is the case with FOIA laws). Thus, we can reasonably assume that the uncertainty about information that can be requested increased abruptly for all public institutional investors in all states. Anecdotal evidence and media reports indicate that VC funds became reluctant to share information with public institutional investors after these court rulings.
We use the court rulings as an exogenous shock to the transmission of information from VC funds to public institutional investors. After the court rulings, we expect public institutional investors to receive less information from their VC funds. We use the time period from the third quarter of 2002 to the fourth quarter of 2004 as the treatment window (after this date, some states began to pass counteracting laws, as discussed below) and the first quarter of 2000 to the second quarter of 2002 as the pre-treatment window. The control group comprises private institutional investors.
We conduct difference-in-differences tests using the sample of connected stocks. This rules out alternative explanations in which information transmission between institutional investors and VC funds does not play any role. For example, institutional investors may hire experts and/or allocate resources to select investments in a specific industry. These experts may pick both publicly traded stocks and VC funds in the same industry, generating both connected industries and higher returns from connected investments. In addition, this test rules out the possibility that information events that correlate with returns of stocks in connected industries explain our results, such as years with more technology IPOs or the dot-com bubble and its subsequent burst.
Figure 5 shows the coefficient on the connection of the public (treated) institutional investors relative to that of private (control) institutional investors within an industry using Fama–French 5-factor-adjusted alphas over time. The figure plots $ {\unicode{x03B2}}_1 $
from the following regression for each quarter for the sample of connected institutions:
$ {\unicode{x03B2}}_1 $
from the following regression for each quarter for the sample of connected institutions:
 $$ {R}_{i,j,l,t+1}={\unicode{x03B2}}_1{\mathrm{Treated}}_l+{\Gamma}_{\mathrm{FE}}+{\varepsilon}_{i,j,l,t+1}, $$
where $ {\Gamma}_{\mathrm{FE}} $
is the industry fixed effect. The figure illustrates three points. First, average quarterly returns for the treated group and the control group are similar prior to the event. Second, prior to the event, there does not appear to be any time trend. Third, after the event, the return of the treated group drops sharply relative to the control group. Next, we use the following regression specification to test whether the difference-in-differences is significant:
$ {\Gamma}_{\mathrm{FE}} $
is the industry fixed effect. The figure illustrates three points. First, average quarterly returns for the treated group and the control group are similar prior to the event. Second, prior to the event, there does not appear to be any time trend. Third, after the event, the return of the treated group drops sharply relative to the control group. Next, we use the following regression specification to test whether the difference-in-differences is significant:
 $$ {R}_{i,j,l,t+1}={\unicode{x03B2}}_1\mathrm{Pos}{\mathrm{t}}_t\times {\mathrm{Treated}}_l+{\unicode{x03B2}}_2{\mathrm{Treated}}_l+{\unicode{x03B2}}_3\mathrm{Pos}{\mathrm{t}}_t+{\Gamma}_{\mathrm{FE}}+{\varepsilon}_{i,j,l,t+1}. $$
Figure 5 shows the coefficient $ {\unicode{x03B2}}_1 $
estimated using the equation
$ {\unicode{x03B2}}_1 $
estimated using the equation
 $$ {R}_{i,j,l,t+1}={\unicode{x03B2}}_1{\mathrm{Treated}}_l+{\Gamma}_{\mathrm{FE}}+{\unicode{x025B}}_{i,j,l,t+1} $$
for the connected sample and the Fama–French 5-factor-adjusted alphas in each quarter. It measures the alpha from the connection of the treated (public) institutional investors relative to that of private institutional investors within an industry. The treated group includes all public institutional investors, whereas the control group includes all private institutional investors. The red vertical line represents the third quarter of 2002. The blue vertical lines represent the 95% confidence interval.

The variable, $ \mathrm{Pos}{\mathrm{t}}_t $
, is set to 1 for the treatment time window, and
$ \mathrm{Pos}{\mathrm{t}}_t $
, is set to 1 for the treatment time window, and $ \mathrm{Treate}{\mathrm{d}}_l $
is a dummy variable that is set to 1 for public institutional investors. Notation for the other variables is the same as in equation (1). The coefficient of the interaction term
$ \mathrm{Treate}{\mathrm{d}}_l $
is a dummy variable that is set to 1 for public institutional investors. Notation for the other variables is the same as in equation (1). The coefficient of the interaction term $ \mathrm{Pos}{\mathrm{t}}_t\times {\mathrm{Treated}}_l $
measures whether public (treated) institutional investors’ returns from connected investments change after the treatment relative to the returns of private (control) institutional investors’ connected investments.Footnote 5 If the VC fund managers limit information sharing with public institutional investors, we expect the coefficient of the interaction term
$ \mathrm{Pos}{\mathrm{t}}_t\times {\mathrm{Treated}}_l $
measures whether public (treated) institutional investors’ returns from connected investments change after the treatment relative to the returns of private (control) institutional investors’ connected investments.Footnote 5 If the VC fund managers limit information sharing with public institutional investors, we expect the coefficient of the interaction term $ \mathrm{Pos}{\mathrm{t}}_t\times {\mathrm{Treated}}_l $
to be negative and significant, which is confirmed by columns 1–4 of Panel A of Table 3. For example, column 4 (which controls for industry-quarter fixed effects) reports that public institutional investors’ returns from connected investments drop about 130 BPS per quarter (t-stat = −4.05) relative to the private institutional investors’ returns from connected investments.
$ \mathrm{Pos}{\mathrm{t}}_t\times {\mathrm{Treated}}_l $
to be negative and significant, which is confirmed by columns 1–4 of Panel A of Table 3. For example, column 4 (which controls for industry-quarter fixed effects) reports that public institutional investors’ returns from connected investments drop about 130 BPS per quarter (t-stat = −4.05) relative to the private institutional investors’ returns from connected investments.

Next, we introduce a triple-differences design that takes into account that the event window may coincide with another shock that may differently affect the investment performance of public institutional investors relative to private institutional investors. We do so by controlling for the change in institutional investors’ returns from their nonconnected investments around the event, and using a triple interaction term among treated, connected, and post. This test also rules out the possibility that state court rulings affected information flow from all sources to public institutional investors, which would lead to lower returns for both connected and nonconnected investments. Finally, controlling for the returns from nonconnected stocks also rules out the possibility that the FOIA requests against public institutional investors created attention constraints for these institutions, which would reduce their returns from both connected and nonconnected investments. We estimate the triple-differences tests:
 $$ {\displaystyle \begin{array}{c}{R}_{i,j,l,t+1}={\unicode{x03B2}}_1\mathrm{Connectio}{\mathrm{n}}_{j,l,t}+{\unicode{x03B2}}_2{\mathrm{Treated}}_l+{\unicode{x03B2}}_3\mathrm{Pos}{\mathrm{t}}_t\times {\mathrm{Treated}}_l+\\ {}\hskip7.5em {\unicode{x03B2}}_4\mathrm{Connectio}{\mathrm{n}}_{j,l,t}\times \mathrm{Pos}{\mathrm{t}}_t+{\unicode{x03B2}}_5\mathrm{Connectio}{\mathrm{n}}_{j,l,t}\times \mathrm{Treate}{\mathrm{d}}_l\\ {}\hskip7em +{\unicode{x03B2}}_6\mathrm{Connectio}{\mathrm{n}}_{j,l,t}\times \mathrm{Pos}{\mathrm{t}}_t\times \mathrm{Treate}{\mathrm{d}}_l+{\Gamma}_{\mathrm{FE}}+{\varepsilon}_{i,j,l,t+1}.\end{array}} $$
Columns 5–8 of Panel A of Table 3 report that the coefficient of the triple interaction term, $ \mathrm{Connectio}{\mathrm{n}}_{j,l,t}\times \mathrm{Pos}{\mathrm{t}}_t\times \mathrm{Treate}{\mathrm{d}}_l $
, is always negative and large, ranging from 25 to 200 BPS per quarter. The triple interaction term is also statistically significant with Fama–French 5-factor-adjusted alphas with institution and year fixed effects (t-stat = −3.21) and industry-quarter fixed effects (t-stat = −2.95) but not when we use raw returns. These results show that, on average, treated institutions’ connected investments perform 59.4 BPS (t-stat = −2.55) lower than private institutions’ connected investments in the post-FOIA period. Moreover, treated institutions’ connected investments do not outperform their own nonconnected investments in the post-FOIA period.
$ \mathrm{Connectio}{\mathrm{n}}_{j,l,t}\times \mathrm{Pos}{\mathrm{t}}_t\times \mathrm{Treate}{\mathrm{d}}_l $
, is always negative and large, ranging from 25 to 200 BPS per quarter. The triple interaction term is also statistically significant with Fama–French 5-factor-adjusted alphas with institution and year fixed effects (t-stat = −3.21) and industry-quarter fixed effects (t-stat = −2.95) but not when we use raw returns. These results show that, on average, treated institutions’ connected investments perform 59.4 BPS (t-stat = −2.55) lower than private institutions’ connected investments in the post-FOIA period. Moreover, treated institutions’ connected investments do not outperform their own nonconnected investments in the post-FOIA period.
2. Robustness Tests for FOIA Shock
Abuzov et al. (Reference Abuzov, Gornall and Strebulaev2025) find that the formation of new connections between public institutional investors and top-performing VC firms was severely limited following the court rulings. This creates an endogenous change in connections around the event time. For instance, the majority of new connections formed by public institutions might involve smaller and younger VC funds, and if these funds are not strong sources of information, changes in the type of connection could explain our results. However, this would still align with our argument that institutions access information through their connections. Nevertheless, it remains important to determine whether the results are due to changes in the nature of the connections or a reduction in information sharing within existing connections.
To address this question, we conduct five robustness tests. First, we repeat our analysis using only stable connections that persisted throughout the event window in Panel B of Table 3. Since the termination of existing funds takes time, many connections established before the event remained intact during this period. Second, we repeat our analysis using only institutions whose average number of VC funds they invested in did not decrease between the pre-period and the post-period in Panel C of Table 3. The results in Panels B and C closely mirror those in Panel A, indicating that information sharing between treated institutions and VC funds declines even among persistent connections and institutions that do not experience a reduction in the number of VC fund investments.
Third, we exclude connections through the top 20 best-performing VC firms, as identified by Abuzov et al. (Reference Abuzov, Gornall and Strebulaev2025), because some of these VC funds may have severed ties with public institutional investors. Fourth, we fix the connection status of institutions to industries as of the FOIA rulings and keep this status unchanged throughout the event window. Fifth, we exclude institutions whose total number of connected industries decreases by 15% or more between the pre-period and the post-period. These tests produce results similar to those in our main analysis. For brevity, the results for these last three robustness tests are not presented in a table (available from the authors).
3. State Law Changes to FOIA That Restored Information Flow
After a strong reaction from VC fund managers and institutional investors to the court cases broadening the interpretation of FOIA laws, several states passed laws providing exemptions from FOIA requests for public institutional investors.Footnote 6 For example, the amended law in California stipulates that public institutional investors are not required to disclose i) due diligence materials, ii) quarterly and annual financial statements of VC funds, iii) investment agreements and related documents, iv) information about nonpublicly traded firms in a VC fund’s portfolio, v) capital calls and distribution notices, and vi) partnership agreements.Footnote 7 The details of these exemptions vary across states. The full list of the states that passed laws providing exemptions and their dates is provided in the Supplementary Material.
Although none of the new laws protected against the disclosure of all information, these laws greatly reduced uncertainty about what information is subject to disclosure. Therefore, we expect information flow between VC funds and public institutional investors to be partially restored after the passage of state laws that provide exemptions from FOIA requests for public institutional investors’ investments in private equity. VC fund managers and institutional investors lobbied for the passage of these laws, making their enactment highly expected and potentially endogenous. Keeping these issues in mind, we use the staggered passage of these state laws as positive shocks to the flow of information between VC funds and public institutional investors in those states. The staggered passage of state laws, where the timing of events varies across states, rules out the possibility that another event coinciding with our experiment affects connected investments of public and private firms differently, thus explaining the results.
We use a stacked difference-in-differences regression because the common way of staggered difference-in-differences regressions with 2-way fixed effects can produce biased results (Cengiz, Dube, Lindner, and Zipperer (Reference Cengiz, Dube, Lindner and Zipperer2019), Goodman-Bacon (Reference Goodman-Bacon2021), and Baker, Larcker, and Wang (Reference Baker, Larcker and Wang2022)). Public institutional investors in states that changed FOIA laws to provide materially important exemptions from FOIA requests for public institutional investors are treated institutions. We test whether the public (treated) institutional investors’ returns from their connected investments increase after the passage of these laws relative to the control groups’ returns from their connected investments. The control group consists of public institutional investors in states that did not pass laws providing exemptions from FOIA requests, as well as all private institutional investors in our sample. An advantage of our sample is that there is a large number of control observations even within the states that pass regulations, because connected investments of private institutional investors are not treated. We stack all event-specific data sets and use the following regression specification:
 $$ {R}_{i,j,l,t+1}=\unicode{x03B2} \times \mathrm{Treate}{\mathrm{d}}_{l,s}\times {\mathrm{Post}}_t+{\Gamma}_{\mathrm{FE}}+{\varepsilon}_{i,j,l,t+1}. $$
The pre- and post-periods are defined relative to each event. The explanatory variable, $ \mathrm{Pos}{\mathrm{t}}_t $
, is set to 1 for the public institutional investors that are headquartered in state s after the state enacts regulations providing exemptions from FOIA requests and the corresponding control group.
$ \mathrm{Pos}{\mathrm{t}}_t $
, is set to 1 for the public institutional investors that are headquartered in state s after the state enacts regulations providing exemptions from FOIA requests and the corresponding control group. $ \mathrm{Treate}{\mathrm{d}}_{l,s} $
is a dummy variable that is set to 1 if the institutional investor is a public institution in state s that enacts the exemption, and 0 otherwise. The coefficient
$ \mathrm{Treate}{\mathrm{d}}_{l,s} $
is a dummy variable that is set to 1 if the institutional investor is a public institution in state s that enacts the exemption, and 0 otherwise. The coefficient $ \unicode{x03B2} $
measures whether public institutional investors’ returns from connected investments increase after the state passes regulations providing exemptions from FOIA requests relative to connected investments of the control group of all private institutional investors and public institutional investors in states that did not provide FOIA exemptions for public institutions.
$ \unicode{x03B2} $
measures whether public institutional investors’ returns from connected investments increase after the state passes regulations providing exemptions from FOIA requests relative to connected investments of the control group of all private institutional investors and public institutional investors in states that did not provide FOIA exemptions for public institutions.
Table 4 reports the results. The coefficient of $ \mathrm{Treate}{\mathrm{d}}_{l,s}\times {\mathrm{Post}}_t $
is always positive and statistically significant, ranging between 29 (t-stat = 2.13) and 54 (t-stat = 4.72) BPS per quarter. The magnitudes of the coefficients are comparable to but slightly lower than those of the first experiment. Perhaps this result is not surprising, given that these events may have only partially restored information flow and that these events were expected. The evidence is consistent with the revival of information flow from VC funds to public institutional investors after the states provide FOIA exemptions for public institutions. These tests, based on FOIA rulings and state laws, allow us to establish that the information flow from VC funds to institutional investors explains why these institutions do better in their investments in connected industries.
$ \mathrm{Treate}{\mathrm{d}}_{l,s}\times {\mathrm{Post}}_t $
is always positive and statistically significant, ranging between 29 (t-stat = 2.13) and 54 (t-stat = 4.72) BPS per quarter. The magnitudes of the coefficients are comparable to but slightly lower than those of the first experiment. Perhaps this result is not surprising, given that these events may have only partially restored information flow and that these events were expected. The evidence is consistent with the revival of information flow from VC funds to public institutional investors after the states provide FOIA exemptions for public institutions. These tests, based on FOIA rulings and state laws, allow us to establish that the information flow from VC funds to institutional investors explains why these institutions do better in their investments in connected industries.

D. Variation in Institutional Investors’ Information Advantage
Our results are consistent with institutional investors’ outperformance in connected investments stemming from an information advantage. Next, we show that this outperformance varies based on differences in the information advantage of institutional investors in connected investments.
1. VC Specialization
The quantity and/or quality of information that institutional investors obtain from a VC fund may vary with the industry specialization of the VC fund. If the VC fund is specialized in an industry, presumably, the VC fund will have better information about the industry and, potentially, could pass along better information to its institutional investors. We create an indicator variable, Specialized VC, that is set to 1 if the institutional investor’s VC fund belongs to a VC firm that has more than 50% of its investments, as of that quarter, in an industry. If at least one connection of the institutional investor is through a fund of a specialized VC firm, the variable Specialized VC is set to 1. We interact Specialized VC with Connection in the main regression specification.
Columns 1 and 2 of Table 5 display the results. The coefficient for the interaction term Connection × Specialized VC is 39 BPS when we use institution-quarter fixed effects (Panel A) and is statistically significant (t-stat = 2.10). The same coefficient is 9 BPS in raw returns with industry-quarter fixed effects (Panel B) and is statistically significant (t-stat = 5.05). The coefficients of the interaction terms are similar when we use Fama–French 5-factor-adjusted alphas instead of raw returns with both sets of fixed effects, but the coefficients are not statistically significant. Thus, there is some evidence that institutional investors’ returns from their connected investments are higher when they have access to information through a specialized VC fund.

2. Variation in Publicly Available Information Across Stocks
Institutional investors may have better information relative to other market participants in their connected investments when there is less publicly available information about these publicly traded stocks. We examine whether returns to connected investments vary with proxies of publicly available information. We use the number of IBES analysts covering a stock and the market capitalization of the stock as proxies for publicly available information about the stock.
Columns 3 and 4 of Table 5 report the coefficient of the interaction term of Connection and the logarithm of 1 plus the number of analysts following the publicly traded stock. When institution-quarter fixed effects are used (Panel A), the interaction coefficient is −0.27 (t-stat = −4.17). When industry-quarter fixed effects are used (Panel B), the interaction coefficient is −0.17 (t-stat = −3.48), implying that as the number of analysts following stocks increases, institutional investors’ excess returns from connected investments decrease. However, when we use Fama–French 5-factor-adjusted alphas, the interaction coefficient is not statistically significant.
Columns 5 and 6 of Table 5 designate firms as Small if they are below the 30th percentile in terms of market capitalization of all firms in the CRSP universe in that quarter. The coefficient of the interaction term of Small and Connection is always positive and statistically significant in all columns, ranging from 1.28% to 1.82% per quarter higher returns. These results suggest that institutional investors receive higher returns from their investments in small stocks.
In sum, across the three tests, we find evidence that institutional investors’ returns from connected investments are higher when they invest in stocks that have less publicly available information.
3. Relevance of Information
Excess returns from connected investments should be higher if the information obtained through the VC fund is more relevant to the publicly traded stock. Industry-specific information may have limited usefulness in allocating capital to diversified publicly traded stocks. In columns 1–4 of Table 6, we use the indicator variable Diversified to designate firms with publicly traded stocks that operate in more than one 3-digit SIC code industry in the Compustat Segments data. The coefficient of the interaction term of Diversified with Connection is always negative, large in economic magnitude (varies between 0.31 and 0.63), and statistically significant. That is, when the information obtained through the VC funds is not a good match, the outperformance of institutional investors in their connected investments declines.

4. Times When More Information Is Revealed to the Market
Institutional investors should not realize higher returns based on their private information until their private information is eventually incorporated into the publicly traded stock prices. This implies that institutional investors should earn higher returns from their connected investments during periods of high information incorporation into stock prices. We follow Ozsoylev, Walden, Yavuz, and Bildik (Reference Ozsoylev, Walden, Yavuz and Bildik2014) and use quarters with extreme price movements as periods of high information incorporation into stock prices.
Columns 5–8 of Table 6 repeat our main analysis limited to the top and bottom 25th percentiles of publicly traded stocks by return performance during the quarter. This test has an inherent look-ahead bias. Our goal is limited to understanding whether returns to institutional investors’ connected investments are higher during high information incorporation periods. We find that the excess return to connected investments is always higher than the corresponding return in the overall sample. These differences are only economically significant in specifications that compare the same institution’s connected investments to its nonconnected investments. For example, the excess return from connected investments is 2.56%–3.43% per quarter (t-stat = 6.4–7.9), as reported in columns 5–6. In summary, there is some evidence that institutional investors earn higher returns from their connected investments during periods of high information incorporation.
V. Robustness Tests and Alternative Specifications
A. Robustness Tests
The robustness tests in Table 7 replicate the regressions in Panels B and C of Table 2 after various changes to the methodology or sample. Columns 1 and 2 of Table 7 report that the results are robust to changes in the starting and ending quarters of a connection. We first include a 1-year buffer period between the VC funds’ investments in the industry and the quarter in which the institutional investors’ connection to the industry begins. In column 2, we change the end dates of connections for investments without exit dates from 5 to 7 years after the initial investment.

Next, we examine whether the role of the VC fund within the syndicate affects our results. Columns 3 and 4 of Table 7 analyze connections through lead VC funds (defined as those with the largest share of investment in the first round) and nonlead VC funds, respectively. We hypothesize that connections with lead VC funds would yield higher returns for connected investments, as lead VCs are likely to have superior information access. While returns on connected investments through lead VC funds are slightly higher than those through nonlead VC funds, the difference is not statistically significant. We acknowledge that this could be an ex post rationalization; however, noise in identifying lead VCs may bias the observed differences downward. Our data do not explicitly identify the lead VC fund. Instead, we use the dollar amount of each VC’s investment in specific companies to estimate lead VC funds, but this information is missing for a large portion of observations. This limitation introduces noise into our identification of lead VC funds and may contribute to the muted difference in returns between lead and nonlead connected investments.
We investigate whether our findings differ for the biotech industry (SIC codes 283, 873, and 512 as defined by Thakor, Anaya, Zhang, Vilanilam, Siah, Wong, and Lo (Reference Thakor, Anaya, Zhang, Vilanilam, Siah, Wong and Lo2017) and SIC code 284), where VC investments are prevalent. Innovation is crucial for a firm’s success in the biotech industry and, thus, makes information on new breakthroughs particularly valuable for institutional investors when selecting high-performing stocks. In columns 5 and 6 of Table 7, we present results for the biotech industry alone and after excluding the biotech industry, respectively. Our analysis indicates that the coefficient for the connection dummy is larger within the biotech industry as expected, regardless of whether we apply industry-quarter or institution-quarter fixed effects.
We also test whether the results are robust to excluding certain industries, institutions, stocks, or time periods. Table 7 displays results after excluding highly regulated industries (column 7), the data processing industry (column 8), institutions that never invest in VC firms (column 9), and the 1999–2000 period (column 10). The results for Fama–French 5-factor alphas are robust, with the exception of column 9 of Panel D, when we exclude institutions that do not invest in VC funds and control for industry-quarter fixed effects. Further analysis reveals that excluding institutions with no VC investments has two effects. First, it increases the fraction of connected investments within some industries to be the large majority, which weighs against finding differences when including industry fixed effects. Second, focusing on institutions with VC investments makes the treated and control groups more homogeneous but also increases the importance of precisely identifying the timing of connections. The statistical significance of the results is restored (available from the authors) when we drop industry-quarters where more than 65% of investments are connected or when we focus on time periods in which we are more certain that there is a connection where the institutional investor obtains information (shortening the window of connection by 12 months from both ends).
Ozmel et al. (Reference Ozmel, Trombley and Yavuz2019) show that limited partners earn higher returns when investing in newly listed stocks backed by their VC funds. These investments may appear in our sample as either connected or nonconnected (if the connection to the industry ends with the IPO). Although such cases could potentially contaminate our results, we find that investments in IPO stocks to which institutions were previously connected through their investments in VC funds represent a small fraction of connected investments in other stocks (14,764 vs. 2,404,979). In unreported results, we find that investments in IPO stocks to which institutions were previously connected yield significantly higher excess returns than other connected investments. However, these investments are rare and do not materially influence the aggregate results. Column 11 of Table 7 confirms that the results remain unchanged after excluding all investments in publicly traded firms to which institutions were previously connected.Footnote 8
Finally, column 12 demonstrates that our findings are robust to defining industries at the SIC-2 level instead of SIC-3.
In Table 8, we check whether there is variation in the results across institutional investor types and size categories. We label institutional investors as small (<30th percentile), medium, or large (>70th percentile) based on their assets under management. There is some variation in the results across different types of institutions. We find that connected investments made by financial institutions and public institutions perform better across all specifications, and these institutions account for approximately 97% of our sample. While connected investments by Private Endowments outperform their nonconnected counterparts, this is not the case in specifications where industry-quarter fixed effects are controlled. The connection coefficient for nonfinancial corporations is consistently positive but often lacks statistical significance. These results suggest that financial and public institutions are best suited to use the information provided by their VC funds.

Results also vary by institution size, though the pattern is not always monotonic. The connection coefficient is consistently statistically significant for large institutional investors. Among smaller institutions, the coefficient tends to be the largest in magnitude and is often significant, except in the specification with raw returns and institution-quarter fixed effects. These results are not driven by outliers. Further analysis shows that the nonconnected investments of small institutions underperform those of large institutions, whereas their connected investments yield returns comparable to the connected investments of large institutions. These findings are consistent with the view that small institutions, having fewer alternative sources of information, benefit more from the informational content of the connections we measure. For medium-sized institutions, the results are significant only when using Fama–French 5-factor-adjusted returns and controlling for institution-quarter fixed effects.
B. Allocation to Connected Investments
In this section, we evaluate institutional investors’ portfolio allocations to connected industries. Institutional investors that have at least one connected industry allocate 2.6 times more of their portfolio to a connected industry (mean allocation is 2.04%) than to a nonconnected industry (mean allocation is 0.78%). However, larger allocations may not be due to connections. We investigate institutional investors’ percentage portfolio allocations to connected industries when connections are initiated or terminated.
We again use a stacked differences-in-differences regression estimator. We compare each institutional investor and connected industry pair (treated) from 4 quarters before a connection is initiated (terminated) to 4 quarters after the connection is initiated (terminated) to all other institutional investors and industry pairs (control) over that time interval. We create clean controls within the treatment window for each event – we only use institutional investors that are never connected to an industry but invest in publicly traded stocks in that industry within the sample as controls (Cengiz et al. (Reference Cengiz, Dube, Lindner and Zipperer2019)). We estimate the regression specifications:
 $$ \%{\mathrm{Holding}}_{j,l,t}=\unicode{x03B2} \times \mathrm{Change}\ \mathrm{in}\ \mathrm{connectio}{\mathrm{n}}_{j,l}\times {\mathrm{Post}}_t+{\Gamma}_{\mathrm{FE}}+{\varepsilon}_{j,l,t}, $$
where $ \%{\mathrm{Holding}}_{j,l,t} $
is the institutional investor
$ \%{\mathrm{Holding}}_{j,l,t} $
is the institutional investor $ l $
’s portfolio weight of industry j in quarter t. We estimate two separate regressions for connection initiation and termination. The explanatory variable,
$ l $
’s portfolio weight of industry j in quarter t. We estimate two separate regressions for connection initiation and termination. The explanatory variable, $ \mathrm{Pos}{\mathrm{t}}_t $
, is set to 1 for the institutional investor l when a connection to industry j is initiated (terminated) at time t and for all institutional investors and industry pairs in the control group.
$ \mathrm{Pos}{\mathrm{t}}_t $
, is set to 1 for the institutional investor l when a connection to industry j is initiated (terminated) at time t and for all institutional investors and industry pairs in the control group. $ \mathrm{Change}\ \mathrm{in}\ \mathrm{connectio}{\mathrm{n}}_{j,l} $
is a dummy variable that is set to 1 for institutional investor and connected industry pairs when a connection is initiated or terminated.
$ \mathrm{Change}\ \mathrm{in}\ \mathrm{connectio}{\mathrm{n}}_{j,l} $
is a dummy variable that is set to 1 for institutional investor and connected industry pairs when a connection is initiated or terminated. $ {\Gamma}_{\mathrm{FE}} $
represents the institution and quarter fixed effect or industry-quarter fixed effect. The coefficient
$ {\Gamma}_{\mathrm{FE}} $
represents the institution and quarter fixed effect or industry-quarter fixed effect. The coefficient $ \unicode{x03B2} $
measures whether institutional investors’ portfolio weights of connected industries increase (decrease) after initiation (termination) of a connection, compared to the portfolio allocations of institutions that are never connected to that industry. There is a statistically significant increase in investments in the industry equivalent to 0.072% (t-stat = 1.72) of an institutional investor’s portfolio after a connection is initiated, as compared to institutions that are not connected to the industry in that quarter. Given the sample mean of an average portfolio allocation of 0.78% for nonconnected industries, this translates to approximately a 10% increase in portfolio allocation in the first 4 quarters after a connection is initiated. We also find a statistically insignificant 0.0089% decrease in portfolio allocation to an industry after a connection is terminated. These findings are consistent with institutional investors allocating a higher percentage of their portfolio to industries in which they have an information advantage.
$ \unicode{x03B2} $
measures whether institutional investors’ portfolio weights of connected industries increase (decrease) after initiation (termination) of a connection, compared to the portfolio allocations of institutions that are never connected to that industry. There is a statistically significant increase in investments in the industry equivalent to 0.072% (t-stat = 1.72) of an institutional investor’s portfolio after a connection is initiated, as compared to institutions that are not connected to the industry in that quarter. Given the sample mean of an average portfolio allocation of 0.78% for nonconnected industries, this translates to approximately a 10% increase in portfolio allocation in the first 4 quarters after a connection is initiated. We also find a statistically insignificant 0.0089% decrease in portfolio allocation to an industry after a connection is terminated. These findings are consistent with institutional investors allocating a higher percentage of their portfolio to industries in which they have an information advantage.
A more precise prediction of an information advantage would be that institutional investors overinvest when they have positive information and underinvest when they have negative information about publicly traded stocks. To evaluate this possibility, we use institutional investors’ portfolio weights of publicly traded stocks relative to the industry benchmark to identify stocks that institutions over- or under-weight in their portfolios. We present this analysis with a number of caveats. First, as shown in the summary statistics, only a small minority of stocks are invested in by any individual institutional investor, and the choice to avoid investing is not always because the institution has negative information about these stocks. Second, institutional investors are not required to report their short positions in 13F filings. Thus, we do not observe all investment positions in response to negative information. We calculate over-/under-weighted returns (OU-weighted returns) using the formula:
 $$ \mathrm{OU}\_\mathrm{weighted}\_{\mathrm{returns}}_{i,j,l,t+1}={R}_{i,t+1}\times \left({w}_{i,j,l,t}-{w}_{i,j,t}\right), $$
where $ {w}_{i,j,l,t} $
is the weight of the publicly traded stock
$ {w}_{i,j,l,t} $
is the weight of the publicly traded stock $ i $
in the institutional investor
$ i $
in the institutional investor $ l $
’s portfolio in quarter t, calculated as the institution’s dollar holdings of the stock i divided by the institution’s total dollar investment in all stocks in industry j in quarter t. When the institutional investor does not hold a stock,
$ l $
’s portfolio in quarter t, calculated as the institution’s dollar holdings of the stock i divided by the institution’s total dollar investment in all stocks in industry j in quarter t. When the institutional investor does not hold a stock, $ {w}_{i,j,l,t}=0 $
. The weight of the stock in the industry is denoted by
$ {w}_{i,j,l,t}=0 $
. The weight of the stock in the industry is denoted by $ {w}_{i,j,t} $
, which is the market value of stock i divided by the total market value of all stocks in industry j in quarter t. We multiply the future stock returns by the difference in weights, which we label as OU-weighted returns. We regress raw or risk-adjusted OU-weighted returns on the connection dummy:
$ {w}_{i,j,t} $
, which is the market value of stock i divided by the total market value of all stocks in industry j in quarter t. We multiply the future stock returns by the difference in weights, which we label as OU-weighted returns. We regress raw or risk-adjusted OU-weighted returns on the connection dummy:
 $$ \mathrm{OU}\_\mathrm{weighted}\_{\mathrm{returns}}_{i,j,l,t+1}=\unicode{x03B2} \times \mathrm{Connectio}{\mathrm{n}}_{j,l,t}+{\Gamma}_{\mathrm{FE}}+{\varepsilon}_{i,j,l,t+1}. $$
The coefficient of connection captures the weighted difference in the returns of over-weighted and under-weighted stocks within the connected investments versus the same difference within nonconnected investments. Note that the coefficient $ \unicode{x03B2} $
in these regressions does not directly translate into return differences because the returns on the left-hand side are multiplied by differences in weights
$ \unicode{x03B2} $
in these regressions does not directly translate into return differences because the returns on the left-hand side are multiplied by differences in weights $ \left({w}_{i,j,l,t}-{w}_{i,j,t}\right). $
Panel A of Table 9 reports the results. Connected investments have significantly higher OU-weighted returns across all regression specifications. In sum, once institutional investors become connected to an industry, they tend to increase their portfolio allocations to it, and their decisions to over- or under-weight individual stocks within these connected industries better predict returns compared to nonconnected industries.
$ \left({w}_{i,j,l,t}-{w}_{i,j,t}\right). $
Panel A of Table 9 reports the results. Connected investments have significantly higher OU-weighted returns across all regression specifications. In sum, once institutional investors become connected to an industry, they tend to increase their portfolio allocations to it, and their decisions to over- or under-weight individual stocks within these connected industries better predict returns compared to nonconnected industries.

C. Termination of Connections Through IPOs
Institutions’ information advantage relative to other investors should disappear when institutions lose their connections to an industry because the nonpublicly traded firms that they are connected to through their VC funds become publicly traded.
To test this proposition, we identify all institutions with a lost connection due to a firm undergoing an IPO. Institutions are often connected to industries through multiple firms or VC funds, and an IPO of a connected firm does not always sever these ties. However, in our sample, we identify 339 instances where the connection was terminated following an IPO.
The average raw returns on these institutions’ connected investments are 4.09% for the quarter prior to the termination of the connection, but this drops to 1.26% for the quarter after the connection was lost through the IPO. These summary statistics suggest that investment returns tend to decline once the connection is severed. However, it is well known that IPOs often follow periods of high returns, raising the possibility that market timing could explain some of the return differences after the connection is lost. To address this, we replicate our regression analysis using this sample. That is, we compare the investment performance of these institutions in industries where they had a prior connection to nonconnected investments in the same industry or the same institutions’ nonconnected investments in other industries.
Panel B of Table 9 presents the performance of institutional investments in industries where their prior connections were recently terminated due to IPOs. Across all specifications, returns from industries where the institution had a prior connection are not significantly different from returns of the investments in the same industry made by institutions that are nonconnected and from investments of the same institutions in other nonconnected industries.
This test serves as a falsification test, supporting the proposition that our findings are likely due to information flow through institutions’ connections to industries through their VC investments in those industries.
D. Stock-Level Analyses
A different way of testing our conjecture that institutional investors have an information advantage in allocating capital in connected industries is to examine whether publicly traded stocks that attract relatively more connected investments have higher returns. The test is useful for two reasons. First, aggregating institutional investors’ information at the stock level may reduce the inherent noise in the information that each institution obtains from its VC funds. Second, stock-quarter level observations significantly shrink the sample size and can be used as a robustness test of the statistical significance of the main results.
For the stocks in which connected institutions invest, we create a variable that measures the ratio of the number of institutional investors that made connected investments in the stock to the total number of institutional investors that invested in the stock. Normalizing by the total number of institutional investors that invested in the stock controls for institutions being more likely to invest in certain stocks. We sort stocks within an industry into two groups based on the median ratio within each industry. Stocks with higher-than-median levels of connected investments yield a higher Fama–French 5-factor alpha of 0.69% per quarter relative to stocks within the same industry that attract lower than median investments, as reported in column 2 of Table 10, but the difference is not statistically significant (t-stat = 0.268).

In columns 3–6, we separate industries with higher variation in connected investments from industries with lower such variation. In other words, we sort industries based on whether the difference in the ratio of connected investments between the high and low groups of stocks is above median versus below median across industries. In industries with high variation in the ratio of connected investments, we find that stocks that attract more connected investments do significantly better both in raw and Fama–French 5-factor-adjusted returns. Excess returns of stocks with higher-than-median levels of connected investments that are also within industries with higher-than-median differences in the fraction of connected investments are 0.50% per quarter (t-stat = 1.88) in raw returns and 1.47% (t-stat = 5.25) per quarter in Fama–French 5-factor-adjusted returns.
Industries with lower variation in the connected investments include periodicals, miscellaneous durable goods, canned vegetables and food, electric services, newspapers, and so forth. In contrast, industries with greater variation in the ratio of connected investments include computer and office equipment, data processing services, pharmaceuticals (drugs), medical instruments, and electronic components. It is reasonable that institutions’ connected investments yield higher returns in these industries, where innovation is vital to the success of public firms.
VI. Conclusion
Some information that is relevant to the pricing of publicly traded stocks is produced in private markets. Traditional actors, such as analysts, do not generally follow developments in nonpublicly traded firms. Firms with nonpublicly traded stocks have no requirement to make information public. Regardless, some information about their innovations could be revealed to public investors through media announcements, patent applications, and so forth. Even so, such announcements, by definition, lag the innovation. An institutional investor in VC funds may have the opportunity to obtain information about the nonpublicly traded firms in VC funds’ portfolio before such information becomes public. We propose that institutional investors who invest in nonpublicly traded firms through their investments in VC funds use that information to better allocate capital in public markets.
We find that institutional investors’ investments in publicly traded stocks within industries to which they are connected through their VC funds generate statistically significant excess returns, compared to both nonconnected institutions’ investments in the same industry and the same institution’s investments in other industries. We use legal changes to the interpretation of FOIA, and, later, staggered state laws that exempt public institutional investors’ investments in VC funds from certain FOIA requests, as quasi-natural experiments to determine that the results are due to information flow from VC funds to institutional investors. We also show that an institutional investor’s excess returns from connected investments are higher when the institution has a higher information advantage relative to the public. These conjectures are supported by interviews and a small survey of VC fund managers.
The findings indicate that information generated in private markets has relevance for public markets, and institutional investors who participate in both markets serve as channels for information transmission between the two. The findings also suggest that the benefits of investing in VC funds extend beyond fund cash flows. Institutional investors gain valuable insights from their investments in private markets, enhancing their capital allocation capabilities in publicly traded markets. This observation could help explain the remarkable growth in VC investments (Lerner and Nanda (Reference Lerner and Nanda2020)). Perhaps the most important implication of our findings is that public markets have the capacity to assimilate information generated in private markets and reflect the information in publicly traded stock prices, enhancing the ability of capital providers to allocate capital more efficiently.
Supplementary Material
To view supplementary material for this article, please visit http://doi.org/10.1017/S0022109025102330.


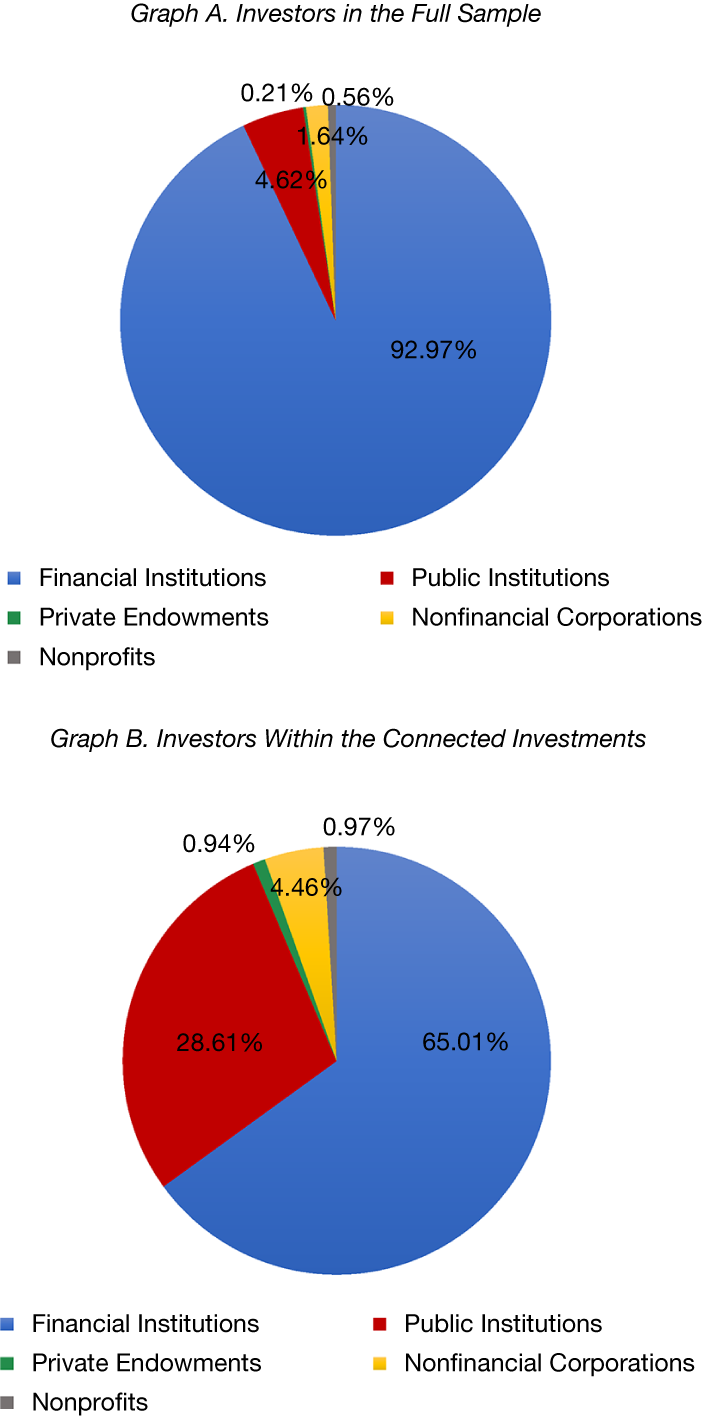
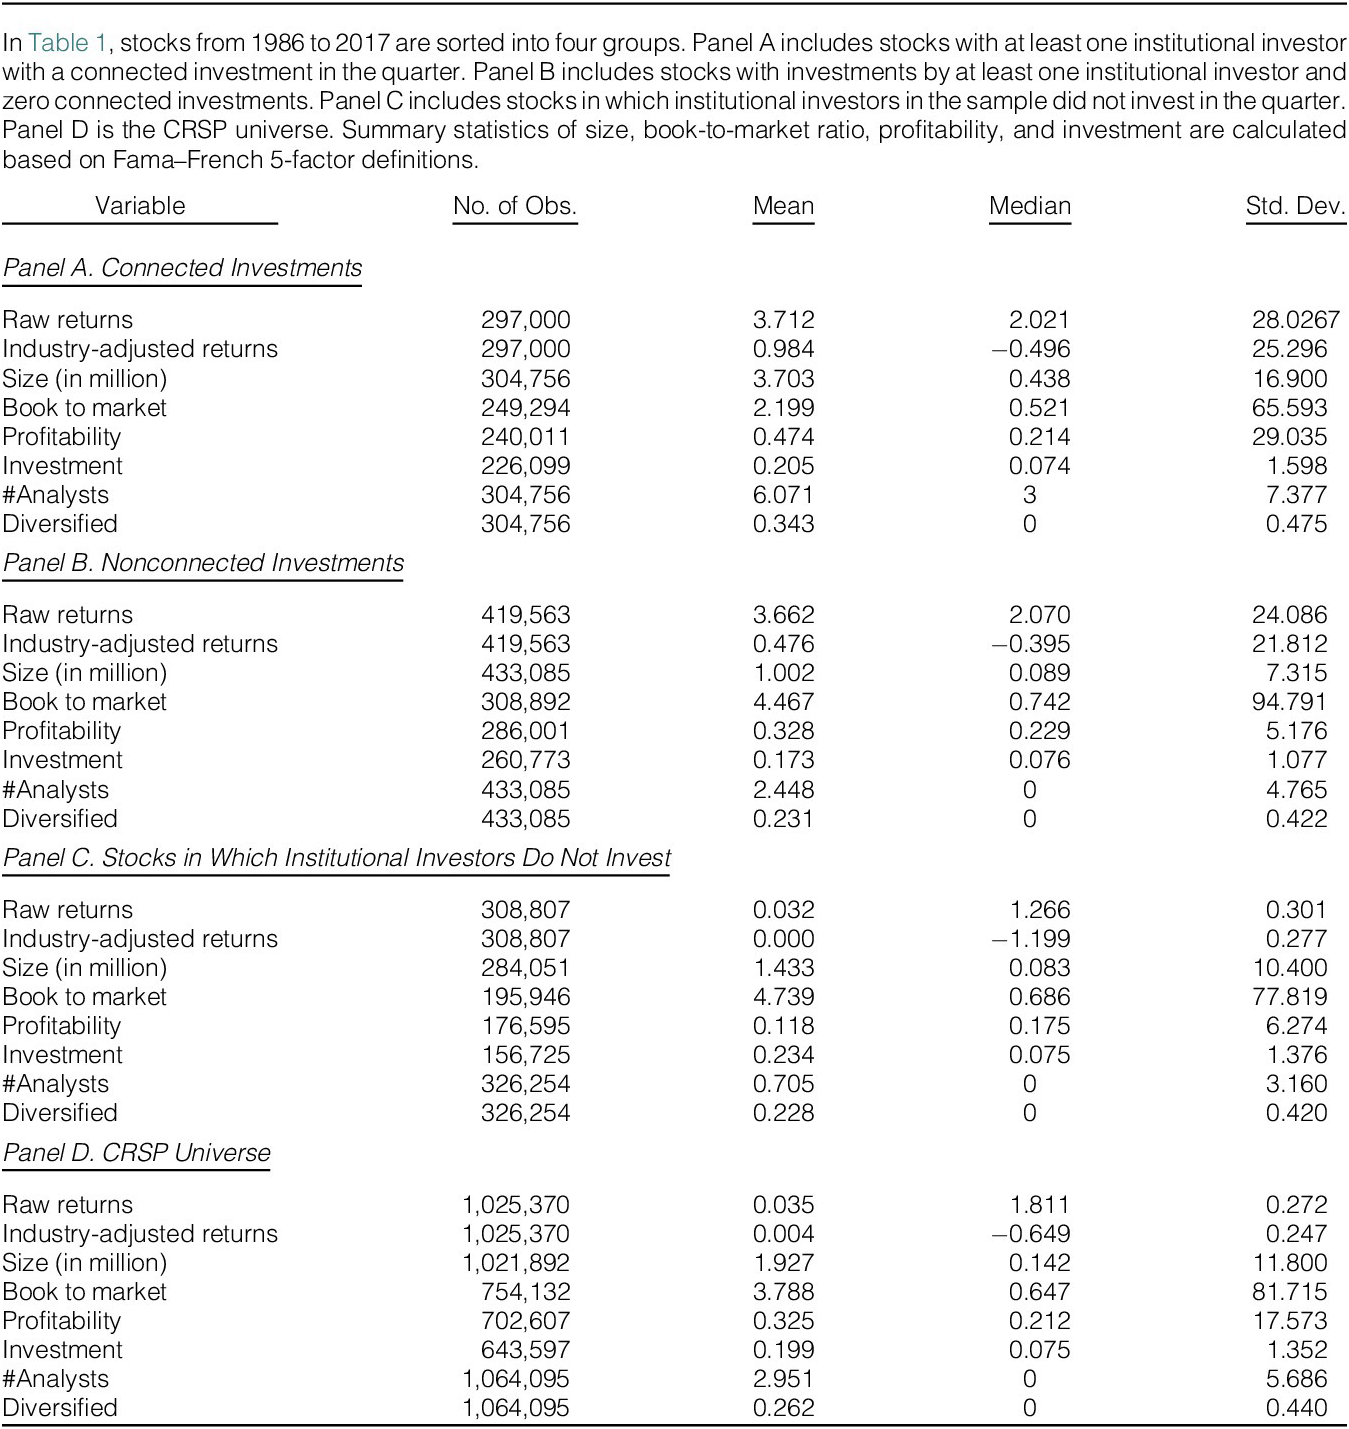
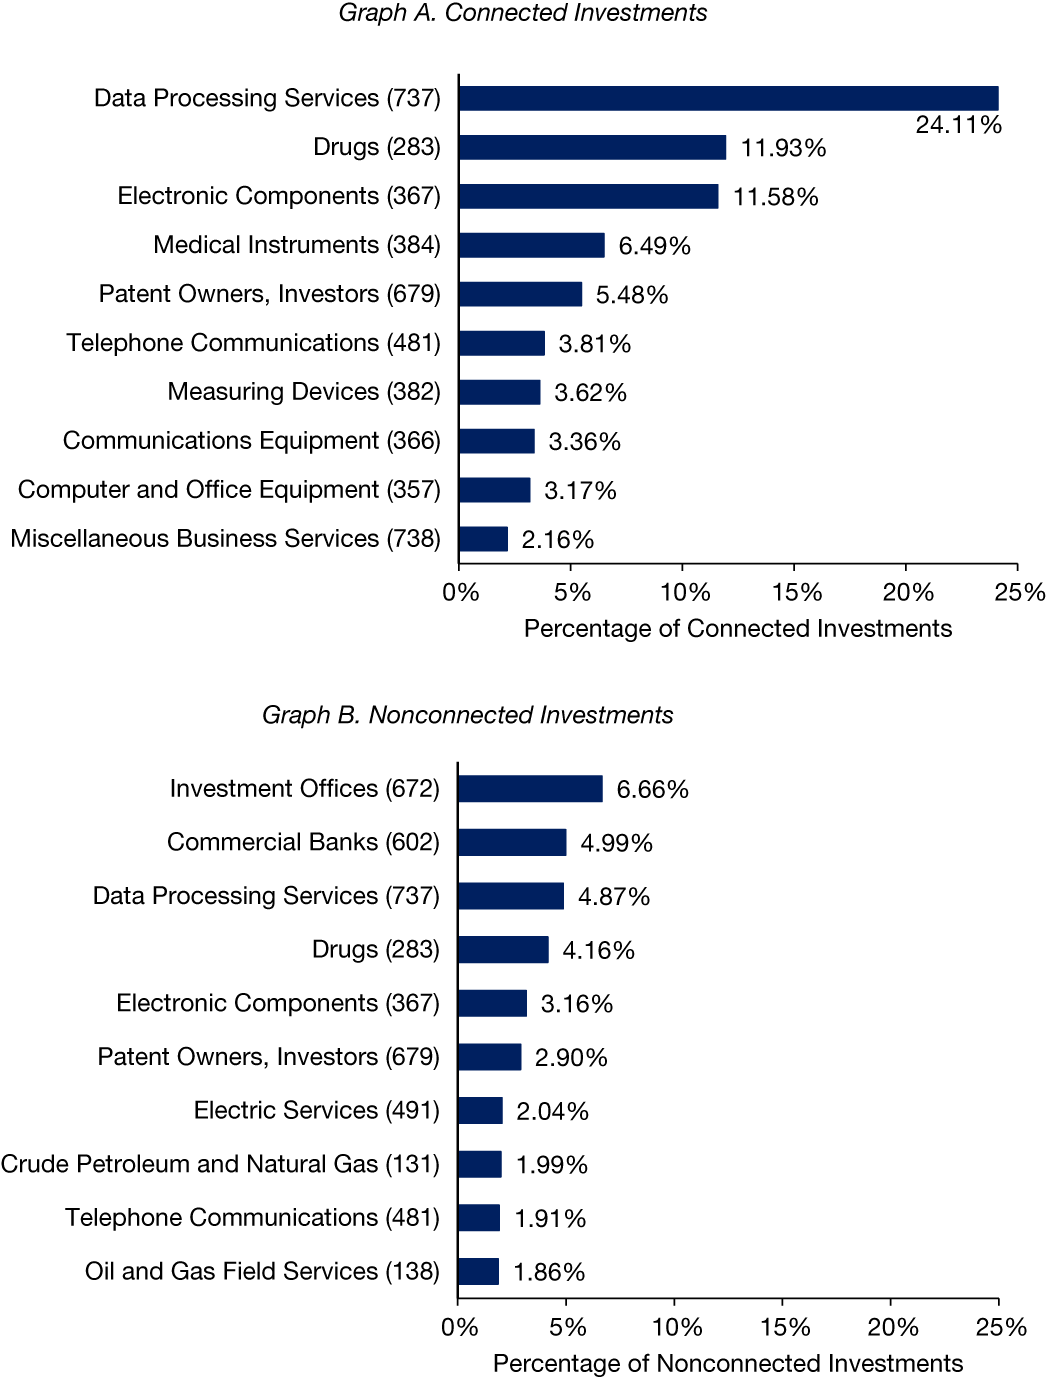
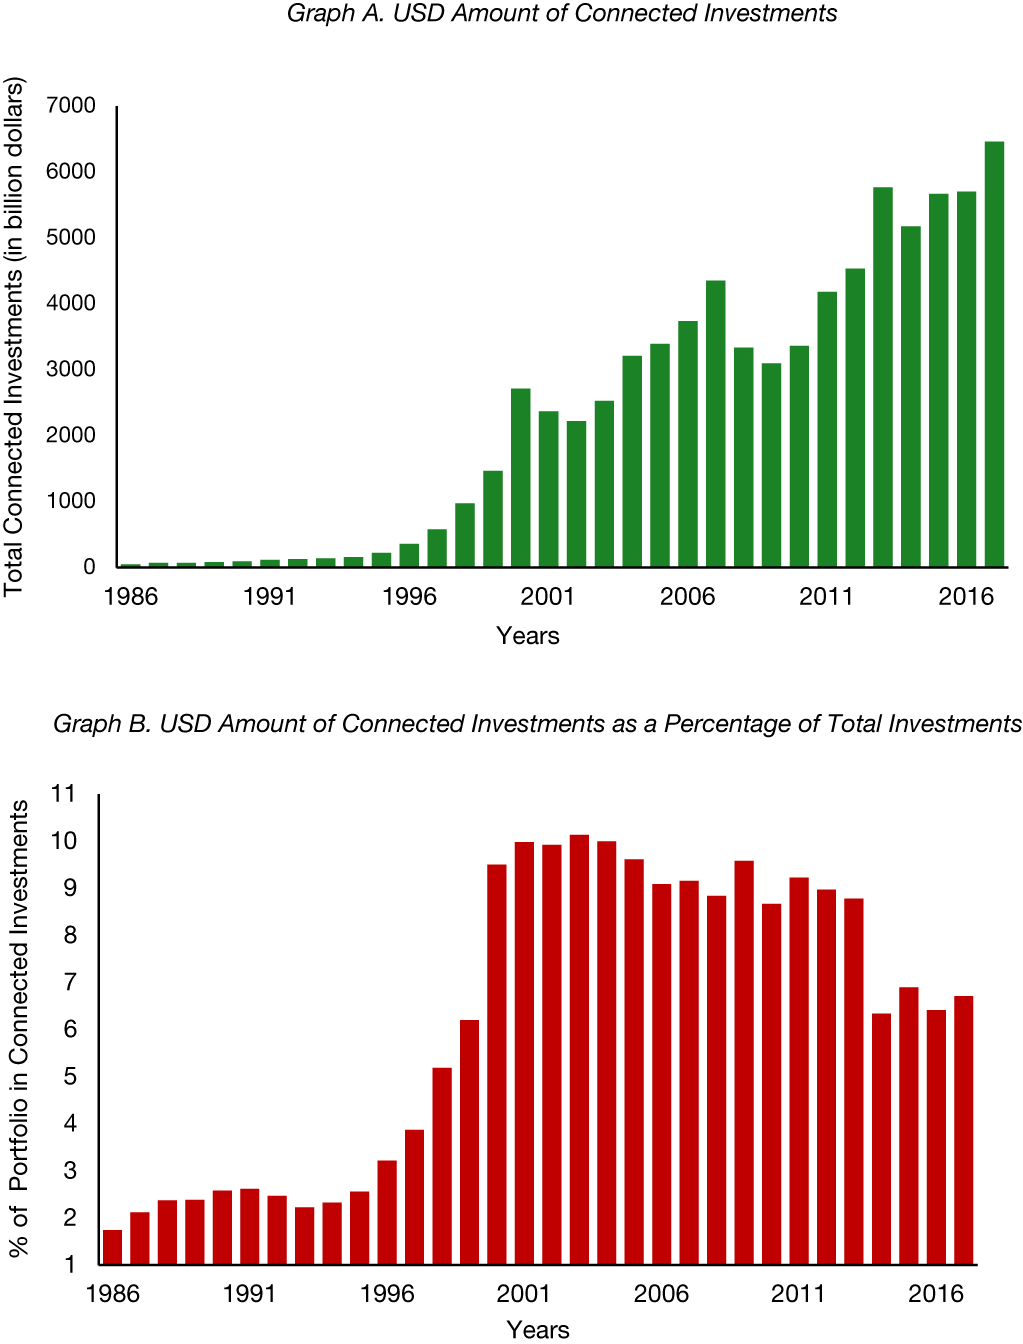
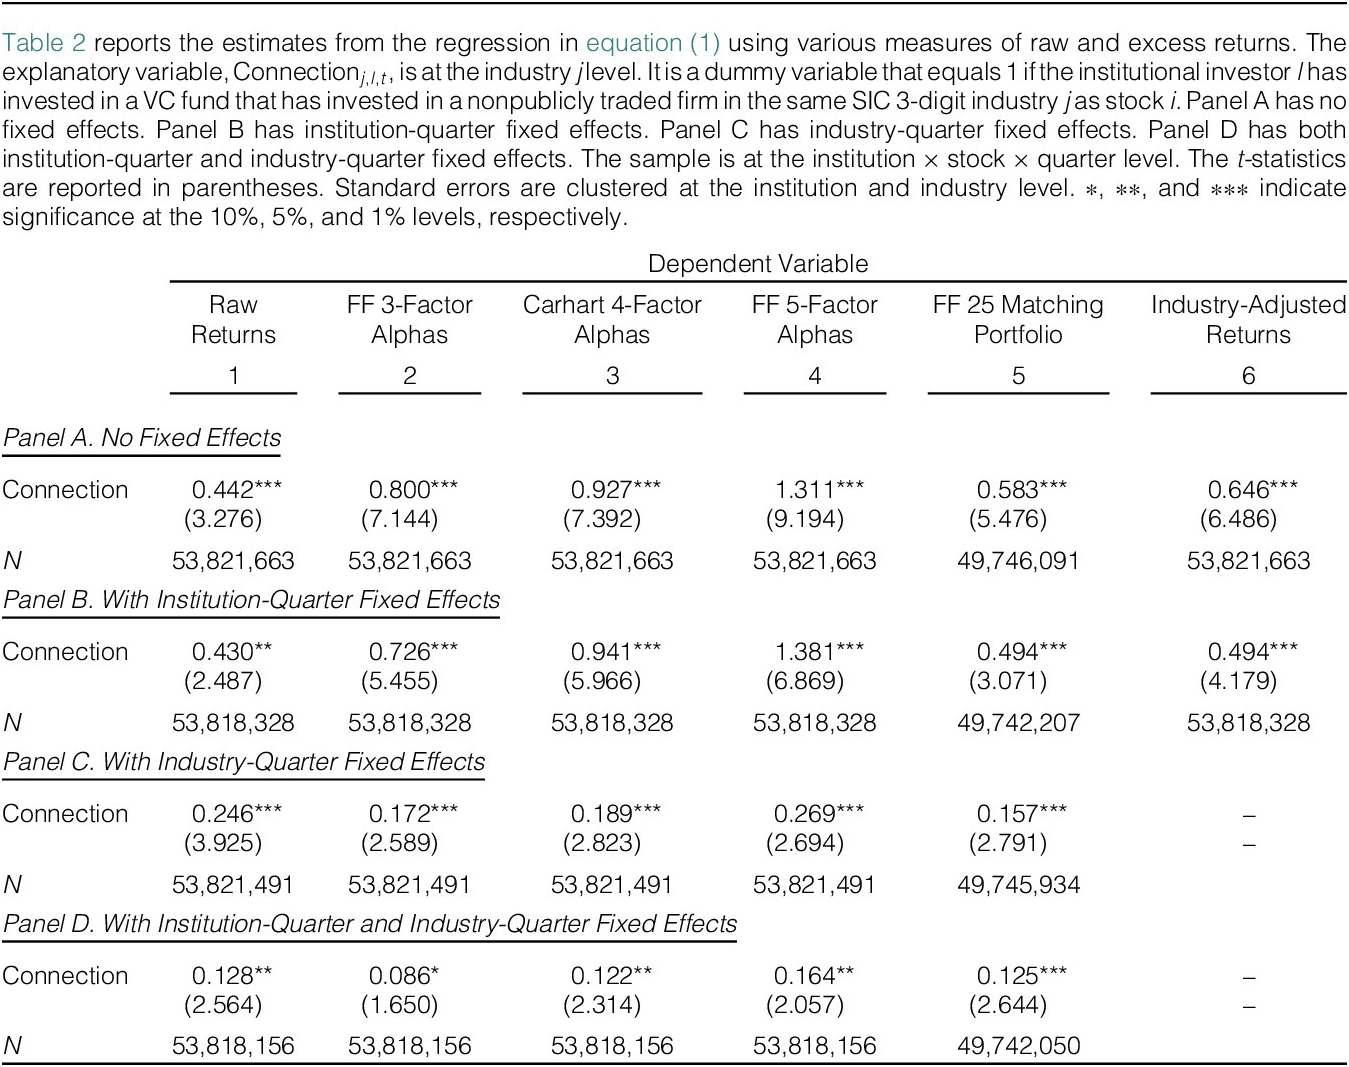
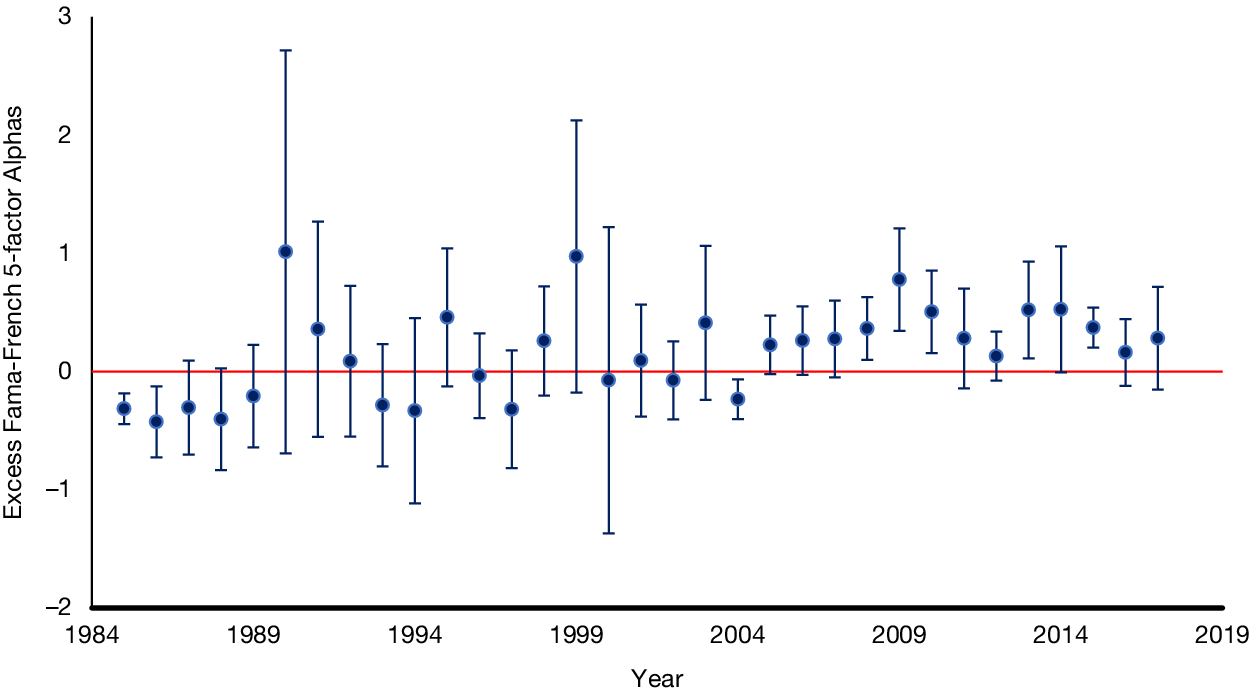


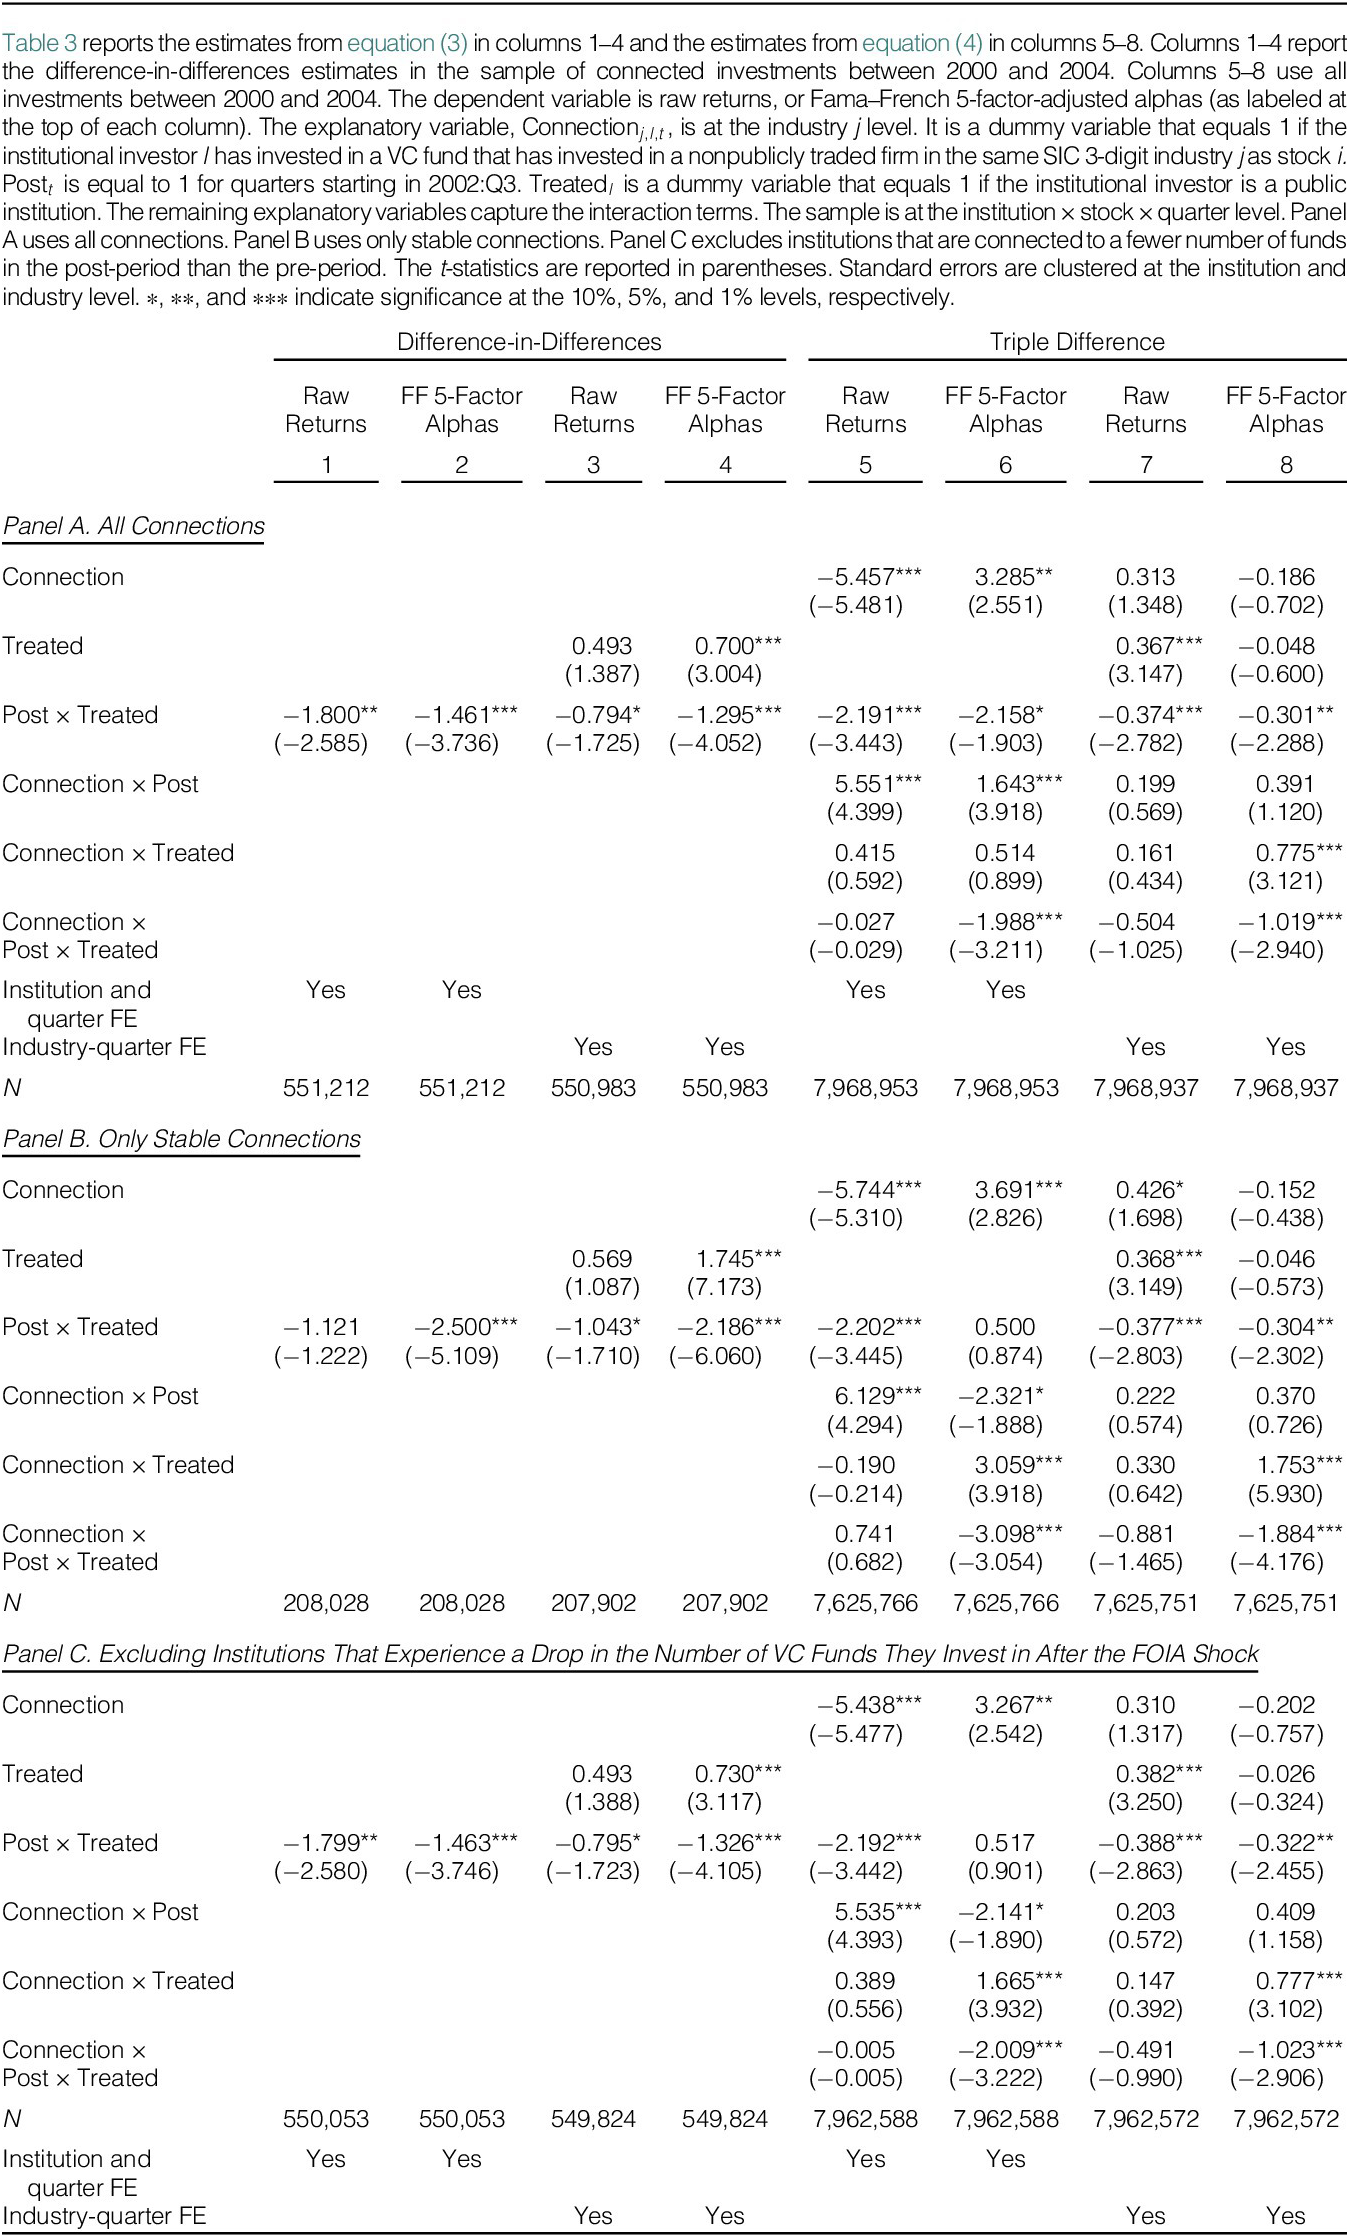
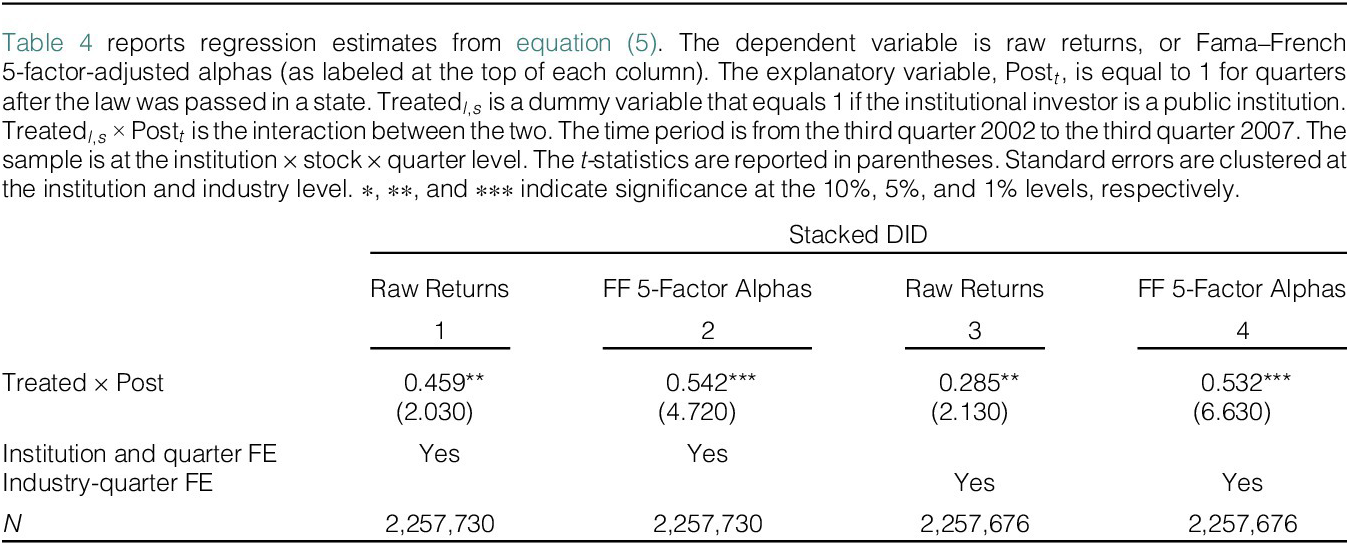
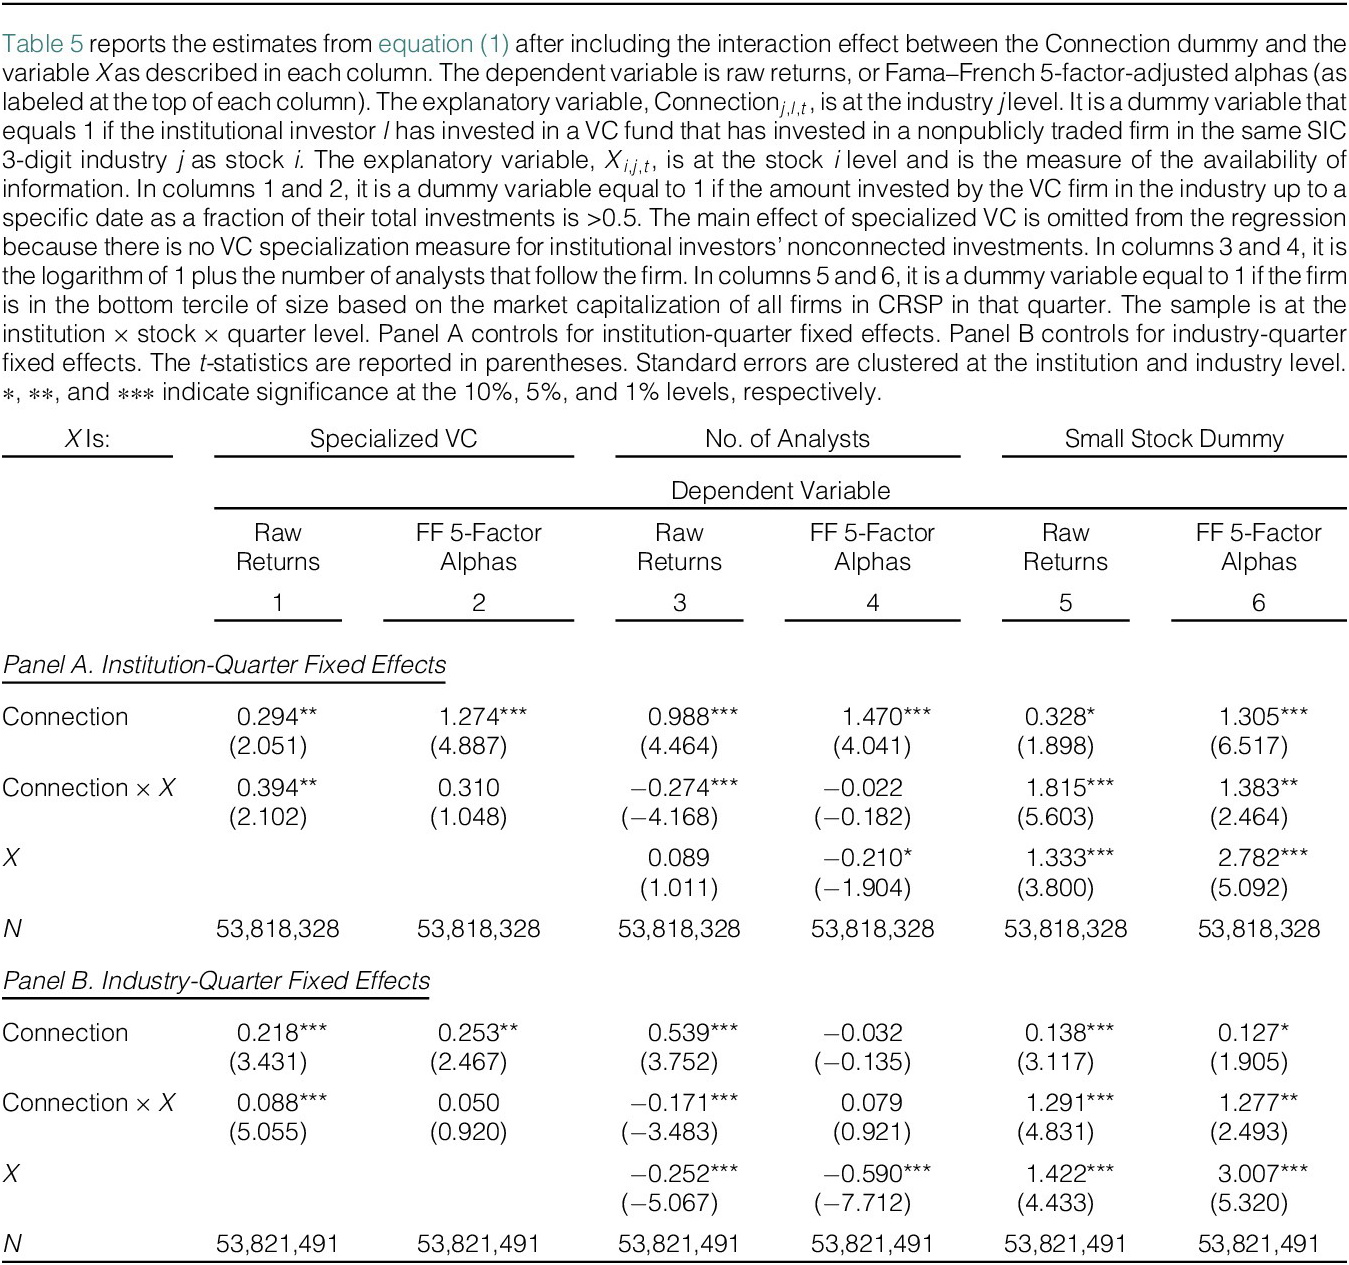
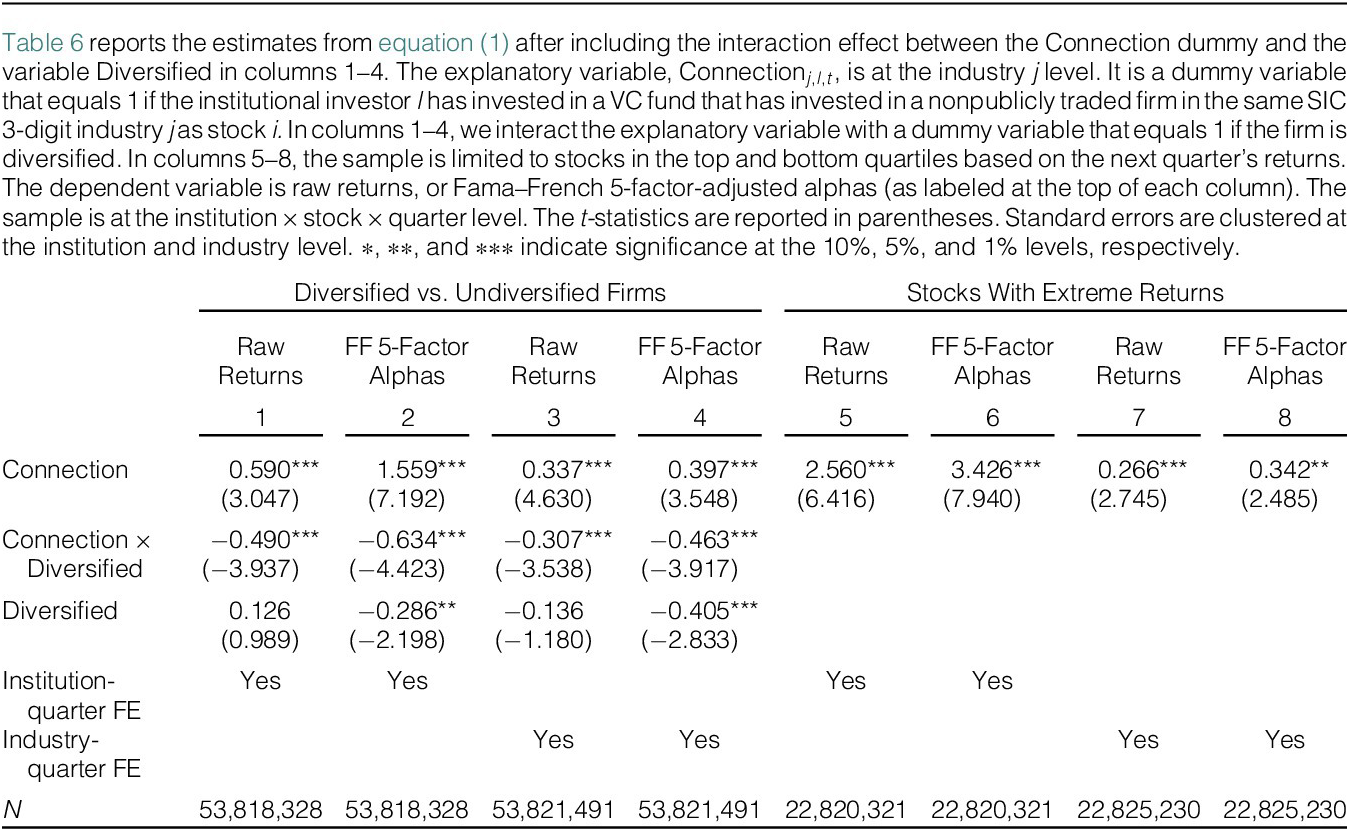
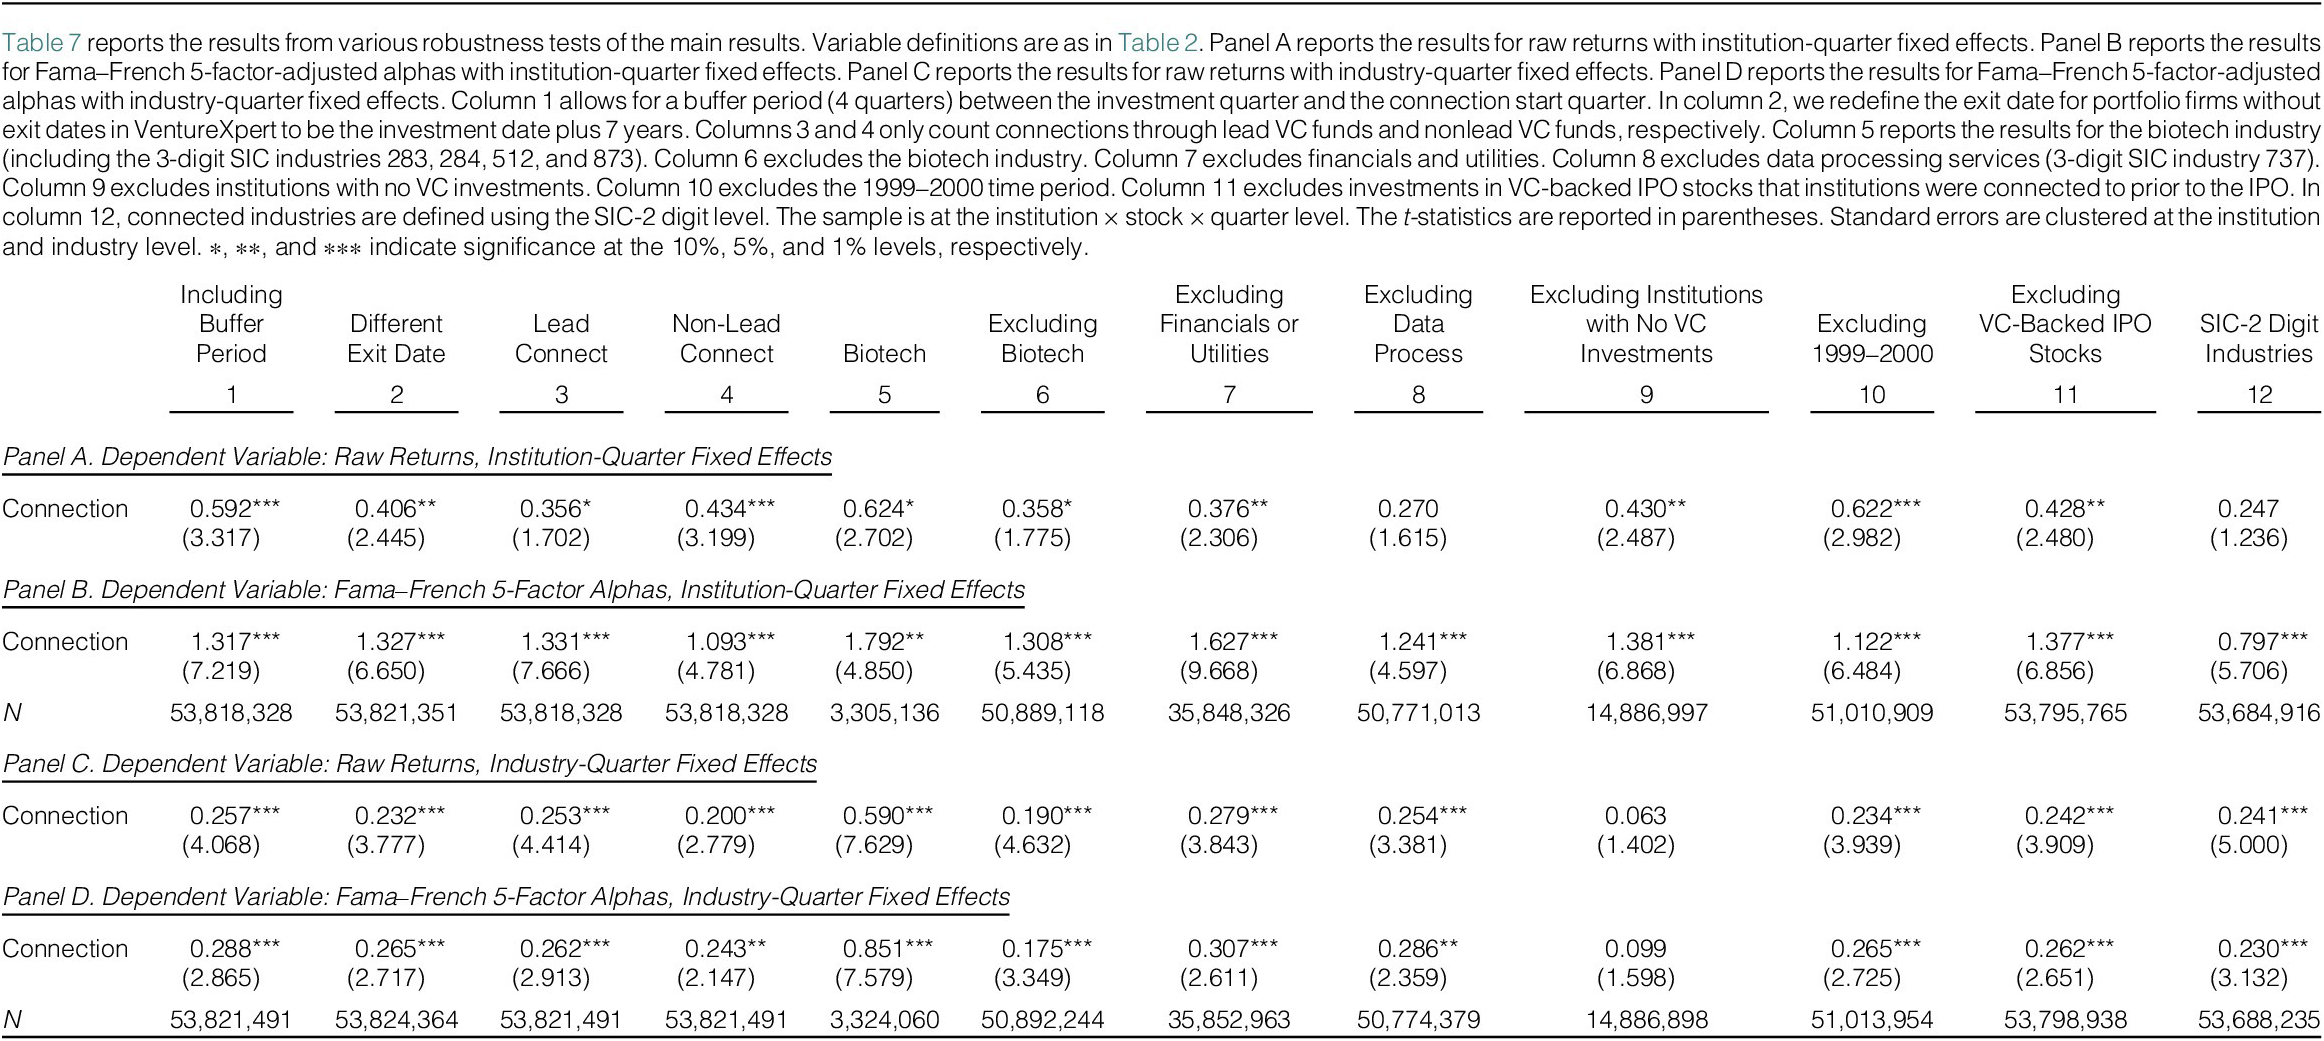
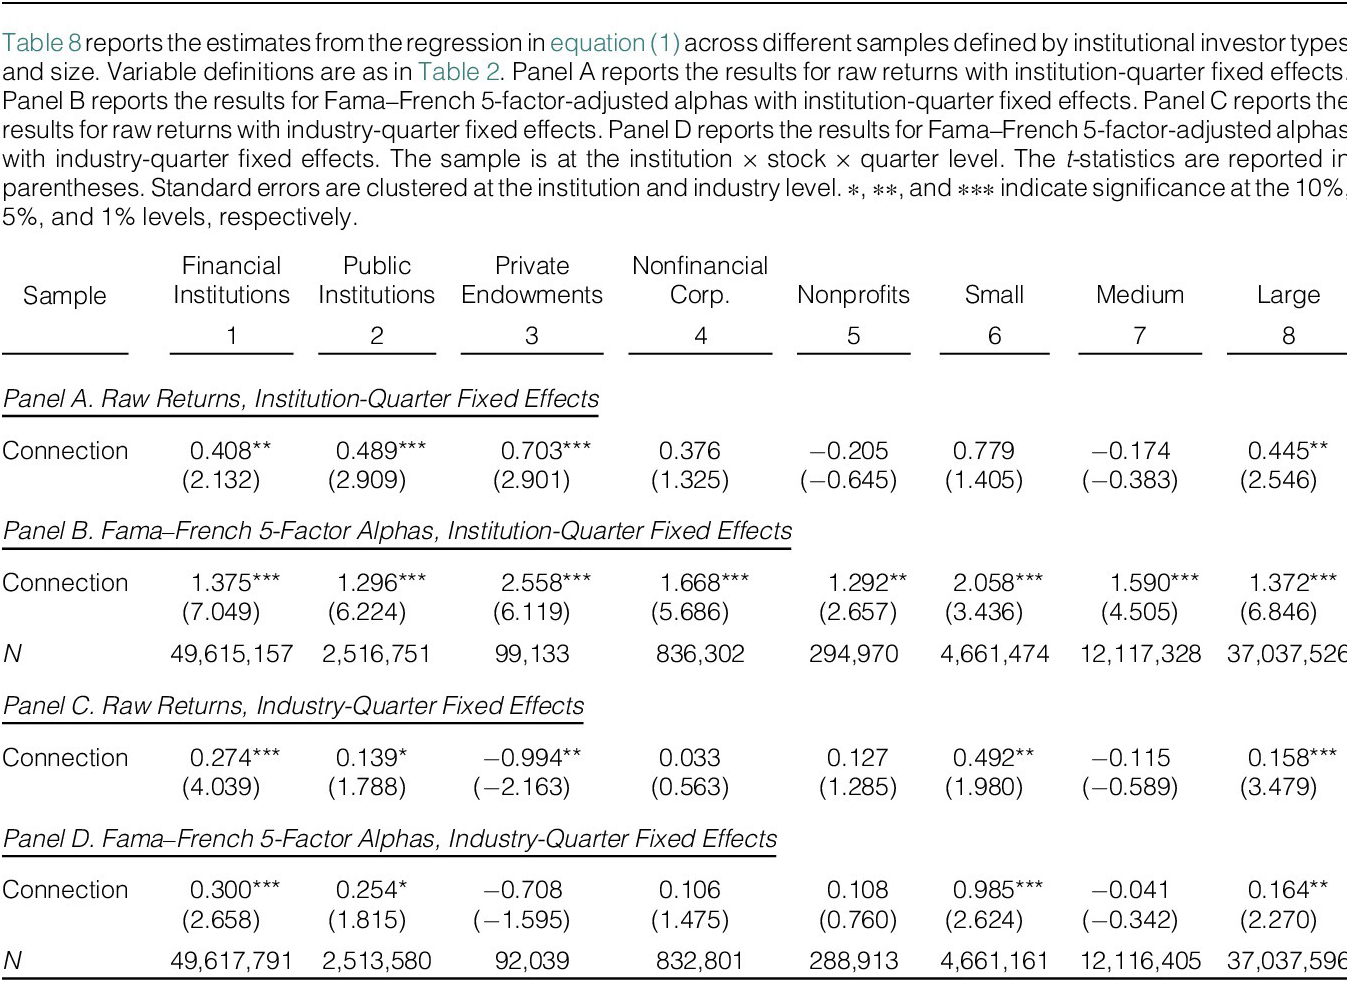

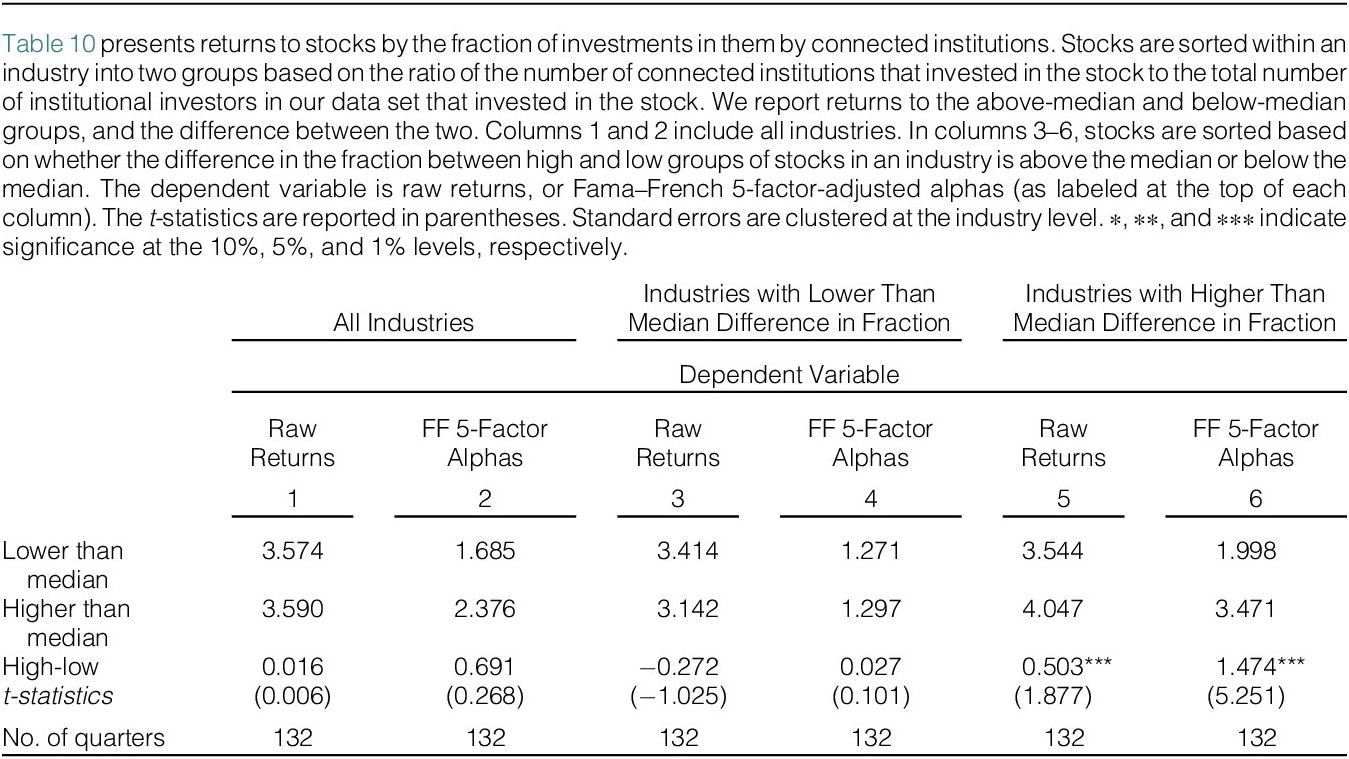


 Open access