


1. Introduction
A finite wall-mounted cylinder (FWMC) is a finite-length cylinder with one free end and one end mounted to a flat wall. Such arrangements are frequently seen in industrial applications, including aircraft landing gear, automobile appendages and wind turbine masts. The noise generated by fluid flow over FWMCs can interfere with the operation of industrial equipment and pose a risk to human health. Inspired by the morphology of harbour seal vibrissae, recent studies have demonstrated the potential of infinite (or two-dimensional) vibrissal-shaped cylinders to suppress the flow-induced noise they produce (Zhu et al. Reference Zhu, Yuan, Hu, Yang and Xu2024; Chen et al. Reference Chen, Liu, Zang and Azarpeyvand2025a ). The present study examines the noise reduction performance of harbour seal vibrissal FWMCs of different aspect ratios. Specifically, it characterises the harbour seal vibrissal FWMC’s wake structure and identifies the flow mechanisms responsible for noise reduction.
The aeroacoustics of the infinite circular cylinder is a classical problem that has been well studied over the last decades (Curle Reference Curle1955; Keefe Reference Keefe1962; Leclercq & Doolan Reference Leclercq and Doolan2009). It is characterised by an Aeolian tone resulting from quasi-periodic von Kármán vortex shedding from the cylinder. The FWMCs exhibit a wake dynamics that is fundamentally distinct from that of two-dimensional cylinders, and so is the noise they produce. The interaction between flow at the free end tip and wall junction gives rise to intricate highly three-dimensional vortex configurations. A detailed review of this topic is provided by Porteous, Moreau & Doolan (Reference Porteous, Moreau and Doolan2014), focusing on circular and square FWMCs. Similar to infinite cylinders, an Aeolian tone has been observed for both circular and square FWMCs (Becker et al. Reference Becker, Hahn, Kaltenbacher and Lerch2008; King & Pfizenmaier Reference King and Pfizenmaier2009; Moreau & Doolan Reference Moreau and Doolan2013; Porteous, Moreau & Doolan Reference Porteous, Moreau and Doolan2017; Karthik, Vengadesan & Bhattacharyya Reference Karthik, Vengadesan and Bhattacharyya2018). Additionally, two secondary tonal peaks occur for FWMCs of large aspect ratio ( $\textit{AR}\gt$
18.5, aspect ratio is defined as
$\textit{AR}\gt$
18.5, aspect ratio is defined as $\textit{AR} = L/D$
, where
$\textit{AR} = L/D$
, where $L$
is the span length, and
$L$
is the span length, and $D$
is the diameter of the cylinder) (Moreau & Doolan Reference Moreau and Doolan2013; Porteous et al. Reference Porteous, Moreau and Doolan2017): a broad peak appears at a lower frequency, and a narrow peak bifurcates from the fundamental Aeolian tone. The former tonal peak was found to be linked with tip flow, while the latter was attributed to the influence of junction flow (Porteous et al. Reference Porteous, Moreau and Doolan2017).
$D$
is the diameter of the cylinder) (Moreau & Doolan Reference Moreau and Doolan2013; Porteous et al. Reference Porteous, Moreau and Doolan2017): a broad peak appears at a lower frequency, and a narrow peak bifurcates from the fundamental Aeolian tone. The former tonal peak was found to be linked with tip flow, while the latter was attributed to the influence of junction flow (Porteous et al. Reference Porteous, Moreau and Doolan2017).
The frequency of the Aeolian tone of FWMCs is generally lower than that observed for its infinite counterpart, while the strength depends on the aspect ratio. Becker et al. (Reference Becker, Hahn, Kaltenbacher and Lerch2008) reported the amplitude of the tonal peak of square FWMCs with $\textit{AR} = 6$
is approximately 20 % below that measured for two-dimensional square cylinders. Increasing the FWMC aspect ratio leads to an increase in both the broadband noise and Aeolian tone level (King & Pfizenmaier Reference King and Pfizenmaier2009; Moreau & Doolan Reference Moreau and Doolan2013; Karthik et al. Reference Karthik, Vengadesan and Bhattacharyya2018). However, the secondary peaks corresponding to the free tip and junction flows for circular FWMCs were found by Porteous, Doolan & Moreau (Reference Porteous, Doolan and Moreau2013) to be of constant strength and frequency regardless of the aspect ratio. Becker et al. (Reference Becker, Hahn, Kaltenbacher and Lerch2008) suggested that suppression of the Aeolian tone could result from reducing the strength of the vortices shed and their correlation by studying the flow-induced noise of square FWMCs with fore and aft bodies attached. King & Pfizenmaier (Reference King and Pfizenmaier2009) measured the sound generated by flow over finite cylinders with square, circular and elliptical cross-sections and found that the peak spectral level for the square cylinder was approximately 7 dB higher than that of the circular cylinder, and approximately 15 dB higher than that of the elliptical cylinder. It can be concluded from these studies that both the aspect ratio and cross-sectional shape of the FWMC influence the amplitude of the fundamental Aeolian tone.
$\textit{AR} = 6$
is approximately 20 % below that measured for two-dimensional square cylinders. Increasing the FWMC aspect ratio leads to an increase in both the broadband noise and Aeolian tone level (King & Pfizenmaier Reference King and Pfizenmaier2009; Moreau & Doolan Reference Moreau and Doolan2013; Karthik et al. Reference Karthik, Vengadesan and Bhattacharyya2018). However, the secondary peaks corresponding to the free tip and junction flows for circular FWMCs were found by Porteous, Doolan & Moreau (Reference Porteous, Doolan and Moreau2013) to be of constant strength and frequency regardless of the aspect ratio. Becker et al. (Reference Becker, Hahn, Kaltenbacher and Lerch2008) suggested that suppression of the Aeolian tone could result from reducing the strength of the vortices shed and their correlation by studying the flow-induced noise of square FWMCs with fore and aft bodies attached. King & Pfizenmaier (Reference King and Pfizenmaier2009) measured the sound generated by flow over finite cylinders with square, circular and elliptical cross-sections and found that the peak spectral level for the square cylinder was approximately 7 dB higher than that of the circular cylinder, and approximately 15 dB higher than that of the elliptical cylinder. It can be concluded from these studies that both the aspect ratio and cross-sectional shape of the FWMC influence the amplitude of the fundamental Aeolian tone.
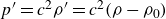
(a) A harbour seal vibrissal FWMC mounted to a flat wall with diameter $D$
and span
$D$
and span $L$
subject to a flow with free-stream velocity
$L$
subject to a flow with free-stream velocity $U_0$
and an incoming boundary layer height of
$U_0$
and an incoming boundary layer height of $\delta$
. (b) Geometric parameters of the harbour seal vibrissa.
$\delta$
. (b) Geometric parameters of the harbour seal vibrissa.

Harbour seals are capable of following the trajectories of water disturbances over distances that far exceed the ranges of vision or hearing in the water. During the hunting process, harbour seal vibrissae, which have an undulated morphology with two inclined elliptical cross-sections (see figure 1), play a crucial role in enabling the seal to track upstream prey (Dehnhardt et al. Reference Dehnhardt, Mauck, Hanke and Bleckmann2001; Schulte-Pelkum et al. Reference Schulte-Pelkum, Wieskotten, Hanke, Dehnhardt and Mauck2007; Wieskotten et al. Reference Wieskotten, Mauck, Miersch, Dehnhardt and Hanke2011). Dehnhardt et al. (Reference Dehnhardt, Mauck, Hanke and Bleckmann2001) found that the ability to detect wake fluctuations strongly depends on the vortex-induced vibrations (VIVs) of the vibrissae. This discovery motivated further investigation into the vibrational response of harbour seal vibrissae to upstream wakes, also referred to as wake-induced vibrations (WIVs) (Assi et al. Reference Assi, Bearman, Carmo, Meneghini, Sherwin and Willden2013). Beem & Triantafyllou (Reference Beem and Triantafyllou2015) demonstrated that, when a circular cylinder was placed upstream of the vibrissal cylinder in a water tunnel, the vibrissal model oscillated in a slaloming motion with relatively large amplitude and a frequency consistent with the wake dynamics of the upstream cylinder. Gong, Suresh & Jin (Reference Gong, Suresh and Jin2023) employed time-resolved particle image velocimetry (PIV) to investigate the vortex flow dynamics and vibrational response of harbour seal vibrissae positioned within the wake of a moving cylinder. They found that the WIV of the vibrissa remained synchronised with the incoming vortex flow; however, the vibration amplitudes gradually decayed over time.
The special undulating geometry has shown effective suppression of vortex shedding in the subcritical Reynolds number regime. This vortex shedding suppression has been observed regardless of whether the cylinders are vibrating or fixed. Hanke et al. (Reference Hanke, Witte, Miersch, Brede, Oeffner, Michael, Hanke, Leder and Dehnhardt2010) conducted experimental research of VIV of a harbour seal vibrissa using a head-mounted camera and performed force measurements on vibrissae. Results indicated that the oscillation response was suppressed for harbour seal vibrissae. Further insights into the underlying flow mechanisms were gained through numerical simulations involving fixed vibrissal cylinders. Hanke et al. (Reference Hanke, Witte, Miersch, Brede, Oeffner, Michael, Hanke, Leder and Dehnhardt2010) and Witte et al. (Reference Witte, Hanke, Wieskotten, Miersch, Brede, Dehnhardt and Leder2012) performed numerical simulations of a fixed, infinite vibrissal cylinder at $\textit{Re} = 500$
, identifying elongated vortices in the wake. These characteristic flow structures were subsequently confirmed by Wang & Liu (Reference Wang and Liu2016) through experiments and by Kim & Yoon (Reference Kim and Yoon2018) through numerical simulations within a Reynolds number range of 50–500. Wang & Liu (Reference Wang and Liu2016) observed that elongated vortices are shed in a more complex and coherent mode in the wake of the harbour seal vibrissae compared with the quasi-periodic von Kármán vortex shedding of a circular cylinder. An approximate 79 % reduction in the root-mean-square (r.m.s.) of the fluctuating lift for a vibrissal cylinder in comparison with a circular cylinder was reported by Jie & Liu (Reference Jie and Liu2017). In addition, Morrison et al. (Reference Morrison, Brede, Dehnhardt and Leder2016) observed significantly lower magnitude turbulent kinetic energy in the wake of the harbour seal vibrissa than that of the circular cylinder. Song, Ji & Zhang (Reference Song, Ji and Zhang2021) numerically simulated the VIV of a vibrissal cylinder at a Reynolds number of 300 and observed discernible suppression of the vibration responses and a reduction in the drag force.
$\textit{Re} = 500$
, identifying elongated vortices in the wake. These characteristic flow structures were subsequently confirmed by Wang & Liu (Reference Wang and Liu2016) through experiments and by Kim & Yoon (Reference Kim and Yoon2018) through numerical simulations within a Reynolds number range of 50–500. Wang & Liu (Reference Wang and Liu2016) observed that elongated vortices are shed in a more complex and coherent mode in the wake of the harbour seal vibrissae compared with the quasi-periodic von Kármán vortex shedding of a circular cylinder. An approximate 79 % reduction in the root-mean-square (r.m.s.) of the fluctuating lift for a vibrissal cylinder in comparison with a circular cylinder was reported by Jie & Liu (Reference Jie and Liu2017). In addition, Morrison et al. (Reference Morrison, Brede, Dehnhardt and Leder2016) observed significantly lower magnitude turbulent kinetic energy in the wake of the harbour seal vibrissa than that of the circular cylinder. Song, Ji & Zhang (Reference Song, Ji and Zhang2021) numerically simulated the VIV of a vibrissal cylinder at a Reynolds number of 300 and observed discernible suppression of the vibration responses and a reduction in the drag force.
In comparison with the comprehensive studies of the flow dynamics and VIV of the harbour seal vibrissae, only a few studies have investigated the flow-induced noise generated by harbour seal vibrissae, with recent research focusing on the noise of infinite cylinders. Compared with a cylinder of circular cross-section, the overall sound pressure level (OASPL) was found to be 24 dB lower for the infinite vibrissal cylinder, with no primary tone observed in the acoustic spectrum measured by Smith, Chen & Zang (Reference Smith, Chen and Zang2023). The large anti-phase vortex shedding typically associated with bluff body flows was absent in the case of the vibrissal cylinder. Instead, a more stable wake region characterised by smaller, uncorrelated vortices shed from either side of the geometry was observed. Smith et al. (Reference Smith, Chen and Zang2023) demonstrated that this wake behaviour is highly effective in reducing flow-induced noise. Both far-field noise measurements and numerical simulations were conducted by Zhu et al. (Reference Zhu, Yuan, Hu, Yang and Xu2024), who showed that, in comparison with a circular cylinder, the vibrissal cylinder significantly suppressed flow-induced noise by 13 dB. The out-of-phase vortex shedding induced by the two adjacent saddle planes, which disrupted coherence within the separated shear layers, was observed. Zhu et al. (Reference Zhu, Yuan, Hu, Yang and Xu2024) attributed the elimination of the tonal peak in the aerodynamic noise spectrum to this out-of-phase shedding behaviour. Similarly, a reduction in the OASPL of 13 dB was found by Chen et al. (Reference Chen, Liu, Zang and Azarpeyvand2025a ) for the infinite harbour seal vibrissa compared with the circular cylinder, along with significant attenuation of the peak associated with vortex shedding. They employed proper orthogonal decomposition mode analysis of the wake velocity to demonstrate that non-synchronous vortex shedding occurs in the saddle and nodal planes, which could suppress the vortex shedding. In addition, Zhu et al. (Reference Zhu, Lu, Jia, Xia and Chu2023) investigated the flow-induced noise of tandem harbour seal vibrissae and identified suppression effectiveness in the wake of the tandem cylinders. Zhu et al. (Reference Zhu, Lu, Jia, Xia and Chu2023) found that the reversed vortex shedding induced by two adjacent saddle surfaces in the wake of a vibrissal cylinder could balance lateral forces and significantly suppress lift fluctuations, thereby reducing aerodynamic noise caused by wall pressure variations.
In summary, a few studies have comprehensively examined the flow-induced noise and coherent flow structures of infinite harbour seal vibrissae. However, to the best of the authors’ knowledge, there is no existing information on the noise production of vibrissal FWMCs that incorporates the effects of the free tip and wall-junction flow. To address this gap, the present study investigates the flow-induced noise of the harbour seal vibrissal FWMC shown in figure 1, with a finite spanwise length $L$
and diameter
$L$
and diameter $D$
. The FWMC is mounted to an infinite wall and interacts with free-stream velocity
$D$
. The FWMC is mounted to an infinite wall and interacts with free-stream velocity $U_0$
and a fully developed turbulent boundary layer (TBL) with thickness given by
$U_0$
and a fully developed turbulent boundary layer (TBL) with thickness given by $\delta$
at the wall junction. For the first time, the radiated noise spectra and intermittent cellular shedding of harbour seal vibrissal FWMCs are examined. The coherent structures in phase with the Aeolian tone of the circular FWMCs are illustrated, and the flow mechanism responsible for tonal suppression is identified. The specific aims of this paper are to: (i) comprehensively characterise the noise reduction performance of the vibrissal FWMCs; (ii) investigate the flow patterns and behaviours of vibrissal FWMC wakes for different aspect ratios; (iii) elucidate the mechanisms of tip–wall interaction and vibrissal geometry at varying aspect ratios; and (iv) establish the relationship between the wake flow structures and the reduction of flow-induced noise.
$\delta$
at the wall junction. For the first time, the radiated noise spectra and intermittent cellular shedding of harbour seal vibrissal FWMCs are examined. The coherent structures in phase with the Aeolian tone of the circular FWMCs are illustrated, and the flow mechanism responsible for tonal suppression is identified. The specific aims of this paper are to: (i) comprehensively characterise the noise reduction performance of the vibrissal FWMCs; (ii) investigate the flow patterns and behaviours of vibrissal FWMC wakes for different aspect ratios; (iii) elucidate the mechanisms of tip–wall interaction and vibrissal geometry at varying aspect ratios; and (iv) establish the relationship between the wake flow structures and the reduction of flow-induced noise.
The rest of this paper is organised as follows. Section 2 illustrates the methodology for solving the flow-induced noise problem considered in this work. Far-field acoustics, time-averaged and statistical flow quantities, cellular vortex shedding and three-dimensional vortical structures are comprehensively examined in § 3. Additionally, the coherence between the flow and acoustics, and the spanwise flow transportation analysis are provided in § 3 for further insight into the suppression of the tonal peaks produced by circular FWMCs. Section 4 concludes this paper. A computational mesh study and validation of the acoustic prediction method is presented in Appendix A, where both circular FWMCs and infinite vibrissal cylinders are studied to validate the present numerical methods.
2. Methodology
In this study, large eddy simulations (LES) are performed to examine the turbulent coherent structures in high fidelity and the Ffowcs Williams–Hawkings (FW–H) equation proposed by Ffowcs Williams & Hawkings (Reference Ffowcs Williams and Hawkings1969) is used in the prediction of flow-induced noise. The aerodynamic diameter $D$
of the cylinder is 0.006 m, the free-stream velocity is
$D$
of the cylinder is 0.006 m, the free-stream velocity is $U_0$
= 30 m s−1, resulting in a diameter-based Reynolds number of 12 000, and the TBL non-dimensional thickness
$U_0$
= 30 m s−1, resulting in a diameter-based Reynolds number of 12 000, and the TBL non-dimensional thickness $\delta /D$
is 1.6, following the parameters adopted in the circular FWMC experiments of Moreau & Doolan (Reference Moreau and Doolan2013).
$\delta /D$
is 1.6, following the parameters adopted in the circular FWMC experiments of Moreau & Doolan (Reference Moreau and Doolan2013).
Hanke et al. (Reference Hanke, Witte, Miersch, Brede, Oeffner, Michael, Hanke, Leder and Dehnhardt2010) examined a harbour seal over flow speeds ranging from 0.323 to 0.55 m s−1. Using a representative vibrissa diameter of approximately 5 mm as the characteristic length scale, the corresponding Reynolds numbers were estimated to lie between 186 and 340. Chen, Wang & Liu (Reference Chen, Wang and Liu2024) considered a higher Reynolds number of 3750, based on the hydrodynamic diameter of real harbour seal vibrissae of approximately 0.5–1 mm (Hans, Miao & Triantafyllou Reference Hans, Miao and Triantafyllou2014) and a typical swimming speed of about 2 m s−1 (Geurten et al. Reference Geurten, Niesterok, Dehnhardt and Hanke2017). The present Reynolds number of 12 000 remains within the subcritical regime, which provides a useful reference for potential engineering applications at comparable Reynolds numbers.
The undulating shape of the harbour seal vibrissal FWMC follows the previous studies of Wang & Liu (Reference Wang and Liu2016), Jie & Liu (Reference Jie and Liu2017) and Chen et al. (Reference Chen, Liu, Zang and Azarpeyvand2025a
). Harbour seal vibrissal FWMCs with aspect ratios of $\textit{AR} =$
3.2, 6.5, 12.9 and 22.6 are examined comprehensively along with their circular counterparts for comparison.
$\textit{AR} =$
3.2, 6.5, 12.9 and 22.6 are examined comprehensively along with their circular counterparts for comparison.
As shown in figure 1(b), the harbour seal vibrissa features spanwise undulations with wavelength $\lambda$
and is characterised by two inclined elliptical cross-sections, A-A and B-B. The inclination angles are denoted as
$\lambda$
and is characterised by two inclined elliptical cross-sections, A-A and B-B. The inclination angles are denoted as $\alpha$
and
$\alpha$
and $\beta$
for the respective cross-sections. Yoon, Nam & Kim (Reference Yoon, Nam and Kim2020) examined the effects of the semi-major and semi-minor axes and the inclination angles of the two characteristic elliptical cross-sections for an infinite harbour seal vibrissa at
$\beta$
for the respective cross-sections. Yoon, Nam & Kim (Reference Yoon, Nam and Kim2020) examined the effects of the semi-major and semi-minor axes and the inclination angles of the two characteristic elliptical cross-sections for an infinite harbour seal vibrissa at $\textit{Re} = 500$
, and reported suppression of the drag coefficient and lift fluctuations compared with an ellptical cylinder. Shi et al. (Reference Shi, Bai, Alam, Ji and Zhu2023) conducted a systematic investigation of the wavelength effect for wavy elliptical cylinders and identified a pair of counter-rotating streamwise vortices for
$\textit{Re} = 500$
, and reported suppression of the drag coefficient and lift fluctuations compared with an ellptical cylinder. Shi et al. (Reference Shi, Bai, Alam, Ji and Zhu2023) conducted a systematic investigation of the wavelength effect for wavy elliptical cylinders and identified a pair of counter-rotating streamwise vortices for $2.58\lt \lambda /D \lt 4.44$
, accompanied by reductions in both the drag coefficient and lift fluctuations. The detailed geometrical parameters of the vibrissal FWMCs studied here were scaled from a geometry reported in Wang & Liu (Reference Wang and Liu2016), which was also referenced by Chen et al. (Reference Chen, Liu, Zang and Azarpeyvand2025a
) and Zhu et al. (Reference Zhu, Yuan, Hu, Yang and Xu2024), to
$2.58\lt \lambda /D \lt 4.44$
, accompanied by reductions in both the drag coefficient and lift fluctuations. The detailed geometrical parameters of the vibrissal FWMCs studied here were scaled from a geometry reported in Wang & Liu (Reference Wang and Liu2016), which was also referenced by Chen et al. (Reference Chen, Liu, Zang and Azarpeyvand2025a
) and Zhu et al. (Reference Zhu, Yuan, Hu, Yang and Xu2024), to $D$
= 0.006 m, which is consistent with the studied circular counterparts and experimental measurements of circular FWMCs of Moreau & Doolan (Reference Moreau and Doolan2013) and these parameters are presented in table 1. In the present study, the value of the wavelength
$D$
= 0.006 m, which is consistent with the studied circular counterparts and experimental measurements of circular FWMCs of Moreau & Doolan (Reference Moreau and Doolan2013) and these parameters are presented in table 1. In the present study, the value of the wavelength $\lambda$
is approximately 2.8 following the wavelength definition in Shi et al. (Reference Shi, Bai, Alam, Ji and Zhu2023), who comprehensively studied the wavelength effect of the harbour seal vibrissa inspired wavy elliptic cylinder. The oncoming TBL thickness used in this study follows the experimental research of Moreau & Doolan (Reference Moreau and Doolan2013) for square and circular FWMCs.
$\lambda$
is approximately 2.8 following the wavelength definition in Shi et al. (Reference Shi, Bai, Alam, Ji and Zhu2023), who comprehensively studied the wavelength effect of the harbour seal vibrissa inspired wavy elliptic cylinder. The oncoming TBL thickness used in this study follows the experimental research of Moreau & Doolan (Reference Moreau and Doolan2013) for square and circular FWMCs.
Geometrical parameters of harbour seal vibrissal cylinders.

The methodology for predicting flow-induced noise is carried out in three sequential steps. First, a precursor simulation is conducted to obtain a fully developed TBL. Next, it is applied to the FWMC simulations. Finally, the flow-induced noise prediction is performed. The present study is simulated using the open-source computational fluid dynamics solver OpenFOAM. The governing equations for the prediction of the flow-induced noise are provided in § 2.1. Section 2.2 describes the cases studied and illustrates the mesh geometry. Detailed validations of the flow-induced noise of circular FWMCs and infinite harbour seal vibrissal cylinders are presented in Appendix A.
2.1. Governing equations and numerical methods
The present paper considers homogeneous viscous incompressible flow and the governing equations of the fluid domain are presented as follows. More detailed information regarding the LES model is available in Launder (Reference Launder1995) and Wagner, Hüttl & Sagaut (Reference Wagner, Hüttl and Sagaut2007). The filtered continuity and momentum equations are
 \begin{align} \frac {\partial {\overline {u_i}}}{\partial {x_i}}=0, \end{align}
 \begin{align} \frac {\partial {\bar {u_i}}}{\partial {t}} + \frac {\partial {(\bar {u_i}\bar {u_j})}}{\partial {x_j}}= -\frac {1}{\rho } \frac {\partial {\bar {p}}}{\partial {x_i}} + \frac {\partial }{\partial {x_j}} \left [ \nu \left (\frac {\partial {\bar {u_i}}}{\partial {x_j}} + \frac {\partial {\bar {u_j}}}{\partial {x_i}}\right ) \right ]-\frac {\partial {\tau _{\textit{ij}}} }{\partial {x_j}}, \end{align}
where $\bar {u_i}$
is the filtered fluid velocity with subscripts
$\bar {u_i}$
is the filtered fluid velocity with subscripts $i$
,
$i$
, $j = 1$
, 2 and 3 representing components in the in-line, traverse and spanwise directions, respectively;
$j = 1$
, 2 and 3 representing components in the in-line, traverse and spanwise directions, respectively; $\bar {p}$
is the filtered pressure;
$\bar {p}$
is the filtered pressure; $t$
is the time scale;
$t$
is the time scale; $x_i$
is the space scale in the
$x_i$
is the space scale in the $i$
-direction; the variable
$i$
-direction; the variable $\rho$
is the density of the flow; and
$\rho$
is the density of the flow; and $\nu$
is the kinematic viscosity. Large eddies are directly resolved with the LES method while the small eddies are modelled. The process by which large eddies cascade into smaller scales needs to take sub-grid viscosity into consideration. The subgrid-scale stress tensor
$\nu$
is the kinematic viscosity. Large eddies are directly resolved with the LES method while the small eddies are modelled. The process by which large eddies cascade into smaller scales needs to take sub-grid viscosity into consideration. The subgrid-scale stress tensor $\tau _{\textit{ij}}$
is defined as
$\tau _{\textit{ij}}$
is defined as $\tau _{\textit{ij}} = \overline {U_i U_j} - \bar {U_i}\bar {U_j}$
, which is unknown. The subgrid-scale turbulent stress is modelled according to
$\tau _{\textit{ij}} = \overline {U_i U_j} - \bar {U_i}\bar {U_j}$
, which is unknown. The subgrid-scale turbulent stress is modelled according to
 \begin{equation} \tau _{\textit{ij}} - \frac {1}{3}\tau _{kk} \delta _{\textit{ij}} = - 2\left ( {C_s \varDelta } \right )^2 \left | {\bar S} \right |\bar{S}_{\textit{ij}}. \end{equation}
Here, the Smagorinsky model (Smagorinsky Reference Smagorinsky1963) was selected to model the sub-grid eddy viscosity $\mu _{sgs}$
as
$\mu _{sgs}$
as
 \begin{equation} \mu _{sgs} = \rho \left ( {l_m } \right )^2 \left | {\bar S} \right |, \end{equation}
where $l_m$
is the sub-grid length scale defined as
$l_m$
is the sub-grid length scale defined as
 \begin{equation} \ l_m = C_s \varDelta , \end{equation}
where $ C_s$
is the Smagorinsky constant and
$ C_s$
is the Smagorinsky constant and $\varDelta$
is the filter width. The subgrid-scale stresses were modelled using the Smagorinsky constant
$\varDelta$
is the filter width. The subgrid-scale stresses were modelled using the Smagorinsky constant $C_s = 0.1$
supplemented by the Van Driest damping function in the present study, considering both the robustness of the simulation and the noise-prediction integrity. The Smagorinsky constant,
$C_s = 0.1$
supplemented by the Van Driest damping function in the present study, considering both the robustness of the simulation and the noise-prediction integrity. The Smagorinsky constant, $C_s$
, with a Van Driest near-wall damping function was adopted and has been shown to be sufficient for capturing the complex base and tip vortices in numerical studies of FWMCs with a free end (Afgan et al. Reference Afgan, Moulinec, Prosser and Laurence2007; Krajnović Reference Krajnović2011; Karthik et al. Reference Karthik, Vengadesan and Bhattacharyya2018), as well as in simulations of wavy cylinders (Lam & Lin Reference Lam and Lin2008; Lin et al. Reference Lin, Bai, Alam, Zhang and Lam2016; Zhu et al. Reference Zhu, Yuan, Hu, Yang and Xu2024). In addition, to ensure a stable and clean acoustic far field, particularly for flow-induced noise prediction of harbour seal vibrissal FWMCs, we argue that the constant Smagorinsky model with the Van Driest damping function represents a safer and more robust choice; this approach has also been adopted by Karthik et al. (Reference Karthik, Vengadesan and Bhattacharyya2018) and Chen et al. (Reference Chen, Doolan and Moreau2025b
) in numerical studies of the flow-induced noise of finite circular cylinders.
$C_s$
, with a Van Driest near-wall damping function was adopted and has been shown to be sufficient for capturing the complex base and tip vortices in numerical studies of FWMCs with a free end (Afgan et al. Reference Afgan, Moulinec, Prosser and Laurence2007; Krajnović Reference Krajnović2011; Karthik et al. Reference Karthik, Vengadesan and Bhattacharyya2018), as well as in simulations of wavy cylinders (Lam & Lin Reference Lam and Lin2008; Lin et al. Reference Lin, Bai, Alam, Zhang and Lam2016; Zhu et al. Reference Zhu, Yuan, Hu, Yang and Xu2024). In addition, to ensure a stable and clean acoustic far field, particularly for flow-induced noise prediction of harbour seal vibrissal FWMCs, we argue that the constant Smagorinsky model with the Van Driest damping function represents a safer and more robust choice; this approach has also been adopted by Karthik et al. (Reference Karthik, Vengadesan and Bhattacharyya2018) and Chen et al. (Reference Chen, Doolan and Moreau2025b
) in numerical studies of the flow-induced noise of finite circular cylinders.
The Smagorinsky constant, $C_s$
, is flow-dependent (Georgiadis, Rizzetta & Fureby Reference Georgiadis, Rizzetta and Fureby2010). A large value can lead to excessive damping of large-scale fluctuations in the presence of mean shear or in transitional regimes, whereas overly small values (
$C_s$
, is flow-dependent (Georgiadis, Rizzetta & Fureby Reference Georgiadis, Rizzetta and Fureby2010). A large value can lead to excessive damping of large-scale fluctuations in the presence of mean shear or in transitional regimes, whereas overly small values ( $C_s \lt 1$
) may cause convergence difficulties (Lam & Lin Reference Lam and Lin2008). In the present study, all simulations have been performed with
$C_s \lt 1$
) may cause convergence difficulties (Lam & Lin Reference Lam and Lin2008). In the present study, all simulations have been performed with $C_s = 0.1$
, following the noise-prediction study of Karthik et al. (Reference Karthik, Vengadesan and Bhattacharyya2018) for a finite circular cylinder, which is consistent with Lam & Lin (Reference Lam and Lin2008), who identified this value as suitable for turbulent wake simulations using the Smagorinsky model. Moreover, the Van Driest damping function reduces the overdamping of the model in the near wall (Lévêque et al. Reference Lévêque, Toschi, Shao and Bertoglio2007). The mesh-independence study for the harbour seal vibrissal FWMC of
$C_s = 0.1$
, following the noise-prediction study of Karthik et al. (Reference Karthik, Vengadesan and Bhattacharyya2018) for a finite circular cylinder, which is consistent with Lam & Lin (Reference Lam and Lin2008), who identified this value as suitable for turbulent wake simulations using the Smagorinsky model. Moreover, the Van Driest damping function reduces the overdamping of the model in the near wall (Lévêque et al. Reference Lévêque, Toschi, Shao and Bertoglio2007). The mesh-independence study for the harbour seal vibrissal FWMC of $\textit{AR} = 3.2$
, presented in Appendix A, further demonstrates that the present numerical set-up is adequate for predicting the flow-induced noise of vibrissal FWMCs.
$\textit{AR} = 3.2$
, presented in Appendix A, further demonstrates that the present numerical set-up is adequate for predicting the flow-induced noise of vibrissal FWMCs.
The filter width $\varDelta$
is usually taken to be
$\varDelta$
is usually taken to be
 \begin{equation} \Delta = \left ( \mbox{Volume} \right )^{\tfrac {1}{3}}, \end{equation}
where Volume is the volume of the filtered grid. The stress tensor is defined as
 \begin{equation} \bar S = \sqrt {2 \bar {S_{\textit{ij}}} \bar {S_{\textit{ij}}}}, \end{equation}
where $\bar {S_{\textit{ij}}}$
is the strain rate tensor. The finite volume method was employed to discretise the aforementioned LES model. The values
$\bar {S_{\textit{ij}}}$
is the strain rate tensor. The finite volume method was employed to discretise the aforementioned LES model. The values $[\boldsymbol{u}, p, \nu _t]$
were stored at the centre of the volume when constructing the fields. The equations were solved by using a second-order Gauss integration scheme to handle the divergence, gradient and Laplacian terms. Additionally, the second-order backward Euler method was applied for time discretisation. Therefore, the numerical discretisation method provided second-order accuracy in both the spatial and temporal dimensions. A combination of the pressure implicit with splitting of operator algorithm and the semi-implicit method for pressure linked equations was employed to decouple the pressure and velocity during the solution process. The flow-induced noise prediction was based on high-fidelity resolution of the flow fields. To predict the flow-induced noise accurately and efficiently, Ffowcs Williams & Hawkings (Reference Ffowcs Williams and Hawkings1969) rearranged the governing equations of the flow into wave equation form. The FW–H equation (Ffowcs Williams & Hawkings Reference Ffowcs Williams and Hawkings1969) is as follows:
$[\boldsymbol{u}, p, \nu _t]$
were stored at the centre of the volume when constructing the fields. The equations were solved by using a second-order Gauss integration scheme to handle the divergence, gradient and Laplacian terms. Additionally, the second-order backward Euler method was applied for time discretisation. Therefore, the numerical discretisation method provided second-order accuracy in both the spatial and temporal dimensions. A combination of the pressure implicit with splitting of operator algorithm and the semi-implicit method for pressure linked equations was employed to decouple the pressure and velocity during the solution process. The flow-induced noise prediction was based on high-fidelity resolution of the flow fields. To predict the flow-induced noise accurately and efficiently, Ffowcs Williams & Hawkings (Reference Ffowcs Williams and Hawkings1969) rearranged the governing equations of the flow into wave equation form. The FW–H equation (Ffowcs Williams & Hawkings Reference Ffowcs Williams and Hawkings1969) is as follows:
 \begin{equation} \Box ^2 p' = \frac {\partial }{\partial {t}}[\rho _0 \nu _n \delta (s)] - \frac {\partial }{\partial {x_i}}[p n_i \delta (s)] + \frac {\partial ^2}{\partial {x_i}\partial {x_j}}[H(s)T_{\textit{ij}}], \end{equation}
where $\Box ^2 = ( {1}/{{c_0}^2})( {\partial ^2p'}/{\partial {t^2}}) - {\nabla} ^2$
is the wave or D’Alembertian operator in three-dimensional space;
$\Box ^2 = ( {1}/{{c_0}^2})( {\partial ^2p'}/{\partial {t^2}}) - {\nabla} ^2$
is the wave or D’Alembertian operator in three-dimensional space; $p' = c^2\rho ' = c^2(\rho -\rho _0)$
is the acoustic pressure and
$p' = c^2\rho ' = c^2(\rho -\rho _0)$
is the acoustic pressure and $c_0$
and
$c_0$
and $\rho _0$
are the speed of sound and density in the undisturbed fluid, respectively. It is noted here that only if
$\rho _0$
are the speed of sound and density in the undisturbed fluid, respectively. It is noted here that only if $\rho ' / \rho _0 \lt \lt 1$
can
$\rho ' / \rho _0 \lt \lt 1$
can $p'$
be interpreted as the acoustic pressure. The present flow field is incompressible and hence
$p'$
be interpreted as the acoustic pressure. The present flow field is incompressible and hence $p'$
can be regarded as acoustic pressure. The vector
$p'$
can be regarded as acoustic pressure. The vector $\boldsymbol{n}$
is the unit outward normal of the surface of the structure, which satisfies
$\boldsymbol{n}$
is the unit outward normal of the surface of the structure, which satisfies $\boldsymbol{\nabla }s = \boldsymbol{n}$
as the surface is defined as
$\boldsymbol{\nabla }s = \boldsymbol{n}$
as the surface is defined as $s(\boldsymbol{x},t) = 0$
. It indicates that
$s(\boldsymbol{x},t) = 0$
. It indicates that $s\gt 0$
is outside the surface. Also,
$s\gt 0$
is outside the surface. Also, $\nu _n$
and
$\nu _n$
and $p$
are the local normal velocity and pressure on the surface, respectively. Functions
$p$
are the local normal velocity and pressure on the surface, respectively. Functions $H(s)$
and
$H(s)$
and $\delta (s)$
are the Heaviside and the Dirac delta functions, respectively. The term
$\delta (s)$
are the Heaviside and the Dirac delta functions, respectively. The term $T_{\textit{ij}} = \rho u_i u_j -\sigma _{\textit{ij}} + (p'-c^2\rho ')$
is the Lighthill stress tensor, where
$T_{\textit{ij}} = \rho u_i u_j -\sigma _{\textit{ij}} + (p'-c^2\rho ')$
is the Lighthill stress tensor, where $\sigma _{\textit{ij}}$
is the viscous stress tensor and
$\sigma _{\textit{ij}}$
is the viscous stress tensor and $\delta _{\textit{ij}}$
is Kronecker delta. The second-order derivation of
$\delta _{\textit{ij}}$
is Kronecker delta. The second-order derivation of $T_{\textit{ij}}$
indicates the quadrupole source. Additionally, the first and second items on the left of the equation are interpreted as the monopole and dipole sources, respectively.
$T_{\textit{ij}}$
indicates the quadrupole source. Additionally, the first and second items on the left of the equation are interpreted as the monopole and dipole sources, respectively.
To solve the FW–H equation efficiently, the Farassat 1A equation derived by Farassat (Reference Farassat2007) is one of the formulations of the solution. In the present study, the Farassat 1A formulation was adopted to perform numerical integration over the data surface for FW–H prediction. The data surfaces coincide with the solid wall boundaries of the cylinders. These data surfaces were assumed to be impermeable and non-vibrating, which means the normal velocity on the surface is zero ( $\nu _n = 0$
). The maximum variation of retarded time across the data surface is small compared with the characteristic time scale of the turbulent fluctuations. Consequently, the surface pressure fluctuations can be computed using incompressible flow simulations without compromising the accuracy of the acoustic prediction, as the temporal decorrelation between source emission and the observer is negligible for the present compact source configuration (Hajczak et al. Reference Hajczak, Sanders, Vuillot and Druault2021).
$\nu _n = 0$
). The maximum variation of retarded time across the data surface is small compared with the characteristic time scale of the turbulent fluctuations. Consequently, the surface pressure fluctuations can be computed using incompressible flow simulations without compromising the accuracy of the acoustic prediction, as the temporal decorrelation between source emission and the observer is negligible for the present compact source configuration (Hajczak et al. Reference Hajczak, Sanders, Vuillot and Druault2021).
2.2. Set-up of the simulations
Figure 2 shows the boundary condition arrangement and the TBL velocity profile. There are two independent computational domains. As can be seen from figure 2(a), the fully developed TBL was obtained by LES simulation using the precursor domain with a streamwise length of $108D$
. It should be noted here that the length of
$108D$
. It should be noted here that the length of $71.7D$
illustrated in figure 2(a) represents the distance from the inlet to the location of the extracted plane (
$71.7D$
illustrated in figure 2(a) represents the distance from the inlet to the location of the extracted plane ( $y{-}z$
plane) for the turbulent inlet of the FWMCs. In the cylinder computational domain, the transfer interface was set to be an inlet condition with time-varying data which were extracted on a transverse-flow plane (
$y{-}z$
plane) for the turbulent inlet of the FWMCs. In the cylinder computational domain, the transfer interface was set to be an inlet condition with time-varying data which were extracted on a transverse-flow plane ( $y{-}z$
plane) in the precursor simulation results.
$y{-}z$
plane) in the precursor simulation results.
The computational domain: (a) layout of the computational domain, (b) time-mean velocity at the cylinder position, (c) the present TBL profile in comparison with experimental results of Moreau & Doolan (Reference Moreau and Doolan2013) and 1/7th power law with its logarithmic form (inset). Here, $\omega$
denotes the vorticity magnitude.
$\omega$
denotes the vorticity magnitude.

For the mapping of the time-varying TBL inlet, the lengths of the major computational domain in the spanwise and transverse-flow directions were consistent with that of the precursor computational domain. The length of the computational domains in the transverse-flow direction reached $30D$
, which is sufficient for the development of the turbulence (Yauwenas et al. Reference Yauwenas, Porteous, Moreau and Doolan2019). The height of the computational domains was
$30D$
, which is sufficient for the development of the turbulence (Yauwenas et al. Reference Yauwenas, Porteous, Moreau and Doolan2019). The height of the computational domains was $50 D$
, which also follows the numerical setting of Yauwenas et al. (Reference Yauwenas, Porteous, Moreau and Doolan2019), who studied square FWMCs at a Reynolds number of 14 000.
$50 D$
, which also follows the numerical setting of Yauwenas et al. (Reference Yauwenas, Porteous, Moreau and Doolan2019), who studied square FWMCs at a Reynolds number of 14 000.
A free-stream velocity of $U_0$
= 30 m s−1 was set for the zero-pressure-gradient (ZPG) TBL simulation. The outlet for the precursor computational domain was set as pressure gradient of zero. The application of periodic boundary conditions was set for the sides of the computational domain. The upper boundary was a slip wall that serves as an ideal condition of infinite wall-normal height.
$U_0$
= 30 m s−1 was set for the zero-pressure-gradient (ZPG) TBL simulation. The outlet for the precursor computational domain was set as pressure gradient of zero. The application of periodic boundary conditions was set for the sides of the computational domain. The upper boundary was a slip wall that serves as an ideal condition of infinite wall-normal height.
The time-varying velocity inlet for the LES simulation of the FWMCs was defined based on data extracted from the TBL, as illustrated in figure 2(a). The upper and side boundaries of the FWMC simulation were consistent with the settings used in the TBL simulation, employing a slip wall condition for the upper boundary and cyclic boundary conditions for the side boundaries. A pressure outlet with a zero-gradient condition was also applied in the LES simulation of the FWMCs. The cylinder and the plate on which the cylinder is mounted were treated as walls with a no-slip boundary condition. Within the computational domain, the distance from the TBL inlet to the cylinder location was $8.33D$
. For consistency, time-varying turbulent boundary data should be extracted at a position upstream of
$8.33D$
. For consistency, time-varying turbulent boundary data should be extracted at a position upstream of $8.33D$
from the location where the contour and profile have been presented in figures 2(b) and 2(c). The origin of the present coordinate system is defined at the base centre of the harbour seal vibrissal FWMC. The streamwise and transverse-flow directions correspond to the
$8.33D$
from the location where the contour and profile have been presented in figures 2(b) and 2(c). The origin of the present coordinate system is defined at the base centre of the harbour seal vibrissal FWMC. The streamwise and transverse-flow directions correspond to the $x$
- and
$x$
- and $y$
-axis, respectively, while the
$y$
-axis, respectively, while the $z$
-axis extends along the spanwise direction of the FWMC, from the junction to the free tip.
$z$
-axis extends along the spanwise direction of the FWMC, from the junction to the free tip.
Forced transition from a laminar boundary layer to a TBL on the wall was necessary to obtain a boundary layer with parameters similar to those in the experiments of Moreau & Doolan (Reference Moreau and Doolan2013). Various tripping methods, such as tripping wires, sandpaper and blowing–suction, have been employed in the development of ZPG TBLs (Wolf & Lele Reference Wolf and Lele2012; Marusic et al. Reference Marusic, Chauhan, Kulandaivelu and Hutchins2015; Chen & He Reference Chen and He2023; Tang et al. Reference Tang, Jiang, Lu and Zhou2024). A blowing jet was used by Yauwenas et al. (Reference Yauwenas, Porteous, Moreau and Doolan2019) to introduce artificial perturbations and trigger the transition to trip the wall boundary layer for square FMWCs. In the present study, a tripping wire with square cross-section spans the entire domain width in the transverse-flow direction. The height of the tripping wire is $0.5D$
, as shown in figure 2(a). A similar tripping wire was also adopted by Chen & He (Reference Chen and He2023). No-slip wall boundary conditions were applied for the tripping wire and the wall.
$0.5D$
, as shown in figure 2(a). A similar tripping wire was also adopted by Chen & He (Reference Chen and He2023). No-slip wall boundary conditions were applied for the tripping wire and the wall.
Figure 2(a) also shows the instantaneous vortical flow structures from the tripping wire in the developed TBL inlet boundary for the following computational domain. The iso-surfaces have been visualised using the Q-criterion (Q = 500 000), coloured by instantaneous vorticity magnitude. It should be noted that the iso-surfaces shown in figure 2(a) do not fully represent the entire vortical structure. Figure 2(a) only depicts the vortical structures that develop from the tripping wire to the position where time-varying inlet data were extracted, which were then applied in the subsequent LES simulation of the FWMCs. The decay in the magnitude of vorticity downstream of the tripping wire indicates that the velocity field is recovering from the perturbations induced by the wake of the tripping wire.
Figure 2(b) shows the time-averaged streamwise velocity contour of the TBL at the cylinder location. The boundary layer thickness is defined as the distance from the side plate to the position where the flow velocity reaches 99 % of the free-stream velocity. A white line depicts the contour line of $ u/U_0 = 0.99$
in figure 2(b), demonstrating the thickness,
$ u/U_0 = 0.99$
in figure 2(b), demonstrating the thickness, $\delta = 1.6D$
(9.6 mm), which is consistent with the boundary layer thickness measured at the cylinder position by Moreau & Doolan (Reference Moreau and Doolan2013). For further comparison, the time-averaged velocity profile is compared with that of the boundary layer in Moreau & Doolan (Reference Moreau and Doolan2013) and the one-seventh power law for a TBL (Doolan & Moreau Reference Doolan and Moreau2022). The present boundary layer profile agrees well with the results of both experimental measurements and the one-seventh power law profile, as can be seen in figure 2(c), suggesting that the flow is well developed and in a turbulent state at the cylinder location. In addition, the inset provides the TBL profile in a logarithmic form with the non-dimensional velocity
$\delta = 1.6D$
(9.6 mm), which is consistent with the boundary layer thickness measured at the cylinder position by Moreau & Doolan (Reference Moreau and Doolan2013). For further comparison, the time-averaged velocity profile is compared with that of the boundary layer in Moreau & Doolan (Reference Moreau and Doolan2013) and the one-seventh power law for a TBL (Doolan & Moreau Reference Doolan and Moreau2022). The present boundary layer profile agrees well with the results of both experimental measurements and the one-seventh power law profile, as can be seen in figure 2(c), suggesting that the flow is well developed and in a turbulent state at the cylinder location. In addition, the inset provides the TBL profile in a logarithmic form with the non-dimensional velocity $u^+$
and distance
$u^+$
and distance $z^+$
. They are defined as
$z^+$
. They are defined as $u^+ = U/u_{\tau }$
,
$u^+ = U/u_{\tau }$
, $z^+ = zu_{\tau }/\nu$
, where the friction velocity
$z^+ = zu_{\tau }/\nu$
, where the friction velocity $u_{\tau } = \sqrt {\tau _w/\rho }$
;
$u_{\tau } = \sqrt {\tau _w/\rho }$
; $\tau _w$
is the wall shear stress. The laminar viscous sublayer of
$\tau _w$
is the wall shear stress. The laminar viscous sublayer of $u^+ = z^+$
and logarithmic law of
$u^+ = z^+$
and logarithmic law of $u^+ = 1/0.41 ln(z^+) + 5$
are depicted in dashed lines. The present TBL profile collapses along the law with a minor higher streamwise velocity in the region of
$u^+ = 1/0.41 ln(z^+) + 5$
are depicted in dashed lines. The present TBL profile collapses along the law with a minor higher streamwise velocity in the region of $ 30\lt z^+ \lt 100$
.
$ 30\lt z^+ \lt 100$
.
Figure 3 presents the mesh overview and resolution around the FWMC. The mesh for the precursor simulation of the TBL is shown as well. Completely orthogonal grids can be seen in the computational domain used for the TBL simulation, as shown in figure 3(a).
A C-grid blocking configuration was employed to discretise the computational domain, incorporating structured O-grids around the cylinder to ensure good orthogonal mesh quality around the FWMCs. Within the C-grid block, the number of nodes in the circumferential direction is $ 4 \times 45$
, which is consistent for all cylinders. In the radial direction, the first-layer grid spacing is maintained to achieve a
$ 4 \times 45$
, which is consistent for all cylinders. In the radial direction, the first-layer grid spacing is maintained to achieve a $y^+$
value of approximately 0.9, ensuring full resolution of the laminar sublayer, where
$y^+$
value of approximately 0.9, ensuring full resolution of the laminar sublayer, where $y^+$
represents the normalised viscous wall distance. The mesh distribution around the cylinder is presented in figure 3(b). The number of nodes in the radial direction of the O-grids is 55, with an expansion ratio of 1.05 within the O-block. The number of nodes in the spanwise direction (z-axis) varies depending on the aspect ratio.
$y^+$
represents the normalised viscous wall distance. The mesh distribution around the cylinder is presented in figure 3(b). The number of nodes in the radial direction of the O-grids is 55, with an expansion ratio of 1.05 within the O-block. The number of nodes in the spanwise direction (z-axis) varies depending on the aspect ratio.
Mesh configurations of FWMCs investigated in the present study.

Computational mesh (a) overview in the streamwise-sectional plane ( $y=0$
), (b) surface mesh around the cylinder from a top view. Contours of the spatial resolution in different sectional planes: (c) the streamwise-sectional plane of
$y=0$
), (b) surface mesh around the cylinder from a top view. Contours of the spatial resolution in different sectional planes: (c) the streamwise-sectional plane of $y=0$
, (d) the horizontal-sectional plane at nodal position (
$y=0$
, (d) the horizontal-sectional plane at nodal position ( $z/D = 14.5$
), (e) the horizontal-sectional plane at saddle position (
$z/D = 14.5$
), (e) the horizontal-sectional plane at saddle position ( $z/D = 13.3$
). A vibrassal FWMC with
$z/D = 13.3$
). A vibrassal FWMC with $\textit{AR} = 22.6$
is taken as an example. The spatial resolution is defined as the local mesh size
$\textit{AR} = 22.6$
is taken as an example. The spatial resolution is defined as the local mesh size $\sqrt [3]{\Delta x \Delta y\Delta z}$
to the Kolmogorov length scale
$\sqrt [3]{\Delta x \Delta y\Delta z}$
to the Kolmogorov length scale $\eta$
.
$\eta$
.

The number of nodes along the span of the cylinder, $N_z$
, ranges from
$N_z$
, ranges from $N_z$
= 65 for
$N_z$
= 65 for $\textit{AR}$
= 3.2 to
$\textit{AR}$
= 3.2 to $N_z$
= 438 for AR = 22.6. D’Alessandro et al. (Reference D’Alessandro, Montelpare and Ricci2016) suggested a minimum number of 48 cells every
$N_z$
= 438 for AR = 22.6. D’Alessandro et al. (Reference D’Alessandro, Montelpare and Ricci2016) suggested a minimum number of 48 cells every $\pi$
D to capture the streamwise vortex structures. The aspect ratio is abbreviated as
$\pi$
D to capture the streamwise vortex structures. The aspect ratio is abbreviated as $\textit{AR}$
in the present study, determined by the ratio of the span length of the FWMC to the diameter of the cylinder. Varying
$\textit{AR}$
in the present study, determined by the ratio of the span length of the FWMC to the diameter of the cylinder. Varying $\textit{AR}$
values from 3.2 to 22.6 are adopted to comprehensively examine the suppression of the flow-induced noise mechanism of the harbour seal vibrissal FWMCs. The detailed configurations of the FWMCs studied in the present study can be found in table 2.
$\textit{AR}$
values from 3.2 to 22.6 are adopted to comprehensively examine the suppression of the flow-induced noise mechanism of the harbour seal vibrissal FWMCs. The detailed configurations of the FWMCs studied in the present study can be found in table 2.
In the present study, the spanwise resolution of the three-dimensional mesh was more than sufficient. Figure 3(c–e) presents contours of spatial resolution in the streamwise-sectional plane of $y=0$
and two characterised horizontal-sectional planes, which are denoted as nodal and saddle planes. The grid resolution was compared with the Kolmogorov length scale, defined as
$y=0$
and two characterised horizontal-sectional planes, which are denoted as nodal and saddle planes. The grid resolution was compared with the Kolmogorov length scale, defined as $\eta = (\nu ^3 / \epsilon )^{1/4}$
, where
$\eta = (\nu ^3 / \epsilon )^{1/4}$
, where $\epsilon$
is the dissipation rate of turbulent kinetic energy. The highest ratio of local values is observed in the vortex shedding region, with a maximum value of 6.37. In the wake of the FWMC, the majority of the flow is resolved with a spatial resolution ranging from two to four Kolmogorov scales, which is sufficient to resolve the turbulence in the wake in flows interacting with bluff bodies (Cimarelli, Corsini & Stalio Reference Cimarelli, Corsini and Stalio2024).
$\epsilon$
is the dissipation rate of turbulent kinetic energy. The highest ratio of local values is observed in the vortex shedding region, with a maximum value of 6.37. In the wake of the FWMC, the majority of the flow is resolved with a spatial resolution ranging from two to four Kolmogorov scales, which is sufficient to resolve the turbulence in the wake in flows interacting with bluff bodies (Cimarelli, Corsini & Stalio Reference Cimarelli, Corsini and Stalio2024).
The time step is set to $1 \times 10^{-6}$
s ensuring the Courant–Friedrichs–Lewy number of less than 0.2, which corresponds to a Nyquist frequency of 500 kHz. This provides a sufficient physical temporal resolution
$1 \times 10^{-6}$
s ensuring the Courant–Friedrichs–Lewy number of less than 0.2, which corresponds to a Nyquist frequency of 500 kHz. This provides a sufficient physical temporal resolution $\Delta t^+ = u^2_\tau \Delta t/\nu \lt 1$
, where
$\Delta t^+ = u^2_\tau \Delta t/\nu \lt 1$
, where $u_\tau$
is the friction velocity (Georgiadis et al. Reference Georgiadis, Rizzetta and Fureby2010). The simulations were performed on the Gadi cluster of the Australian National Computational Infrastructure. The simulation for each case used 64 cores and was run for around 800 h for a physical time of 0.3 s after the simulation had reached a statistically steady state.
$u_\tau$
is the friction velocity (Georgiadis et al. Reference Georgiadis, Rizzetta and Fureby2010). The simulations were performed on the Gadi cluster of the Australian National Computational Infrastructure. The simulation for each case used 64 cores and was run for around 800 h for a physical time of 0.3 s after the simulation had reached a statistically steady state.
Locations of the observers denoted as red circular balls; (a) isometric view, (b) top view.

Figure 4 illustrates the configuration of the acoustic observers. A far-field acoustic observer array was deployed to capture the acoustic signals in the far field. All observers were positioned in a horizontal plane, with the height matching that used by Moreau & Doolan (Reference Moreau and Doolan2013), as shown in figure 4(a). The height of the observer plane above the mounting wall was $H_{ob} = 0.0679$
m. The array comprised 11 observers, covering a polar angle range from
$H_{ob} = 0.0679$
m. The array comprised 11 observers, covering a polar angle range from $\theta = 0^\circ$
to
$\theta = 0^\circ$
to $180^\circ$
, where
$180^\circ$
, where $\theta = 0^\circ$
corresponds to the streamwise direction. Figure 4(b) shows the radiated distance to the cylinder is 0.515 m, which is consistent with the microphone distance to the cylinder as well.
$\theta = 0^\circ$
corresponds to the streamwise direction. Figure 4(b) shows the radiated distance to the cylinder is 0.515 m, which is consistent with the microphone distance to the cylinder as well.
3. Results
The acoustic power spectral density (PSD) and directivities of the OASPLs are first presented in § 3.1. The recirculation zones, turbulent intensity, reattachment length on the free tip and vortex formation length are examined in § 3.2. This is followed by § 3.3, where cellular shedding behaviour is shown using surface lift force fluctuations on the side surface of the cylinder, and wake velocity spectra. To explain the reasons for observed differences in the circular and harbour seal vibrissal FWMC noise and vortex shedding behaviour, the instantaneous three-dimensional vortical structures are examined in § 3.4. The acoustic-coherent structures of FWMCs are visualised by coherent analysis in § 3.5. Finally, spanwise flow transportation is analysed by the surface flow pattern and the streamwise vortical structures in § 3.6.
3.1. Far-field acoustic analysis
3.1.1. Acoustic PSD
Figure 5 presents the far-field acoustic spectra of circular and vibrissal FWMCs of different aspect ratios. As observed for an infinite cylinder (Chen et al. Reference Chen, Liu, Zang and Azarpeyvand2025a
), the Aeolian tone is completely suppressed for vibrissal FWMCs across various aspect ratios. However, as shown in figures 5(c) and 5(d), this suppression effect is not evident for shorter cylinders. Specifically, the primary tone ‘P1’ and lower-amplitude secondary tone ‘P2’ produced by circular FWMCs, which are comprehensively discussed in Appendix A, are effectively suppressed for vibrissal FWMCs with $\textit{AR}$
= 12.9 and 22.6. However, as the aspect ratio decreases to
$\textit{AR}$
= 12.9 and 22.6. However, as the aspect ratio decreases to $\textit{AR}$
= 6.5, the acoustic spectra of the circular and vibrissal FWMCs exhibit similar amplitude. Additionally, a modest decrease in amplitude in broadband noise within the frequency range lower than 0.4 kHz is observed for the vibrissal FWMC in comparison with that of the circular FWMC. For
$\textit{AR}$
= 6.5, the acoustic spectra of the circular and vibrissal FWMCs exhibit similar amplitude. Additionally, a modest decrease in amplitude in broadband noise within the frequency range lower than 0.4 kHz is observed for the vibrissal FWMC in comparison with that of the circular FWMC. For $\textit{AR}$
= 3.2, the acoustic spectrum of the vibrissal FWMC is similar to its circular counterpart within the frequency range below 1.4 kHz, while beyond 2 kHz, the amplitude of the noise spectrum of vibrissal FWMC is higher than that of the circular FWMC.
$\textit{AR}$
= 3.2, the acoustic spectrum of the vibrissal FWMC is similar to its circular counterpart within the frequency range below 1.4 kHz, while beyond 2 kHz, the amplitude of the noise spectrum of vibrissal FWMC is higher than that of the circular FWMC.
Far-field acoustic spectra of the circular and vibrissal FWMCs of different aspect ratios: (a) $\textit{AR}$
= 22.6, (b)
$\textit{AR}$
= 22.6, (b) $\textit{AR}$
= 12.9, (c)
$\textit{AR}$
= 12.9, (c) $\textit{AR}$
= 6.5, (d)
$\textit{AR}$
= 6.5, (d) $\textit{AR}$
= 3.2. Here,
$\textit{AR}$
= 3.2. Here, $St$
refers to Strouhal number based on cylinder diameter.
$St$
refers to Strouhal number based on cylinder diameter.

3.1.2. Directivities of the overall sound pressure levels
For further insight into the acoustic characteristics of the vibrissal FWMC, additional observers were positioned at varying angles around the cylinder, as shown in figure 4. The acoustic signals measured directly above and below the cylinder were found to be similar in magnitude and out of phase, thus confirming the dipolar characteristics of the sound field. Directivity data obtained at observer angles from $0^\circ$
to
$0^\circ$
to $180^\circ$
are presented in figure 6 for circular and vibrissal FWMCs at different aspect ratios. The sound levels have been computed by integrating the acoustic pressure fluctuations,
$180^\circ$
are presented in figure 6 for circular and vibrissal FWMCs at different aspect ratios. The sound levels have been computed by integrating the acoustic pressure fluctuations, $p'$
, using the expression:
$p'$
, using the expression: $p'$
as
$p'$
as $10 log_{10} \int (\varPhi _{p'p'}/p_{ref}^{2}){\rm d}f$
, where the band centre frequency was selected as the peak frequency observed for circular FWMCs at each respective aspect ratio, spanning a range of 400 Hz. For cylinders with
$10 log_{10} \int (\varPhi _{p'p'}/p_{ref}^{2}){\rm d}f$
, where the band centre frequency was selected as the peak frequency observed for circular FWMCs at each respective aspect ratio, spanning a range of 400 Hz. For cylinders with $\textit{AR}$
= 6.5, the integration band central frequency was selected as 0.8 kHz, corresponding to the peak of the broadband hump observed in figure 5.
$\textit{AR}$
= 6.5, the integration band central frequency was selected as 0.8 kHz, corresponding to the peak of the broadband hump observed in figure 5.
Far-field acoustic directivities for the cylinders of different aspect ratios at the central peak frequencies: (a) $\textit{AR}$
= 22.6, P1, (b)
$\textit{AR}$
= 22.6, P1, (b) $\textit{AR}$
= 12.9, P1, (c)
$\textit{AR}$
= 12.9, P1, (c) $\textit{AR}$
= 22.6, P2, (d)
$\textit{AR}$
= 22.6, P2, (d) $\textit{AR}$
= 12.9, P2, (e)
$\textit{AR}$
= 12.9, P2, (e) $\textit{AR}$
= 6.5, 0.8 kHz, (f)
$\textit{AR}$
= 6.5, 0.8 kHz, (f) $\textit{AR}$
= 3.2, P1.
$\textit{AR}$
= 3.2, P1.

As shown in figure 6(a), the primary tone ‘P1’ of the vibrissal cylinder at $\textit{AR}$
= 22.6 is 24 dB lower than that of the circular cylinder, representing the maximum suppression observed in this study. A similar reduction in peak tonal magnitude was also reported by Smith et al. (Reference Smith, Chen and Zang2023), who applied the harbour seal vibrissa shape to infinite cylinders. The suppression effect for the primary tone ‘P1’ in vibrissal FWMCs is less pronounced at
$\textit{AR}$
= 22.6 is 24 dB lower than that of the circular cylinder, representing the maximum suppression observed in this study. A similar reduction in peak tonal magnitude was also reported by Smith et al. (Reference Smith, Chen and Zang2023), who applied the harbour seal vibrissa shape to infinite cylinders. The suppression effect for the primary tone ‘P1’ in vibrissal FWMCs is less pronounced at $\textit{AR}$
= 12.9, with an average noise reduction of 18.6 dB, as illustrated in figure 6(b). A similar trend is observed for the secondary tones at
$\textit{AR}$
= 12.9, with an average noise reduction of 18.6 dB, as illustrated in figure 6(b). A similar trend is observed for the secondary tones at $\textit{AR}$
= 22.6 and
$\textit{AR}$
= 22.6 and $\textit{AR}$
= 12.9. Specifically, the secondary tone ‘P2’ for the vibrissal cylinder with
$\textit{AR}$
= 12.9. Specifically, the secondary tone ‘P2’ for the vibrissal cylinder with $\textit{AR}$
= 22.6 is 10 dB lower than that of the circular cylinder, while only a 4.8 dB reduction is observed for vibrissal FWMCs with
$\textit{AR}$
= 22.6 is 10 dB lower than that of the circular cylinder, while only a 4.8 dB reduction is observed for vibrissal FWMCs with $\textit{AR}$
= 12.9. The directivity results demonstrate that the suppression mechanism is ineffective for cylinders with
$\textit{AR}$
= 12.9. The directivity results demonstrate that the suppression mechanism is ineffective for cylinders with $\textit{AR}$
of 6.5 and 3.2. For
$\textit{AR}$
of 6.5 and 3.2. For $\textit{AR}$
= 6.5, the peak noise level is comparable in magnitude to that of the circular cylinder within the observer angle range of
$\textit{AR}$
= 6.5, the peak noise level is comparable in magnitude to that of the circular cylinder within the observer angle range of $\theta = 45^\circ$
to
$\theta = 45^\circ$
to $145^\circ$
, as shown in figure 6(e). However, a reduction of approximately 10 dB is still observed at streamwise observer locations (
$145^\circ$
, as shown in figure 6(e). However, a reduction of approximately 10 dB is still observed at streamwise observer locations ( $\theta = 0^\circ$
and
$\theta = 0^\circ$
and $180^\circ$
) for vibrissal FWMCs relative to their circular counterparts. Notably, figure 6(f) shows that the peak magnitude of the vibrissal FWMC slightly exceeds that of the circular FWMC for
$180^\circ$
) for vibrissal FWMCs relative to their circular counterparts. Notably, figure 6(f) shows that the peak magnitude of the vibrissal FWMC slightly exceeds that of the circular FWMC for $\textit{AR}$
= 3.2 within the observer angle range of
$\textit{AR}$
= 3.2 within the observer angle range of $\theta = 45^\circ$
to
$\theta = 45^\circ$
to $145^\circ$
. For cylinders of such a short span, the undulated geometrical features are insufficient to span a full wavelength for the harbour seal vibrissa, potentially rendering the suppression mechanism ineffective and leading to comparable noise levels to the circular FWMC.
$145^\circ$
. For cylinders of such a short span, the undulated geometrical features are insufficient to span a full wavelength for the harbour seal vibrissa, potentially rendering the suppression mechanism ineffective and leading to comparable noise levels to the circular FWMC.
3.2. Time-averaged and the statistical flow quantities
3.2.1. Time-averaged velocity and fluctuations
Figure 7 presents the time-averaged streamwise velocity contours in $xOz$
plane (
$xOz$
plane ( $y$
= 0) embedded with streamlines visualised by the line integral convolution (LIC) method for the cylinders of different aspect ratios. To highlight the flow structures, white arrows are adopted to depict the flow directions. The recirculation zones (coloured with blue, suggesting negative streamwise velocity) of the vibrissal FWMC exhibit discontinuous spanwise distribution, in contrast to the spanwise-continuous distribution observed for the circular FWMCs. As the aspect ratio decreases from
$y$
= 0) embedded with streamlines visualised by the line integral convolution (LIC) method for the cylinders of different aspect ratios. To highlight the flow structures, white arrows are adopted to depict the flow directions. The recirculation zones (coloured with blue, suggesting negative streamwise velocity) of the vibrissal FWMC exhibit discontinuous spanwise distribution, in contrast to the spanwise-continuous distribution observed for the circular FWMCs. As the aspect ratio decreases from $\textit{AR}=$
22.6–3.2, the number of recirculation zones of the vibrissal FWMC is reduced from nine to one. Additionally, the recirculation zones tend to converge toward the saddle position of the vibrissal cylinder.
$\textit{AR}=$
22.6–3.2, the number of recirculation zones of the vibrissal FWMC is reduced from nine to one. Additionally, the recirculation zones tend to converge toward the saddle position of the vibrissal cylinder.
Time-averaged streamwise velocity contours in $xOz$
plane (
$xOz$
plane ( $y$
= 0) embedded with streamlines visualised by the line integral convolution method and close-up views of the tip flow region for various cylinders of different aspect ratios: (a) circular cylinder of
$y$
= 0) embedded with streamlines visualised by the line integral convolution method and close-up views of the tip flow region for various cylinders of different aspect ratios: (a) circular cylinder of $\textit{AR}$
= 22.6, (b) vibrissal cylinder of
$\textit{AR}$
= 22.6, (b) vibrissal cylinder of $\textit{AR}$
= 22.6, (c) circular cylinder of
$\textit{AR}$
= 22.6, (c) circular cylinder of $\textit{AR}$
= 12.9, (d) vibrissal cylinder of
$\textit{AR}$
= 12.9, (d) vibrissal cylinder of $\textit{AR}$
= 12.9, (e) circular cylinder of
$\textit{AR}$
= 12.9, (e) circular cylinder of $\textit{AR}$
= 6.5, (f) vibrissal cylinder of
$\textit{AR}$
= 6.5, (f) vibrissal cylinder of $\textit{AR}$
= 6.5, (g) circular cylinder of
$\textit{AR}$
= 6.5, (g) circular cylinder of $\textit{AR}$
= 3.2, (h) vibrissal cylinder of
$\textit{AR}$
= 3.2, (h) vibrissal cylinder of $\textit{AR}$
= 3.2.
$\textit{AR}$
= 3.2.

As shown in figure 7, the discontinuity in the recirculation zones in the vibrissal cases extends the streamwise recovery region for $\textit{AR} = 12.9$
and 22.6 (figure 7
b, d), and yields a recovery length comparable to that of the circular cylinder for
$\textit{AR} = 12.9$
and 22.6 (figure 7
b, d), and yields a recovery length comparable to that of the circular cylinder for $\textit{AR} = 6.5$
(figure 7
f). For
$\textit{AR} = 6.5$
(figure 7
f). For $\textit{AR} = 3.2$
, however, the recovery region contracts (figure 7
h), indicating weakened spanwise wake modulation at low aspect ratio. The circular cylinder with
$\textit{AR} = 3.2$
, however, the recovery region contracts (figure 7
h), indicating weakened spanwise wake modulation at low aspect ratio. The circular cylinder with $\textit{AR} = 6.5$
exhibits the longest recirculation zone of all cases, extending to
$\textit{AR} = 6.5$
exhibits the longest recirculation zone of all cases, extending to $x/D = 3.8$
at
$x/D = 3.8$
at $z/L \approx 0.25$
(figure 7
e). Additionally, the number of spanwise-intermittent recirculation zones, denoted by
$z/L \approx 0.25$
(figure 7
e). Additionally, the number of spanwise-intermittent recirculation zones, denoted by $N_{{rz}}$
, depends on the aspect-ratio-to-wavelength ratio (
$N_{{rz}}$
, depends on the aspect-ratio-to-wavelength ratio ( $\textit{AR}/\lambda$
). Within the range of cases considered here, this dependence is represented by a second-order polynomial fit, given in (3.1)
$\textit{AR}/\lambda$
). Within the range of cases considered here, this dependence is represented by a second-order polynomial fit, given in (3.1)
 \begin{equation} N_{rz} = -1.07+1.93 \frac {AR}{\lambda }-0.085 \left(\frac {AR}{\lambda }\right)^2. \end{equation}
In (3.1), the linear term is dominated by the intrinsic effect of the undulated geometry, whereas the remaining two terms account for end effects. The fitted polynomial indicates that, for vibrissal FWMCs in the present study, the spanwise length must exceed 1.72 $\lambda$
(
$\lambda$
( $\textit{AR} \approx$
4.8) for two intermittent recirculation zones to occur in the near wake.
$\textit{AR} \approx$
4.8) for two intermittent recirculation zones to occur in the near wake.
Furthermore, the appearance of multiple saddle points at the mid-span suggests a reduced influence of the two ends. For the longest circular cylinder, the flow between saddle points S1 and S2 is predominantly horizontal. Similarly, spanwise flow observed between S1 and S5 in the vibrissal FWMC (figure 7) is governed primarily by intrinsic geometric effects rather than by end-induced motion. However, as the aspect ratio decreases, the upwash from the free tip and the downwash generated at the wall junction become increasingly pronounced. For short cylinders ( $\textit{AR} = 6.5$
and 3.2), the streamwise extent of the recirculation zone in the vibrissal FWMC is no longer greater than that of the corresponding circular configuration, indicating a diminished influence of the harbour seal vibrissa-inspired geometry.
$\textit{AR} = 6.5$
and 3.2), the streamwise extent of the recirculation zone in the vibrissal FWMC is no longer greater than that of the corresponding circular configuration, indicating a diminished influence of the harbour seal vibrissa-inspired geometry.
For a deeper understanding of the near wake of the vibrissal FWMCs, the free end vortex $V_f$
and the additional vortical structures are shown in figure 7, with vortex cores marked by red crosses. Compared with the circular cases, the
$V_f$
and the additional vortical structures are shown in figure 7, with vortex cores marked by red crosses. Compared with the circular cases, the $V_f$
in the separation bubble, which was also investigated by Krajnović (Reference Krajnović2011), is consistently thinner, and the reattachment point, highlighted with yellow triangle in the close-up views of figure 7, is located approximately one third of the free tip length upstream of the trailing edge (except for
$V_f$
in the separation bubble, which was also investigated by Krajnović (Reference Krajnović2011), is consistently thinner, and the reattachment point, highlighted with yellow triangle in the close-up views of figure 7, is located approximately one third of the free tip length upstream of the trailing edge (except for $\textit{AR} = 12.9$
). For the short cylinders (
$\textit{AR} = 12.9$
). For the short cylinders ( $\textit{AR} = 3.2$
and 6.5), two small-scale tip vortices
$\textit{AR} = 3.2$
and 6.5), two small-scale tip vortices $V_{f1}$
and
$V_{f1}$
and $V_{f2}$
are observed in the separation bubble region, producing a very thin recirculation region above the free end and for
$V_{f2}$
are observed in the separation bubble region, producing a very thin recirculation region above the free end and for $\textit{AR} = 3.2$
, an additional reattachment point.
$\textit{AR} = 3.2$
, an additional reattachment point.
The vortex just below the free end of the cylinder $B_t$
and base vortex
$B_t$
and base vortex $N_w$
have been extensively documented for circular FWMCs (Krajnović Reference Krajnović2011; Rostamy et al. Reference Rostamy, Sumner, Bergstrom and Bugg2012; Sumner Reference Sumner2013; Beitel, Heng & Sumner Reference Beitel, Heng and Sumner2019) and correspond to the primary
$N_w$
have been extensively documented for circular FWMCs (Krajnović Reference Krajnović2011; Rostamy et al. Reference Rostamy, Sumner, Bergstrom and Bugg2012; Sumner Reference Sumner2013; Beitel, Heng & Sumner Reference Beitel, Heng and Sumner2019) and correspond to the primary $N1$
and secondary
$N1$
and secondary $N2$
vortices in Liu (Reference Liu2024). In contrast to the circular FWMCs, the base vortex
$N2$
vortices in Liu (Reference Liu2024). In contrast to the circular FWMCs, the base vortex $N_w$
and the vortex beneath the free end
$N_w$
and the vortex beneath the free end $B_t$
are largely suppressed and vortex
$B_t$
are largely suppressed and vortex $B_t$
appears only at
$B_t$
appears only at $\textit{AR} = 12.9$
, indicating a substantial modification of the near-wake topology by the undulated geometry.
$\textit{AR} = 12.9$
, indicating a substantial modification of the near-wake topology by the undulated geometry.
Additional mid-span vortices, denoted $B_v$
, occur together with the saddle points and typically form counter-rotating pairs between adjacent recirculation zones. Their rotation is predominantly negative near the free tip and positive near the wall junction, demonstrating that the geometry-induced spanwise swirling of the shear layer opposes the upwash and downwash from the two ends. This geometric control weakens as
$B_v$
, occur together with the saddle points and typically form counter-rotating pairs between adjacent recirculation zones. Their rotation is predominantly negative near the free tip and positive near the wall junction, demonstrating that the geometry-induced spanwise swirling of the shear layer opposes the upwash and downwash from the two ends. This geometric control weakens as $\textit{AR}$
decreases and becomes negligible at
$\textit{AR}$
decreases and becomes negligible at $\textit{AR} = 3.2$
.
$\textit{AR} = 3.2$
.
Time-averaged streamwise velocity fluctuation contours in the $xOz$
plane (
$xOz$
plane ( $y$
= 0) embedded with streamlines visualised by the LIC method for cylinders of different aspect ratios: (a) circular cylinder of
$y$
= 0) embedded with streamlines visualised by the LIC method for cylinders of different aspect ratios: (a) circular cylinder of $\textit{AR}$
= 22.6, (b) vibrissal cylinder of
$\textit{AR}$
= 22.6, (b) vibrissal cylinder of $\textit{AR}$
= 22.6, (c) circular cylinder of
$\textit{AR}$
= 22.6, (c) circular cylinder of $\textit{AR}$
= 12.9, (d) vibrissal cylinder of
$\textit{AR}$
= 12.9, (d) vibrissal cylinder of $\textit{AR}$
= 12.9, (e) circular cylinder of
$\textit{AR}$
= 12.9, (e) circular cylinder of $\textit{AR}$
= 6.5, (f) vibrissal cylinder of
$\textit{AR}$
= 6.5, (f) vibrissal cylinder of $\textit{AR}$
= 6.5, (g) circular cylinder of
$\textit{AR}$
= 6.5, (g) circular cylinder of $\textit{AR}$
= 3.2, (h) vibrissal cylinder of
$\textit{AR}$
= 3.2, (h) vibrissal cylinder of $\textit{AR}$
= 3.2.
$\textit{AR}$
= 3.2.

To examine the turbulence intensity and the near-wake fluctuations, contours of the time-averaged fluctuating streamwise velocity are shown in figure 8. As the streamwise velocity fluctuations are aligned with the mean flow direction, they serve as an indicator of wake recovery and are used to determine the wake formation length for the different FWMCs (Rostamy et al. Reference Rostamy, Sumner, Bergstrom and Bugg2012; Porteous et al. Reference Porteous, Moreau and Doolan2017), as discussed in the following section. Furthermore, the streamwise velocity fluctuations are sufficient to characterise the turbulent fluctuations around the free end and in the near wake.
As can be seen in figure 8, eight and four interconnected, intermittent ‘C’-shaped zones of high streamwise velocity fluctuations are observed for $\textit{AR}$
= 22.6 and 12.9, respectively, arranged in a spanwise array, with peak magnitudes reaching only approximately half of those in the wakes of the corresponding circular cylinders. This reduction accounts for the attenuation of broadband noise in the long-cylinder cases. Additionally, for the short cylinders (
$\textit{AR}$
= 22.6 and 12.9, respectively, arranged in a spanwise array, with peak magnitudes reaching only approximately half of those in the wakes of the corresponding circular cylinders. This reduction accounts for the attenuation of broadband noise in the long-cylinder cases. Additionally, for the short cylinders ( $\textit{AR} = 6.5$
and
$\textit{AR} = 6.5$
and $3.2$
), regions of high-amplitude fluctuations appear above the free tip and persist downstream in the wakes of the circular FWMCs, whereas they are absent for the vibrissal configurations. However, a thin fluctuating layer is observed above the free end only at
$3.2$
), regions of high-amplitude fluctuations appear above the free tip and persist downstream in the wakes of the circular FWMCs, whereas they are absent for the vibrissal configurations. However, a thin fluctuating layer is observed above the free end only at $\textit{AR} = 12.9$
for the vibrissal FWMC, indicating the presence of vortex shedding.
$\textit{AR} = 12.9$
for the vibrissal FWMC, indicating the presence of vortex shedding.
Variation of characteristic flow lengths near the free end and within the wake: (a) reattachment length ( $X_r$
) of the top flow, (b) wake formation length (
$X_r$
) of the top flow, (b) wake formation length ( $L_f/D$
) at the mid-span of the FWMC as a function of aspect ratio.
$L_f/D$
) at the mid-span of the FWMC as a function of aspect ratio.

3.2.2. Reattachment and vortex formation length
To elucidate the influence of aspect ratio and cylinder geometry on the near wake, the reattachment length of the flow separated from the free tip, denoted by $X_r$
, and the vortex formation length,
$X_r$
, and the vortex formation length, $L_f$
, are presented in figure 9. Because the streamwise extension of the free end varies with aspect ratio, resulting in different spanwise phases of the harbour seal vibrissa,
$L_f$
, are presented in figure 9. Because the streamwise extension of the free end varies with aspect ratio, resulting in different spanwise phases of the harbour seal vibrissa, $X_r$
is defined here as the distance from the front-edge point to the reattachment saddle point along the centreline of the free end surface.
$X_r$
is defined here as the distance from the front-edge point to the reattachment saddle point along the centreline of the free end surface.
Figure 9(a) shows that, for the circular FWMCs, the reattachment length remains approximately constant at $X_r/D \approx 0.9$
for all aspect ratios. In contrast, the vibrissal FWMCs exhibit a clear dependence on aspect ratio. Specifically,
$X_r/D \approx 0.9$
for all aspect ratios. In contrast, the vibrissal FWMCs exhibit a clear dependence on aspect ratio. Specifically, $X_r$
increases as
$X_r$
increases as $\textit{AR}$
rises from 3.2 to 12.9, reaches a maximum at
$\textit{AR}$
rises from 3.2 to 12.9, reaches a maximum at $\textit{AR} = 12.9$
and then decreases to a value comparable to that at
$\textit{AR} = 12.9$
and then decreases to a value comparable to that at $\textit{AR} = 6.5$
when
$\textit{AR} = 6.5$
when $\textit{AR} = 22.6$
. For
$\textit{AR} = 22.6$
. For $\textit{AR} = 3.2$
, two reattachment points are observed, leading to a bifurcation at
$\textit{AR} = 3.2$
, two reattachment points are observed, leading to a bifurcation at $X_r/D = 0.22$
.
$X_r/D = 0.22$
.
Compared with the circular counterparts at the same aspect ratios, the vibrissal configurations exhibit similar reattachment lengths excluding the double reattachment at $\textit{AR} = 3.2$
and the
$\textit{AR} = 3.2$
and the $\textit{AR} = 12.9$
case. The streamwise stretching of the vibrissal geometry causes the reattachment on the top surface to occur further from the trailing edge. This earlier reattachment promotes a more stable shear layer over the free end and is consistent with the reduced turbulent fluctuations observed for
$\textit{AR} = 12.9$
case. The streamwise stretching of the vibrissal geometry causes the reattachment on the top surface to occur further from the trailing edge. This earlier reattachment promotes a more stable shear layer over the free end and is consistent with the reduced turbulent fluctuations observed for $\textit{AR} = 3.2$
, 6.5 and 22.6. The different behaviour at
$\textit{AR} = 3.2$
, 6.5 and 22.6. The different behaviour at $\textit{AR} = 12.9$
arises because the free end is located within the half-wavelength region from the nodal plane to saddle plane, producing a contraction towards the tip; in the other cases, the free end lies in the phase from saddle to nodal, forming a protracted tip geometry. Consistent with the findings of Taylor, Gurka & Kopp (Reference Taylor, Gurka and Kopp2014), a thicker and blunter leading edge increases the size of the separation bubble and delays reattachment of flow over buildings. At
$\textit{AR} = 12.9$
arises because the free end is located within the half-wavelength region from the nodal plane to saddle plane, producing a contraction towards the tip; in the other cases, the free end lies in the phase from saddle to nodal, forming a protracted tip geometry. Consistent with the findings of Taylor, Gurka & Kopp (Reference Taylor, Gurka and Kopp2014), a thicker and blunter leading edge increases the size of the separation bubble and delays reattachment of flow over buildings. At $\textit{AR} = 12.9$
, the contraction effectively produces a thicker leading edge at the free end, shifting the reattachment point downstream and leaving insufficient streamwise length for the shear layer to stabilise.
$\textit{AR} = 12.9$
, the contraction effectively produces a thicker leading edge at the free end, shifting the reattachment point downstream and leaving insufficient streamwise length for the shear layer to stabilise.
The vortex formation length, $L_f$
, is determined from the streamwise location of the maximum turbulence intensity at
$L_f$
, is determined from the streamwise location of the maximum turbulence intensity at $z/L = 0.5$
, following approaches commonly adopted in previous studies (Hosseini, Bourgeois & Martinuzzi Reference Hosseini, Bourgeois and Martinuzzi2013; Porteous et al. Reference Porteous, Moreau and Doolan2017). As this spanwise position does not coincide with the two characteristic cross-sections of the undulated geometry, the values of
$z/L = 0.5$
, following approaches commonly adopted in previous studies (Hosseini, Bourgeois & Martinuzzi Reference Hosseini, Bourgeois and Martinuzzi2013; Porteous et al. Reference Porteous, Moreau and Doolan2017). As this spanwise position does not coincide with the two characteristic cross-sections of the undulated geometry, the values of $L_f$
at the nodal and saddle planes closest to
$L_f$
at the nodal and saddle planes closest to $z/L = 0.5$
are shown as error bars in figure 9(b). For
$z/L = 0.5$
are shown as error bars in figure 9(b). For $\textit{AR} = 22.6$
,
$\textit{AR} = 22.6$
, $L_f$
exceeds that of the circular FWMC. At
$L_f$
exceeds that of the circular FWMC. At $\textit{AR} = 12.9$
, the saddle-plane value of
$\textit{AR} = 12.9$
, the saddle-plane value of $L_f$
also remains longer than that of the circular counterpart. In contrast, for the short cylinders, the circular FWMCs exhibit a longer vortex formation length. Previous studies by Lam & Lin (Reference Lam and Lin2009) and Essel, Tachie & Balachandar (Reference Essel, Tachie and Balachandar2021) showed that an elongated vortex formation length stabilises the shear layer and suppresses vortex shedding for an infinite wavy cylinder and circular FWMCs, respectively. The variations in
$L_f$
also remains longer than that of the circular counterpart. In contrast, for the short cylinders, the circular FWMCs exhibit a longer vortex formation length. Previous studies by Lam & Lin (Reference Lam and Lin2009) and Essel, Tachie & Balachandar (Reference Essel, Tachie and Balachandar2021) showed that an elongated vortex formation length stabilises the shear layer and suppresses vortex shedding for an infinite wavy cylinder and circular FWMCs, respectively. The variations in $L_f$
shown in figure 9(b) therefore indicate that the disappearance of the primary tonal peak in the acoustic spectra (figure 5) is closely linked to suppression of vortex shedding in the wake.
$L_f$
shown in figure 9(b) therefore indicate that the disappearance of the primary tonal peak in the acoustic spectra (figure 5) is closely linked to suppression of vortex shedding in the wake.
3.3. Cellular vortex shedding analysis
3.3.1. Aerodynamic force
For an illustration of the pressure fluctuations on the cylinder surface, figure 10 presents the spatio-temporal distributions of the lift force coefficients for cylinders with different aspect ratios. The lift force coefficients have been used to indicate cylinder vortex shedding modes (Williamson & Goverdhan Reference Williamson and Goverdhan2004; Chen et al. Reference Chen, Wang and Liu2024). The fluctuating force pattern is strongly dependent on the spanwise location for long cylinders ( $\textit{AR}$
= 12.9, 22.6) and this behaviour is referred to as ‘cellular shedding’, which has been widely observed for circular FWMCs (Sumner, Heseltine & Dansereau Reference Sumner, Heseltine and Dansereau2004; Moreau & Doolan Reference Moreau and Doolan2013).
$\textit{AR}$
= 12.9, 22.6) and this behaviour is referred to as ‘cellular shedding’, which has been widely observed for circular FWMCs (Sumner, Heseltine & Dansereau Reference Sumner, Heseltine and Dansereau2004; Moreau & Doolan Reference Moreau and Doolan2013).
For $\textit{AR}$
= 22.6, vertical bands of fluctuating lift span from
$\textit{AR}$
= 22.6, vertical bands of fluctuating lift span from $z/L$
= 0.2 to 0.8 for the circular FWMC, as shown in figure 10(a). These bands are indicative of the dominant shedding pattern responsible for the primary Aeolian tone, periodic von Kármán vortex shedding. Additionally, a lower-frequency shedding region is observed near the free end, specifically within
$z/L$
= 0.2 to 0.8 for the circular FWMC, as shown in figure 10(a). These bands are indicative of the dominant shedding pattern responsible for the primary Aeolian tone, periodic von Kármán vortex shedding. Additionally, a lower-frequency shedding region is observed near the free end, specifically within $0.8 \lt z/L \lt 1$
, while shedding near the wall junction becomes increasingly intermittent. In contrast, In figure 10(b) for the vibrissal FWMC, the spatio-temporal distribution of the lift force displays a chaotic wavepacket pattern with significantly weaker fluctuations, indicating strong suppression of spanwise-periodic vortex shedding. This suppression extends to both the free tip and wall-junction regions. While the force fluctuation patterns near the two ends resemble those of the circular FWMC at the same aspect ratio, they are reduced in magnitude and more spatially confined.
$0.8 \lt z/L \lt 1$
, while shedding near the wall junction becomes increasingly intermittent. In contrast, In figure 10(b) for the vibrissal FWMC, the spatio-temporal distribution of the lift force displays a chaotic wavepacket pattern with significantly weaker fluctuations, indicating strong suppression of spanwise-periodic vortex shedding. This suppression extends to both the free tip and wall-junction regions. While the force fluctuation patterns near the two ends resemble those of the circular FWMC at the same aspect ratio, they are reduced in magnitude and more spatially confined.
Spatio-temporal distributions of the lift force coefficients for cylinders of different aspect ratios: (a) circular cylinder of AR = 22.6, (b) vibrissal cylinder of $\textit{AR}$
= 22.6, (c) circular cylinder of
$\textit{AR}$
= 22.6, (c) circular cylinder of $\textit{AR}$
= 12.9, (d) vibrissal cylinder of
$\textit{AR}$
= 12.9, (d) vibrissal cylinder of $\textit{AR}$
= 12.9, (e) circular cylinder of
$\textit{AR}$
= 12.9, (e) circular cylinder of $\textit{AR}$
= 6.5, (f) vibrissal cylinder of
$\textit{AR}$
= 6.5, (f) vibrissal cylinder of $\textit{AR}$
= 6.5, (g) circular cylinder of
$\textit{AR}$
= 6.5, (g) circular cylinder of $\textit{AR}$
= 3.2, (h) vibrissal cylinder of
$\textit{AR}$
= 3.2, (h) vibrissal cylinder of $\textit{AR}$
= 3.2.
$\textit{AR}$
= 3.2.

Suppression of lift force fluctuations in the mid-span region is observed for the vibrissal FWMC with $\textit{AR} = 12.9$
, in comparison with its circular counterpart, as shown in figures 10(c) and 10(d). For the circular FWMC of this aspect ratio, two prominent vortex shedding regions are identified: one near the free tip, spanning
$\textit{AR} = 12.9$
, in comparison with its circular counterpart, as shown in figures 10(c) and 10(d). For the circular FWMC of this aspect ratio, two prominent vortex shedding regions are identified: one near the free tip, spanning $0.6 \lt z/L \lt 1$
, and another extending from the wall junction to
$0.6 \lt z/L \lt 1$
, and another extending from the wall junction to $z/L = 0.6$
. The shedding near the free tip exhibits greater intensity than both the lower-span region and the corresponding region in the circular FWMC with
$z/L = 0.6$
. The shedding near the free tip exhibits greater intensity than both the lower-span region and the corresponding region in the circular FWMC with $\textit{AR} = 22.6$
. Interestingly, the vibrissal FWMC still displays three distinct shedding regions. Near the free tip (
$\textit{AR} = 22.6$
. Interestingly, the vibrissal FWMC still displays three distinct shedding regions. Near the free tip ( $0.75 \lt z/L \lt 1$
), an intermittent fluctuation pattern is observed. A region of lower-frequency intermittent shedding also appears near the wall junction (
$0.75 \lt z/L \lt 1$
), an intermittent fluctuation pattern is observed. A region of lower-frequency intermittent shedding also appears near the wall junction ( $0 \lt z/L \lt 0.25$
) and in the mid-span region of the vibrissal FWMC (
$0 \lt z/L \lt 0.25$
) and in the mid-span region of the vibrissal FWMC ( $0.25 \lt z/L \lt 0.75$
), a chaotic wavepacket pattern with very weak amplitude is evident, as shown in figure 10(d).
$0.25 \lt z/L \lt 0.75$
), a chaotic wavepacket pattern with very weak amplitude is evident, as shown in figure 10(d).
For $\textit{AR} = 6.5$
, as shown in figures 10(e) and 10(f), it is noteworthy that both the circular and vibrissal FWMCs exhibit a wavepacket pattern in the spatio-temporal distribution of the lift forces. The circular FWMC displays a double-wavepacket mode, indicating two distinct spanwise regions of high fluctuation amplitude, primarily located within
$\textit{AR} = 6.5$
, as shown in figures 10(e) and 10(f), it is noteworthy that both the circular and vibrissal FWMCs exhibit a wavepacket pattern in the spatio-temporal distribution of the lift forces. The circular FWMC displays a double-wavepacket mode, indicating two distinct spanwise regions of high fluctuation amplitude, primarily located within $0.1 \lt z/{}L \lt 0.8$
. In contrast, the vibrissal FWMC demonstrates a triple-wavepacket mode extending across the entire span for most of the time. Further, the shedding components in the wavepacket shedding pattern are interconnected with each other. For
$0.1 \lt z/{}L \lt 0.8$
. In contrast, the vibrissal FWMC demonstrates a triple-wavepacket mode extending across the entire span for most of the time. Further, the shedding components in the wavepacket shedding pattern are interconnected with each other. For $\textit{AR} = 12.9$
and
$\textit{AR} = 12.9$
and $\textit{AR} = 22.6$
, suppression of classical periodic von Kármán vortex shedding gives rise to this spanwise interconnected wavepacket shedding behaviour, which is of relatively weak strength.
$\textit{AR} = 22.6$
, suppression of classical periodic von Kármán vortex shedding gives rise to this spanwise interconnected wavepacket shedding behaviour, which is of relatively weak strength.
The shedding pattern of the circular FWMC of $\textit{AR} = 3.2$
is characterised by vertical bands, as shown in figure 10(g). However, unlike the circular FWMC with
$\textit{AR} = 3.2$
is characterised by vertical bands, as shown in figure 10(g). However, unlike the circular FWMC with $\textit{AR} = 22.6$
, which exhibits consistent alternations of positive and negative lift fluctuations within
$\textit{AR} = 22.6$
, which exhibits consistent alternations of positive and negative lift fluctuations within $0.1 \lt z/L \lt 0.8$
, the shedding strength for
$0.1 \lt z/L \lt 0.8$
, the shedding strength for $\textit{AR} = 3.2$
varies significantly in both time and spanwise direction. Furthermore, the lift force fluctuations of the vibrissal FWMC exhibit larger amplitudes than those of its circular counterpart, as illustrated in figures 10(g) and 10(h). This indicates that the vortex shedding suppression mechanism observed at higher aspect ratios is no longer effective at
$\textit{AR} = 3.2$
varies significantly in both time and spanwise direction. Furthermore, the lift force fluctuations of the vibrissal FWMC exhibit larger amplitudes than those of its circular counterpart, as illustrated in figures 10(g) and 10(h). This indicates that the vortex shedding suppression mechanism observed at higher aspect ratios is no longer effective at $\textit{AR} = 3.2$
. The shedding region for the vibrissal FWMC extends across a wider spanwise range of
$\textit{AR} = 3.2$
. The shedding region for the vibrissal FWMC extends across a wider spanwise range of $0.2 \lt z/L \lt 0.9$
, in contrast to the more confined shedding region of the circular FWMC, which is limited to
$0.2 \lt z/L \lt 0.9$
, in contrast to the more confined shedding region of the circular FWMC, which is limited to $0.2 \lt z/L \lt 0.8$
.
$0.2 \lt z/L \lt 0.8$
.
3.3.2. Vortex shedding frequency
Figure 11 presents the fast Fourier transform results of velocity probes in the wake of cylinders with different aspect ratios. These probes were arranged as spanwise lines in the $x{-}z$
plane (
$x{-}z$
plane ( $y=0$
), positioned
$y=0$
), positioned $3.5D$
apart in the streamwise direction towards the cylinder centre. The cellular shedding from different regions of the circular FWMC is consistent with observations from hot-wire measurements in the wake, as reported by Moreau & Doolan (Reference Moreau and Doolan2013). Three shedding cells are identified for the circular FWMC with
$3.5D$
apart in the streamwise direction towards the cylinder centre. The cellular shedding from different regions of the circular FWMC is consistent with observations from hot-wire measurements in the wake, as reported by Moreau & Doolan (Reference Moreau and Doolan2013). Three shedding cells are identified for the circular FWMC with $\textit{AR}$
= 22.6, similar to the spectral maps of fluctuating wake velocity illustrated by Yauwenas et al. (Reference Yauwenas, Porteous, Moreau and Doolan2019) for a square FWMC with
$\textit{AR}$
= 22.6, similar to the spectral maps of fluctuating wake velocity illustrated by Yauwenas et al. (Reference Yauwenas, Porteous, Moreau and Doolan2019) for a square FWMC with $\textit{AR}$
= 21.9. As shown in figure 11(a), the tip-shedding cell appears at
$\textit{AR}$
= 21.9. As shown in figure 11(a), the tip-shedding cell appears at $z/L$
= 0.85 and is distinct from the mid-span shedding cell, which spans from
$z/L$
= 0.85 and is distinct from the mid-span shedding cell, which spans from $z/L$
= 0.1 to 0.8. A third weak shedding cell is located near the junction, adjacent to the mid-span cell. For the vibrissal cylinder at this aspect ratio, both the tip and junction shedding cells are absent, as illustrated in figure 11(b), this corresponds to the disappearance of secondary tonal peaks in the acoustic spectrum of vibrissal FWMC of
$z/L$
= 0.1 to 0.8. A third weak shedding cell is located near the junction, adjacent to the mid-span cell. For the vibrissal cylinder at this aspect ratio, both the tip and junction shedding cells are absent, as illustrated in figure 11(b), this corresponds to the disappearance of secondary tonal peaks in the acoustic spectrum of vibrissal FWMC of $\textit{AR}$
= 22.6. Additionally, five intermittent shedding cells are observed in the mid-span region (0.18
$\textit{AR}$
= 22.6. Additionally, five intermittent shedding cells are observed in the mid-span region (0.18 $ \lt z/L \lt$
0.8) of the vibrissal FWMC, periodically distributed at a Strouhal number of
$ \lt z/L \lt$
0.8) of the vibrissal FWMC, periodically distributed at a Strouhal number of $St = 0.25$
. The height of the centres of these cells has a strong correlation with the saddle position of the vibrissal FWMC.
$St = 0.25$
. The height of the centres of these cells has a strong correlation with the saddle position of the vibrissal FWMC.
Fast Fourier transform results of velocity probes in the wake for cylinders of different aspect ratios: (a) circular cylinder of $\textit{AR}$
= 22.6, (b) vibrissal cylinder of
$\textit{AR}$
= 22.6, (b) vibrissal cylinder of $\textit{AR}$
= 22.6, (c) circular cylinder of
$\textit{AR}$
= 22.6, (c) circular cylinder of $\textit{AR}$
= 12.9, (d) vibrissal cylinder of
$\textit{AR}$
= 12.9, (d) vibrissal cylinder of $\textit{AR}$
= 12.9, (e) circular cylinder of
$\textit{AR}$
= 12.9, (e) circular cylinder of $\textit{AR}$
= 6.5, (f) vibrissal cylinder of
$\textit{AR}$
= 6.5, (f) vibrissal cylinder of $\textit{AR}$
= 6.5, (g) circular cylinder of
$\textit{AR}$
= 6.5, (g) circular cylinder of $\textit{AR}$
= 3.2, (h) vibrissal cylinder of
$\textit{AR}$
= 3.2, (h) vibrissal cylinder of $\textit{AR}$
= 3.2.
$\textit{AR}$
= 3.2.

For the vibrissal FWMC with $\textit{AR}$
= 12.9, five shedding cells are present, as shown in figure 11(c). While there are two tip shedding cells observed at
$\textit{AR}$
= 12.9, five shedding cells are present, as shown in figure 11(c). While there are two tip shedding cells observed at $z/L$
= 0.8, they are weak in amplitude and located at
$z/L$
= 0.8, they are weak in amplitude and located at $St$
= 0.23 and 0.19. In contrast to the five intermittent mid-span shedding cells observed in the mid-span wake of vibrissal FWMC of
$St$
= 0.23 and 0.19. In contrast to the five intermittent mid-span shedding cells observed in the mid-span wake of vibrissal FWMC of $\textit{AR}$
= 22.6, there are three mid-span shedding cells that can be identified, while only shedding cells with a centre height of
$\textit{AR}$
= 22.6, there are three mid-span shedding cells that can be identified, while only shedding cells with a centre height of $z/L$
= 0.4 and 0.6 are concentrated at
$z/L$
= 0.4 and 0.6 are concentrated at $St$
= 0.23. Although there are shedding cells that appear for
$St$
= 0.23. Although there are shedding cells that appear for $\textit{AR}$
= 22.6 and 12.9, the weakness in amplitude and spanwise intermittency makes the shedding weaker than that of the circular counterparts.
$\textit{AR}$
= 22.6 and 12.9, the weakness in amplitude and spanwise intermittency makes the shedding weaker than that of the circular counterparts.
For $\textit{AR}$
= 6.5, no distinct shedding cells are observed for the circular FWMC but a shedding cell in a very weak amplitude is located around
$\textit{AR}$
= 6.5, no distinct shedding cells are observed for the circular FWMC but a shedding cell in a very weak amplitude is located around $0.25 \lt z/L \lt 0.5$
for vibrissal FWMC. In contrast, for the circular FWMC with
$0.25 \lt z/L \lt 0.5$
for vibrissal FWMC. In contrast, for the circular FWMC with $\textit{AR}$
= 3.2, both tonal noise and shedding cells reappear. However, no distinct shedding cells are observed for the vibrissal FWMC at this aspect ratio but a region with a weak amplitude is observed centred at
$\textit{AR}$
= 3.2, both tonal noise and shedding cells reappear. However, no distinct shedding cells are observed for the vibrissal FWMC at this aspect ratio but a region with a weak amplitude is observed centred at $St$
= 0.3 with range of
$St$
= 0.3 with range of $0.25 \lt St\lt 0.35$
. This explains the broadband acoustic spectrum behaviour. Further, since the shedding components are dispersed over a wide frequency range, the vortex shedding strength of vibrissal FWMCs cannot regarded as suppressed, in combination with the lift force fluctuations shown in figure 10(h).
$0.25 \lt St\lt 0.35$
. This explains the broadband acoustic spectrum behaviour. Further, since the shedding components are dispersed over a wide frequency range, the vortex shedding strength of vibrissal FWMCs cannot regarded as suppressed, in combination with the lift force fluctuations shown in figure 10(h).
Visualisation of instantaneous flow structures by plotting the iso-surfaces of Q = 2500 000 coloured by instantaneous vorticity in z-direction for cylinders of different aspect ratios: (a) circular cylinder of $\textit{AR}$
= 22.6, (b) vibrissal cylinder of
$\textit{AR}$
= 22.6, (b) vibrissal cylinder of $\textit{AR}$
= 22.6, (c) circular cylinder of
$\textit{AR}$
= 22.6, (c) circular cylinder of $\textit{AR}$
= 12.9, (d) vibrissal cylinder of
$\textit{AR}$
= 12.9, (d) vibrissal cylinder of $\textit{AR}$
= 12.9, (e) circular cylinder of
$\textit{AR}$
= 12.9, (e) circular cylinder of $\textit{AR}$
= 6.5, (f) vibrissal cylinder of
$\textit{AR}$
= 6.5, (f) vibrissal cylinder of $\textit{AR}$
= 6.5, (g) circular cylinder of
$\textit{AR}$
= 6.5, (g) circular cylinder of $\textit{AR}$
= 3.2, (h) vibrissal cylinder of
$\textit{AR}$
= 3.2, (h) vibrissal cylinder of $\textit{AR}$
= 3.2. The yellow dashed lines depict the centre lines of the vortical tubes.
$\textit{AR}$
= 3.2. The yellow dashed lines depict the centre lines of the vortical tubes.

3.4. Three-dimensional vortical structures
3.4.1. Instantaneous vortical structures
Figure 12 presents the instantaneous flow structures visualised by Q-iso-surfaces at $Q = 2\,500\,000$
, coloured by instantaneous vorticity in the
$Q = 2\,500\,000$
, coloured by instantaneous vorticity in the $ z$
-direction for various cylinders with different aspect ratios. The vortical tubes are highlighted by yellow dashed lines. The three-dimensional vortical structures at different downstream positions also exhibit the evolution process of the shear layer separated from the cylinders, as shown in figures 12(a) and 12(b) with text annotations. The horseshoe vortices are shown for all FWMCs, near the bottom of the cylinder, wrapping around the cylinder. The shear layers develop and prepare to separate from the cylinders. Von Kármán vortex shedding is observed along the span, characterised by uniform vortical tubes, for the circular FWMCs with
$ z$
-direction for various cylinders with different aspect ratios. The vortical tubes are highlighted by yellow dashed lines. The three-dimensional vortical structures at different downstream positions also exhibit the evolution process of the shear layer separated from the cylinders, as shown in figures 12(a) and 12(b) with text annotations. The horseshoe vortices are shown for all FWMCs, near the bottom of the cylinder, wrapping around the cylinder. The shear layers develop and prepare to separate from the cylinders. Von Kármán vortex shedding is observed along the span, characterised by uniform vortical tubes, for the circular FWMCs with $\textit{AR}$
= 22.6 and 12.9, with a slight inclination angle around the free tip (Lee Reference Lee1997). They evolve into streamwise vortices and move downstream. However, for vibrissal FWMCs at these aspect ratios, the shedding behaviour is entirely different. The vortical structures are smaller in the wake of the vibrissa FWMCs compared with the circular FWMCs. The vortex structures exhibit a spanwise-wavy pattern, where variations in the separation positions along the streamwise direction influence the shedding phase. Consequently, hairpin vortices of a smaller scale in comparison with the uniform vortical tubes of the circular cylinders form and interconnect as they detach from the cylinder.
$\textit{AR}$
= 22.6 and 12.9, with a slight inclination angle around the free tip (Lee Reference Lee1997). They evolve into streamwise vortices and move downstream. However, for vibrissal FWMCs at these aspect ratios, the shedding behaviour is entirely different. The vortical structures are smaller in the wake of the vibrissa FWMCs compared with the circular FWMCs. The vortex structures exhibit a spanwise-wavy pattern, where variations in the separation positions along the streamwise direction influence the shedding phase. Consequently, hairpin vortices of a smaller scale in comparison with the uniform vortical tubes of the circular cylinders form and interconnect as they detach from the cylinder.
Interestingly, hairpin vortices are also observed in the wake of the circular FWMC with $\textit{AR}$
= 6.5, as shown in figure 12(e). In the wake of vibrissal cylinders, these hairpin vortical structures persist further downstream and require a longer distance to transition into streamwise vortices compared with their circular cylinder counterparts.
$\textit{AR}$
= 6.5, as shown in figure 12(e). In the wake of vibrissal cylinders, these hairpin vortical structures persist further downstream and require a longer distance to transition into streamwise vortices compared with their circular cylinder counterparts.
For $\textit{AR}$
= 3.2, von Kármán vortex shedding is absent in both circular and vibrissal cylinders. Instead, vertical vortical tubes are attached to the rear of the circular cylinder, transitioning into streamwise vortices in the near wake. Meanwhile, hairpin vortices continue to dominate the shedding behaviour of the vibrissal cylinder with
$\textit{AR}$
= 3.2, von Kármán vortex shedding is absent in both circular and vibrissal cylinders. Instead, vertical vortical tubes are attached to the rear of the circular cylinder, transitioning into streamwise vortices in the near wake. Meanwhile, hairpin vortices continue to dominate the shedding behaviour of the vibrissal cylinder with $\textit{AR}$
= 3.2, as illustrated in figure 12(h).
$\textit{AR}$
= 3.2, as illustrated in figure 12(h).
A twisting vortex pair is attached to the free tip of the vibrissal FWMC of $\textit{AR}$
= 22.6, as shown in the close-up view in figure 12(b). However, for
$\textit{AR}$
= 22.6, as shown in the close-up view in figure 12(b). However, for $\textit{AR}$
= 12.9, the twisting vortex pair is absent and it reappears for
$\textit{AR}$
= 12.9, the twisting vortex pair is absent and it reappears for $\textit{AR}s$
= 6.5 and 3.2. Buaria, Lawson & Wilczek (Reference Buaria, Lawson and Wilczek2024) suggested that the twisting of vortex lines can regularise turbulence and suppress the fluctuations in the wake. The appearance of the twisting vortex pair leads to a suppression of the vortex shedding around the free tip, which could be induced by the free tip end cross-section shapes. The absence of the twisting vortex pair for
$\textit{AR}s$
= 6.5 and 3.2. Buaria, Lawson & Wilczek (Reference Buaria, Lawson and Wilczek2024) suggested that the twisting of vortex lines can regularise turbulence and suppress the fluctuations in the wake. The appearance of the twisting vortex pair leads to a suppression of the vortex shedding around the free tip, which could be induced by the free tip end cross-section shapes. The absence of the twisting vortex pair for $\textit{AR}$
= 12.9 aligns with the formation of tip-shedding cell (
$\textit{AR}$
= 12.9 aligns with the formation of tip-shedding cell ( $z/L$
= 0.8) shown in figure 11(d).
$z/L$
= 0.8) shown in figure 11(d).
3.4.2. Time-averaged vortical structures
The time-averaged vortical structures of FWMCs can be used to study the mean wake pattern including the transition from dipole to quadrupole structure with increasing aspect ratio (Yauwenas et al. Reference Yauwenas, Porteous, Moreau and Doolan2019; Essel et al. Reference Essel, Tachie and Balachandar2021; Crane et al. Reference Crane, Popinhak, Martinuzzi and Morton2022). The time-averaged flow structures using iso-surfaces of $Q = 100\,000$
, coloured by time-averaged vorticity in the z- or x-directions for cylinders with varying aspect ratio are presented in figure 13. For
$Q = 100\,000$
, coloured by time-averaged vorticity in the z- or x-directions for cylinders with varying aspect ratio are presented in figure 13. For $\textit{AR}$
= 12.9 and 22.6, a quadrupole time-averaged wake flow structure is observed, with both free end and junction vortex pairs visible. The FWMC with
$\textit{AR}$
= 12.9 and 22.6, a quadrupole time-averaged wake flow structure is observed, with both free end and junction vortex pairs visible. The FWMC with $\textit{AR}$
= 6.5 serves as the critical aspect ratio for the transition, where there is an absence of trailing vortices in the time-mean flow structure. For circular cylinders, the dipole mean wake structure is shown for
$\textit{AR}$
= 6.5 serves as the critical aspect ratio for the transition, where there is an absence of trailing vortices in the time-mean flow structure. For circular cylinders, the dipole mean wake structure is shown for $\textit{AR}$
= 3.2, characterised by trailing vortices downstream from the free tip.
$\textit{AR}$
= 3.2, characterised by trailing vortices downstream from the free tip.
Visualisation of the time-averaged flow structure using iso-surfaces of $Q = 100\,000$
, coloured by time-averaged vorticity in the z- or x-directions for cylinders with varying aspect ratios. The results are shown for: (a, b) circular cylinder with
$Q = 100\,000$
, coloured by time-averaged vorticity in the z- or x-directions for cylinders with varying aspect ratios. The results are shown for: (a, b) circular cylinder with $\textit{AR}$
= 22.6 (z- and x-directions, respectively); (c, d) vibrissal cylinder with
$\textit{AR}$
= 22.6 (z- and x-directions, respectively); (c, d) vibrissal cylinder with $\textit{AR}$
= 22.6 (z- and x-directions, respectively); (e, f) circular cylinder with
$\textit{AR}$
= 22.6 (z- and x-directions, respectively); (e, f) circular cylinder with $\textit{AR}$
= 12.9 (z- and x-directions, respectively); (g, h) vibrissal cylinder with
$\textit{AR}$
= 12.9 (z- and x-directions, respectively); (g, h) vibrissal cylinder with $\textit{AR}$
= 12.9 (z- and x-directions, respectively); (i, j) circular cylinder with
$\textit{AR}$
= 12.9 (z- and x-directions, respectively); (i, j) circular cylinder with $\textit{AR}$
= 6.5 (z- and x-directions, respectively); (k, l) vibrissal cylinder with
$\textit{AR}$
= 6.5 (z- and x-directions, respectively); (k, l) vibrissal cylinder with $\textit{AR}$
= 6.5 (z- and x-directions, respectively); (m, n) circular cylinder with
$\textit{AR}$
= 6.5 (z- and x-directions, respectively); (m, n) circular cylinder with $\textit{AR}$
= 3.2 (z- and x-directions, respectively); (o, p) vibrissal cylinder with
$\textit{AR}$
= 3.2 (z- and x-directions, respectively); (o, p) vibrissal cylinder with $\textit{AR}$
= 3.2 (z- and x-directions, respectively).
$\textit{AR}$
= 3.2 (z- and x-directions, respectively).

For vibrissal cylinders, the time-averaged flow structures exhibit a completely different pattern. In the case of $\textit{AR}$
= 22.6, a quadrupole wake is observed, however, the structures emanating from the tip and junction appear on a smaller scale compared with those of the circular cylinder. Furthermore, fin-shaped time-averaged flow structures are observed, attached to the cylinder along its span between the tip and junction vortical pairs. Additional flow structures, isolated from the fin-shaped structures, are present in the wake of figures 13(c) and 13(d). These parallel and well-organised vortical tubes, whose central axes are aligned in the streamwise direction, exhibit varying lengths depending on their spanwise locations, with the longest extension occurring at approximately the
$\textit{AR}$
= 22.6, a quadrupole wake is observed, however, the structures emanating from the tip and junction appear on a smaller scale compared with those of the circular cylinder. Furthermore, fin-shaped time-averaged flow structures are observed, attached to the cylinder along its span between the tip and junction vortical pairs. Additional flow structures, isolated from the fin-shaped structures, are present in the wake of figures 13(c) and 13(d). These parallel and well-organised vortical tubes, whose central axes are aligned in the streamwise direction, exhibit varying lengths depending on their spanwise locations, with the longest extension occurring at approximately the $z/L$
= 0.5 position. Additionally, wavy lines, coloured with red due to their high vorticity magnitude in the z-direction on the vibrissal cylinder, as illustrated in figure 13(c), indicate the presence of a wavy separation line. The attached fin-shaped vortical structures in the vibrissal cylinders originate from this wavy separation line and exhibit a consistent periodicity in the spanwise direction.
$z/L$
= 0.5 position. Additionally, wavy lines, coloured with red due to their high vorticity magnitude in the z-direction on the vibrissal cylinder, as illustrated in figure 13(c), indicate the presence of a wavy separation line. The attached fin-shaped vortical structures in the vibrissal cylinders originate from this wavy separation line and exhibit a consistent periodicity in the spanwise direction.
The wavy separation lines and the attached fin-shaped structures are also observed for vibrissal FWMCs with $\textit{AR}$
= 12.9 and 6.5. For
$\textit{AR}$
= 12.9 and 6.5. For $\textit{AR}$
= 12.9, a weaker quadrupole time-averaged flow structure is identified compared with that of
$\textit{AR}$
= 12.9, a weaker quadrupole time-averaged flow structure is identified compared with that of $\textit{AR}$
= 22.6. Additionally, the isolated flow structures located between the tip and junction vortical pairs appear on a smaller scale than their circular counterparts. In the case of
$\textit{AR}$
= 22.6. Additionally, the isolated flow structures located between the tip and junction vortical pairs appear on a smaller scale than their circular counterparts. In the case of $\textit{AR}$
= 6.5, no apparent vortical pairs emanate from the tip or junction ends.
$\textit{AR}$
= 6.5, no apparent vortical pairs emanate from the tip or junction ends.
For the vibrissal cylinder with $\textit{AR}$
= 3.2, the wavy separation line barely forms a complete cycle. A strong yet isolated trailing vortical pair is observed around the free tip. Identifying a dipole time-averaged flow structure for the vibrissal FWMC with
$\textit{AR}$
= 3.2, the wavy separation line barely forms a complete cycle. A strong yet isolated trailing vortical pair is observed around the free tip. Identifying a dipole time-averaged flow structure for the vibrissal FWMC with $\textit{AR}$
= 3.2 is challenging due to the absence of a well-defined flow pattern.
$\textit{AR}$
= 3.2 is challenging due to the absence of a well-defined flow pattern.
3.5. The coherence between the flow and acoustics
To further elucidate the mechanism underlying the suppression of tonal peaks, the components submerged within the broadband acoustic response of the vibrissal FWMCs were examined by coherence analysis with the three-dimensional instantaneous flow fields. Additionally, this analysis helps to identify flow structures that are coherent with the Aeolian tones of the circular FWMCs, which are suppressed for its vibrissal counterparts. The correlation between instantaneous and turbulent flow structures and the Aeolian tone of the circular FWMCs was examined for comparison.
Phase contours in the $x{-}z$
plane at
$x{-}z$
plane at $y/D = 0.25$
between the coherent flow structures and the filtered acoustic signal of (a) circular FWMC of
$y/D = 0.25$
between the coherent flow structures and the filtered acoustic signal of (a) circular FWMC of $\textit{AR} = 22.6$
, (c) vibrissal FWMC of
$\textit{AR} = 22.6$
, (c) vibrissal FWMC of $\textit{AR} = 22.6$
, (e) circular FWMC of
$\textit{AR} = 22.6$
, (e) circular FWMC of $\textit{AR} = 12.9$
, (g) vibrissal FWMC of
$\textit{AR} = 12.9$
, (g) vibrissal FWMC of $\textit{AR} = 12.9$
; and the visualisation of the three-dimensional flow structures that are in-phase with the filtered acoustic signal by plotting the iso-surfaces of
$\textit{AR} = 12.9$
; and the visualisation of the three-dimensional flow structures that are in-phase with the filtered acoustic signal by plotting the iso-surfaces of $\overline {\phi } = 5 ^{\circ }$
coloured in yellow: (b) circular FWMC of
$\overline {\phi } = 5 ^{\circ }$
coloured in yellow: (b) circular FWMC of $\textit{AR} = 22.6$
, (d) vibrissal FWMC of
$\textit{AR} = 22.6$
, (d) vibrissal FWMC of $\textit{AR} = 22.6$
, (f) circular FWMC of
$\textit{AR} = 22.6$
, (f) circular FWMC of $\textit{AR} = 12.9$
, (h) vibrissal FWMC of
$\textit{AR} = 12.9$
, (h) vibrissal FWMC of $\textit{AR} = 12.9$
. The acoustic signal has been filtered at the ‘P1’ acoustic peak for circular cylinders and the mid-span shedding cell frequency for vibrissal cylinders. Red dashed lines highlight the large-scale in-phase flow structures.
$\textit{AR} = 12.9$
. The acoustic signal has been filtered at the ‘P1’ acoustic peak for circular cylinders and the mid-span shedding cell frequency for vibrissal cylinders. Red dashed lines highlight the large-scale in-phase flow structures.

Following the method used by Porteous et al. (Reference Porteous, Moreau and Doolan2017) and Doolan & Moreau (Reference Doolan and Moreau2022), which serves as a powerful approach in diagnosing acoustic sources, the time-averaged phase between the acoustic signals and the velocity fluctuations in the wake was calculated as follows:
 \begin{equation} \overline {\phi }_{xy}(f) = \textit{tan}^{-1} \frac {\textrm{Im}(\overline {G}_{xy}(f))}{\textit{Re}(\overline {G}_{xy}(f))}=0, \end{equation}
where $Gxy(f)$
is the cross-spectral density between x and y (Bendat & Piersol Reference Bendat and Piersol2011), with x and y representing the acoustic signal and the velocity fluctuations, respectively. This parameter
$Gxy(f)$
is the cross-spectral density between x and y (Bendat & Piersol Reference Bendat and Piersol2011), with x and y representing the acoustic signal and the velocity fluctuations, respectively. This parameter $Gxy(f)$
was determined with highest coherence between time histories of the far-field acoustic signals and the wake velocity. The acoustic signals have been filtered at their peak tonal frequencies with a band size of 400 Hz for circular cylinders. For the vibrissal FWMCs, a narrower bandwidth of 120 Hz was employed, centred on the dominant mid-span shedding frequency, in order to reduce the influence of broadband noise.
$Gxy(f)$
was determined with highest coherence between time histories of the far-field acoustic signals and the wake velocity. The acoustic signals have been filtered at their peak tonal frequencies with a band size of 400 Hz for circular cylinders. For the vibrissal FWMCs, a narrower bandwidth of 120 Hz was employed, centred on the dominant mid-span shedding frequency, in order to reduce the influence of broadband noise.
Figure 14 shows the phase contours depicting the correlations between coherent flow structures and the acoustic signal filtered at the ‘P1’ acoustic peak. This figure also shows the coherent flow structures related to vortex shedding that are in phase with the acoustic signal at $\overline {\phi } = 5^\circ$
. The in-phase coherent structures are highlighted in yellow rather than by phase magnitude.
$\overline {\phi } = 5^\circ$
. The in-phase coherent structures are highlighted in yellow rather than by phase magnitude.
For $\textit{AR} = 22.6$
, from the phase maps, concentrated inclined in-phase zones are observed in figure 14(a) for the circular FWMC. These inclined, periodically distributed zones extend from
$\textit{AR} = 22.6$
, from the phase maps, concentrated inclined in-phase zones are observed in figure 14(a) for the circular FWMC. These inclined, periodically distributed zones extend from $ z/L = 0.26$
to 0.66. The in-phase structures, characterised by inclined vortex tubes (highlighted with red dashed lines), appear in the mid-span region and are well organised along the streamwise direction. As shown in figures 14(b) and 11, they exhibit a consistent vortex tube arrangement in the wake, with uniform Kármán vortex tubes shedding from the mid-span cell, spanning from
$ z/L = 0.26$
to 0.66. The in-phase structures, characterised by inclined vortex tubes (highlighted with red dashed lines), appear in the mid-span region and are well organised along the streamwise direction. As shown in figures 14(b) and 11, they exhibit a consistent vortex tube arrangement in the wake, with uniform Kármán vortex tubes shedding from the mid-span cell, spanning from $z/L = 0.1$
to 0.8. Figures 14(c) and 14(d) show that, for the vibrissal cylinder of
$z/L = 0.1$
to 0.8. Figures 14(c) and 14(d) show that, for the vibrissal cylinder of $\textit{AR} = 22.6$
, the flow structures that are in phase with the acoustic signal are arranged in a spanwise-wavy pattern and are composed of short vortex tubes. The phase contours in figures 14(a) and 14(b) further indicate that the spanwise-coherent structures are disrupted in the near wake (
$\textit{AR} = 22.6$
, the flow structures that are in phase with the acoustic signal are arranged in a spanwise-wavy pattern and are composed of short vortex tubes. The phase contours in figures 14(a) and 14(b) further indicate that the spanwise-coherent structures are disrupted in the near wake ( $x/D \lt 8$
), where they break into short, wavy segments. In contrast, the flow structures associated with the tonal peak of the circular cylinder remain spanwise coherent and stable in the far wake at
$x/D \lt 8$
), where they break into short, wavy segments. In contrast, the flow structures associated with the tonal peak of the circular cylinder remain spanwise coherent and stable in the far wake at $x/D = 18$
.
$x/D = 18$
.
These short, successive flow structures that are in phase with the acoustic field form a spanwise-wavy pattern exhibiting two cycles along the entire span of the vibrissal FWMC of $\textit{AR} = 22.6$
, with local streamwise minima located at
$\textit{AR} = 22.6$
, with local streamwise minima located at $z/L =$
0.25, 0.5 and 0.75. As shown in figures 14(c) and 14(d), the flow structure at
$z/L =$
0.25, 0.5 and 0.75. As shown in figures 14(c) and 14(d), the flow structure at $z/L = 0.75$
remains attached to the rear surface of the cylinder, whereas the structure at
$z/L = 0.75$
remains attached to the rear surface of the cylinder, whereas the structure at $z/L = 0.25$
is displaced away from the surface. This indicates that an inclination angle persists in the wavy pattern formed by the clustered, spanwise-modulated, short and successive flow structures.
$z/L = 0.25$
is displaced away from the surface. This indicates that an inclination angle persists in the wavy pattern formed by the clustered, spanwise-modulated, short and successive flow structures.
Additionally, the comparison between the flow structures associated with the tonal peak ‘P1’ and those for its acoustically suppressed counterpart of $\textit{AR}$
= 12.9 provides further evidence that the noise-generating structures are broken down into smaller, spanwise-wavy, organised elements (figure 14
e–h). Owing to the weaker wake coherence at this aspect ratio, the circular cylinder exhibits large-scale in-phase structures correlated with the acoustic signal filtered at the ‘P1’ frequency, whereas the vibrissal configuration displays dispersed but well-organised spanwise-wavy clusters. These structures originate from a lower vertical position than those of
$\textit{AR}$
= 12.9 provides further evidence that the noise-generating structures are broken down into smaller, spanwise-wavy, organised elements (figure 14
e–h). Owing to the weaker wake coherence at this aspect ratio, the circular cylinder exhibits large-scale in-phase structures correlated with the acoustic signal filtered at the ‘P1’ frequency, whereas the vibrissal configuration displays dispersed but well-organised spanwise-wavy clusters. These structures originate from a lower vertical position than those of $\textit{AR}$
= 12.9 for the circular cylinder, while the fragmented small-scale structures of the vibrissal FWMC of
$\textit{AR}$
= 12.9 for the circular cylinder, while the fragmented small-scale structures of the vibrissal FWMC of $\textit{AR} = 12.9$
still extend across the entire span, forming a one cycle configuration.
$\textit{AR} = 12.9$
still extend across the entire span, forming a one cycle configuration.
The time-averaged streamwise vortical structures have commonly been used to help explain the suppression mechanism of the wavy cylinders (Lam & Lin Reference Lam and Lin2008, Reference Lam and Lin2009; Lin et al. Reference Lin, Bai, Alam, Zhang and Lam2016; Zhang et al. Reference Zhang, Katsuchi, Zhou, Yamada and Lu2018). To provide a more unified interpretation of noise reduction and vortex shedding suppression, the spanwise transport, quantified by the wall shear stress distribution, is presented subsequently in § 3.6.1. This surface separation mode topological analysis has also been applied to FWMC flows by Cao et al. (Reference Cao, Tamura, Zhou, Bao and Han2022).
3.6. Spanwise flow transportation analysis
3.6.1. Surface flow pattern
To investigate the separation lines and the spanwise flow movements and relate it to the suppression of vortex shedding, the surface flows of FWMCs of different $\textit{AR}$
s are comprehensively examined using the wall shear stress fields to identify the separation positions of the flow passing over the FWMCs. This method was also applied for the harbour seal vibrissal cylinder (Chen et al. Reference Chen, Wang and Liu2024) and circular wavy cylinder (Zhang et al. Reference Zhang, Katsuchi, Zhou, Yamada and Lu2018).
$\textit{AR}$
s are comprehensively examined using the wall shear stress fields to identify the separation positions of the flow passing over the FWMCs. This method was also applied for the harbour seal vibrissal cylinder (Chen et al. Reference Chen, Wang and Liu2024) and circular wavy cylinder (Zhang et al. Reference Zhang, Katsuchi, Zhou, Yamada and Lu2018).
Following the definitions in Délery (Reference Délery2001) and the depictions therein, white arrows indicate the local flow direction, while white dashed lines delineate boundary layer separation lines. Red circular markers denote saddle points, whereas green and yellow circular markers indicate sink and source points. For clarity, close-up views around the junction are also provided at this aspect ratio.
Figures 15–18 present the time-averaged wall shear stress fields, visualised using the LIC method for the different FWMCs with varying aspect ratios. For clarity, the cylinders are oriented horizontally for long cylinders ( $\textit{AR} = 12.9$
and 22.6). Due to the cylinder’s longitudinal extent, the span is divided into two sections for
$\textit{AR} = 12.9$
and 22.6). Due to the cylinder’s longitudinal extent, the span is divided into two sections for $\textit{AR} = 22.6$
, referred to as the upper and lower sections, as observed in the side and rear views.
$\textit{AR} = 22.6$
, referred to as the upper and lower sections, as observed in the side and rear views.
Averaged wall shear stress fields visualised by the LIC method for (a) circular cylinder of $\textit{AR}$
= 22.6, (b) vibrissal cylinder of
$\textit{AR}$
= 22.6, (b) vibrissal cylinder of $\textit{AR}$
= 22.6 from upwind, side and rear views. The white arrows indicate the local flow direction; the white dashed lines depict the region of boundary layer separation lines; green circular points depict sink points; yellow circular points depict source points; red circular points indicate saddle points.
$\textit{AR}$
= 22.6 from upwind, side and rear views. The white arrows indicate the local flow direction; the white dashed lines depict the region of boundary layer separation lines; green circular points depict sink points; yellow circular points depict source points; red circular points indicate saddle points.

Averaged wall shear stress fields visualised by the LIC method for (a) circular cylinder of $\textit{AR}$
= 12.9, (b) vibrissal cylinder of
$\textit{AR}$
= 12.9, (b) vibrissal cylinder of $\textit{AR}$
= 12.9 from upwind, side and rear views.
$\textit{AR}$
= 12.9 from upwind, side and rear views.

Time-averaged wall shear stress fields visualised by the LIC method for (a) circular cylinder of $\textit{AR}$
= 6.5, (b) vibrissal cylinder of
$\textit{AR}$
= 6.5, (b) vibrissal cylinder of $\textit{AR}$
= 6.5 from upwind, side and rear views.
$\textit{AR}$
= 6.5 from upwind, side and rear views.

Time-averaged wall shear stress fields visualised by the LIC method for (a) circular cylinder of $\textit{AR}$
= 3.2, (b) vibrissal cylinder of
$\textit{AR}$
= 3.2, (b) vibrissal cylinder of $\textit{AR}$
= 3.2 from upwind, side and rear views with close-up views around junction of the FWMCs. Close-up views depict the wall shear stress fields around the junction.
$\textit{AR}$
= 3.2 from upwind, side and rear views with close-up views around junction of the FWMCs. Close-up views depict the wall shear stress fields around the junction.

The stagnation line (denoted as line I), shown in the upwind views for all FWMCs, remains straight and well aligned. Together with the separating flow that ends at the primary separation line (line II), shown in the side views, it defines the boundary layer region. Downstream of line II, a second region develops between the primary and the secondary separation lines (i.e. lines III–V in the side view of figure 15 a). This region is well organised and exhibits clear spanwise variation for FWMCs. While Zhang et al. (Reference Zhang, Katsuchi, Zhou, Yamada and Lu2018) classified the surface flow topology into three regions and reported a chaotic wake without a distinct pattern in the rear view, the present results reveal no fully chaotic wake; instead, a more complex but structured reverse-flow topology is observed. The wall-surface flow can therefore be divided into a boundary layer region and a reverse-flow region. The reverse-flow region in the rear view is not perfectly symmetric, which could be attributed to the insufficient averaging time. Nevertheless, a relatively well-organised and symmetrically converged trend is provided in the rear views.
The spanwise surface flow differs markedly between the boundary layer and reverse-flow regions. For $\textit{AR} = 22.6$
(figure 15), the circular FWMC exhibits three distinct spanwise regions: (i) a free end region of
$\textit{AR} = 22.6$
(figure 15), the circular FWMC exhibits three distinct spanwise regions: (i) a free end region of $0.85\lt z/L$
characterised by a pair of saddle points and well-aligned secondary separation lines; (ii) a mid-span region of
$0.85\lt z/L$
characterised by a pair of saddle points and well-aligned secondary separation lines; (ii) a mid-span region of $ 0.2\lt z/L \lt 0.85$
where lateral flow arises from the interaction between the upwash and downwash from the two ends; and (iii) a wall-junction region of
$ 0.2\lt z/L \lt 0.85$
where lateral flow arises from the interaction between the upwash and downwash from the two ends; and (iii) a wall-junction region of $z/L \lt 0.2$
marked by a source point and spanwise-aligned secondary separation lines. These regions correspond to the three shedding cells identified in the velocity spectra for circular FWMC of
$z/L \lt 0.2$
marked by a source point and spanwise-aligned secondary separation lines. These regions correspond to the three shedding cells identified in the velocity spectra for circular FWMC of $\textit{AR} = 22.6$
(figure 11
a).
$\textit{AR} = 22.6$
(figure 11
a).
Of interest, the primary separation line (line II) becomes spanwise wavy, with eight sink points that coincide with the streamwise maxima of the primary separation line for the vibrissal FWMC of $\textit{AR} = 22.6$
(figure 15
b). Such waviness has been shown to suppress vortex shedding by modulating the separation phase and elongating the vortex formation length (Lin et al. Reference Lin, Bai, Alam, Zhang and Lam2016; Assi & Bearman Reference Assi and Bearman2018). The relative spanwise positions of the sink points and their neighbouring saddle points indicate that the downwash induced by the free end remains effective down to
$\textit{AR} = 22.6$
(figure 15
b). Such waviness has been shown to suppress vortex shedding by modulating the separation phase and elongating the vortex formation length (Lin et al. Reference Lin, Bai, Alam, Zhang and Lam2016; Assi & Bearman Reference Assi and Bearman2018). The relative spanwise positions of the sink points and their neighbouring saddle points indicate that the downwash induced by the free end remains effective down to $z/L = 0.35$
. Furthermore, in the mid-span, short secondary separation lines tend to appear in the saddle planes of the geometry (around ‘B-B’ cross-section). Five such lines (V, VIII, X, XII and XIII) are clearly visible near the primary separation line in the side view and exhibit a spanwise periodicity along with the sink–saddle pair appearing in the nodal planes (around ‘A-A’ cross section). Owing to the interruption of the sink–saddle pattern in the nodal planes, these lines remain shorter and straighter than the primary separation line and produce the five spanwise-intermittent shedding components in the mid span, as observed the wake velocity spectra for vibrissal FWMC of
$z/L = 0.35$
. Furthermore, in the mid-span, short secondary separation lines tend to appear in the saddle planes of the geometry (around ‘B-B’ cross-section). Five such lines (V, VIII, X, XII and XIII) are clearly visible near the primary separation line in the side view and exhibit a spanwise periodicity along with the sink–saddle pair appearing in the nodal planes (around ‘A-A’ cross section). Owing to the interruption of the sink–saddle pattern in the nodal planes, these lines remain shorter and straighter than the primary separation line and produce the five spanwise-intermittent shedding components in the mid span, as observed the wake velocity spectra for vibrissal FWMC of $\textit{AR} = 22.6$
(figure 11
b).
$\textit{AR} = 22.6$
(figure 11
b).
For $\textit{AR} = 12.9$
, the circular cylinder shows a simpler interaction pattern due to the reduced span. The wall-junction region no longer contains spanwise-aligned secondary separation lines but instead exhibits streamwise-oriented lines, indicating the dominance of streamwise vortices and the suppression of spanwise shedding; only two shedding cells are therefore present in the velocity spectrum (figure 11
c). For the vibrissal FWMC of this aspect ratio, no spanwise-periodic pattern is observed at mid-span. Nevertheless, short and nearly straight secondary separation lines (III, V, XII and XIII) can still be identified slightly below the saddle planes (around ‘B-B’ cross section) in the rear view, suggesting the shear-layer separation locations for spanwise vortex shedding.
$\textit{AR} = 12.9$
, the circular cylinder shows a simpler interaction pattern due to the reduced span. The wall-junction region no longer contains spanwise-aligned secondary separation lines but instead exhibits streamwise-oriented lines, indicating the dominance of streamwise vortices and the suppression of spanwise shedding; only two shedding cells are therefore present in the velocity spectrum (figure 11
c). For the vibrissal FWMC of this aspect ratio, no spanwise-periodic pattern is observed at mid-span. Nevertheless, short and nearly straight secondary separation lines (III, V, XII and XIII) can still be identified slightly below the saddle planes (around ‘B-B’ cross section) in the rear view, suggesting the shear-layer separation locations for spanwise vortex shedding.
For the short cylinders of $\textit{AR} = 6.5$
and 3.2 (figures 17 and 18), the spanwise characterised surface flow regions for the circular FWMC disappear. Instead, an extremely short secondary separation line (III), accompanied by two saddle points and one source point at
$\textit{AR} = 6.5$
and 3.2 (figures 17 and 18), the spanwise characterised surface flow regions for the circular FWMC disappear. Instead, an extremely short secondary separation line (III), accompanied by two saddle points and one source point at $z/L \approx$
0.37, separates the upwash and downwash flows can be seen for circular cylinder of
$z/L \approx$
0.37, separates the upwash and downwash flows can be seen for circular cylinder of $\textit{AR} = 6.5$
(figure 17
a). For the vibrissal FWMC of
$\textit{AR} = 6.5$
(figure 17
a). For the vibrissal FWMC of $\textit{AR} = 6.5$
, the primary separation line remains wavy, and two spanwise regions
$\textit{AR} = 6.5$
, the primary separation line remains wavy, and two spanwise regions $0.25\lt z/L \lt 0.4$
and
$0.25\lt z/L \lt 0.4$
and $0.62\lt z/L \lt 0.68$
contain short secondary separation lines. Two pairs are visible in the rear view (III–VIII and IV–IX), consistent with the two weak shedding components in figure 11(f); the lower pair still coincides with the saddle planes.
$0.62\lt z/L \lt 0.68$
contain short secondary separation lines. Two pairs are visible in the rear view (III–VIII and IV–IX), consistent with the two weak shedding components in figure 11(f); the lower pair still coincides with the saddle planes.
For the shortest cylinders, the upwash dominates the surface flow (figure 18). A saddle point with spanwise-aligned secondary separation lines appears at the wall junction $z/L \approx$
0.2 for the circular and
$z/L \approx$
0.2 for the circular and $z/L \approx$
0.25 for the vibrissal cylinder, rear views). Strong shear-layer separation occurs near the free end, where a pair of sink points with an intermediate saddle point is observed. For the circular FWMC at
$z/L \approx$
0.25 for the vibrissal cylinder, rear views). Strong shear-layer separation occurs near the free end, where a pair of sink points with an intermediate saddle point is observed. For the circular FWMC at $\textit{AR} = 3.2$
, the primary separation line cannot complete a full spanwise cycle, and the secondary separation lines are mainly governed by the wall junction. A saddle point acting as a local stagnation point is also visible near the wall junction in the upwind close-up view, along with streamwise separation lines or source points in the reverse-flow region. This feature, arising from the interaction between the incoming boundary layer and the cylinder, exists in all cases but is not always clearly presented. A similar topology has been reported for square FWMCs by Cao et al. (Reference Cao, Tamura, Zhou, Bao and Han2022), indicating the presence of the horseshoe vortex and base vortex.
$\textit{AR} = 3.2$
, the primary separation line cannot complete a full spanwise cycle, and the secondary separation lines are mainly governed by the wall junction. A saddle point acting as a local stagnation point is also visible near the wall junction in the upwind close-up view, along with streamwise separation lines or source points in the reverse-flow region. This feature, arising from the interaction between the incoming boundary layer and the cylinder, exists in all cases but is not always clearly presented. A similar topology has been reported for square FWMCs by Cao et al. (Reference Cao, Tamura, Zhou, Bao and Han2022), indicating the presence of the horseshoe vortex and base vortex.
3.6.2. Streamwise vortices
Chen et al. (Reference Chen, Wang and Liu2024) illustrated the role of streamwise vortical structures in the suppression mechanism of vibration of the infinite vibrissal cylinder. Lin et al. (Reference Lin, Bai, Alam, Zhang and Lam2016) and Zhang et al. (Reference Zhang, Katsuchi, Zhou, Yamada and Lu2018) studied the stationary wavy cylinder and attributed the suppression of the vortex shedding mechanism to the spanwise-periodic distribution of the streamwise vortices attached to the cylinder. Lin et al. (Reference Lin, Bai, Alam, Zhang and Lam2016) concluded that the periodic arrangement of the positive–negative streamwise vortices suppressed the vortex shedding by retarding the roll-up and development of the spanwise vortices.
For further insight into the formation of the wavy separation lines, the contours of time-averaged streamwise vorticity of $\omega _x D/U$
=
$\omega _x D/U$
= $\pm$
0.6 for various cylinders of different aspect ratios are presented from the rear view in figure 19. The black arrows indicate the rotation direction of the streamwise vorticity, where ‘+’ denotes the positive x-axis direction and ‘−’ represents the negative x-axis direction. The circular cylinders exhibit a transition from a quadrupole to a dipole pattern as the aspect ratio decreases from
$\pm$
0.6 for various cylinders of different aspect ratios are presented from the rear view in figure 19. The black arrows indicate the rotation direction of the streamwise vorticity, where ‘+’ denotes the positive x-axis direction and ‘−’ represents the negative x-axis direction. The circular cylinders exhibit a transition from a quadrupole to a dipole pattern as the aspect ratio decreases from $\textit{AR}=$
22.6 to 3.2.
$\textit{AR}=$
22.6 to 3.2.
Rear view for the contours of time-averaged streamwise vorticity of $\omega _x D/U$
=
$\omega _x D/U$
= $\pm$
0.6 for various cylinders of different aspect ratios: (a) circular cylinder of
$\pm$
0.6 for various cylinders of different aspect ratios: (a) circular cylinder of $\textit{AR}$
= 22.6, (b) vibrissal cylinder of
$\textit{AR}$
= 22.6, (b) vibrissal cylinder of $\textit{AR}$
= 22.6, (c) circular cylinder of
$\textit{AR}$
= 22.6, (c) circular cylinder of $\textit{AR}$
= 12.9, (d) vibrissal cylinder of
$\textit{AR}$
= 12.9, (d) vibrissal cylinder of $\textit{AR}$
= 12.9, (e) circular cylinder of
$\textit{AR}$
= 12.9, (e) circular cylinder of $\textit{AR}$
= 6.5, (f) vibrissal cylinder of
$\textit{AR}$
= 6.5, (f) vibrissal cylinder of $\textit{AR}$
= 6.5, (g) circular cylinder of
$\textit{AR}$
= 6.5, (g) circular cylinder of $\textit{AR}$
= 3.2, (h) vibrissal cylinder of
$\textit{AR}$
= 3.2, (h) vibrissal cylinder of $\textit{AR}$
= 3.2. Red colour indicates positive vorticity and blue colour indicates negative vorticity. The black arrows indicate the rotation direction of the streamwise vorticity with ‘+’ indicating the positive x-axis and ‘−’ indicating the negative x-axis direction.
$\textit{AR}$
= 3.2. Red colour indicates positive vorticity and blue colour indicates negative vorticity. The black arrows indicate the rotation direction of the streamwise vorticity with ‘+’ indicating the positive x-axis and ‘−’ indicating the negative x-axis direction.

In contrast, the vibrissal FWMCs display an entirely different streamwise vortical paradigm compared with circular cylinders. The flow pattern transitions from a hexapole to a dipole pattern as the aspect ratio decreases from $\textit{AR}=$
22.6 to 3.2. For
$\textit{AR}=$
22.6 to 3.2. For $\textit{AR}$
= 22.6, two pairs of counter-rotating vortices are observed attached to the free tip of the vibrissal cylinder. These vortical structures are smaller in scale than those present at the free tip of the circular cylinder. Around the junction, the vibrissal cylinder exhibits streamwise vortical structures similar to those of the circular cylinder. However, the height of the junction vortex pair is greater than that of the circular cylinder.
$\textit{AR}$
= 22.6, two pairs of counter-rotating vortices are observed attached to the free tip of the vibrissal cylinder. These vortical structures are smaller in scale than those present at the free tip of the circular cylinder. Around the junction, the vibrissal cylinder exhibits streamwise vortical structures similar to those of the circular cylinder. However, the height of the junction vortex pair is greater than that of the circular cylinder.
For $\textit{AR}$
= 12.9, a hexapole flow configuration is also evident. Two pairs of counter-rotating vortices are observed around the free tip of the vibrissal cylinder around
$\textit{AR}$
= 12.9, a hexapole flow configuration is also evident. Two pairs of counter-rotating vortices are observed around the free tip of the vibrissal cylinder around $z/L$
= 0.6 and 0.8, respectively, as can be seen in figure 19(d). Additionally, the vortex pair near the junction is significantly higher than that of the circular cylinder, whereas the pair of counter-rotating vortices exhibits similar strength and positioning to those observed in the circular cylinder. However, an additional weak pair of counter-rotating vortices is observed in close proximity to the free end, exhibiting a significantly smaller scale compared with the two primary counter-rotating vortices aforementioned. This could be related to the disappearance of the twisting vortex pair in figure 12(d). The small vortex pair could alter the spanwise phase of the streamwise vortical structures, leading to the emergence of a shedding cell in the wake velocity spectrum (figure 11
d).
$z/L$
= 0.6 and 0.8, respectively, as can be seen in figure 19(d). Additionally, the vortex pair near the junction is significantly higher than that of the circular cylinder, whereas the pair of counter-rotating vortices exhibits similar strength and positioning to those observed in the circular cylinder. However, an additional weak pair of counter-rotating vortices is observed in close proximity to the free end, exhibiting a significantly smaller scale compared with the two primary counter-rotating vortices aforementioned. This could be related to the disappearance of the twisting vortex pair in figure 12(d). The small vortex pair could alter the spanwise phase of the streamwise vortical structures, leading to the emergence of a shedding cell in the wake velocity spectrum (figure 11
d).
For shorter cylinders, such as $\textit{AR}$
= 6.5 and 3.2, only a pair of counter-rotating vortices are found attached to the free tip for
$\textit{AR}$
= 6.5 and 3.2, only a pair of counter-rotating vortices are found attached to the free tip for $\textit{AR}$
= 6.5 and 3.2.
$\textit{AR}$
= 6.5 and 3.2.
Interestingly, five concentrated quadrupole streamwise vortical structures are present at $0.2 \lt z/L \lt 0.8$
for the vibrissal FWMC of
$0.2 \lt z/L \lt 0.8$
for the vibrissal FWMC of $\textit{AR} = 22.6$
, as seen in figure 19(b). The vortices are periodically arranged along the span of the cylinder. The vortices present in the quadrupole cell are considerably smaller in scale than the primary streamwise vortical structures generated from the free tip and wall-junction regions. Of the five cycles, two are classified as transition cycles due to their close location to the primary vortex pairs in the spanwise direction. Further, the vortices in the mid-span quadrupole cycle demonstrate comparable scale and magnitude while figure 19(b) presents a close-up view within a black-dashed rectangle. The five cycles associated with the three vortex pairs emanating from the free tip and wall junction correspond to the eight sink points that denote the local maximums of the sinuous wavy separation line II depicted in figure 15(b).
$\textit{AR} = 22.6$
, as seen in figure 19(b). The vortices are periodically arranged along the span of the cylinder. The vortices present in the quadrupole cell are considerably smaller in scale than the primary streamwise vortical structures generated from the free tip and wall-junction regions. Of the five cycles, two are classified as transition cycles due to their close location to the primary vortex pairs in the spanwise direction. Further, the vortices in the mid-span quadrupole cycle demonstrate comparable scale and magnitude while figure 19(b) presents a close-up view within a black-dashed rectangle. The five cycles associated with the three vortex pairs emanating from the free tip and wall junction correspond to the eight sink points that denote the local maximums of the sinuous wavy separation line II depicted in figure 15(b).
For the vibrissal FWMC with $\textit{AR} = 12.9$
, an individual concentrated quadrupole streamwise vortical structure is observed at the mid-span. Figure 19(d) highlights two vortex pairs enclosed within a black dashed rectangle. Nonetheless, the upper vortex pair exhibits a larger scale than the lower vortex pair, attributable to the proximate influence of the primary vortex pair adjacent to the wall junction.
$\textit{AR} = 12.9$
, an individual concentrated quadrupole streamwise vortical structure is observed at the mid-span. Figure 19(d) highlights two vortex pairs enclosed within a black dashed rectangle. Nonetheless, the upper vortex pair exhibits a larger scale than the lower vortex pair, attributable to the proximate influence of the primary vortex pair adjacent to the wall junction.
For $\textit{AR} = 6.5$
and 3.2, such concentrated quadrupole structures are absent. Nevertheless,
$\textit{AR} = 6.5$
and 3.2, such concentrated quadrupole structures are absent. Nevertheless, $\textit{AR} = 6.5$
appears to be a critical aspect ratio for both circular and vibrissal FWMCs. As shown in figures 19(g) and 19(h), for circular cylinders at
$\textit{AR} = 6.5$
appears to be a critical aspect ratio for both circular and vibrissal FWMCs. As shown in figures 19(g) and 19(h), for circular cylinders at $\textit{AR} = 6.5$
, although only one primary vortex pair emanates from the free tip, anti-rotating structures are observed wrapping around the lower half of the wall surface. These structures are of a comparable scale to those associated with the upper part of the wrapping, from which the dipole vortex pair originates. Similar wrapping-wall structures are also present in circular FWMCs of other aspect ratios. However, for circular FWMCs of other aspect ratios (
$\textit{AR} = 6.5$
, although only one primary vortex pair emanates from the free tip, anti-rotating structures are observed wrapping around the lower half of the wall surface. These structures are of a comparable scale to those associated with the upper part of the wrapping, from which the dipole vortex pair originates. Similar wrapping-wall structures are also present in circular FWMCs of other aspect ratios. However, for circular FWMCs of other aspect ratios ( $\textit{AR}$
= 3.2, 12.9 and 22.6), as shown in figures 19(a) and 19(c), the spanwise extent of the upper wrapping structures is approximately twice that of the lower part. This suggests that, for the circular FWMC of
$\textit{AR}$
= 3.2, 12.9 and 22.6), as shown in figures 19(a) and 19(c), the spanwise extent of the upper wrapping structures is approximately twice that of the lower part. This suggests that, for the circular FWMC of $\textit{AR} = 6.5$
, the dipole streamwise vortex pattern, together with the wrapping-wall structures, produces a concentrated quasi-quadrupole configuration with comparable vorticity strength. This corresponds to the similar behaviours of hairpin vortical shedding and a cellular wavepacket mode in the lift force fluctuations for the circular FWMC of
$\textit{AR} = 6.5$
, the dipole streamwise vortex pattern, together with the wrapping-wall structures, produces a concentrated quasi-quadrupole configuration with comparable vorticity strength. This corresponds to the similar behaviours of hairpin vortical shedding and a cellular wavepacket mode in the lift force fluctuations for the circular FWMC of $\textit{AR}$
= 6.5 in comparison with the suppression of vortex shedding for vibrissal FWMCs.
$\textit{AR}$
= 6.5 in comparison with the suppression of vortex shedding for vibrissal FWMCs.
Wrapping-wall structures are also observed for vibrissal FWMC of $\textit{AR}$
= 6.5, but they exhibit an opposite polarity compared with their circular counterpart. These wrapping-wall structures contribute to the formation of a concentrated quasi-quadrupole vortical pattern for the vibrissal FWMC of
$\textit{AR}$
= 6.5, but they exhibit an opposite polarity compared with their circular counterpart. These wrapping-wall structures contribute to the formation of a concentrated quasi-quadrupole vortical pattern for the vibrissal FWMC of $\textit{AR}$
= 6.5. Additionally, a secondary pair of concentrated streamwise vortical structures is identified, rotating in the same direction as the primary streamwise vortex pair. This configuration may account for the increased number of spanwise-distributed wave packets observed in the time–spatial distribution of the lift force, relative to the circular counterpart.
$\textit{AR}$
= 6.5. Additionally, a secondary pair of concentrated streamwise vortical structures is identified, rotating in the same direction as the primary streamwise vortex pair. This configuration may account for the increased number of spanwise-distributed wave packets observed in the time–spatial distribution of the lift force, relative to the circular counterpart.
4. Conclusion
This study has investigated the flow-induced noise and three-dimensional flow structures of harbour seal vibrissal FWMCs with aspect ratios ranging from $\textit{AR}=$
3.2 to 22.6. Large eddy simulation and the FW–H equation were employed for the FWMCs at
$\textit{AR}=$
3.2 to 22.6. Large eddy simulation and the FW–H equation were employed for the FWMCs at $ Re = 12\,000$
with an incoming TBL of
$ Re = 12\,000$
with an incoming TBL of $\delta /D = 1.6$
. Circular FWMCs were studied for comparison, whose configurations followed the experimental measurement reported by Moreau & Doolan (Reference Moreau and Doolan2013). The aerodynamic diameter of the harbour seal vibrissal FWMC was scaled from the geometry in Wang & Liu (Reference Wang and Liu2016) and consistent with that of the circular FWMC.
$\delta /D = 1.6$
. Circular FWMCs were studied for comparison, whose configurations followed the experimental measurement reported by Moreau & Doolan (Reference Moreau and Doolan2013). The aerodynamic diameter of the harbour seal vibrissal FWMC was scaled from the geometry in Wang & Liu (Reference Wang and Liu2016) and consistent with that of the circular FWMC.
The acoustic spectra of the harbour seal vibrissal FWMCs were characterised by broadband noise without prominent tonal peaks. The noise reduction performance was observed for vibrissal FWMCs of $\textit{AR}$
= 22.6 and 12.9 in comparison with its circular counterparts by examining the OASPL. The maximum reduction in OASPL was achieved for the suppression of the primary Aeolian tone ‘P1’ at
$\textit{AR}$
= 22.6 and 12.9 in comparison with its circular counterparts by examining the OASPL. The maximum reduction in OASPL was achieved for the suppression of the primary Aeolian tone ‘P1’ at $\textit{AR}$
= 22.6, where a 24 dB reduction was observed in the transverse-flow direction relative to that of the circular FWMC. For
$\textit{AR}$
= 22.6, where a 24 dB reduction was observed in the transverse-flow direction relative to that of the circular FWMC. For $\textit{AR}$
= 6.5, both vibrissal and circular FWMCs produced a comparable OASPL. However, the effectiveness of the suppression of flow-induced noise diminished and the noise radiated by the harbour seal vibrissal FWMC was slightly higher than that of its circular counterpart at
$\textit{AR}$
= 6.5, both vibrissal and circular FWMCs produced a comparable OASPL. However, the effectiveness of the suppression of flow-induced noise diminished and the noise radiated by the harbour seal vibrissal FWMC was slightly higher than that of its circular counterpart at $St \gt 0.3$
.
$St \gt 0.3$
.
Spanwise-intermittent recirculation zones were observed in the near wake of vibrissal FWMCs, with their number decreasing from nine to one as the $\textit{AR}$
was reduced from 22.6 to 3.2. The spanwise-intermittency of the recirculation zones plays an important role in elongating the vortex formation length. It was suggested that for the present harbour seal vibrissal FWMCs,
$\textit{AR}$
was reduced from 22.6 to 3.2. The spanwise-intermittency of the recirculation zones plays an important role in elongating the vortex formation length. It was suggested that for the present harbour seal vibrissal FWMCs, $\textit{AR} \gt 4.8$
could lead to more than one single recirculation zone and reach a spanwise intermittency in near wake. Correspondingly, cellular shedding was characterised by spanwise-distributed shedding cells, exhibiting weak and intermittent patterns at a higher Strouhal number (
$\textit{AR} \gt 4.8$
could lead to more than one single recirculation zone and reach a spanwise intermittency in near wake. Correspondingly, cellular shedding was characterised by spanwise-distributed shedding cells, exhibiting weak and intermittent patterns at a higher Strouhal number ( $St \sim$
0.25) compared with their circular counterparts in the wake velocity spectra for longer vibrissal FWMCs (
$St \sim$
0.25) compared with their circular counterparts in the wake velocity spectra for longer vibrissal FWMCs ( $\textit{AR} = 12.9$
and 22.6). For
$\textit{AR} = 12.9$
and 22.6). For $\textit{AR} = 22.6$
, the wake in the mid-span region (
$\textit{AR} = 22.6$
, the wake in the mid-span region ( $0.2 \lt z/L \lt 0.8$
) was primarily governed by the geometric effects, where five distinct shedding cells were identified. A similar region was observed in the wake of
$0.2 \lt z/L \lt 0.8$
) was primarily governed by the geometric effects, where five distinct shedding cells were identified. A similar region was observed in the wake of $0.3 \lt z/L \lt 0.5$
for
$0.3 \lt z/L \lt 0.5$
for $\textit{AR} = 12.9$
; however, the geometric influence was weaker compared with the mid-span dominance seen at
$\textit{AR} = 12.9$
; however, the geometric influence was weaker compared with the mid-span dominance seen at $\textit{AR} = 22.6$
. For shorter cylinders (
$\textit{AR} = 22.6$
. For shorter cylinders ( $\textit{AR} = 6.5$
and 3.2), the upwash from the wall junction and the downwash from the free tip competed with the geometry-induced spanwise flow, diminishing the flow control of the undulated surface.
$\textit{AR} = 6.5$
and 3.2), the upwash from the wall junction and the downwash from the free tip competed with the geometry-induced spanwise flow, diminishing the flow control of the undulated surface.
Hairpin vortices, rather than spanwise-continuous vortical structures, dominated the vortex shedding across all vibrissal FWMCs, leading to the complete suppression of classical von Kármán vortex shedding. In addition to the spanwise cellular shedding induced by hairpin vortices, the twisting vortex pair attached to the free tip contributed to turbulence regularisation and suppression of flow fluctuations. It suppresses the vortex shedding cell appearance around the free tip.
The noise-generating structures coherent to the primary tonal peak are broken down into smaller, spanwise-wavy organised elements for the vibrissal FWMCs of $\textit{AR} = 22.6$
and 12.9. The spanwise-wavy pattern formed by these short, successive flow elements exhibited two cycles and one cycle along the entire span of the vibrissal FWMC of
$\textit{AR} = 22.6$
and 12.9. The spanwise-wavy pattern formed by these short, successive flow elements exhibited two cycles and one cycle along the entire span of the vibrissal FWMC of $\textit{AR} = 22.6$
and 12.9, respectively. The spanwise flow motions revealed that the concentrated quadrupole of counter-rotating streamwise vortices modulated the spanwise shedding and stabilised the flow by balancing forces in the transverse (
$\textit{AR} = 22.6$
and 12.9, respectively. The spanwise flow motions revealed that the concentrated quadrupole of counter-rotating streamwise vortices modulated the spanwise shedding and stabilised the flow by balancing forces in the transverse ( $y$
) direction. This structure represents the primary mechanism responsible for vortex shedding suppression in FWMCs, including the circular FWMC at
$y$
) direction. This structure represents the primary mechanism responsible for vortex shedding suppression in FWMCs, including the circular FWMC at $\textit{AR} = 6.5$
and vibrissal FWMCs with
$\textit{AR} = 6.5$
and vibrissal FWMCs with $\textit{AR}$
ranging from 6.5 to 22.6, where the concentrated quadrupole and the quasi-quadrupole structure have been investigated.
$\textit{AR}$
ranging from 6.5 to 22.6, where the concentrated quadrupole and the quasi-quadrupole structure have been investigated.
Acknowledgements
We acknowledge the use of ChatGPT for minor grammatical assistance. We also acknowledge support from the SJTU-UNSW Joint PhD Program.
Funding
This research received no specific grant from any funding agency, commercial or not-for-profit sectors.
Declaration of interests
The authors declare that they have no known competing financial interests or personal relationships that could have appeared to influence the work reported in this paper.
Appendix A
A.1. Validation of the flow-induced noise-prediction methods
Validation was conducted by comparing the numerical far-field acoustic spectra of an infinite harbour seal vibrissal cylinder and circular FWMCs with the experimental data reported by Chen et al. (Reference Chen, Liu, Zang and Azarpeyvand2025a ) and Moreau & Doolan (Reference Moreau and Doolan2013), respectively. This comparison was used to verify the accuracy of the flow-induced noise-prediction methodology.
A.1.1. Mesh study and validation of the infinite harbour seal vibrissa
As no experimental measurements of the flow-induced noise from vibrissal FWMCs are currently available, the aeroacoustic behaviour and flow dynamics of an infinite harbour seal vibrissa were examined and compared with existing experimental studies. To the best of the authors’ knowledge, only three investigations have examined the flow-induced noise of an infinite harbour seal vibrissa: Smith et al. (Reference Smith, Chen and Zang2023), Zhu et al. (Reference Zhu, Yuan, Hu, Yang and Xu2024) and Chen et al. (Reference Chen, Liu, Zang and Azarpeyvand2025a ). Among these, the study of Chen et al. (Reference Chen, Liu, Zang and Azarpeyvand2025a ) is the closest to the present Reynolds number, with a value of 36 000.
The simulation of the infinite harbour seal vibrissal cylinder was performed using parameters consistent with the experiments of Chen et al. (Reference Chen, Liu, Zang and Azarpeyvand2025a
). The cylinder has an aerodynamic diameter of 22 mm, is subjected to a free-stream velocity of 25 m s−1, resulting in $\textit{Re} = 36\,000$
and the observer was set at angle of
$\textit{Re} = 36\,000$
and the observer was set at angle of $\theta = 90^\circ$
. In this case, a circular computational domain was used instead of the one illustrated in figure 2. An O-grid block was used around the infinite cylinder to ensure consistent mesh resolution in the circumferential, radial, and spanwise directions, matching that used for the FWMCs.
$\theta = 90^\circ$
. In this case, a circular computational domain was used instead of the one illustrated in figure 2. An O-grid block was used around the infinite cylinder to ensure consistent mesh resolution in the circumferential, radial, and spanwise directions, matching that used for the FWMCs.
The mesh study was conducted for the infinite harbour seal vibrissa. Three scales of the mesh were adopted to study the mesh for the three-dimensional undulated geometry. The mesh parameters are given in table 3, where $n_r$
is the number of radial cells;
$n_r$
is the number of radial cells; $n_c$
is the number of circumferential cells;
$n_c$
is the number of circumferential cells; $n_s$
is the number of spanwise cells. The results of the mesh study of the infinite harbour seal vibrissa can be found in figure 20 and table 3.
$n_s$
is the number of spanwise cells. The results of the mesh study of the infinite harbour seal vibrissa can be found in figure 20 and table 3.
Mesh parameters and results of the mesh study for an infinite harbour seal vibrissa.

As shown in figure 20, the acoustic spectrum and the lift coefficient are similar for the different scale meshes. Nevertheless, the centre frequency of the minor hump predicted by the ‘coarse mesh’ is found to be slightly smaller than those predicted by the others. Additionally, the drag coefficient shows that the ‘medium-fine mesh’ has converged to the finer mesh results. Considering both the simulation efficiency and the requirement for numerical accuracy, the mesh parameters of ‘medium-fine mesh’ are adopted in this study. The results of the mesh study of the infinite harbour seal vibrissa are summarised in table 3, where $S_t$
is the central frequency of the minor hump.
$S_t$
is the central frequency of the minor hump.
An overview of the selected mesh resolution is given in figure 21. The highest ratio of local values is observed in the vortex shedding region, with a maximum value of 10.86. In the wake of the infinite harbour seal vibrissa, the majority of the flow is resolved with a spatial resolution ranging from four to eight Kolmogorov scales, which is sufficient to resolve the acoustics and flow fields, as demonstrated by figure 20.
The acoustic spectrum and the time-averaged flow fields are compared with the experimental results in detail as well. Figure 20 presents the far-field acoustic spectrum of the infinite harbour seal vibrissal cylinder, compared with the experimental results of Chen et al. (Reference Chen, Liu, Zang and Azarpeyvand2025a ).
To demonstrate the accuracy of the simulation methodology, the acoustic spectrum and the time-averaged flow fields are compared with the experimental results. The computed acoustic spectrum, figure 20, of the infinite harbour seal vibrissa shows good agreement with Chen et al. (Reference Chen, Liu, Zang and Azarpeyvand2025a
) in both the centre frequency of the broadband hump and the overall spectral shape. The lower magnitude observed at low frequencies in the numerical acoustic spectra, compared with the experimental measurements, could be attributed to background noise generated by the facilities in the experiments. Previous studies on infinite circular and harbour seal vibrissal cylinders such as Smith et al. (Reference Smith, Chen and Zang2023) and Zhu et al. (Reference Zhu, Yuan, Hu, Yang and Xu2024) reported similar discrepancies. Smith et al. (Reference Smith, Chen and Zang2023) demonstrated that wind-tunnel background noise can elevate the measured sound pressure level, particularly when the true radiated sound approaches the facility noise floor. Likewise, Zhu et al. (Reference Zhu, Yuan, Hu, Yang and Xu2024) observed higher experimental amplitudes below 100 Hz and attributed them to nozzle-generated background noise. Hence, the lower amplitudes predicted for $St \lt 0.2$
(
$St \lt 0.2$
( $f\lt 227$
Hz) are likely due to background noise in the measurements, as acknowledged by Chen et al. (Reference Chen, Liu, Zang and Azarpeyvand2025a
), who reported that the broadband components were influenced by facility noise more than in this frequency range.
$f\lt 227$
Hz) are likely due to background noise in the measurements, as acknowledged by Chen et al. (Reference Chen, Liu, Zang and Azarpeyvand2025a
), who reported that the broadband components were influenced by facility noise more than in this frequency range.
No tonal peaks are observed in either acoustic spectrum, however, a low-amplitude hump is visible at a Strouhal number of $St$
= 0.26 (
$St$
= 0.26 ( $St = fD/U_0$
, where
$St = fD/U_0$
, where $f$
is the frequency of the spectrum) in the experimental results is attributed to weak vortex shedding in the wake (Chen et al. Reference Chen, Liu, Zang and Azarpeyvand2025a
). The present numerical simulation captures this phenomenon, displaying a broad hump in the range of
$f$
is the frequency of the spectrum) in the experimental results is attributed to weak vortex shedding in the wake (Chen et al. Reference Chen, Liu, Zang and Azarpeyvand2025a
). The present numerical simulation captures this phenomenon, displaying a broad hump in the range of $St$
from 0.22 to 0.3.
$St$
from 0.22 to 0.3.
Comparison of the numerical results of different meshes for the infinite harbour seal vibrissa: (a) far-field acoustic spectra, (b) drag coefficients, (c) lift coefficients.

Contours of the spatial resolution in different sectional planes: (a) the streamwise-sectional plane of $y = 0$
, (b) the horizontal-sectional plane at nodal position, (c) the horizontal-sectional plane at saddle position.
$y = 0$
, (b) the horizontal-sectional plane at nodal position, (c) the horizontal-sectional plane at saddle position.

Figure 22 compares the LES numerical simulation results of the time-averaged and r.m.s. velocity distributions in the nodal and saddle planes of the harbour seal vibrissal cylinder with the PIV measurements reported by Chen et al. (Reference Chen, Liu, Zang and Azarpeyvand2025a
). In each subfigure, the upper and lower halves depict the streamwise ( $u$
) and transverse (
$u$
) and transverse ( $v$
) velocity components, respectively, which exhibit symmetry or anti-symmetry about the centreline at
$v$
) velocity components, respectively, which exhibit symmetry or anti-symmetry about the centreline at $y/D = 0$
. The left column displays the LES simulation results, while the right column shows the corresponding PIV experimental data. To ensure a meaningful comparison, the colour bar ranges in each row of the LES simulations are matched to those used in the experimental visualisations.
$y/D = 0$
. The left column displays the LES simulation results, while the right column shows the corresponding PIV experimental data. To ensure a meaningful comparison, the colour bar ranges in each row of the LES simulations are matched to those used in the experimental visualisations.
The time-averaged and r.m.s. velocity distributions in the near wake from the present LES simulations (left column) show good agreement with the experimental measurements (right column). The negative streamwise velocity indicates the presence of the recirculation zone. In the time-averaged flow fields, the recirculation zones and the water-drop-shaped region ( $x/D$
= 2) formed by high-magnitude transverse velocity in the LES results are consistent with the patterns observed in the PIV measurements. For the r.m.s. velocity distributions, a slight contraction in the transverse direction (
$x/D$
= 2) formed by high-magnitude transverse velocity in the LES results are consistent with the patterns observed in the PIV measurements. For the r.m.s. velocity distributions, a slight contraction in the transverse direction ( $y$
) is observed in the LES results compared with the PIV data, as illustrated in figures 22(e) and 22(f). This discrepancy can be attributed to numerical dissipation downstream, particularly for
$y$
) is observed in the LES results compared with the PIV data, as illustrated in figures 22(e) and 22(f). This discrepancy can be attributed to numerical dissipation downstream, particularly for $x/D \gt 4$
.
$x/D \gt 4$
.
Variations in flow structures along the spanwise direction of the harbour seal vibrissal cylinder are evident when comparing the nodal and saddle planes. In both the numerical and experimental observations, the nodal plane exhibits shorter (in the streamwise direction) and narrower (in the transverse-flow direction) recirculation zones, as shown in figures 22(a) and 22(e). In contrast, a more elongated recirculation zone extending downstream to approximately $x/D = 2.6$
is observed in the saddle plane, as shown in figures 22(c) and 22(d). Additionally, notable variations occur in the streamwise direction. As illustrated in figure 22(e), the transverse r.m.s. velocity component (
$x/D = 2.6$
is observed in the saddle plane, as shown in figures 22(c) and 22(d). Additionally, notable variations occur in the streamwise direction. As illustrated in figure 22(e), the transverse r.m.s. velocity component ( $v_{rms}$
) in the nodal plane reaches a magnitude of approximately 0.3, showing a contraction near
$v_{rms}$
) in the nodal plane reaches a magnitude of approximately 0.3, showing a contraction near $x/D = 2$
followed by expansion further downstream. A similar trend is observed in the experimental results of Chen et al. (Reference Chen, Liu, Zang and Azarpeyvand2025a
) (figure 22
f) This convergent-divergent behaviour is also reported by Jie and Liu Jie & Liu (Reference Jie and Liu2017), who conducted LES of the infinite harbour seal vibrissal cylinder at
$x/D = 2$
followed by expansion further downstream. A similar trend is observed in the experimental results of Chen et al. (Reference Chen, Liu, Zang and Azarpeyvand2025a
) (figure 22
f) This convergent-divergent behaviour is also reported by Jie and Liu Jie & Liu (Reference Jie and Liu2017), who conducted LES of the infinite harbour seal vibrissal cylinder at $\textit{Re} = 18{\,}000$
. These observations suggest that the velocity fluctuations are stabilised in the nodal plane, potentially resulting in a different vortex shedding pattern in comparison with that of a circular cylinder.
$\textit{Re} = 18{\,}000$
. These observations suggest that the velocity fluctuations are stabilised in the nodal plane, potentially resulting in a different vortex shedding pattern in comparison with that of a circular cylinder.
Time-averaged and r.m.s. velocity distributions in the nodal and saddle planes of the harbour seal vibrissal cylinder: (a, b) time-averaged velocity in the nodal plane; (c, d) time-averaged velocity in the saddle plane; (e, f) r.m.s. velocity in the nodal plane; (g, h) r.m.s. velocity in the saddle plane. In each subfigure, the upper and lower halves represent the streamwise velocity component ( $u$
) and the transverse velocity component (
$u$
) and the transverse velocity component ( $v$
), respectively. The present LES numerical results are compared with the PIV measurements reported by Chen et al. (Reference Chen, Liu, Zang and Azarpeyvand2025a
) The left column (a, c, e, g) shows the LES simulations, while the right column (b, d, f, h) presents the corresponding PIV experimental results adapted from the study of Chen et al. (Reference Chen, Liu, Zang and Azarpeyvand2025a
), licenced CC BY licence (https://creativecommons.org/licenses/by/4.0/).
$v$
), respectively. The present LES numerical results are compared with the PIV measurements reported by Chen et al. (Reference Chen, Liu, Zang and Azarpeyvand2025a
) The left column (a, c, e, g) shows the LES simulations, while the right column (b, d, f, h) presents the corresponding PIV experimental results adapted from the study of Chen et al. (Reference Chen, Liu, Zang and Azarpeyvand2025a
), licenced CC BY licence (https://creativecommons.org/licenses/by/4.0/).

Far-field acoustic spectra of the circular FWMCs in comparison with the experimental results of Moreau & Doolan (Reference Moreau and Doolan2013) for different aspect ratios: (a) $\textit{AR}$
= 22.6, (b)
$\textit{AR}$
= 22.6, (b) $\textit{AR}$
= 12.9, (c)
$\textit{AR}$
= 12.9, (c) $\textit{AR}$
= 6.5, (d)
$\textit{AR}$
= 6.5, (d) $\textit{AR}$
= 3.2.
$\textit{AR}$
= 3.2.

A.1.2. Validation of the circular FWMCs
Figure 23 shows the far-field acoustic spectra of the circular FWMCs of different aspect ratios in comparison with the experimental results of Moreau & Doolan (Reference Moreau and Doolan2013). The data used for figure 23 were recorded at an observer whose location was consistent with that of Moreau & Doolan (Reference Moreau and Doolan2013). The observer angle is shown in figure 23.
The numerical simulations show good agreement with the experimental data over the primary frequency range of 400 Hz to 2 kHz, with both the frequency and amplitude of the tonal peaks accurately captured. Nevertheless, consistently lower amplitudes are observed in the numerical results at low frequencies ( $f\lt 400$
Hz) for all aspect ratios. In addition, for
$f\lt 400$
Hz) for all aspect ratios. In addition, for $\textit{AR} = 3.2$
, reduced amplitudes are also evident in the higher-frequency range of 2–4 kHz. Moreau & Doolan (Reference Moreau and Doolan2013) demonstrated that, for circular FWMC measurements, the anechoic wind-tunnel facility can be regarded as acoustically free field only above approximately 250 Hz. At lower frequencies, the measured spectrum is influenced by facility background noise, whereas the test model aerodynamic noise becomes dominant as frequency increases. As
$\textit{AR} = 3.2$
, reduced amplitudes are also evident in the higher-frequency range of 2–4 kHz. Moreau & Doolan (Reference Moreau and Doolan2013) demonstrated that, for circular FWMC measurements, the anechoic wind-tunnel facility can be regarded as acoustically free field only above approximately 250 Hz. At lower frequencies, the measured spectrum is influenced by facility background noise, whereas the test model aerodynamic noise becomes dominant as frequency increases. As $\textit{AR} = 3.2$
produces the lowest-amplitude tonal peak and broadband noise, the signal-to-noise ratio is reduced. The increased relative contribution of background noise likely leads to the larger discrepancies with the numerical results.
$\textit{AR} = 3.2$
produces the lowest-amplitude tonal peak and broadband noise, the signal-to-noise ratio is reduced. The increased relative contribution of background noise likely leads to the larger discrepancies with the numerical results.
Mesh parameters and results of the mesh study for a vibrissal FWMC of $\textit{AR} = 3.2$
.
$\textit{AR} = 3.2$
.

Comparison of the numerical results of different meshes for the harbour seal vibrissal FWMCs: (a) far-field acoustic spectra, (b) drag coefficients, (c) lift coefficients.

The peaks of the long cylinders ( $\textit{AR} = 12.9$
and 22.6) were determined as local maxima exceeding the surrounding broadband noise by more than 5 dB, consistent with the criterion adopted by Chen et al. (Reference Chen, Doolan and Moreau2025b
). Peak identification was further supported by comparison with the findings of Moreau & Doolan (Reference Moreau and Doolan2013), who reported corresponding peaks at similar Strouhal numbers.
$\textit{AR} = 12.9$
and 22.6) were determined as local maxima exceeding the surrounding broadband noise by more than 5 dB, consistent with the criterion adopted by Chen et al. (Reference Chen, Doolan and Moreau2025b
). Peak identification was further supported by comparison with the findings of Moreau & Doolan (Reference Moreau and Doolan2013), who reported corresponding peaks at similar Strouhal numbers.
The tonal peaks are well captured in the numerical simulation with a slightly higher frequency than that of the experimental results. The Aeolian tone, characterised by the primary peak labelled ‘P1’ in the acoustic spectra, appears only for long cylinders ( $\textit{AR}$
= 12.9 and 22.6). An additional secondary tone linked with the tip flow, which occurs at a lower frequency and magnitude, ‘P2’ , is also visible in figures 23(a) and 23(b). As the cylinder length decreases, both ‘P1’ and ‘P2’ disappear for
$\textit{AR}$
= 12.9 and 22.6). An additional secondary tone linked with the tip flow, which occurs at a lower frequency and magnitude, ‘P2’ , is also visible in figures 23(a) and 23(b). As the cylinder length decreases, both ‘P1’ and ‘P2’ disappear for $\textit{AR}$
= 6.5, as shown in figure 23(c). However, figure 23(d) demonstrates the reappearance of ‘P1’ in the spectrum for
$\textit{AR}$
= 6.5, as shown in figure 23(c). However, figure 23(d) demonstrates the reappearance of ‘P1’ in the spectrum for $\textit{AR}$
= 3.2. The magnitude of the primary peak ‘P1’ captured in the simulations is consistent with that of the measurements by Moreau & Doolan (Reference Moreau and Doolan2013). The magnitude of the secondary peak ‘P2’ of
$\textit{AR}$
= 3.2. The magnitude of the primary peak ‘P1’ captured in the simulations is consistent with that of the measurements by Moreau & Doolan (Reference Moreau and Doolan2013). The magnitude of the secondary peak ‘P2’ of $\textit{AR}$
= 12.9 and the broadband noise of
$\textit{AR}$
= 12.9 and the broadband noise of $\textit{AR}$
= 3.2 is slightly lower than that of the experimental results. This could be attributed to the experimental measurements having a longer time span of the acoustic time histories than that of the numerical simulations.
$\textit{AR}$
= 3.2 is slightly lower than that of the experimental results. This could be attributed to the experimental measurements having a longer time span of the acoustic time histories than that of the numerical simulations.
A.1.3. Mesh study of the harbour seal vibrissal FWMCs
The mesh study had been conducted for the harbour seal vibrissal FWMC of $\textit{AR} = 3.2$
. Three sets mesh of different grid resolutions for
$\textit{AR} = 3.2$
. Three sets mesh of different grid resolutions for $\textit{AR} = 3.2$
were used to study the sensitivity of the grid. Figure 24 presents the far-field acoustics spectra and aerodynamic force coefficients, demonstrating that the medium-fine mesh already achieves satisfactory convergence and spatial accuracy. The mesh parameters and results of the mesh study are summarised in table 4. The FWMCs with different aspect ratios examined in this study exhibited consistent mesh configuration with that of the medium-fine mesh.
$\textit{AR} = 3.2$
were used to study the sensitivity of the grid. Figure 24 presents the far-field acoustics spectra and aerodynamic force coefficients, demonstrating that the medium-fine mesh already achieves satisfactory convergence and spatial accuracy. The mesh parameters and results of the mesh study are summarised in table 4. The FWMCs with different aspect ratios examined in this study exhibited consistent mesh configuration with that of the medium-fine mesh.
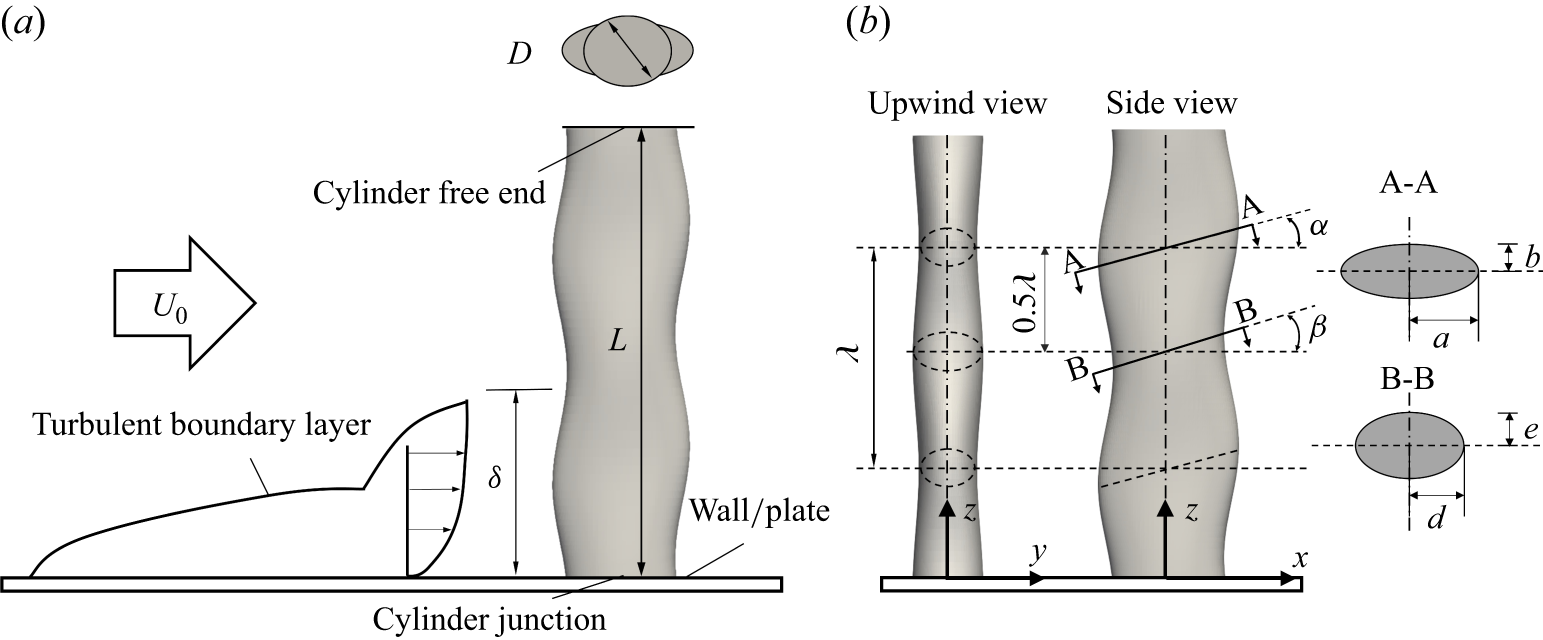


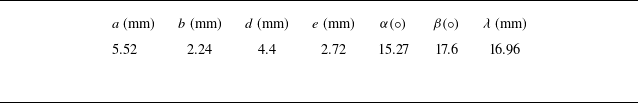


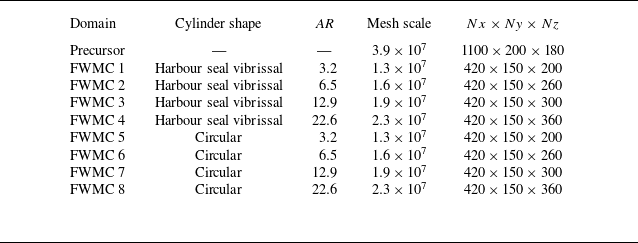


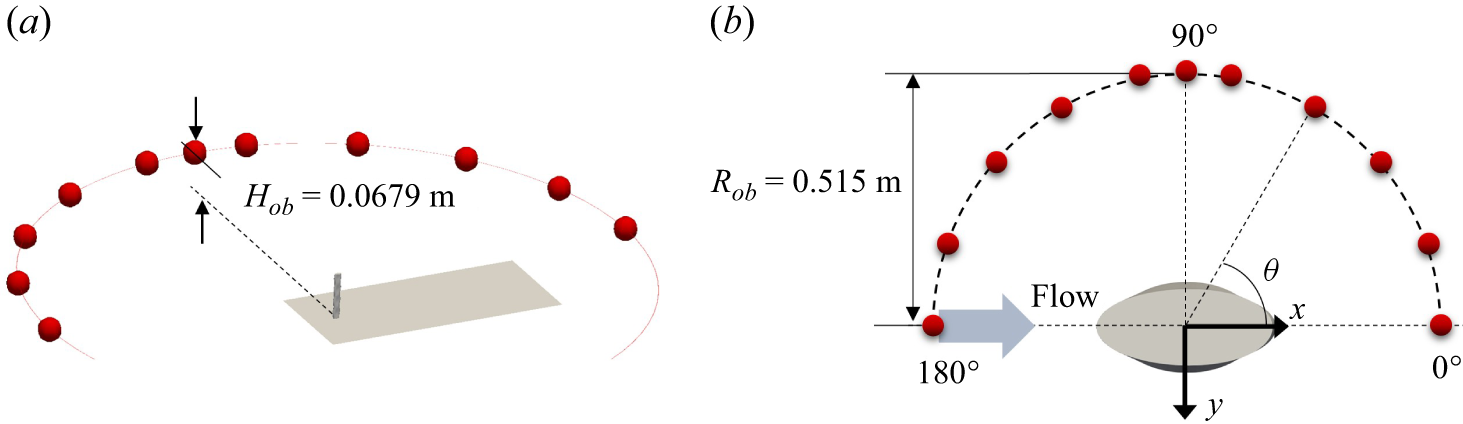


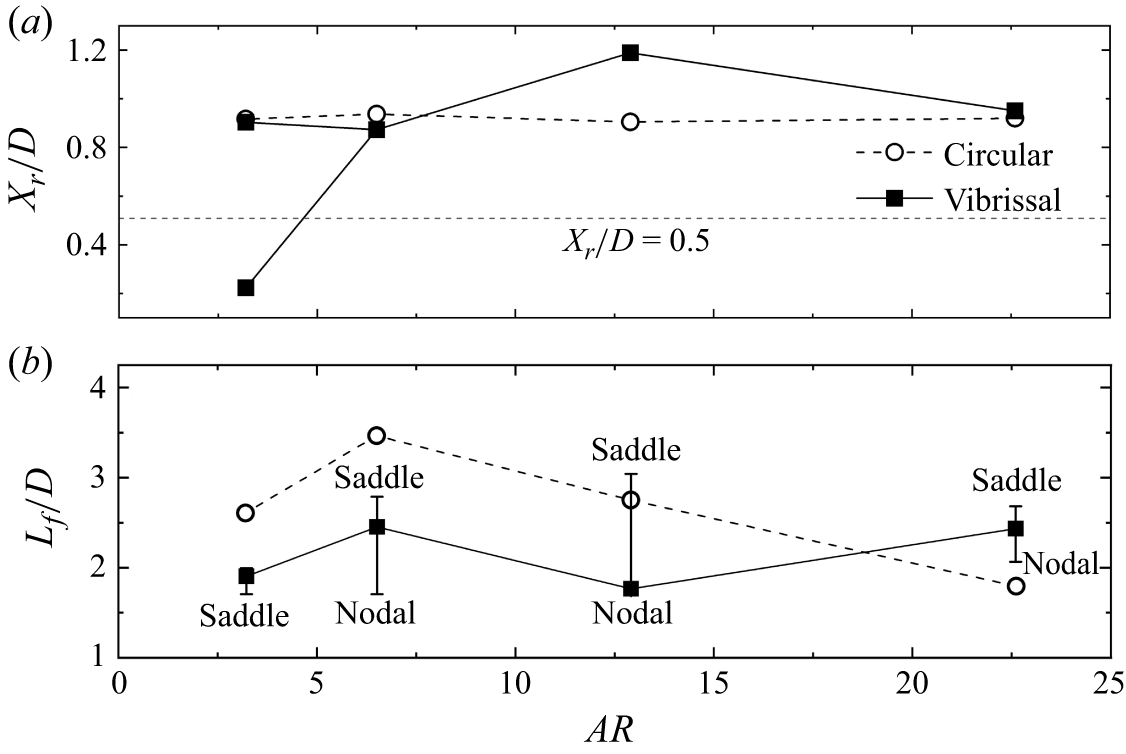


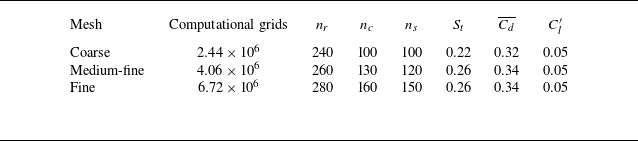


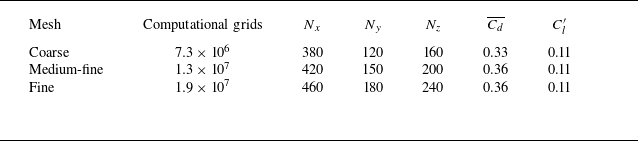


 Open access