


Introduction
The cellular stress response can lead to numerous pathways, and one of the most common mechanisms is inflammation. Inflammation plays a destructive role in the response to endogenous and exogenous irritation or injury. Physiologic stress, internal and external stimulants contribute to the development and progression of inflammation-related diseases.(Reference Haq, Grondin, Banskota and Khan1) It is well recognized that inflammation is the most important event in the pathophysiology of inflammation-related diseases such as Inflammatory Bowel Disease (IBD).(Reference Ramos and Papadakis2) Chronic inflammation in the gut has been associated with the development of various gastrointestinal diseases such as Crohn’s disease (CD) and ulcerative colitis (UC).(Reference Le Berre, Ananthakrishnan, Danese, Singh and Peyrin-Biroulet3,Reference Sankarasubramanian, Ahmad, Avuthu, Singh and Guda4) Recent studies have shown that inflammatory diseases, including UC and CD, are associated with different degradation pathways, especially autophagy. Therefore, the relationship between autophagy and IBD is currently the subject of much scientific debate in the world.(Reference Iida, Onodera and Nakase5)
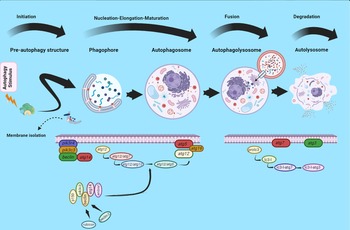
Autophagy is a fundamental cellular process increasingly recognized for its role in intestinal barrier disruption and inflammation.(Reference Larabi, Barnich and Nguyen6) Its primary function is the degradation of misfolded proteins and dysfunctional organelles, recycling them into essential nutrients such as amino acids. During autophagy, intracellular membranes – including the endoplasmic reticulum – contribute to forming a double-membrane structure termed the phagophore. The initiation of phagophore formation is regulated by the class III phosphatidylinositol 3-kinase (PIK3C3) complex, which includes PIK3C3 (VPS34), ATG14, Beclin1, and PIK3R4 (VPS15). As the phagophore elongates, it engulfs targeted cytoplasmic components to generate an autophagosome. Membrane expansion and closure rely on two ubiquitin-like conjugation systems that mediate LC3 lipidation. Here, ATG7 (E1-like) and ATG3 (E2-like) catalyse the conversion of LC3-I to LC3-II, which incorporates into the autophagosomal membrane. In parallel, ATG12 conjugates with ATG5, and this complex associates with ATG16 to form a multimeric structure essential for autophagosome maturation (Figure 1). Once assembled, the autophagosome fuses with a lysosome to create an autolysosome, where the enclosed material is degraded and recycled. These coordinated molecular events, governed by specific autophagy-related genes, reflect the core framework of the canonical autophagy pathway.(Reference Iida, Onodera and Nakase5,Reference Yang and Klionsky7,Reference Li, Liu, Wu and Li8)
Autophagy pathway. Autophagy is a multistep process that consist of the following steps: initiation, nucleation, elongation, maturation, fusion and degradation stage. Several proteins called autophagy-related genes regulate this process. Autophagy is stimulated under normal conditions and triggered by different stimulants. atg: autophagy-related genes; the formation of phagophore is depending on the interactions between lipid bilayers and recruited ULK complex and PI3K complex (composed of atg14, beclin, pik3r4 and pik3c3). At the same time, two different conjugation systems, LC3 and the complex of atg12-atg5-atg16 and atg3, atg7 are involved in the assembling of autophagosome.

The autophagy process protects the integrity of the barrier and limits chronic intestinal inflammation by adjusting inflammation-induced apoptosis.(Reference Elshaer and Begun9) Disruptions in autophagy mechanisms can trigger various human ailments such as metabolic disorders, neurodegenerative conditions, ageing, inflammatory bowel disease (IBD), and different types of cancer.(Reference Ichimiya, Yamakawa and Hirano10) For example, deletion of the autophagy gene atg16 in the T cells of mice resulted in intense intestinal inflammation.(Reference Kabat, Harrison and Riffelmacher11) In general, a comprehensive understanding of autophagy-related genes (atg) has helped to elucidate the link between autophagy and the pathogenesis of various inflammatory diseases.(Reference Ichimiya, Yamakawa and Hirano10)
Probiotics exert beneficial effects on the host by integrating into the gut microbiota and regulating mucosal barrier inflammation.(Reference Sánchez, Delgado, Blanco-Míguez, Lourenço, Gueimonde and Margolles12) Probiotics can alter the composition of the gut microbiome, leading to improvement or prevention of gut inflammation and other intestinal or systemic disease phenotypes. They have been shown to enhance/modulate inflammatory responses as well as alleviate infection, inflammation, and intestinal disease by modulating gut function.(Reference Cristofori, Dargenio, Dargenio, Miniello, Barone and Francavilla13) The majority of probiotic microorganisms are classified under the genera Lactobacillus and Bifidobacterium, with most species of Lactobacillus and Bifidobacterium serving as probiotics.(Reference Khalighi, Behdani, Kouhestani, Rao and Rao14) The anti-inflammatory effect of Lactobacillus and Bifidobacterium species has been demonstrated in rodent colitis models and in patients with IBD by affecting the NF-κB signalling pathway and IL-8 secretion.(Reference Plaza-Díaz, Ruiz-Ojeda, Vilchez-Padial and Gil15)
Previous research indicates that when Lactobacillus and Bifidobacterium are examined separately, they exhibit an ability to reduce inflammation by impacting inflammatory pathways and pro-inflammatory cytokines.(Reference Oh, Joung, Lee and Kim16,Reference Aghamohammad, Sepehr, Miri, Najafi, Pourshafie and Rohani17) By determining the exact mechanism by which probiotics exert their anti-inflammatory effects, we can gain a better understanding of the relationship between probiotics and the reduction of inflammation. This study will specifically focus on examining the impact of our selected probiotics on the progression of inflammation. We will analyse the expression of autophagy genes to determine whether the combination of probiotics can have any beneficial effects on reducing inflammation.
Also, this study aimed to investigate the effect of our native strains on expression patterns of key genes involved in different stages of the autophagy process. Specifically, we examined genes associated with phagophore formation (pik3C3, atg14, beclin, and pik3R4) and genes related to autophagosome formation (atg5, atg16, atg7 and atg3). By analysing these gene groups, we sought to better understand their coordinated roles and regulatory significance in the progression of autophagy under the studied conditions.
Material and methods
Probiotic cocktail preparation and pathogenic bacterial mixture
To assess the effects of the probiotic mixture on the autophagy signalling pathway, a molecular in vitro assay was conducted using the HT-29 colon carcinoma cell line. The probiotic mixture consisted of four Lactobacillus species, including L. plantarum 42, L. rhamnosus 195, L. brevis 205, and L. reuteri 100 and five Bifidobacterium species, including Bifidum Bifidum 1001 and 1005, Bifidum longum 1044, and Bifidum infantis 1015 and 1063. These species were obtained from stool samples and breast milk, as previously explained.(Reference Rohani, Noohi, Talebi, Katouli and Pourshafie18,Reference Eshaghi, Bibalan and Rohani19) The pathogenic bacterial mixture included Enterotoxin-producing Escherichia coli (ETEC) and Salmonella typhimurium (ST), as described before.(Reference Torkamaneh, Torfeh and Jouriani20) All protocols adhered to the Helsinki Declaration and were approved by the ethics committee of the Pasteur Institute of Iran (IR.PII.REC.1401.002). All methods were carried out in accordance with applicable guidelines and regulations.
HT-29 cell culture treatment
Enterotoxigenic Escherichia coli (ETEC, ATCC 25922) and Salmonella typhimurium (ST, ATCC 13311) were cultured overnight at 37°C in Luria-Bertani (LB) broth. Bacterial cells were harvested by centrifugation, washed, and resuspended in 0.1 M phosphate buffer (pH 6.9) to a final concentration of 1.5 × 10⁸ cells/mL (0.5 MacFarland). Cell disruption was performed by sonication on ice using an ultrasonic homogenizer (Ultrasonic 1000) with 30-second pulses until complete lysis was achieved. The homogenate was then centrifuged at 10,000 × g for 30 minutes at 4°C to remove cellular debris. The resulting supernatant, containing the soluble bacterial lysate, was aliquoted and stored at –70°C until further use.
For the preparation of the probiotic cocktail, each bacterial strain was cultured individually in MRS broth under anaerobic conditions at 37°C for 18 hours. Once the optical density at 600 nm (OD600) reached 1.0, indicating a concentration of approximately 10^9 CFU/mL, the cultures were centrifuged at 12,000 × g for 5 minutes at 4°C. The resulting bacterial pellets were then subjected to two washes with sterile, anaerobic phosphate-buffered saline (PBS) to thoroughly remove any residual media components. Finally, each washed pellet was meticulously re-suspended in an equal volume of anaerobic PBS. The final probiotic cocktail was then assembled by combining equal volumes of each individual bacterial suspension, thus ensuring a uniform mixture with equivalent cell counts contributed by every strain.
The preventive effects of probiotic cocktail before inflammation (pre-phase)
First, Lactobacillus/Bifidobacterium mixture (MOI 100; Multiplicity of Infection) was added to the HT-29 cell line (2 × 10^5 HT-29 cells per well), then in order to induce inflammation after 6 hours, SP-ETEC and SP-ST (200 μl prepared SP-ETEC and SP-ST as described in section 2.2) were added to the HT-29 cell culture flask to investigate Lactobacillus/Bifidobacterium mixture effect before inflammation initiation (LB→ETEC+ST).
The therapeutic effects of probiotic cocktail concurrently with inflammation (simultaneous-phase)
A mixture of Lactobacillus and Bifidobacterium (MOI100) corresponding to 2 × 10^5 HT-29 cells per well, along with SP-ETEC and SP-ST (200 μl prepared SP-ETEC and SP-ST as described in section 2.2), were introduced together into the HT-29 cell line, in order to examine the impact of the Lactobacillus/Bifidobacterium mixture during the initial stages of inflammation induction (LB+ETEC+ST).
The therapeutic effects of probiotic cocktail after inflammation (post-phase)
First, the HT-29 cell line was treated with SP-ETEC and SP-ST (200 μl prepared SP-ETEC and SP-ST as described in section 2.2). Then, after 6 hours, the HT-29 cell culture flask was supplemented with a mixture of Lactobacillus and Bifidobacterium (MOI100 corresponding to 2 × 10^5 HT-29 cells per well), to examine the impact of the Lactobacillus/Bifidobacterium mixture following inflammation induction (ETEC+ST→LB). In addition, each treatment ultimately included two biological replicates and three technical replicates. Subsequently, non-adherent bacteria and excess particles were removed by washing each well twice with PBS. These treatments were carried out in duplicate, and the cell culture was maintained at 37°C and 5% CO2 for a maximum of 48 hours. The MOI was determined as previously reported.(Reference Ghanavati, Asadollahi, Shapourabadi, Razavi, Talebi and Rohani21)
The assessment of autophagy signalling pathway genes
According to the manufacturer’s instructions (Roche, Germany), the extraction of total RNA was carried out. Following this, the cDNA template was generated utilizing the cDNA synthesis kit (Yekta Tajhiz, Iran) in accordance with the manufacturer’s instructions. The PrimerBank website (http://pga.mgh.harvard.edu/primerbank) was applied to select the qPCR primers (Table 1). To determine the appropriate annealing temperature for all the primers, Gradient PCR was employed. The quantification of studied genes was assessed with the ABI step one plus detection system (Applied Biosystems, USA co.) by using the SYBR Green master mix (Amplicon Bio, Denmark). All the reactions were performed in triplicate. The relative gene expression in the comparative CT method was demonstrated using the analytical formula RQ = 2−ΔΔCT.(Reference Rao, Huang, Zhou and Lin22) In order to normalize the data, a housekeeping gene is required, and thus, the glyceraldehyde 3-phosphate dehydrogenase was chosen as the internal control gene.(Reference Gilsbach, Kouta, Bönisch and Brüss23)
Primer sequences used in this study

Table 1. Long description
A table with seven rows and four columns. The columns are labeled Gene name, Primer forward, Primer reverse, Primer bank ID, and Product size (bp). The table lists the following data: Row 1: Gene name, pik3C3; Primer forward, GTCTGGCCTAATGTAGAAGCAG; Primer reverse, GGCAAGACGGCTCATCTGAT; Primer bank ID, 34761063c3; Product size (bp), 96. Row 2: Gene name, atg14; Primer forward, GCAAATCTTCGACGATCCCAT; Primer reverse, CACACCCGTCTTTACTTCCTC; Primer bank ID, 335057541c3; Product size (bp), 75. Row 3: Gene name, beclin; Primer forward, CTGGTAGAAGATAAAACCCGGTG; Primer reverse, AGGTAGAGCGTGGACTATCCG; Primer bank ID, 50843826c1; Product size (bp), 76. Row 4: Gene name, pik3R4; Primer forward, CCTGGTCGTTGTGAAGGTTT; Primer reverse, TCTGTGCAGAATTAAGCCTGATT; Primer bank ID, 116812580c1; Product size (bp), 104. Row 5: Gene name, atg7; Primer forward, CAGTTTGCCTTCTTAGTAGTGC; Primer reverse, CCAGCCGATACCTCGTCAGC; Primer bank ID, 222144228c1; Product size (bp), 82. Row 6: Gene name, atg5; Primer forward, AAAGATGTGCTTCGAGATGTGT; Primer reverse, CACTTTGTCAGTTACCAACGTCA; Primer bank ID, 92859692c1; Product size (bp), 144. Row 7: Gene name, atg16; Primer forward, ACCTGCGTGTCAGCAACAT; Primer reverse, CAGCTTTGGTCCAGTCAGAAC; Primer bank ID, 55743107c3; Product size (bp), 75. Row 8: Gene name, atg3; Primer forward, ACATGGCAATGGGCTACAGG; Primer reverse, CTGTTTGCACGCTTATAGCA; Primer bank ID, 34147490c2; Product size (bp), 108.
Statistical data analysis
The Graph Pad Prism 8 (GraphPad Software Inc., United States) was utilized conducting statistical data analyses. Differences between groups were calculated using one-way ANOVA followed by Tukey’s post hoc test. The comparison was made between Ctrl and ETEC+ST, probiotic treatments and ETEC+ST, as well as probiotic treatments with each other. P < 0.05 and P < 0.001 were considered statistically significant. Results were represented as mean ± standard deviation (SD).
Results
Our research outcomes were categorized into two groups based on the position of genes within the autophagy process, as follow:
Genes in the phagophore formation (pik3C3, atg14, beclin, and pik3R4)
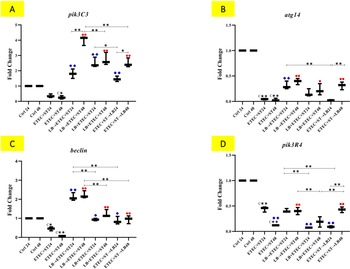
A notable reduction in pik3C3 expression was seen in the ETEC+ST48 group compared to the Ctrl 48 group (refer to Figure 2A). Across all treatments and phases, there was an increase in gene expression levels. No significant differences were noted in the 24-hour treatments. Notably, in the 48-hour treatments, the most pronounced impact on pik3C3 was seen in the LB→ETEC+ST48 group (p < 0.001), indicating the influence of Lactobacillus/Bifidobacterium spp. Nevertheless, a marked increase was evident in the 48-hour treatments compared to the 24-hour treatments in both pre- and post-phases.
Relative gene expression (mean fold change) of autophagy genes in the different groups of treatments. Data were represented as mean ± SD. Data were considered as statistically significant when p < 0.05 (*p < 0.05, **p < 0.001). Letter A–D indicates the graphs of genes involved in nucleation-elongation-maturation stage (A: pik3C3, B: atg14, C: beclin, D: pik3R4). C* and C** shows the relatedness between Ctrl 24 and Ctrl 48 with ETEC+ST24 and ETEC+ST48, the blue colour (
 and
and
 ) shows the relatedness between ETEC+ST24 and other treatments, and the red colour (
 and
and
 ) shows the relatedness between ETEC+ST48 with other treatments. The relatedness between other treatments is shown with bracket.

In the comparative analysis of atg14, a decrease in gene expression was observed in the ETEC+ST24 and ETEC+ST48 treatments compared to Ctrl 24 and Ctrl 48 (Figure 2B). A notable increase in atg14 levels was observed specifically in the LB→ETEC+ST24 treatment compared to ETEC+ST24. There was an upward trend in atg14 expression across all 48-hour treatments. Among the 24-hour treatment groups, the most significant impact of Lactobacillus/Bifidobacterium spp. was observed in the LB→ETEC+ST24 treatment (p < 0.001). In the 48-hour treatments, no significant differences were found between the treatments. In the post-phase, gene expression levels were higher in the 48-hour treatment compared to the 24-hour treatment, while in the pre and simultaneous phases, no significant differences were observed between the 24-hour and 48-hour treatments.
In the study, a decrease in beclin expression was noted in the ETEC+ST24 and ETEC+ST48 groups when compared to the Ctrl 24 and Ctrl 48 groups, as illustrated in Figure 2C. Gene expression displayed a general increasing trend across all treatments. Nevertheless, no notable difference was observed between the 48-hour and 24-hour treatments in any phase. Notably, among the 24-hour treatments, the most pronounced impact on beclin was evident in LB→ETEC+ST24 (p < 0.001). Similarly, within the 48-hour treatments, the greatest impact of probiotics on beclin was observed in LB→ETEC+ST48 (p < 0.001).
The analysis of pik3R4 showed a decrease in gene expression in ETEC+ST24 and ETEC+ST48 compared to Ctrl 24 and Ctrl 48 (Figure 2D). There was a noticeable decline in pik3R4 expression in LB+ETEC+ST24 and ETEC+ST→LB24 when compared to ETEC+ST24 (p < 0.001). Both LB→ETEC+ST48 and ETEC+ST→LB48 groups exhibited a significant increase in pik3R4 expression compared to ETEC+ST48 (p < 0.001). Particularly noteworthy was the significant increase in ETEC+ST→LB48 compared to ETEC+ST→LB24. The intake of Lactobacillus/Bifidobacterium spp. before and after inflammation had the most pronounced impact on the expression of pik3R4 (LB→ETEC+ST48 and ETEC+ST→LB48).
Genes in autophagosome formation (atg5, atg16, atg7 and atg3)
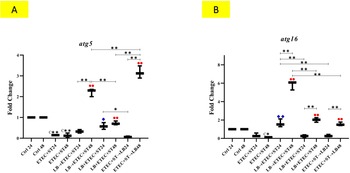
The analysis of atg5 gene expression indicated a decrease in atg5 levels in ETEC+ST24 and ETEC+ST48 in comparison to Ctrl 24 and Ctrl 48 (Figure 3A). Notably, atg5 expression significantly rose in ETEC+ST→LB24 when compared with ETEC+ST24 (p < 0.05). Furthermore, all 48-hour treatments displayed a notable increase when compared to ETEC+ST48 (p < 0.001). Particularly, the treatment of ETEC+ST→LB48 exhibited the most substantial impact on atg5 expression in comparison to all other 48-hour treatments. It is noteworthy that in both pre- and post-phases, the 48-hour treatments demonstrated a significantly stronger upregulating effect on atg5 compared to the 24-hour treatments (p < 0.001).
Relative gene expression (mean fold change) of autophagy genes in the different groups of treatments. Data were represented as mean ± SD. Data were considered as statistically significant when p < 0.05 (*p < 0.05, **p < 0.001). Letter A and B indicates the graphs of genes involved in fusion stage (A: atg5 and B: atg16). C* and C** shows the relatedness between Ctrl 24 and Ctrl 48 with ETEC+ST24 and ETEC+ST48, the blue colour (
 and
and
 ) shows the relatedness between ETEC+ST24 and other treatments, and the red colour (
 and
and
 ) shows the relatedness between ETEC+ST48 with other treatments. The relatedness between other treatments is shown with bracket.

In the statistical analysis of atg16, a decrease in gene expression was observed in ETEC+ST48 compared to Ctrl 48 (Figure 3B). There was no significant difference in LB+ETEC+ST24 and ETEC+ST→LB24 when compared to Cont+24. However, a notable increase was observed in LB-Pro 24 compared to ETEC+ST24. An upward trend in gene expression was noted in all 48-hour treatments compared to ETEC+ST48 (p < 0.001). Among the 24-hour treatments, the most significant impact of Lactobacillus/Bifidobacterium spp. on atg16 was observed in LB→ETEC+ST24. Similarly, among the 48-hour treatments, the most notable effect of Lactobacillus/Bifidobacterium spp. on atg16 was seen in LB→ETEC+ST48. Furthermore, there was a significant increase in atg16 in the 48-hour treatments compared to the 24-hour treatments in all phases. Lastly, the administration of probiotics before inflammation induction (LB→ETEC+ST48) exhibited the most potent effect on atg16 expression among the Lactobacillus/Bifidobacterium spp. treatments.
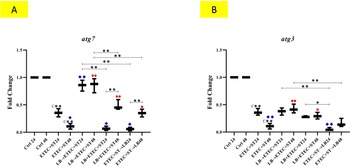
A noticeable decrease in the expression of atg7 was observed in the ETEC+ST24 and ETEC+ST48 groups compared to the Ctrl 24 and Ctrl 48 groups, as depicted in Figure 4A. Particularly, a significant reduction was noted in the ETEC+ST48 group compared to the ETEC+ST24 group (p < 0.05). Conversely, an increase in atg7 expression was detected in the LB→ETEC+ST24 group compared to the ETEC+ST24 group. Moreover, an upward trend in gene expression was observed in all 48-hour treatments compared to ETEC+ST48. Notably, among the 24-hour treatments, the most pronounced impact of Lactobacillus/Bifidobacterium spp. on atg7 was evident in LB→ETEC+ST24 (p < 0.001). Similarly, within the 48-hour treatment groups, the most substantial effect of Lactobacillus/Bifidobacterium spp. on atg7 was seen in LB→ETEC+ST48 (p < 0.001). Throughout both simultaneous and post-treatment phases, gene expression levels were notably higher in the 48-hour treatments compared to the 24-hour treatments (p < 0.001). Collectively, the administration of probiotics before inflammation induction, specifically in the LB→ETEC+ST24 and LB→ETEC+ST48 groups, exhibited the most significant influence of probiotics on atg7 expression.
Relative gene expression (mean fold change) of autophagy genes in the different groups of treatments. Data were represented as mean ± SD. Data were considered as statistically significant when p < .05 (*p < .05, **p < .001). Letter a and B indicates the graphs of genes involved in degradation stage (A: atg7 and B: atg3). C* and C** shows the relatedness between Ctrl 24 and Ctrl 48 with ETEC+ST24 and ETEC+ST48, the blue colour (
 and
and
 ) shows the relatedness between ETEC+ST24 and other treatments, and the red colour (
 and
and
 ) shows the relatedness between ETEC+ST48 with other treatments. The relatedness between other treatments is shown with bracket.

Figure 4. Long description
Panel A: A bar graph shows the relative gene expression of atg7 across different treatment groups. The y-axis represents fold change, ranging from 0.0 to 1.5. The x-axis lists the treatment groups: Ctrl 24, Ctrl 48, ETEC+ST24, ETEC+ST48, LB->ETEC+ST24, LB->ETEC+ST48, LB->ETEC+LB24, LB->ETEC+LB48, ETEC+ST->LB24, and ETEC+ST->LB48. The graph includes annotations indicating statistical significance with asterisks (*p < 0.05, **p < 0.001) and brackets showing relatedness between treatments. Blue and red symbols indicate relatedness between ETEC+ST24 and ETEC+ST48 with other treatments. Panel B: A bar graph shows the relative gene expression of atg3 across the same treatment groups. The y-axis represents fold change, ranging from 0.0 to 1.5. The x-axis lists the same treatment groups as in Panel A. The graph includes similar annotations for statistical significance and relatedness between treatments.
In the analysis of atg3, a noticeable decrease in gene expression was observed in ETEC+ST24 and ETEC+ST48 compared to Ctrl 24 and Ctrl 48 (Figure 4B). A significant decrease was noted in ETEC+ST48 compared to ETEC+ST24 in atg3 (p < 0.001). While no significant difference in gene expression was observed between LB→ETEC+ST24 and LB+ETEC+ST24 compared to ETEC+ST24, a decrease was evident in ETEC+ST→LB24 compared to ETEC+ST24. Notably, a significant increase in atg3 expression was observed in LB→ETEC+ST48 and LB+ETEC+ST48 compared to ETEC+ST48 (p < 0.001 and p < 0.05 respectively). Overall, there were no significant differences between treatments, indicating that Lactobacillus/Bifidobacterium spp. did not have an increasing effect on atg3 expression across all phases.
Discussion
This study indicates that a native Lactobacillus/Bifidobacterium mixture shows potential effects across all phases of autophagy, suggesting both preventive and therapeutic roles. While the probiotic mixture effectively reduced inflammation and modulated autophagy gene expression in the presence of ETEC+ST, its strongest impact on genes like pik3C3, atg14, beclin, pik3R4, atg7, and atg3 was observed when consumed before inflammation was triggered. This pre-inflammation consumption highlights a significant preventive role. Although atg5 and atg16 gene expression differences were not significant between pre- and post-treatment, the overall findings suggest that these native probiotics can prevent inflammation by influencing the majority of examined autophagy genes prior to its induction.
Scientists have established that probiotics are able to influence inflammatory pathways and reduce inflammation in in vitro and in vivo model of inflammatory diseases.(Reference Plaza-Díaz, Ruiz-Ojeda, Vilchez-Padial and Gil15,Reference Alard, Peucelle and Boutillier24) Since the phenotypes observed by our team support the anti-inflammatory effects of our probiotic strains,(Reference Rohani, Noohi, Talebi, Katouli and Pourshafie18) our group aimed to present a comprehensive molecular pattern to illustrate the effects of probiotics on the basic pathways leading to inflammation. In this context, recent studies by our group have investigated the effects of native potential probiotics on several signalling pathways leading to inflammation, including NF-κB and JAK-STAT.(Reference Aghamohammad, Sepehr, Miri, Najafi, Pourshafie and Rohani25–Reference Aghamohammad, Sepehr, Miri, Najafi, Rohani and Pourshafiea27) In the current study, we aimed to investigate multifunctional mechanisms such as autophagy, which play a key role in various organs and tissues and can indirectly influence inflammation. The regulatory network of autophagy interacts with a variety of innate immune receptors, including PAMPs (TLRs and NLRs), and thus can appropriately influence inflammatory responses to alleviate inflammation.(Reference Lapaquette, Guzzo, Bretillon and Bringer28,Reference Netea-Maier, Plantinga, van de Veerdonk, Smit and Netea29) Autophagy is a cellular process that maintains the cellular homeostasis and function. Dysregulation of autophagy can contribute to various gut-related problems such as IBD.(Reference Deretic and Klionsky30) Several previous studies have emphasized the role of autophagy by examining the effects of impaired autophagy in disease. Mutations in autophagy genes such as atg16 and atg5 can lead to inflammation-related diseases such as IBD.(Reference Levine and Kroemer31) In other words, any defect or dysregulation of the aforementioned genes could exacerbate inflammatory state, which is consistent with the findings of this current study. As mentioned in recent research, deficiencies in autophagy genes, particularly atg16, atg5, and atg7, can lead to excessive epithelial cell death by increasing inflammatory mediators such as TNF-α, which promotes the development of IBD.(Reference Jones, Mills and Harris32,Reference Naser, Arce and Khaja33) Another study showed that the ATG14-BECN1/Beclin1-PIK3C3/VPS34 complex positively regulates autophagy in T cell metabolism, inflammatory responses and cell apoptosis. Therefore, defects in this complex may lead to intestinal inflammation and the development and severity of UC.(Reference Wu, Liu and Wang34,Reference Yang, Song and Postoak35)
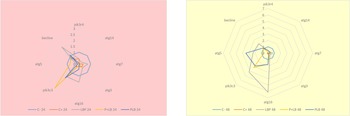
All the results of the current study as well as our previous studies clearly shows that our selective probiotic mixture has significant anti-inflammatory effects. The general trend of the current results could be seen in Figure 5. In contrast, previous studies have indicated that patients with CD and UC report severe side effects and drug toxicity caused by chemical drugs, anti-TNF therapy and invasive surgeries in inflammatory-related disorders.(Reference Barra, Danino and Garrido36–Reference Astó, Méndez, Audivert, Farran-Codina and Espadaler38) Therefore, administering probiotics with fewer side effects and their beneficial effects on human health can offer an advantageous method of administering probiotics to prevent inflammation or reduce the severity of inflammatory diseases. The aim of this study was to examine the effects of our selected probiotics in preventing and reducing inflammation. Thus, the prophylactic role of our Lactobacillus/Bifidobacterium cocktail by modulating autophagy can alleviate severe symptoms of gut inflammation. Moreover, our native Lactobacillus/Bifidobacterium cocktail is able to promote gut health and intestinal balance by enhancing the autophagy signalling pathway.
The general tendency of the present study is as follows: A) the comprehensive outcomes of autophagy expression level after 24 hours. B) The comprehensive outcomes of autophagy expression level after 48 hours.

In addition, further studies should take into account some crucial points such as the long-term administration of probiotics. This may be because the significant increase in gene expression observed in the 48-hour treatments compared to the 24-hour treatments indicates that our selected probiotics may be more effective in reducing inflammation when administered for longer periods. Furthermore, there are numerous other genes involved in the autophagy signalling pathway that can be explored in future studies.
The link between probiotics and inflammation has been widely demonstrated in recent studies, highlighting their potential to reduce inflammation in various inflammatory diseases. The importance of autophagy for homeostasis has also attracted the attention of many scientific communities. Consequently, more comprehensive studies should be conducted to explore the multifaceted role of probiotics in inflammation-related diseases, with a focus on in vivo research. Our team aims to present a molecular approach to the potential of probiotics in preventing and reducing inflammation by considering the autophagy signalling pathway.
This study could provide new evidence regarding the ability of our native probiotic strains to modulate autophagy-related genes in intestinal epithelial cells, highlighting their potential therapeutic effects in inflammatory conditions. A major strength of this work is the evaluation of native probiotic strains with important and beneficial characteristics. Furthermore, the use of the HT-29 intestinal epithelial model enabled controlled investigation of host–microbe interactions under inflammatory conditions. However, certain limitations affect the interpretation of our findings. Our autophagy evaluation was restricted to the protein level using Western blotting. This approach reflects the initial signalling but does not capture the full picture of autophagic flux or functional protein activity. Critical protein markers, such as the LC3-I to LC3-II conversion and p62/SQSTM1 degradation, which are vital for distinguishing autophagy induction from lysosomal fusion blocks, were not assessed. Additionally, to firmly establish the link between probiotic-driven autophagy and reduced inflammation, direct measurement of inflammatory markers like IL-8 and TNF-ɑ was not included in this experimental design. The reliance on the HT-29 cell line as an in vitro model, though valuable for exploring host-microbe interactions, does not replicate the intricate multicellular immune environment of the gut. Therefore, future investigations must employ in vivo animal models and assess these key protein and inflammatory markers to confirm the therapeutic promise of these native strains within a physiological context.
Conclusion
This study provides compelling evidence that native probiotic strains, specifically Lactobacillus and Bifidobacterium species, possess the capacity to modulate the autophagy signalling pathway at the molecular level. Our findings demonstrate that these strains significantly upregulate a diverse array of autophagy-related genes, including pik3c3, pik3r4, beclin, atg3, atg5, atg7, atg14, and atg16, thereby mitigating the suppressive effects induced by sonicated bacterial pathogens. Notably, Bifidobacterium spp. exhibited the most pronounced effect on the expression of these components in all experimental phases. Given the pivotal role of autophagy in maintaining intestinal homeostasis, these results suggest that our isolated strains may exert a beneficial effect on intestinal inflammation. Consequently, these native probiotics may emerge as promising candidates for supplementary therapeutic interventions in the management of IBD. Although further functional studies are warranted to validate autophagic flux at the protein level, this investigation establishes the modulation of autophagy-related gene expression as a robust criterion for the selection and assessment of effective therapeutic probiotics.
Data availability statement
The datasets generated during and/or analysed during the current study are available from the corresponding author on reasonable request.
Acknowledgements
The authors would like to thank Pasteur Institute of Iran as funding agency (with grant number 1284). The current research was done in support of Pasteur Institute of Iran supported as a funding agency. It should be noted that the manuscript was written by the authors, and ChatGPT-5.5 was used solely for language polishing and grammatical correction.
Author contributions
Performed the experiments: Fatemeh Haririzadeh Jouriani, Mahdi Torkamaneh and Mahnaz Torfeh. Data analysis: Fatemeh Haririzadeh Jouriani, Amin Sepehr, Fatemeh Ashrafian. Writing of the manuscript: Fatemeh Haririzadeh Jouriani and Mahdi Torkamaneh. Revised manuscript: Shadi Aghamohammad and Mahdi Rohani. Conceived and designed the experiments: Shadi Aghamohammad and Mahdi Rohani.
Financial statement
The current research was done in support of the Pasteur Institute of Iran supported as a funding agency (with grant number 1284).
Competing interests
The authors declare that there are no conflicts of interest.
Ethical standards
The experimental protocols were established following the Declaration of Helsinki and approved by the ethics committee of Pasteur Institute of Iran (IR.PII.REC.1401.002). All methods were carried out in accordance with relevant guidelines and regulations.
Consent for publication
Not applicable.
AI statement
During the preparation of this manuscript, the authors used ChatGPT-5.5 to improve language readability and grammar. After using this tool, the authors reviewed and edited the content carefully and take full responsibility for the content of the publication.


 Open access

