


Highlights
-
• In Lewy body spectrum disease, atrophy of the substantia innominata (SI) is associated with cognitive impairment.
-
• Widespread gray matter atrophy is better correlated with cognitive aspects of gait performance than SI atrophy alone.
-
• Degree of cognitive impairment is more predictive of gait performance than parkinsonian motor features.
Introduction
The Lewy body disease spectrum encompasses a range of cognitive phenotypes, from Parkinson’s disease (PD) with normal cognition (PD-NC) on one end and PD dementia (PDD) and dementia with Lewy bodies (DLB) on the other. Gait impairment and falls contribute to a high degree of morbidity and functional decline and are associated with an increased burden of cognitive impairment and dementia among other non-motor symptoms. Reference Ba, Obaid, Wieler, Camicioli and Martin1 Additionally, early gait abnormalities are a risk factor for progression to dementia. Reference Aarsland, Batzu and Halliday2 An understanding of the underlying pathological underpinnings of shared cognitive and gait decline in the Lewy body disease spectrum is therefore crucial for both prognostication and development of therapeutic strategies. We have previously shown that global atrophy is associated with worse gait performance in the Lewy body spectrum Reference Subotic, Gee and Nelles3 ; however, an association with localized cortical and subcortical atrophy was not identified.
PD and DLB are pathologically characterized by the accumulation of alpha-synuclein protein aggregates in distinct brain regions with associated neurodegeneration. While loss of dopaminergic neurons in the substantia nigra leads to classic motor symptoms of PD, there is also early alpha-synuclein deposition in other brain structures, including the nucleus basalis of Meynert (NBM) within the basal forebrain and substantia innominata (SI). Reference Surmeier, Obeso and Halliday4 The NBM is a major cholinergic center with projections throughout the entire cortex and plays an important neuromodulatory role in sustaining cognitive functions. Reduced NBM volumes have been associated with faster rates of decline in cognition in several prospective PD cohorts. Reference Ray, Bradburn and Murgatroyd5–Reference Grothe, Labrador-Espinosa and Jesús7
Mounting evidence also suggests a role of cholinergic activity in PD gait decline. The cholinesterase inhibitor rivastigmine has been shown to reduce the risk of falls in PD, Reference Henderson, Lord and Brodie8 and a follow-up phase 3 clinical trial is underway to confirm these results. Reference Neumann, Taylor and Bamford9 Recent studies associate reduced NBM volumes with increased gait variability, specifically in step time variability and swing time variability. Reference Wilkins, Parker and Bronte-Stewart10,Reference Wilson, Yarnall and Craig11 One hypothesis is that the NBM is involved in the cognitive aspects that regulate gait performance, which can be assessed by the dual-task cost (DTC) to various gait parameters, as measured when subjects are engaged in a cognitively demanding task while walking. This is aligned with a previous study showing that NBM atrophy is associated with reduced gait speed and worse DTC using the cognitive timed up and go test. Reference Dalrymple, Huss and Blair12
The aim of this cross-sectional study was to examine the relationship between SI volume and quantitative gait analysis measures in a population representing the cognitive spectrum of Lewy body disease, including PD-NC, PD with mild cognitive impairment (PD-MCI), PDD, and DLB. A novel aspect of the study is the examination of the relationship between SI volume and DTC to gait speed while performing three different cognitive tasks (counting backward, animal fluency, and serial 7 subtractions). Given the multi-factorial contributions of brain pathology to cognition and gait performance, we assessed whether SI associations with quantitative gait measures were independent of total gray matter (GM) volume and global cognition.
Methods
Study population
Participants were recruited from movement disorders and cognitive clinics as well as referrals from community physicians and community advertisements as part of the Canadian Consortium on Neurodegeneration in Aging’s (CCNA) Comprehensive Assessment of Neurodegeneration and Dementia (COMPASS-ND) study. Reference Chertkow, Borrie and Whitehead13 From this cohort, control participants and subjects with Lewy body disease who completed gait assessments with electronic walkways from three COMPASS-ND study sites (University of Alberta, University of Calgary and the Sunnybrook Research Institute in Toronto) were included. Additional controls were recruited at the University of Alberta and University of Calgary from the Functional Assessment and Vascular Reactivity (FAVR-II) study, Reference Sharma, Gee and Nelles14 which is harmonized with COMPASS-ND. COMPASS-ND was approved by the research ethics boards of all involved institutions, while FAVR-II was approved at the University of Alberta and University of Calgary. Both studies were carried out in accordance with The Code of Ethics of the World Medical Association. All participants provided written informed consent.
A total of 79 participants across the spectrum of Lewy body diseases and 20 cognitively unimpaired (CU) controls were included. Of the 79 Lewy body disease participants, 42 had PD-NC, 18 had PD-MCI, 9 had PDD and 10 had DLB. Diagnosis was determined by experienced neurologists (RC/ES/MM/SEB) based on established clinical criteria, as previously reported. Reference Pieruccini-Faria, Black and Masellis15 In brief, participants were diagnosed with PD using criteria consistent with the International Parkinson and Movement Disorder Society (IP-MDS) clinical diagnosis criteria. Reference Postuma, Berg and Stern16 Severity of cardinal motor symptoms (i.e., tremor, bradykinesia, and rigidity) were assessed with the MDS-Unified Parkinson’s Disease Rating Scale-Motor Section (MDS-UPDRS III). Reference Goetz, Tilley and Shaftman17 PD-MCI participants were required to meet IP-MDS clinical diagnostic criteria for PD with subsequent (a) gradual decline in cognitive abilities reported by patient, informant or clinician, (b) cognitive deficits in global cognition assessed with Montreal Cognitive Assessment (MoCA) using a cutoff of <25, which is more specific than commonly used cutoffs and consistent across COMPASS-ND as well as with Level 1 criteria. Reference Litvan, Goldman and Tröster18 Neuropsychological testing was not used for defining MCI. The criteria for DLB were as follows: (a) dementia defined as progressive cognitive decline substantial enough to interfere with normal social or occupational function, reported by patient and or informant over the course of at least one year; (b) prominent or persistent cognitive impairment that was not necessarily evident with progression; (c) deficits on cognitive tests of memory, attention, executive function and visuospatial ability; (d) MoCA score< 25; (e) one or more suggestive features of fluctuating cognition, visual hallucinations and/or spontaneous features of parkinsonism; and (f) one or both suggestive features of Rapid Eye Movement (REM) sleep behaviour disorder and/or severe neuroleptic sensitivity. Reference McKeith, Dickson and Lowe19 The core criteria for diagnosis of probable PDD were from Dubois et al., 2007 Reference Dubois, Burn and Goetz20 and Emre et al., 2007. Reference Emre, Aarsland and Brown21 PDD participants were required to meet the IP-MDS clinical diagnostic criteria for PD and motor impairment preceding (by at least one year) with subsequent cognitive impairment documented by the MoCA representing a decline from premorbid level, with deficits severely enough to interfere with activities of daily living. For analysis, participants with dementia were combined into one group (PDD/DLB) due to their overlapping pathological features Reference Walker, Stefanis and Attems22 and for purposes of statistical power. Of the 20 CU, 13 were recruited from COMPASS-ND and 7 were recruited from FAVR-II.
Clinical assessment
Demographic descriptors included age, sex (assigned from birth and biological variable) and years of education. Global cognition was reported with education-adjusted MoCA score. Disease duration, MDS-UPDRS-III score and levodopa equivalent daily dosage were included as baseline clinical descriptors. Reference Pieruccini-Faria, Black and Masellis15 MDS-UPDRS-III scores were evaluated in the ON state for patients on levodopa.
Gait measurement and analysis
The CCNA gait protocol was used for quantitative gait measurement and analysis. Reference Cullen, Montero-Odasso and Bherer23 All gait measurements were obtained in the ON state for patients on levodopa. Two compatible and reliable electronic walkway systems to measure gait parameters from 6 m walks were used Reference Vallabhajosula, Humphrey, Cook and Freund24 : a ProtoKinetics Zeno Walkways apparatus (University of Alberta and University of Calgary) and a GaitRite gait analysis system (Sunnybrook Research Institute). Participants started and stopped walking 1 m before and after the electronic walkway to exclude acceleration and deceleration. For normal paced gait, three trials were performed and averaged. Participants were then instructed to walk while engaging in each of the following verbal tasks; counting backward by 1 from 100 (counting), naming animals (animal fluency) and serial subtraction by 7s starting at 100 (serial subtractions). Reference Cullen, Montero-Odasso and Bherer23 For each of the dual-task trials, the following formula was used to calculate the percent DTC for gait speed Reference Montero-Odasso, Sarquis-Adamson and Speechley25 :

In addition to DTC to gait speed, specific gait measures that were either temporal (gait speed, swing time, step time variability and swing time variability) or spatial (step length and step length variability) were selected for analysis based on results of previous studies looking at the relationship between gait parameters and NBM volumes. Reference Wilkins, Parker and Bronte-Stewart10,Reference Wilson, Yarnall and Craig11 Variability of gait parameters is reported as a coefficient of variation (CV), with CV = [standard deviation/mean] × 100%. Reference Pieruccini-Faria, Black and Masellis15
Imaging acquisition
All MRI scans were completed on either a Siemens Prisma 3T system (University of Alberta and Sunnybrook), or 3T GE Discovery MR750 (University of Calgary) with harmonized data acquisition across sites according to the Canadian Dementia Imaging Protocol. Reference Chertkow, Borrie and Whitehead13 3D-T1, T2-weighted and fluid attenuated inversion recovery images were obtained.
Imaging analysis
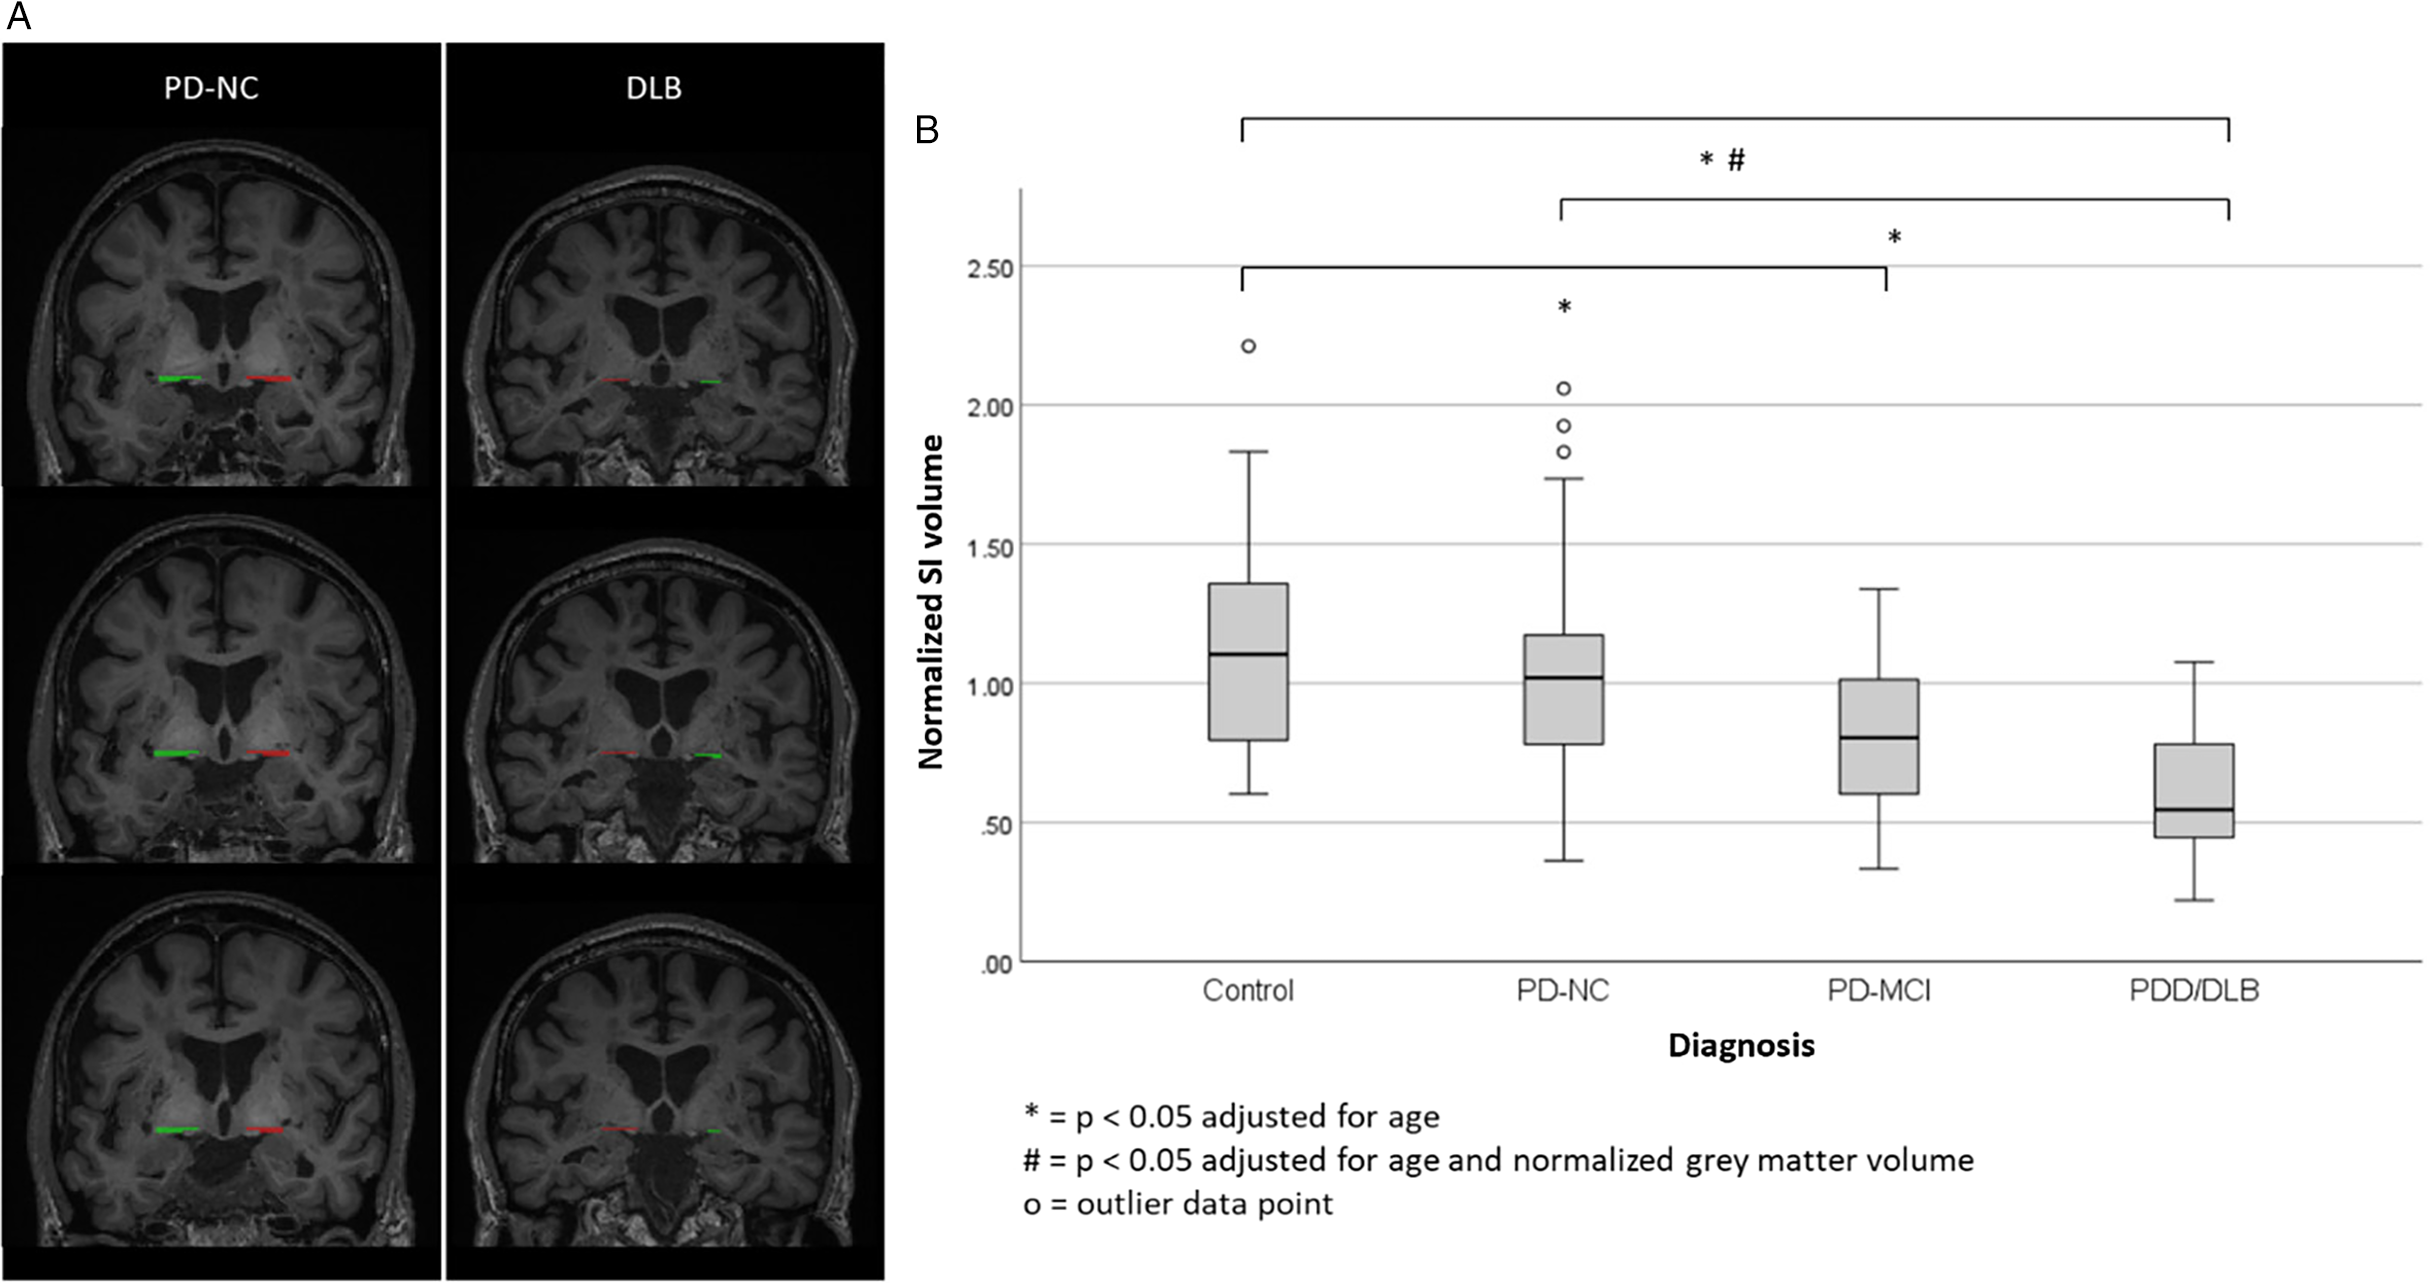
To determine the volume of the SI, manual delineation of the region of interest (ROI) was performed using ITK-SNAP on T1-weighted MRI scans (Figure 1A). The method was adapted from previous methodology Reference George, Mufson, Leurgans, Shah, Ferrari and DeToledo-Morrell26 and has been used in a study of cognitive impairment in a cohort of PD patients. Reference Choi, Jung, Lee, Lee, Sohn and Lee27 In brief, the SI was delineated on the most posterior coronal slice still containing the crossing of the anterior commissure and on two consecutive sections posterior to this slice. The dorsal border of the SI was operationally defined as a horizontal line extending from the ventral border of the putamen. The ventral border was the junction between the basal cistern and the base of the brain. The medial border was operationally defined as a vertical line extending from the ventrolateral border of the stria terminalis to the base of the brain. The lateral border extended to the medial aspect of the putamen. Total NBM volume was calculated from the sum of right and left SI ROIs across all three coronal slices. Tracings were performed by AY and blinded to clinical and gait characteristics. Intra-rater reliability was calculated from 10 scans at the beginning, and 11 scans at the end of the tracing process revealed good to excellent agreement (SPSS; intraclass correlation coefficient = 0.790 and 0.892, respectively).
Substantia innominata (SI) volumetric comparisons between controls and Lewy body spectrum cognitive groups. (A) Representative manual ROI of the SI in a patient with PD-NC and a patient with DLB. SI volume was measured across three consecutive coronal T1 MRI images at the level of the anterior commissure. (B) Box plot comparing TIV-normalized SI volume between controls, PD-NC, PD-MCI and PDD/DLB groups, with levels of significance calculated after adjusting for age and with adjusting for age and TIV-normalized GM volume. ROI = region of interest; PD-NC = Parkinson’s disease with normal cognition; DLB = dementia with Lewy bodies; T1 MRI = T1 Magnetic Resonance Imaging; TIV = total intracranial volume; PD-MCI = Parkinson’s disease with mild cognitive impairment; PDD, Parkinson’s disease dementia; GM = gray matter.

Figure 1. Long description
The image consists of two sections labeled A and B. Section A displays MRI scans of the brain, comparing the substantia innominata (SI) region in a patient with Parkinson’s disease with normal cognition (PD-NC) and a patient with dementia with Lewy bodies (DLB). The scans are shown at the level of the anterior commissure across three consecutive coronal T1 MRI images. Section B presents a box plot that compares the total intracranial volume (TIV)-normalized SI volume among four groups: controls, PD-NC, PD with mild cognitive impairment (PD-MCI), and Parkinson’s disease dementia (PDD)/DLB. The box plot includes levels of significance calculated after adjusting for age and for age and TIV-normalized grey matter volume. The plot shows variations in SI volume across these groups, with statistical annotations indicating significant differences.
Total GM volume measurements were obtained by processing T1-weighted MRI scans through FreeSurfer version 6.0.0. Reference Fischl28 FreeSurfer segmentations were visually inspected for quality. No participants were excluded due to segmentation issues. Total GM volume consisted of total cortical, subcortical (including bilateral caudate, putamen, pallidum, hippocampus, amygdala, nucleus accumbens and thalamus) and cerebellar GM regions. Total intracranial volume (TIV)-normalized total GM volumes and SI volumes were used for analysis, calculated by dividing each volumetric measure by the estimated TIV computed by FreeSurfer.
Statistical Analysis
Participants’ demographic, clinical and gait characteristics were summarized and compared using the Chi-square and Fisher’s exact test for categorical variables, and one-way analysis of variance (ANOVA) or analysis of covariance (ANCOVA) correcting for age as a covariate for continuous variables. The relationship between cognitive groups (control, PD-NC, PD-MCI and PDD/DLB) and MRI analysis of TIV-normalized SI volume and total GM volume was examined using ANCOVA with post hoc analysis (Sidak), accounting for age and total GM volume as covariates.
Simple linear regression models were used to assess the relationship between SI and GM volumes to specific gait characteristics. Multiple regression models were used to examine the relationship between specific gait measures as dependent measures and brain volumes, including SI and GM volumes as predictor variables, while including clinical covariates of age, MDS-UPDRS-III score and MoCA score.
For the univariate gait and volumetric analyses, p-values were controlled for false discovery rate (FDR) using the Benjamini–Hochberg method. Reference Benjamini and Hochberg29 A threshold of p < 0.05 was considered statistically significant. All analyses were conducted using SPSS (version 28, IBM Corporation, Armonk, NY, USA).
Results
Demographic and clinical characteristics of participants
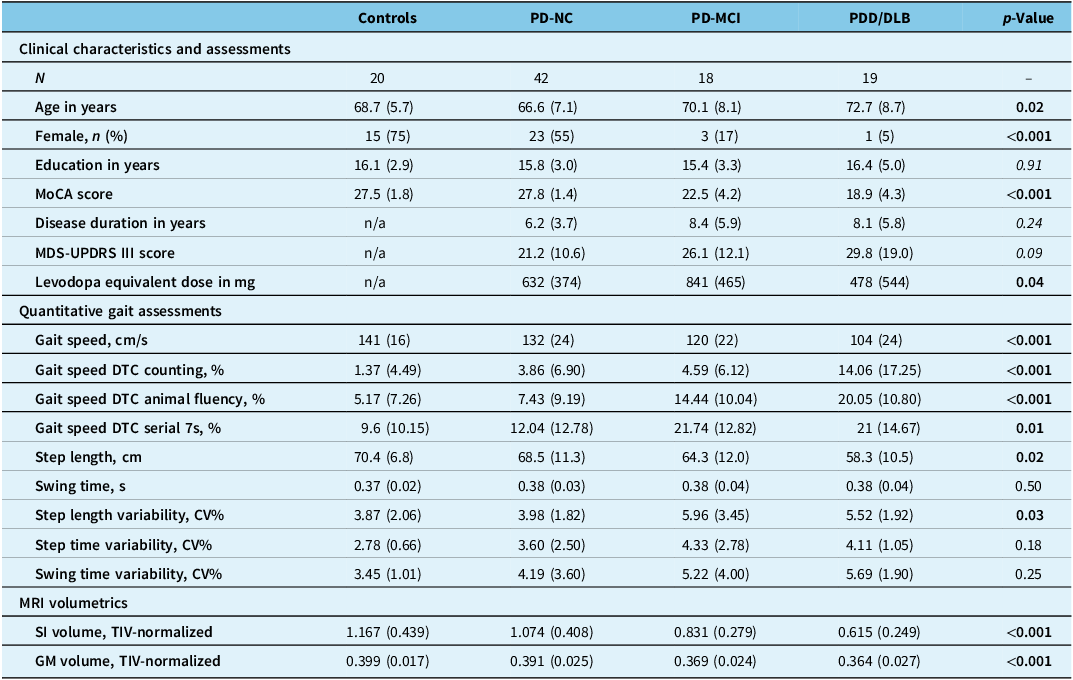
Demographic and clinical characteristics of the participants are summarized in Table 1. Age and sex differed between the four groups (p = 0.02 and p < 0.001, respectively). Participants with dementia were older compared to PD-NC and controls. There was skew in sex distribution across cognitive groups, with more males in the cognitively impaired groups. Education levels were not different between groups (p = 0.91). As expected per definition, there was a difference in MoCA scores (p < 0.001). Within the Lewy body disease participants, disease duration (p = 0.24) and MDS-UPDRS III scores (p = 0.09) were not different; however, they differed in levodopa equivalent daily dose (p = 0.04), with the PD-MCI group having the highest total dose. A total of 12 Lewy body disease participants were not on levodopa (4 PD-NC, 1 PD-MCI and 7 PDD/DLB). Cholinesterase inhibitor use was present in 13 participants (1 PD-NC, 2 PD-MCI and 10 PDD/DLB). Given the known effect of age on cognition and gait performance, all subsequent analyses were corrected for age.
Demographic and clinical information

Table 1. Long description
The table presents demographic and clinical information for four groups: Controls, PD-NC, PD-MCI, and PDD/DLB. It includes data on age, sex, education, MoCA score, disease duration, MDS-UPDRS III score, levodopa equivalent dose, gait speed, gait speed DTC counting, gait speed DTC animal fluency, gait speed DTC serial sevens, step length, swing time, step length variability, step time variability, swing time variability, SI volume TIV-normalized, and GM volume TIV-normalized. The table has 18 rows and 6 columns, with notable trends including differences in age, sex, MoCA scores, and levodopa equivalent dose among the groups.
DTC = dual-task cost; CV = coefficient of variation; MDS-UPDRS III = MDS-sponsored Revision of the Unified Parkinson’’s Disease Rating Scale Part 3; MoCA = Montreal Cognitive Assessment; SI = substantia innominata; TIV = total intracranial volume; GM = gray matter; PD-NC, Parkinson’’s disease with normal cognition; PD-MCI = Parkinson’s disease with mild cognitive impairment; PDD, Parkinson’s disease dementia; DLB, dementia with Lewy bodies.
Values are presented as “mean (standard deviation)” unless otherwise specified. Clinical characteristic and gait parameters are compared by ANOVA. Bolded p-values are significant at <0.05. Gait characteristics and MRI volumetrics are compared by ANCOVA with adjustment for age, corrected for false discovery rate (FDR). Bolded FDR-adjusted p-values are significant at <0.05.
Comparison of quantitative gait analysis measures
Gait characteristics between the control and the cognitively impaired Lewy body disease groups were different across several measures after adjusting for age and FDR correction (Table 1). Gait speed differed between the groups (p < 0.001), with the two cognitively impaired groups slower than the control group in post hoc analysis (PD-MCI, mean difference (MD) = 21 cm/s, p = 0.03; PDD/DLB, MD = 37 cm/s, p < 0.001). The PDD/DLB group was slower than the PD-NC group (MD = 28 cm/s, p = 0.002), but the PD-MCI group was not different from the PD-NC group (MD = 12 cm/s, p = 0.57). DTC to gait speed with counting, animal fluency and serial 7s subtraction differed across the four groups (p < 0.001, p < 0.001, p = 0.01 respectively). Post hoc analysis revealed increased DTC in the PDD/DLB group when compared to the CU group and PD-NC group for the counting (MD = 13%, p < 0.001; MD = 11%, p < 0.001, respectively) and animal fluency (MD = 14%, p < 0.001; MD = 12%, p < 0.001, respectively) tasks, but not for the serial 7s subtraction task (MD = 11%, p = 0.054; MD = 8%, p = 0.14, respectively). DTC was increased in the PD-MCI group compared to the CU group for animal fluency (MD = 9%, p = 0.02) and serial 7s subtraction (MD = 12%, p = 0.02) but not the counting task (MD = 6%, p = 0.22). DTC were not different between PD-NC group and the CU group. For other quantitative gait measures, step length and step length variability differed across groups (p = 0.02 and p = 0.03, respectively), with a reduction in step length in the PDD/DLB group compared to CU group in post hoc analysis (MD = 11 cm, p = 0.01). Step length variability was increased in the PD-MCI group compared to CU group (MD = 2.0%, p = 0.04), while step length variability in the PDD/DLB was not significantly increased (MD 1.3%, p = 0.38). Swing time (p = 0.50), step time variability (p = 0.18) and swing time variability (p = 0.25) did not differ between groups. With sensitivity analysis adjusting for sex, the gait correlations between groups remained significant (data not shown).
Comparison of MRI volumetrics
SI volumes were compared between CU and Lewy body disease groups, adjusting for age. To adjust brain volumes and, indirectly, sex effects on brain size, SI volumes were normalized to TIV for analysis. There was a difference in normalized SI volume between the CU and Lewy body disease cognitive groups (p < 0.001, see Table 1 and Figure 1B). Post hoc analysis showed that both PD-MCI and PDD/DLB groups had reduced SI volume compared to the CU group (MD = 0.31, p = 0.04; MD = 0.48, p < 0.001 respectively). To explore if generalized atrophy is responsible for reduced SI volumes, we also adjusted for normalized GM volume which maintained a difference between groups (p < 0.04); with post hoc analysis, the PDD/DLB group continued to have reduced SI volume compared to CU group (MD = 0.34, p = 0.03), but not PD-MCI (MD = 0.18, p = 0.6).
Secondary analysis of normalized GM volume also showed a difference between groups after correcting for age (p < 0.001). Post hoc analysis showed reduced GM volume in PD-MCI and PDD/DLB groups compared to CU group (MD = 0.03, p = 0.001; MD = 0.03, p < 0.001). There was no difference in normalized SI volume or total GM volume between CU and PD-NC groups.
Associations between quantitative gait analysis measures with SI and total GM volumes in Lewy body spectrum participants
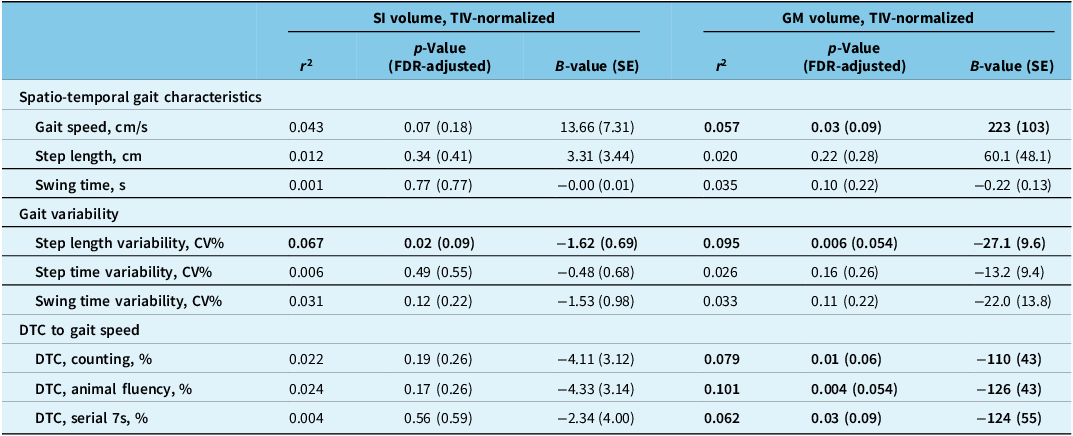
Associations between quantitative gait measures and the MRI measures of SI and total GM volumes were analyzed in the Lewy body disease participants (Table 2). The CU group was not included in this analysis as we were interested on the specific effects of these volumetric measures on the gait characteristics within the Lewy body disease spectrum. For ease of interpretation, parameters were grouped into spatio-temporal gait characteristics, gait variability and DTC to gait speed. In univariate analysis, SI volume was found to be negatively associated with step length variability (r 2 = 0.067, B = −1.62, SE = 0.69, p = 0.02) but did not reach significance after adjusting for FDR (adjusted p = 0.09). The SI was not associated with any other tested gait measures. In comparison, GM volume was positively correlated with gait speed (r 2 = 0.057, B = 223, SE = 103, p = 0.03), negatively associated with step length variability (r 2 = 0.095,B = −27.1, SE = 9.6, p = 0.006) and negatively associated with DTC to gait speed while counting (r 2 = 0.079, B = −110, SE = 43, p = 0.01), animal fluency (r 2 = 0.101, B = −126, SE = 43, p = 0.004) and serial 7s (r 2 = 0.062, B = −124, SE = 55, p = 0.03), though these associations were not significant after adjusting for FDR (adjusted p = 0.09, 0.05, 0.06, 0.05 and 0.09 respectively). To assess whether SI volume and GM have a synergistic effect on gait performance, interaction terms were also compared to our gait parameters; no significant interaction effects were seen (results not shown).
Linear regression analysis of the relationship between gait parameters and normalized SI volume and normalized GM volume in the Lewy body spectrum participants

Table 2. Long description
A table with nine rows and eight columns presents data on the relationship between gait parameters and normalized SI and GM volumes in participants with Lewy body spectrum disorders. The columns include r squared, p value, B value, and standard error for both SI volume and GM volume. Spatio-temporal gait characteristics such as gait speed, step length, and swing time are analyzed, along with gait variability measures like step length variability, step time variability, and swing time variability. Additionally, dual-task costs to gait speed are assessed for counting, animal fluency, and serial sevens. Notable trends include a negative association between SI volume and step length variability, and positive correlations between GM volume and gait speed, as well as negative associations between GM volume and step length variability and dual-task costs to gait speed.
DTC = dual-task cost; CV = coefficient of variation; SI = substantia innominata; GM = gray matter; TIV = total intracranial volume; FDR = false discovery rate.
Bolded values are significant at p < 0.05, but not significant when corrected for FDR.
Multivariable analysis of select quantitative gait analysis measures compared to volumetric and clinical parameters in Lewy body spectrum participants
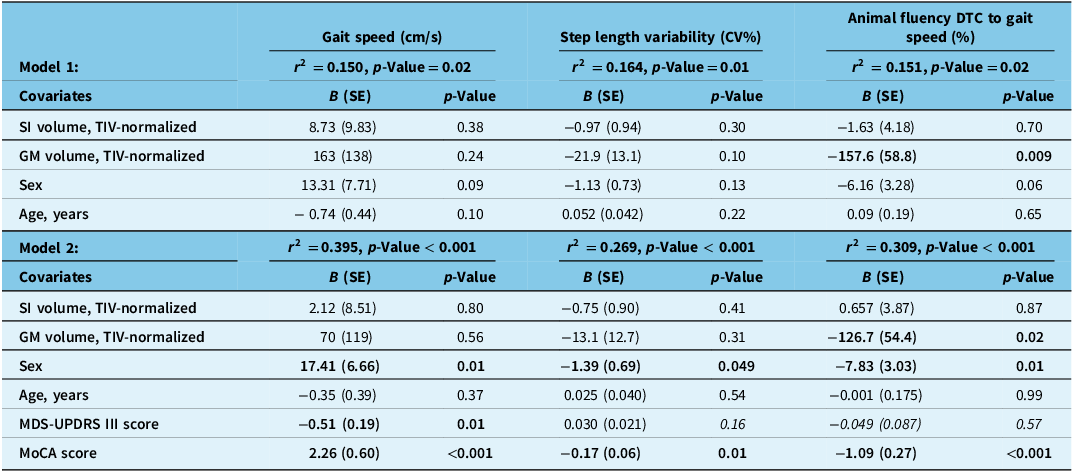
To assess the relative contributions of volumetric measures and clinical parameters to gait performance, we considered two multiple regression models (Table 3). Model 1 included age, sex, TIV-normalized SI and GM volumes. Model 2 included two additional clinical parameters, MDS-UPDRS III score and MoCA score, which are known to impact gait performance. There was no multicollinearity in these models as measured by variance inflation factors. Based on the results of the linear regressions, gait speed, step length variability and DTC to gait speed were specifically chosen for analysis. Among the DTC measures, the animal fluency task was included as it had the most robust association with GM volume and displayed the most separation in mean DTC between the Lewy body spectrum cognitive groups.
Multiple regression analysis of volumetric imaging data and clinical data in relation to selected gait parameters in Lewy body spectrum participants

Table 3. Long description
The table presents the results of two multiple regression models analyzing gait performance in Lewy body spectrum participants. Model 1 includes age, sex, TIV-normalized SI and GM volumes, while Model 2 adds MDS-UPDRS III score and MoCA score. The table is divided into three main sections: Gait speed, Step length variability, and Animal fluency DTC to gait speed. Each section lists the R-squared value, p-value, and covariates with their respective B (SE) and p-values. Notable trends include significant p-values for GM volume in Model 1 and sex and MoCA score in Model 2. The table highlights the contributions of volumetric measures and clinical parameters to gait performance.
DTC = dual-task cost; MDS-UPDRS III = MDS-sponsored Revision of the Unified Parkinson’s Disease Rating Scale Part 3; MoCA = Montreal Cognitive Assessment; SI = substantia innominata; GM = gray matter; TIV = total intracranial volume; CV = coefficient of variation.
Bolded values are significant at p < 0.05.
Model 1 explained about 15% of the variance in gait speed (r 2 = 0.150, p = 0.02) and 16% of the variance in step length variability (r 2 = 0.164, p = 0.01), but individual parameters within the models were not significant. On the other hand, the model explained 15% of the variance in animal fluency DTC (r 2 = 0.151, p = 0.02), with normalized GM volume contributing significantly to the variance (B = −157.6, SE = 58.8, p = 0.009).
In Model 2, both clinical parameters contributed significantly to gait speed (MDS-UPDRS III score: B = −0.51, SE = 0.19, p = 0.01; MoCA score: B = 2.26, SE = 0.60, p < 0.001) with the model explaining 40% of variance (r 2 = 0.395, p < 0.001), while for step length variability (r 2 = 0.269, p < 0.001) and DTC with animal fluency DTC (r 2 = 0.309, p < 0.001), there was a strong negative association with only MoCA (B = −0.17, SE = 0.06, p = 0.01 and B = −1.09, SE = 0.27, p < 0.001, respectively). GM volume continued to contribute significantly to the variance in animal fluency DTC (B = −126.7, SE = 54.4, p = 0.02). Interestingly, sex was a significant covariate in each of the gait parameters. With exploratory analysis stratifying by sex (52 males and 27 females), MoCA scores were associated with the gait parameters in males but not females, while MDS-UPDRS-III score was associated with gait speed and step length variability in females but not males (see supplementary tables).
Discussion
In this cross-sectional study, we examined the relationship between SI atrophy, cognition and gait in participants across the Lewy body disease spectrum. We showed that SI atrophy was associated with dementia phenotypes after adjusting for age and total GM atrophy. We hypothesized that both SI atrophy and GM atrophy could contribute to prediction of gait impairment. After adjusting for FDR, we did not find any significant associations between SI and GM volumes and select quantitative gait measures. However, we observed that both SI and GM volumes showed a trend toward a negative association with step length variability, but not other measures of gait variability (step time variability and swing time variability). We had previously described an association between total GM atrophy with DTCs to gait speed when counting backward in this Lewy body disease cohort. Reference Subotic, Gee and Nelles3 Here, we show that there was a trend toward a negative association between GM volume and DTC to gait speed, with the animal fluency task showing the strongest association compared to counting and serial 7 subtraction tasks. Interestingly, with multivariable analysis adding age, MDS-UPDRS III score and MoCA score as covariates to our volumetric measures, global cognition as represented by the MoCA score had the strongest association with gait speed, step length variability and DTCs to gait speed.
The association between global cognitive score and decline in gait measures is concordant with literature showing a strong relationship between the “dual decliner” phenotype and dementia risk. Reference Montero-Odasso, Sarquis-Adamson and Speechley25,Reference Montero-Odasso, Speechley and Muir-Hunter30 Indeed, PD patients with a postural instability and gait disorder phenotype are more likely to have cognitive impairment and other non-motor symptoms. Reference Ba, Obaid, Wieler, Camicioli and Martin1 One hypothesis was that NBM atrophy drives gait impairment in PD through impaired attentional cognitive processes. Reference Nazmuddin, van Dalen and Borra31 The shared cognitive and gait phenotype may also be a result of more distributed brain pathology. Given that the SI contains the NBM that has cholinergic projections through the entire cortex, early degeneration in the NBM could lead to more widespread cortical changes. Reduced cortical cholinergic activity, as measured by PET imaging, can be seen in PD patients with smaller posterior basal forebrain volumes and is correlated with multi-domain cognitive deficits in PD. Reference Schumacher, Kanel and Dyrba32 Longitudinal cholinergic basal forebrain degeneration is also associated with a faster rate of cortical thinning, which can act as a mediator of global cognitive decline independent of amyloid-beta status. Reference Labrador-Espinosa, Silva-Rodríguez, Reina-Castillo, Mir and Grothe33 In our study, GM atrophy correlated better with DTC to gait speed than SI volume, underlining the importance of more widespread GM atrophy in the cognitive and gait impairment phenotype. Indeed, associations between total and regional cortical/subcortical GM volumes in relation with DTC to gait were recently described from this dataset. Reference Subotic, Gee and Nelles3 In the current study, only animal fluency DTC was the most strongly associated with GM atrophy and remained significantly associated with GM atrophy in our multivariable model. Animal fluency DTC may reflect broader neural degeneration. Reference Ali, Dinomais and Labriffe34
Our study included a spectrum of participants with Lewy body disease (mean disease duration of 6–8 years) with a wide range of cognitive impairments. This contrasts with previous studies applying a prospective approach in early PD cohorts without cognitive impairment, studying the contribution of NBM atrophy to subsequent cognitive and gait decline. Baseline NBM atrophy Reference Ray, Bradburn and Murgatroyd5,Reference Lee, Cho and Song35 and rate of NBM atrophy over time Reference Pereira, Hall and Jalakas6 have been shown to be associated with risk of cognitive decline and conversion to dementia. Smaller baseline NBM volumes were shown to be predictive of greater step time variability increases over 3 years of follow-up. Reference Wilson, Yarnall and Craig11 Our more heterogeneous cohort may include effects of later stages of Lewy body pathology, along with effects of increasing age, white matter disease and global atrophy. Other potential pathological processes not assessed in our analysis could include co-pathology with amyloid-beta, tau or white matter disease.
In our study, step length variability was correlated with cognitive diagnosis and approached significance with SI volume but not with other gait variability measures. This contrasts with the association of SI atrophy with a greater rate of increase in step time variability in an early PD cohort, Reference Wilson, Yarnall and Craig11 highlighting differential associations of specific spatial (e.g., step length) versus temporal (e.g., step time) gait variability parameters in prospective versus cross-sectional analyses and between different population cohorts. This may also serve as a caution against combining multiple gait variability parameters as a single domain for analysis. A previous study looking at gait parameters between dementia groups in the same COMPASS-ND cohort did not show any differences in gait variability between PD, PD-MCI and DLB participants. Reference Pieruccini-Faria, Black and Masellis15 However, they used factor analysis to summarize gait variability, combining stride length variability, stride time variability and double support time variability as a single domain for analysis. Using a gait variability domain may have diluted the association of any one single gait variability parameter (e.g., stride length, which is analogous to step length).
There are limitations to our study. The heterogeneous nature of this cohort and moderate sample size introduces between-group variability that may reduce the power to detect the associations between volumetric measures and quantitative gait measures by increasing type II error. We acknowledge that there might have been misclassification between PD and PD-MCI; however, by including the entire spectrum of cognitive classification, participants in the Lewy body spectrum would all be included. In our cohort, there was significant skew in the sex distribution across the spectrum of cognitive impairment likely due to recruitment bias, which impacts the interpretation of potential independent sex effects on our variables. We only evaluated baseline gait parameters, and it may be that longitudinal, intra-subject changes in gait may be more sensitive.
We used a well-established manual ROI method for measuring the SI volume. Reference Choi, Jung, Lee, Lee, Sohn and Lee27,Reference Lee, Cho and Song35 A caveat is that we examined the SI, which contains the NBM, but not the NBM directly. This might limit comparability with some of the other studies considered. Manual approaches of delineating a basal forebrain ROI, in general, limit analyses to small cross-sectional volumes based on anatomical landmarks and can be impractical for large sample sizes. However, our approach, based on published methods, is reliable and was able to distinguish groups with differing levels of cognitive impairment. Other studies have used atlas-based stereotactic probabilistic mapping methods of labeling cholinergic nuclei ROI, which allows for more complete longitudinal volumes of the NBM. However, these methods also have limitations regarding standardization and patient-specific variability in anatomy which can impact the accuracy of ROI labeling compared to manual measurement. Reference Wang, Zhan, Roebroeck, De Weerd, Kashyap and Roberts36,Reference Doss, Johnson and Narasimhan37 Newer methods for automated segmentation such as deep learning may be more promising. Reference Doss, Johnson and Narasimhan37
In conclusion, our study shows that SI atrophy is associated with cognitive impairment in participants with Lewy body spectrum disease; however, more widespread GM atrophy was more strongly associated with cognitive aspects of gait performance such as DTC to gait speed. The degree of cognitive impairment was more strongly predictive of gait performance in the multivariable models than the MDS-UPDRS III score. Future directions will include analysis of the longitudinal changes in cognition and gait in relation to NBM atrophy.
Supplementary material
The supplementary material for this article can be found at https://doi.org/10.1017/cjn.2026.10623.
Author contributions
AY: Study design, data analysis and interpretation, writing first draft, critical review and revision of the manuscript. MG: Data processing and image analysis supervision, data analysis and interpretation, critical review and revision of the manuscript. FB: Critical review and revision of the manuscript. QA: Critical review and revision of the manuscript. EES: Critical review and revision of the manuscript. KN: Data collection, critical review and revision of the manuscript. BS: Data collection, critical review and revision of the manuscript. MM: Critical review and revision of the manuscript. SB: Critical review and revision of the manuscript. FP: Critical review and revision of the manuscript. MMO: Study design, data analysis, critical review and revision of the manuscript. RC: Study design and analysis, funding, critical review and revision of the manuscript.
Funding statement
Mario Masellis reports grant funding from CIHR related to the current project and unrelated grants, royalties and consulting fees from the Ontario Brain Institute, CIHR, Washington University, the Women’s Brain Health Initiative, Brain Canada, royalties from Henry Stewart Talks, and consulting fees from Eli Lilly, Novo-Nordisk Canada, and Esai Canada, and honoraria from the MINT Memory Clinics and ECHO Dementia Series. He also holds unpaid board memberships on the Alzheimer Society of Canada and the Parkinson Society of Canada. Sandra Black reports unrelated grants to their institution from Genentech, Optina, Roche, Eli Lilly, Eisa/Biogen Idec, NovoNordisk, Lilly Avid, ICON, Aribio Co., Maplight Therapeutics, Merck, Bristol Myers Squibb, Ontario Brain Institute, CIHR, Leducq Foundation, Heart and Stroke Foundation of Canada, NIH, Alzheimer’s Drug Discovery Foundation, Brain Canada, Weston Brain Institute, Canadian Partnership for Stroke Recovery, Canadian Foundation for Innovation, Focused Ultrasound Foundation, Alzheimer’s Association US, Compute Canada Resources for Research Groups, CANARIE. They report consulting fees or honoraria from Roche, Biogen, Novo-Nordisk, Esai, Eli-Lilli, Diagnostic Solutions and Results Inc., CpDnetwork planning committee and MINT Symposium, and board memberships on the World Dementia Counsil, the Ontario Dementia Alliance, ONDRI, CIHR, NIH and the Toronto Dementia Research Alliance. Manuel Montero-Odasso reports funding from CIHR and Brain Canada related to the current project. Richard Camicioli reports funding from CIHR and Brain Canada related to the current project and unrelated grants from NIH via Northwestern University and the Weston Foundation via Western University and unpaid membership on Parkinson Canada advisory board.
Competing interests
Albert K. Yeung reports no disclosures. Myrlene Gee reports no disclosures. Fang Ba reports no disclosures. Quincy Almeida reports unrelated funding from the NIH. Eric E. Smith reports no disclosures. Krista Nelles reports no disclosures. Breni Sharma reports no disclosures. Sandra Black reports no disclosures. Frederico Pieruccini-Faria reports no disclosures.


 Open access

