


Postprandial absorption of amino acids is a fundamental physiological process. After ingestion of protein, amino acids are present in the lumen in peptide (∼80 %) and free forms (∼20 %). Free amino acids and di-/tripeptides are absorbed into enterocytes across the brush border membrane via multiple amino acid transport systems and via a specific peptide transport system(Reference Bhutia, Ganapathy and Said1). Several comprehensive reviews have addressed the molecular basis behind the intestinal amino acid transport system(Reference Bröer and Fairweather2–Reference Trommelen, Tomé and van Loon4).
Amino acids and peptides are mainly absorbed in the proximal jejunum; however, other parts of the small intestine have a significant capacity to transport amino acids(Reference Bhutia, Ganapathy and Said1,Reference Bröer and Fairweather2,Reference Silk, Grimble and Rees5) . Thus, most amino acids are almost completely absorbed by the small intestine. These understandings are determined by findings derived from early studies in which luminal contents were collected from different sites of the small intestine several hours after the ingestion of protein(Reference Borgstrom, Dahlqvist and Lundh6–Reference Silk, Chung and Berger10). Glycine (Gly)(Reference Low11) and tryptophan (Trp)(Reference Singer, Camargo and Ramadan12) are reportedly absorbed less efficiently in the proximal small intestine, as significant amounts of these amino acids were detected in the ileal lumen(Reference Bhutia, Ganapathy and Said1). However, such regional differences were not consistently demonstrated in later studies, possibly because of variations in the experimental methods employed, including different animal species and in vivo/ex vivo models. Because of this, the regional differences in individual amino acid absorption and transport remain unclear.
Plasma amino acid concentrations in peripheral blood increase after meals(Reference Boirie, Dangin and Gachon13–Reference Nässl, Rubio-Aliaga and Fenselau15). It has been cautioned(Reference Trommelen, Tomé and van Loon4) that the plasma amino acid concentrations do not solely represent the quantity of exogenous (dietary) amino acids absorbed through the intestine. This is because they encompass both dietary and endogenous amino acids, which originate from a variety of peripheral tissues. However, postprandial changes in nutrient concentrations in the portal vein blood effectively reflect intestinal transport dynamics. Early studies demonstrated acute (30–60 min) increments in the concentrations of certain amino acids in the portal vein plasma of rats after a meal(Reference Imai, Fujita and Miura16) or administration of an amino acid mixture(Reference Hara, Funabiki and Iwata17); however, regional differences in the small intestine have not been addressed.
Nutrients, such as monosaccharides and amino acids, absorbed into the intestinal epithelial cells are transported into the blood capillaries underneath the epithelium(Reference DeSesso, Jacobson, Williams and Lyubimov18). The blood capillaries join the veins attached throughout the intestinal tissue. The intestinal veins originating from different regions of the intestinal tissue coalesce into the mesenteric veins embedded in the mesenteric tissue, and the mesenteric veins coalesce into the portal vein. Thus, blood and nutrients (except fats and fat-soluble vitamins) drained from the small and large intestines enter the portal vein via the mesenteric veins.
Amino acid levels in the mesenteric veins should be strongly influenced by amino acids transported through the intestinal epithelium. To clarify possible regional differences in postprandial amino acid transport between the proximal (jejunum) and distal (ileum) small intestines, we determined the plasma amino acid concentrations in the jejunal mesenteric, ileal mesenteric and portal veins over time. No previous reports have demonstrated time-course changes in proteogenic amino acid levels in these veins. Additionally, we measured luminal amino acid levels in the jejunum and ileum to estimate the intestinal absorption of orally or luminally administered amino acids.
Methods
Animals and diets
Male Sprague–Dawley rats (8 weeks old, 230∼250 g body weight (BW)) were purchased from Japan SLC. Animals were individually housed in a temperature- and humidity-controlled room (22 ± 2°C and 55 ± 5 %, respectively) and maintained on a 12 h light-dark cycle (08.00–20.00 light period). The rats had free access to water and were fed an AIN-93 diet(Reference Reeves19). The AIN-93G diet is the standard growth diet for rodents recommended by the American Institute of Nutrition. It contains 39·7486 g maize starch, 20 g casein, 13·2 g maltodextrin, 10·0 g sucrose, 7·0 g soybean oil, 5·0 g powdered cellulose, 3·5 g AIN-93G Mineral Mix, 1·0 g AIN-93 Vitamin Mix, 0·3 g L-cystine, 0·25 g choline bitartrate and 0·0014 g t-butylhydroquinone in 100 g diet. Experiments were performed after a 1-week acclimatisation period. The rats were randomly allocated to each group using the standard = RAND() function in Microsoft Excel. This study was approved by the Hokkaido University Animal Committee (approval number 19-0072), and the animals were maintained in accordance with the Hokkaido University guidelines for the care and use of laboratory animals. All reagents were purchased from FUJIFILM Wako Pure Chemical Corporation unless otherwise specified.
Monitoring amino acid levels of jejunal and ileal mesenteric veins after oral administration of a diet suspension or an amino acid mixture (Expt 1)
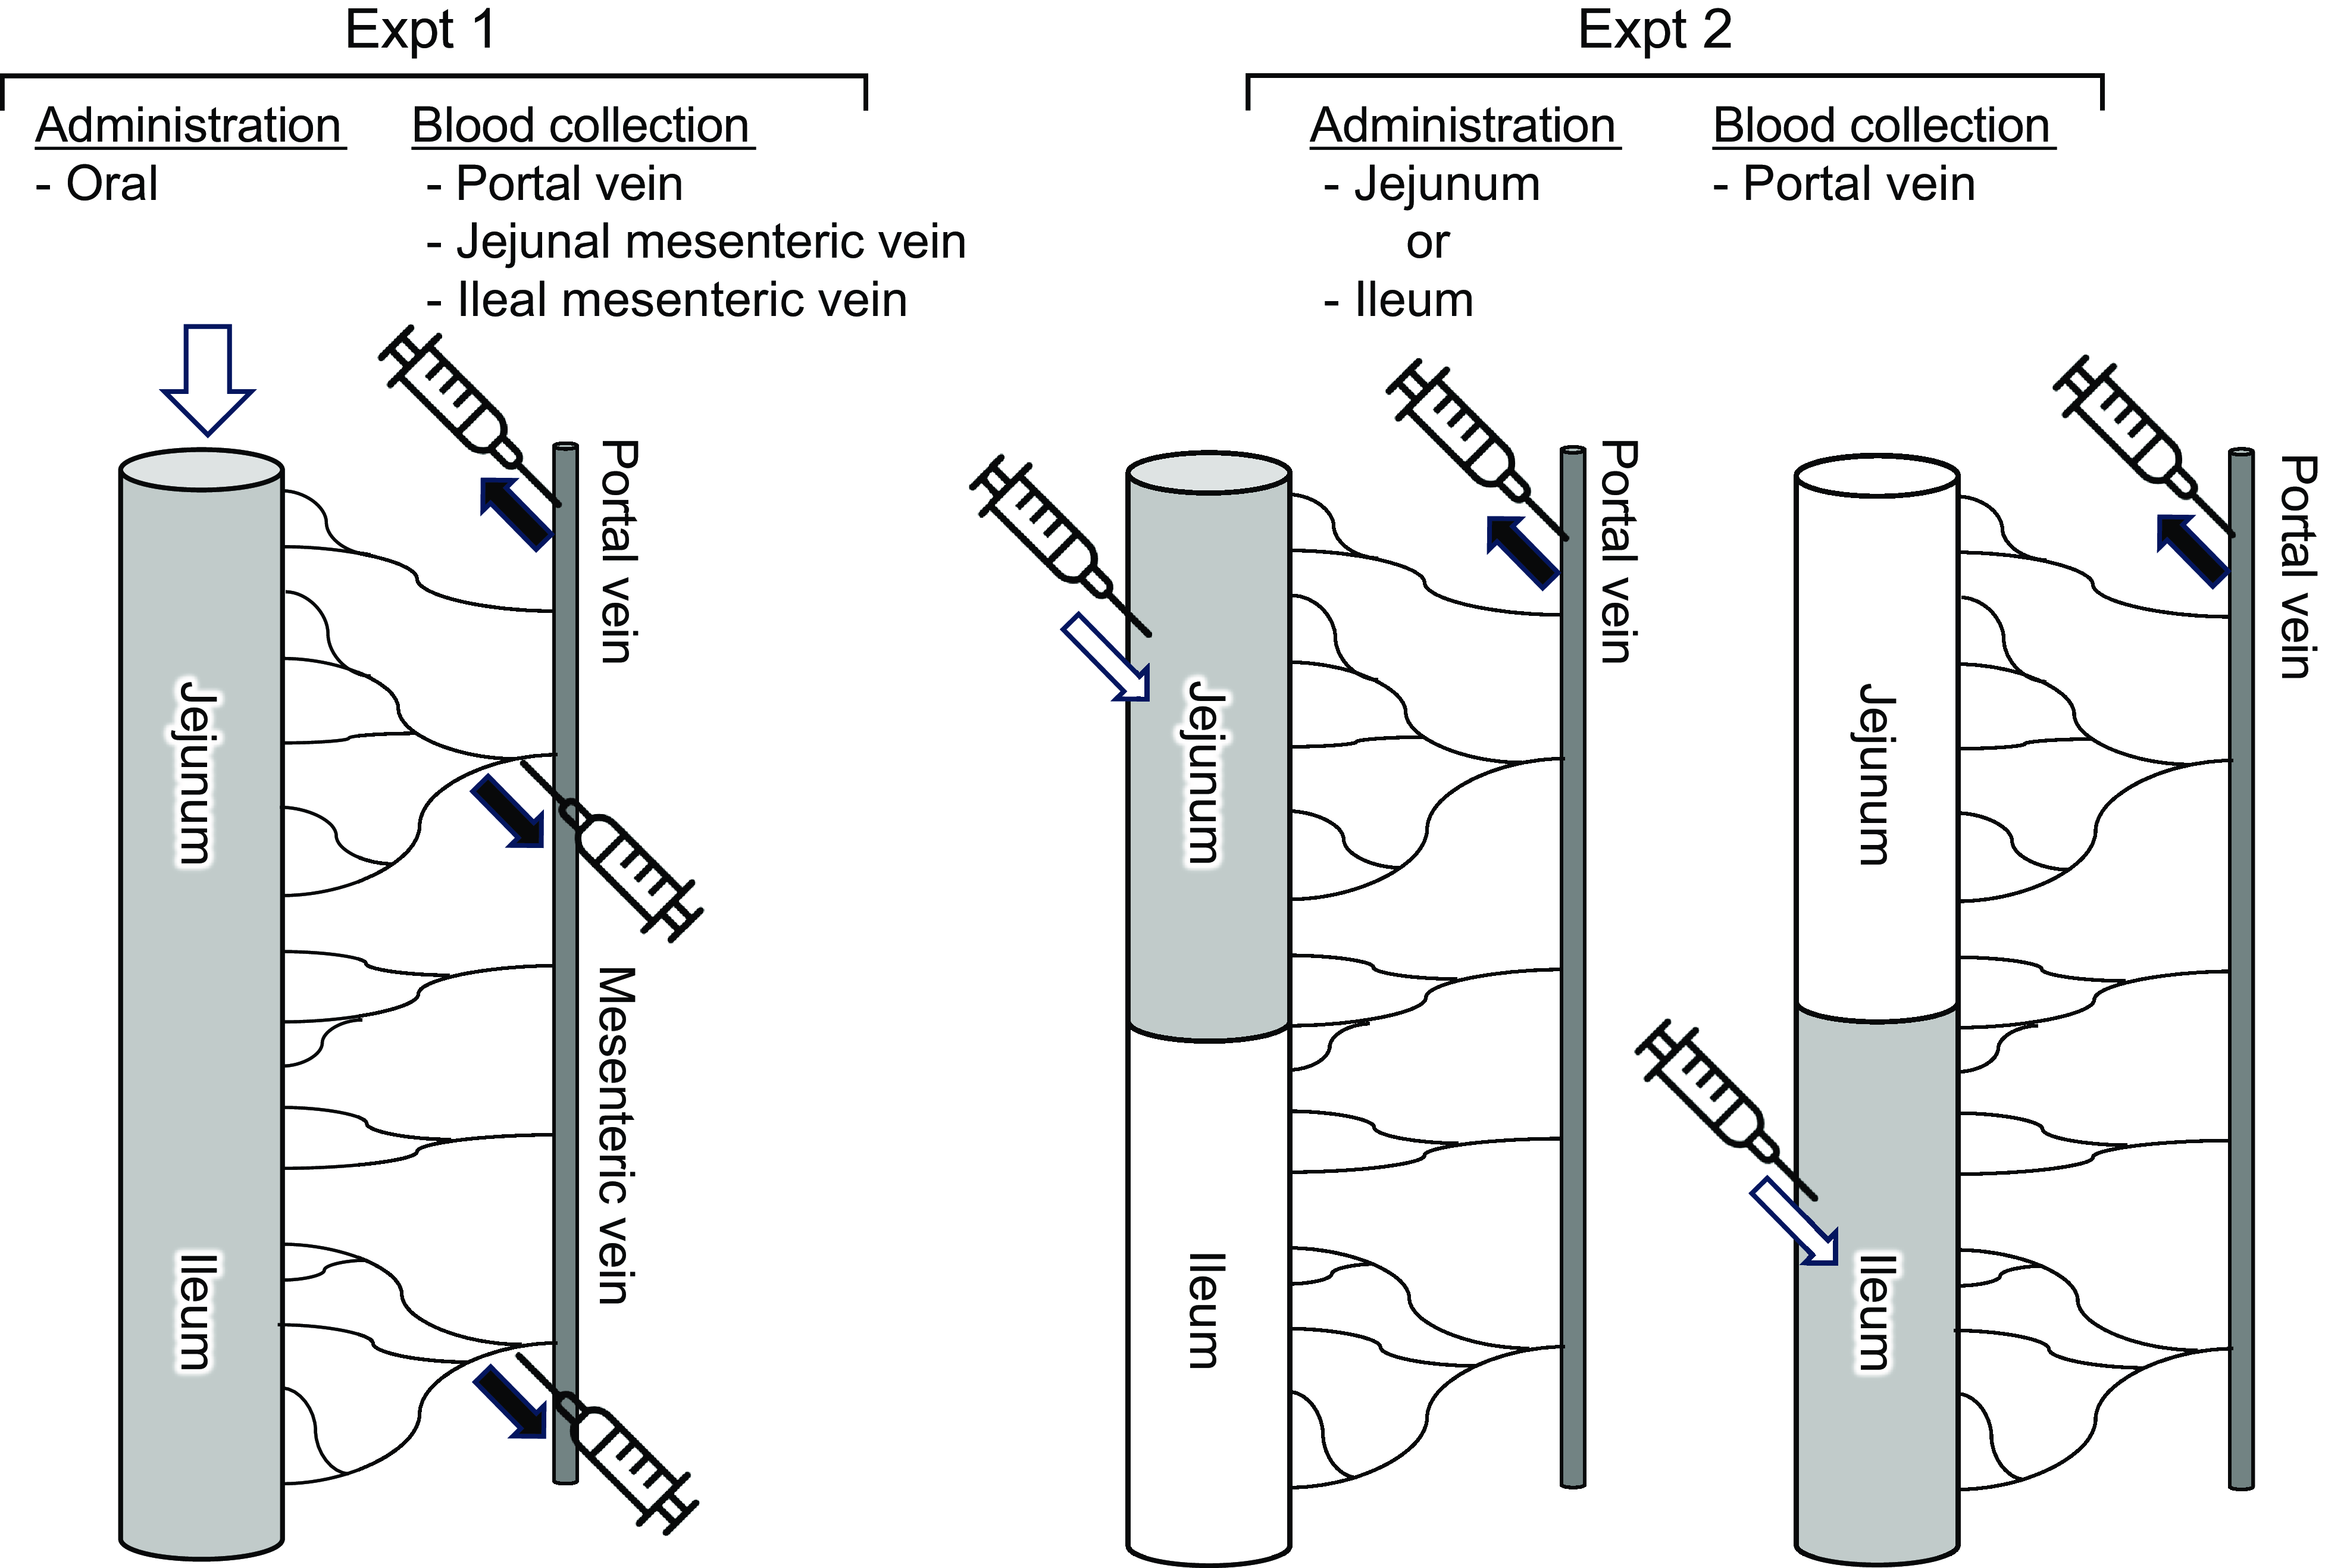
The experimental setup is shown in Fig. 1. Rats (n 6/group, forty-two in total, seven groups; basal, amino acid administration 15 min, amino acid administration 30 min, amino acid administration 60 min, diet administration 15 min, diet administration 30 min and diet administration 60 min) were feed-deprived overnight and then received an oral gavage (18 ml/kg BW) of a suspended diet or amino acid mixture (Table 1). The basal (0 min) group did not receive an oral gavage. A diet suspension was prepared by homogenising AIN-93G (20 % casein) in water at the concentration of 3 g/18 ml. The dose at 3 g diet/18 ml/kg BW was equivalent to 0·75 g diet/rat having 250 g BW. Rats typically consume this amount of the diet after fasting for several hours. The amino acid mixture was prepared by adding glutamine (Gln) and asparagine (Asn) to a commercial amino acid injection (PROTEAMIN 12, Terumo Corporation) because the amino acid injection did not contain these amino acids. The concentrations of Gln and Asn were adjusted to have levels similar to casein in the diet suspension(Reference Dangin, Boirie and Garcia-Rodenas20). Both the diet suspension and the amino acid mixture had similar total amino acid concentrations (584 mg/18 ml). In the present study, we did not conduct the experiment under isonitrogenous and isoenergetic conditions because we aimed to compare amino acid transport between the jejunum and ileum after oral administration of the free amino acid mixture or diet. In the case of diet, carbohydrates, fats and other components could affect amino acid transport and metabolism. Accordingly, direct statistical comparisons were not performed between the amino acid mixture treatment and diet treatment.
Schematic diagram of experiments. Expt 1 was conducted to monitor amino acid levels of jejunal and ileal mesenteric veins after oral administration of a diet suspension or an amino acid mixture. Expt 2 was conducted to monitor amino acid levels of portal vein after luminal (jejunum or ileum) administration of an amino acid mixture.
Composition of amino acid mixtures
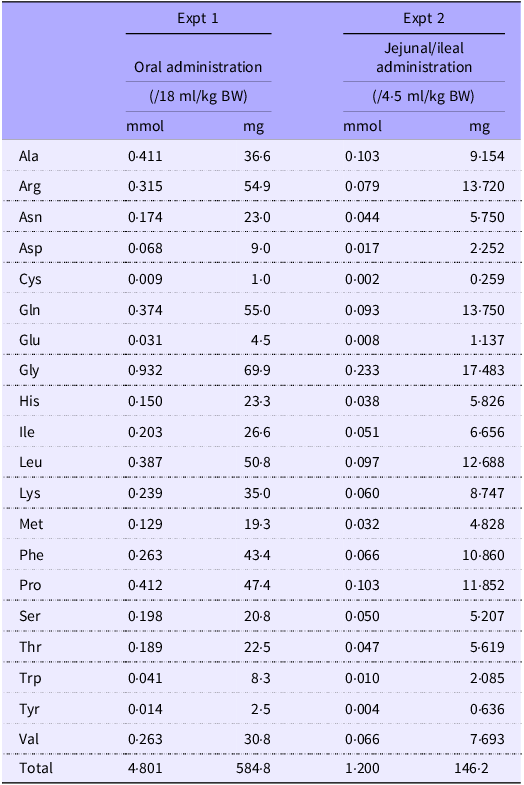
The amino acid mixture was prepared by adding Gln and Asn to a commercial amino acid injection (PROTEAMIN 12; Terumo Corporation) to adjust the amino acid concentrations to match those in the casein diet suspension.
Fifteen, 30 or 60 min after administration, rats were anaesthetised with sodium pentobarbital (50 mg/kg), and laparotomy was performed immediately for blood sampling. Blood samples were collected from the jejunal mesenteric, ileal mesenteric(Reference Hira, Sekishita and Hara21) and portal veins using a syringe containing concentrated heparin solution (final concentration of 50 IU/ml blood). The rats were then euthanised by exsanguination. Plasma was collected after centrifugation (2300 g , 10 min at 4°C) and stored at –80°C until analysis. The entire small intestine was separated into the upper half (jejunum with duodenum) and the lower half (ileum). Luminal contents were collected by flushing with 5 ml ice-cold saline two times followed by flushing with air and were stored at –80°C until analysis.
Monitoring amino acid levels of portal vein after luminal (jejunum or ileum) administration of an amino acid mixture (Expt 2)
Rats (n 6/group, forty-two in total, seven groups; basal, jejunal administration 15 min, jejunal administration 30 min, jejunal administration 60 min, ileal administration 15 min, ileal administration 30 min and ileal administration 60 min) were feed-deprived overnight, and laparotomy was performed under anaesthesia with sodium pentobarbital (50 mg/kg) on a heating pad to maintain body temperature. In the jejunal administration group, the pylorus and middle region of the small intestine (45 cm proximal to the terminal ileum, as the whole length of the small intestine was typically 90 cm in rats having 250–300 g BW) were ligated using surgical sutures. In the ileal administration group, the middle region of the small intestine (45 cm proximal to the terminal ileum) and the terminal ileum were ligated with surgical sutures. The amino acid mixture (Table 1) was directly infused into the jejunal lumen through the duodenum or into the ileal lumen at a dose of 4·5 ml/kg BW (1/4 oral administration).
Fifteen, 30 or 60 min after administration, blood samples were collected from the portal vein. Rats were euthanised immediately by exsanguination. In the basal group (0 min), the pylorus, middle region of the small intestine, and terminal ileum were ligated. In the basal group, water was directly infused into both regions at 4·5 ml/kg BW as a sham treatment, and blood and luminal samples were immediately collected as basal samples. Plasma and intestinal contents were collected as described above.
Amino acid measurement
Plasma samples were mixed with norleucine (an internal standard) and acetonitrile (plasma:0·5 mM norleucine:acetonitrile = 1:1:2), centrifuged to precipitate protein, and the supernatant was collected for phenylthiocarbamyl derivatisation. The intestinal content was centrifuged in saline, and the supernatant was diluted 5-fold with 0·1 M HCl. The diluted intestinal contents were then treated in a manner similar to that of the plasma sample, as described above. Amino acid concentrations were measured as phenylthiocarbamyl derivatives(Reference Cohen, Bidlingmeyer and Tarvin22) via HPLC using a Wakopak® Wakosil-phenylthiocarbamyl (4·0 mm × 200 mm, Wako) column and a diode array detector at 254 nm. The amino acid standard solution (Amino Acids Mixture Standard Solution, Type H, Wako) contains cystine rather than cysteine (Cys) because Cys is easily oxidised into cystine in tissue and blood(Reference Yin, Ren and Yang23).
Statistical analysis
The sample size was calculated based on the experimental design (one-way ANOVA), comparing the plasma amino acid levels determined in the three different veins as the primary outcome measure. The required sample size was six per group, which was calculated using G × Power software (version 3.1.9.4) with power at 0·75, significance level at 0·05 and effect size at 0·8. The effect size was estimated based on the results of a preliminary study. Data are expressed as mean (s em). Statistical analyses were performed using JMP Pro version 17.0.0 (SAS Institute, Inc.). The values of the portal samples were not included in statistical comparisons because they were similar to those of the jejunal mesenteric samples. Statistical significance was determined using Student’s t test. In all analyses, statistical significance was set at P< 0·05.
Results
In Expt 1, changes in amino acid levels (total and individual) were determined in the plasma of the portal, jejunal and ileal mesenteric veins and the contents of the jejunal and ileal lumens after oral administration of the amino acid mixture or diet suspension. Since plasma amino acid concentrations in the jejunal mesenteric vein and portal vein displayed almost equivalent values for most individual amino acids (Figs. 2 and 3), and because our focus was on the difference between the jejunum and ileum, statistical comparisons were made solely between data from these two veins at corresponding time points, with data from the portal vein excluded from the analysis.
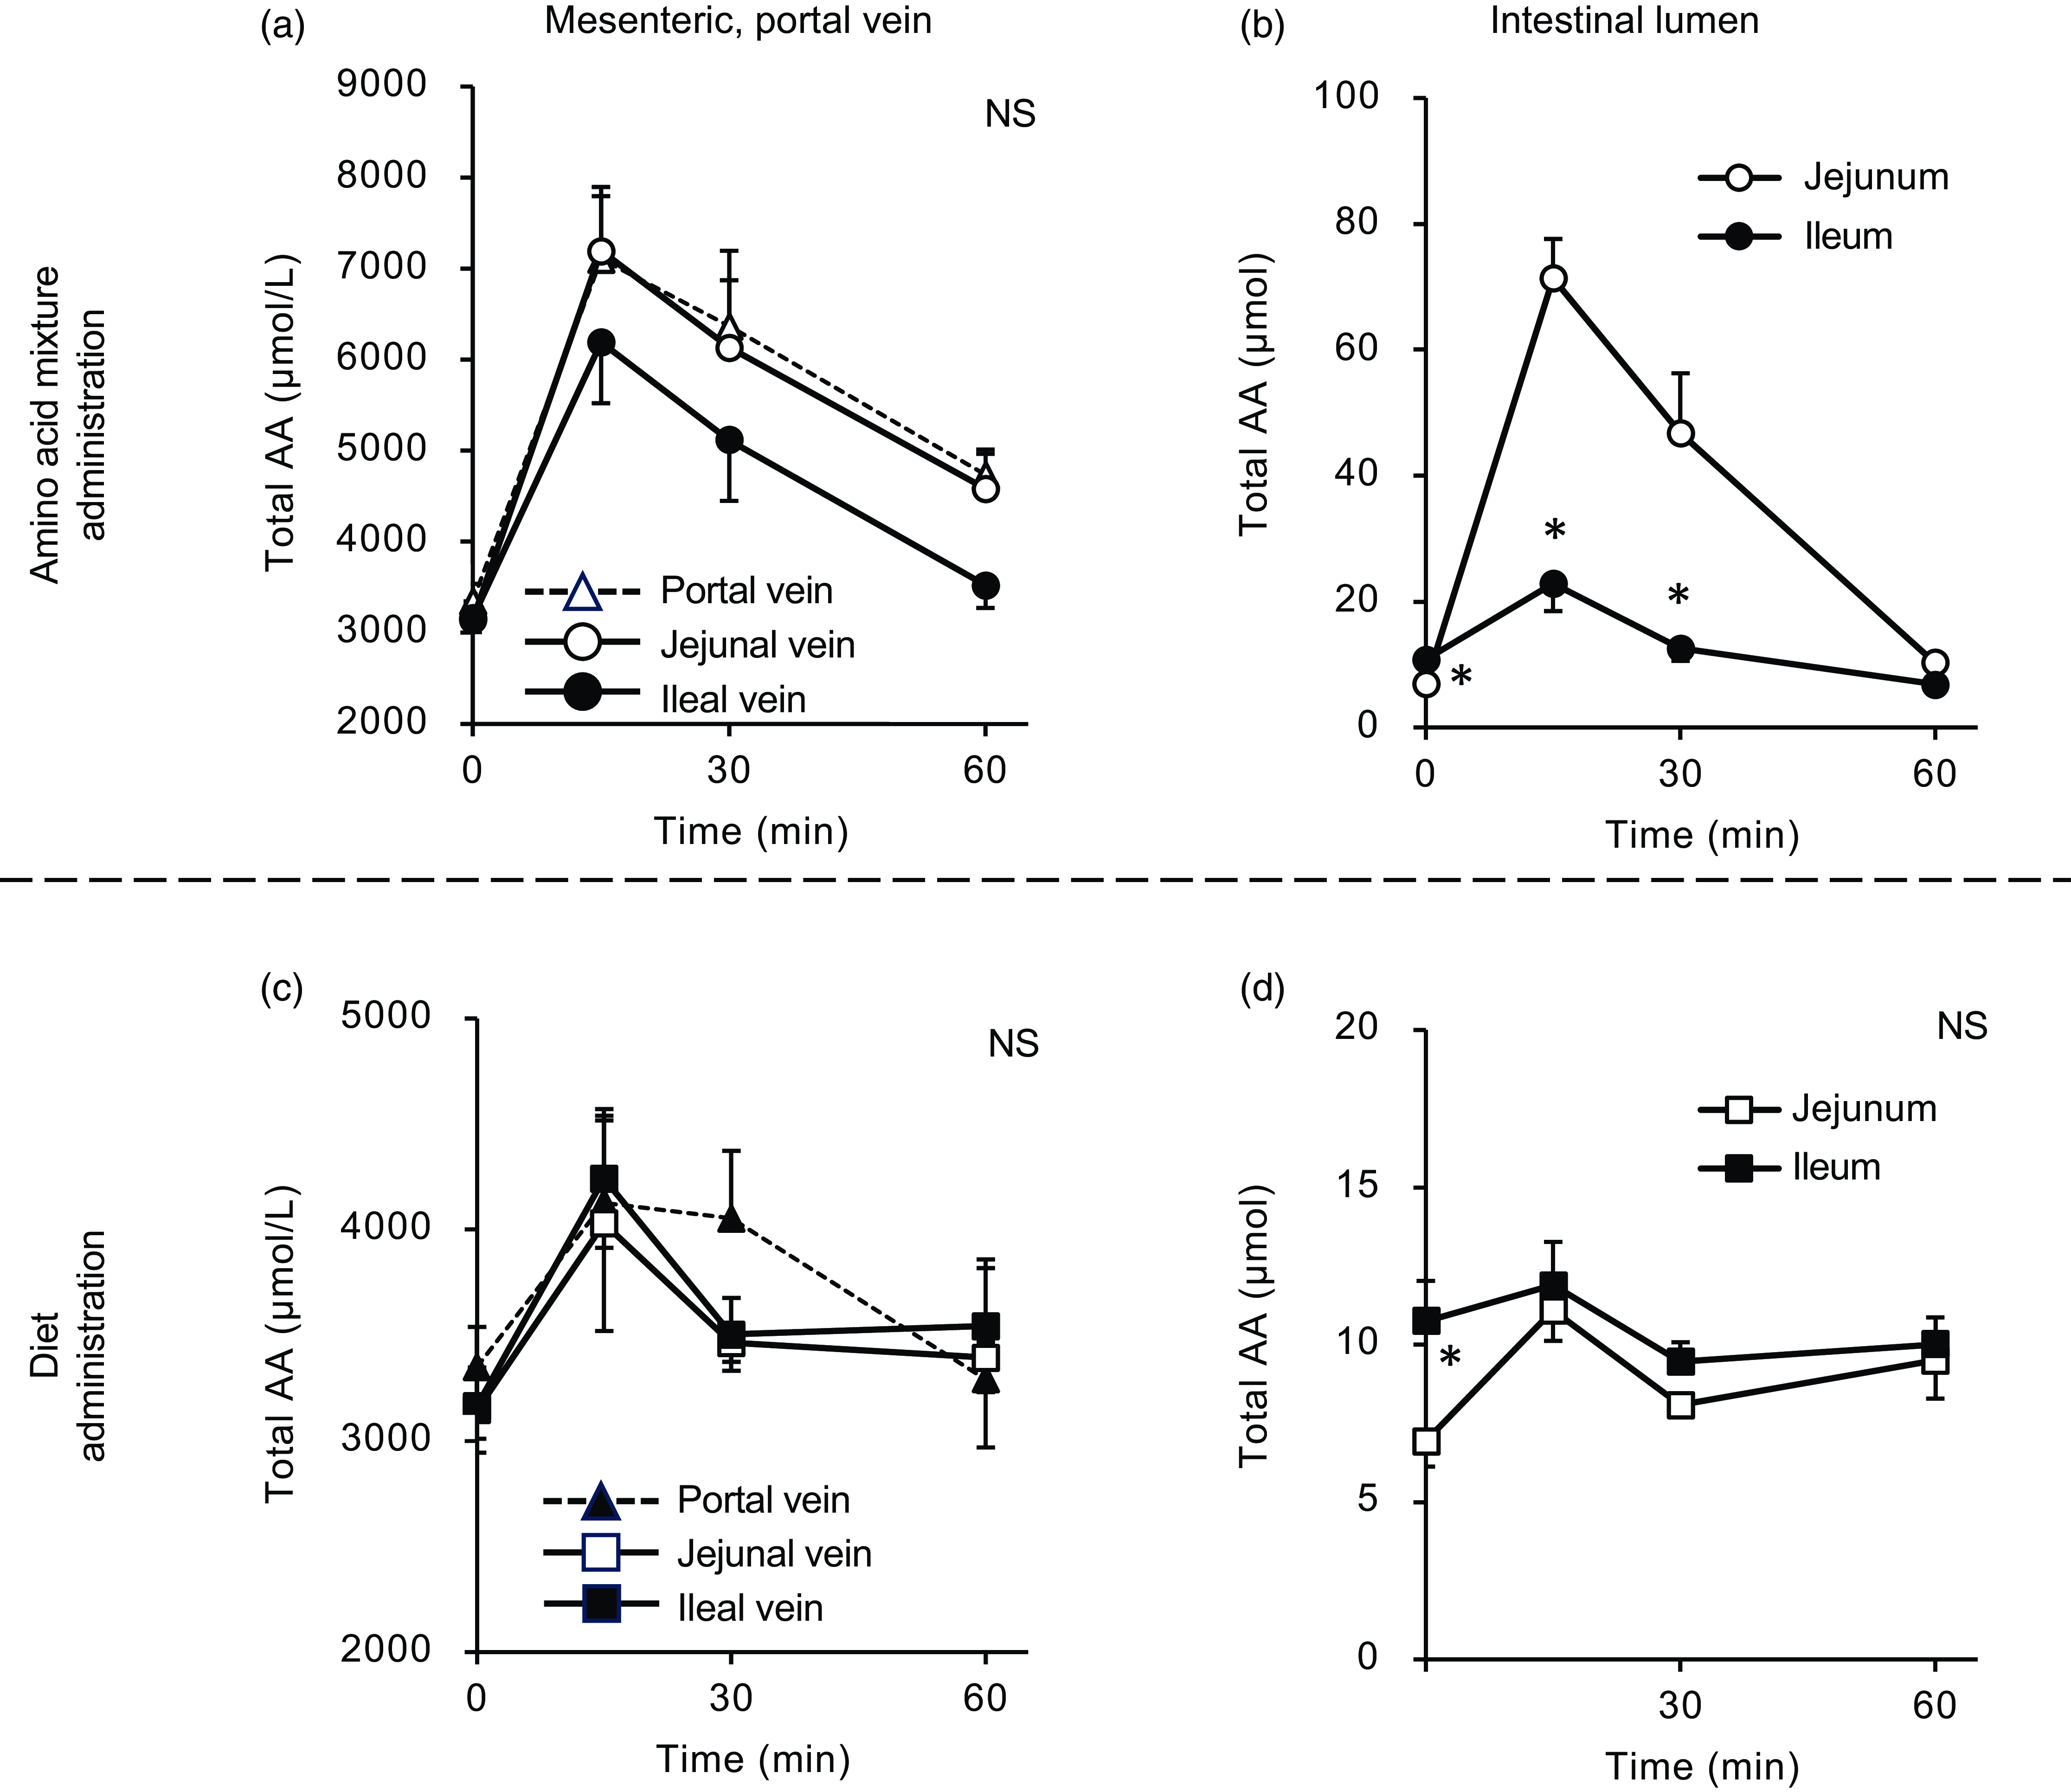
Total amino acid concentrations in the mesenteric veins and small intestinal lumen after oral administration of the amino acid mixture or diet. The amino acid mixture (a) and (b) or diet suspension (c) and (d) was orally administered to awake rats. Blood samples were collected from the jejunal, ileal and portal veins 15, 30 and 60 min after oral administration under anaesthesia (a) and (c). Subsequently, the luminal contents were collected separately from the proximal (jejunum) and distal (ileum) halves of the small intestine. Values are expressed as mean (sem) (n 6). Asterisks (*) indicate significant differences between values of the jejunal and ileal samples at the same time point (P< 0·05, Student’s t test), and ‘NS’ indicates no significant differences. The values of the portal samples were not included in statistical comparisons because they were similar to those of the jejunal mesenteric samples.
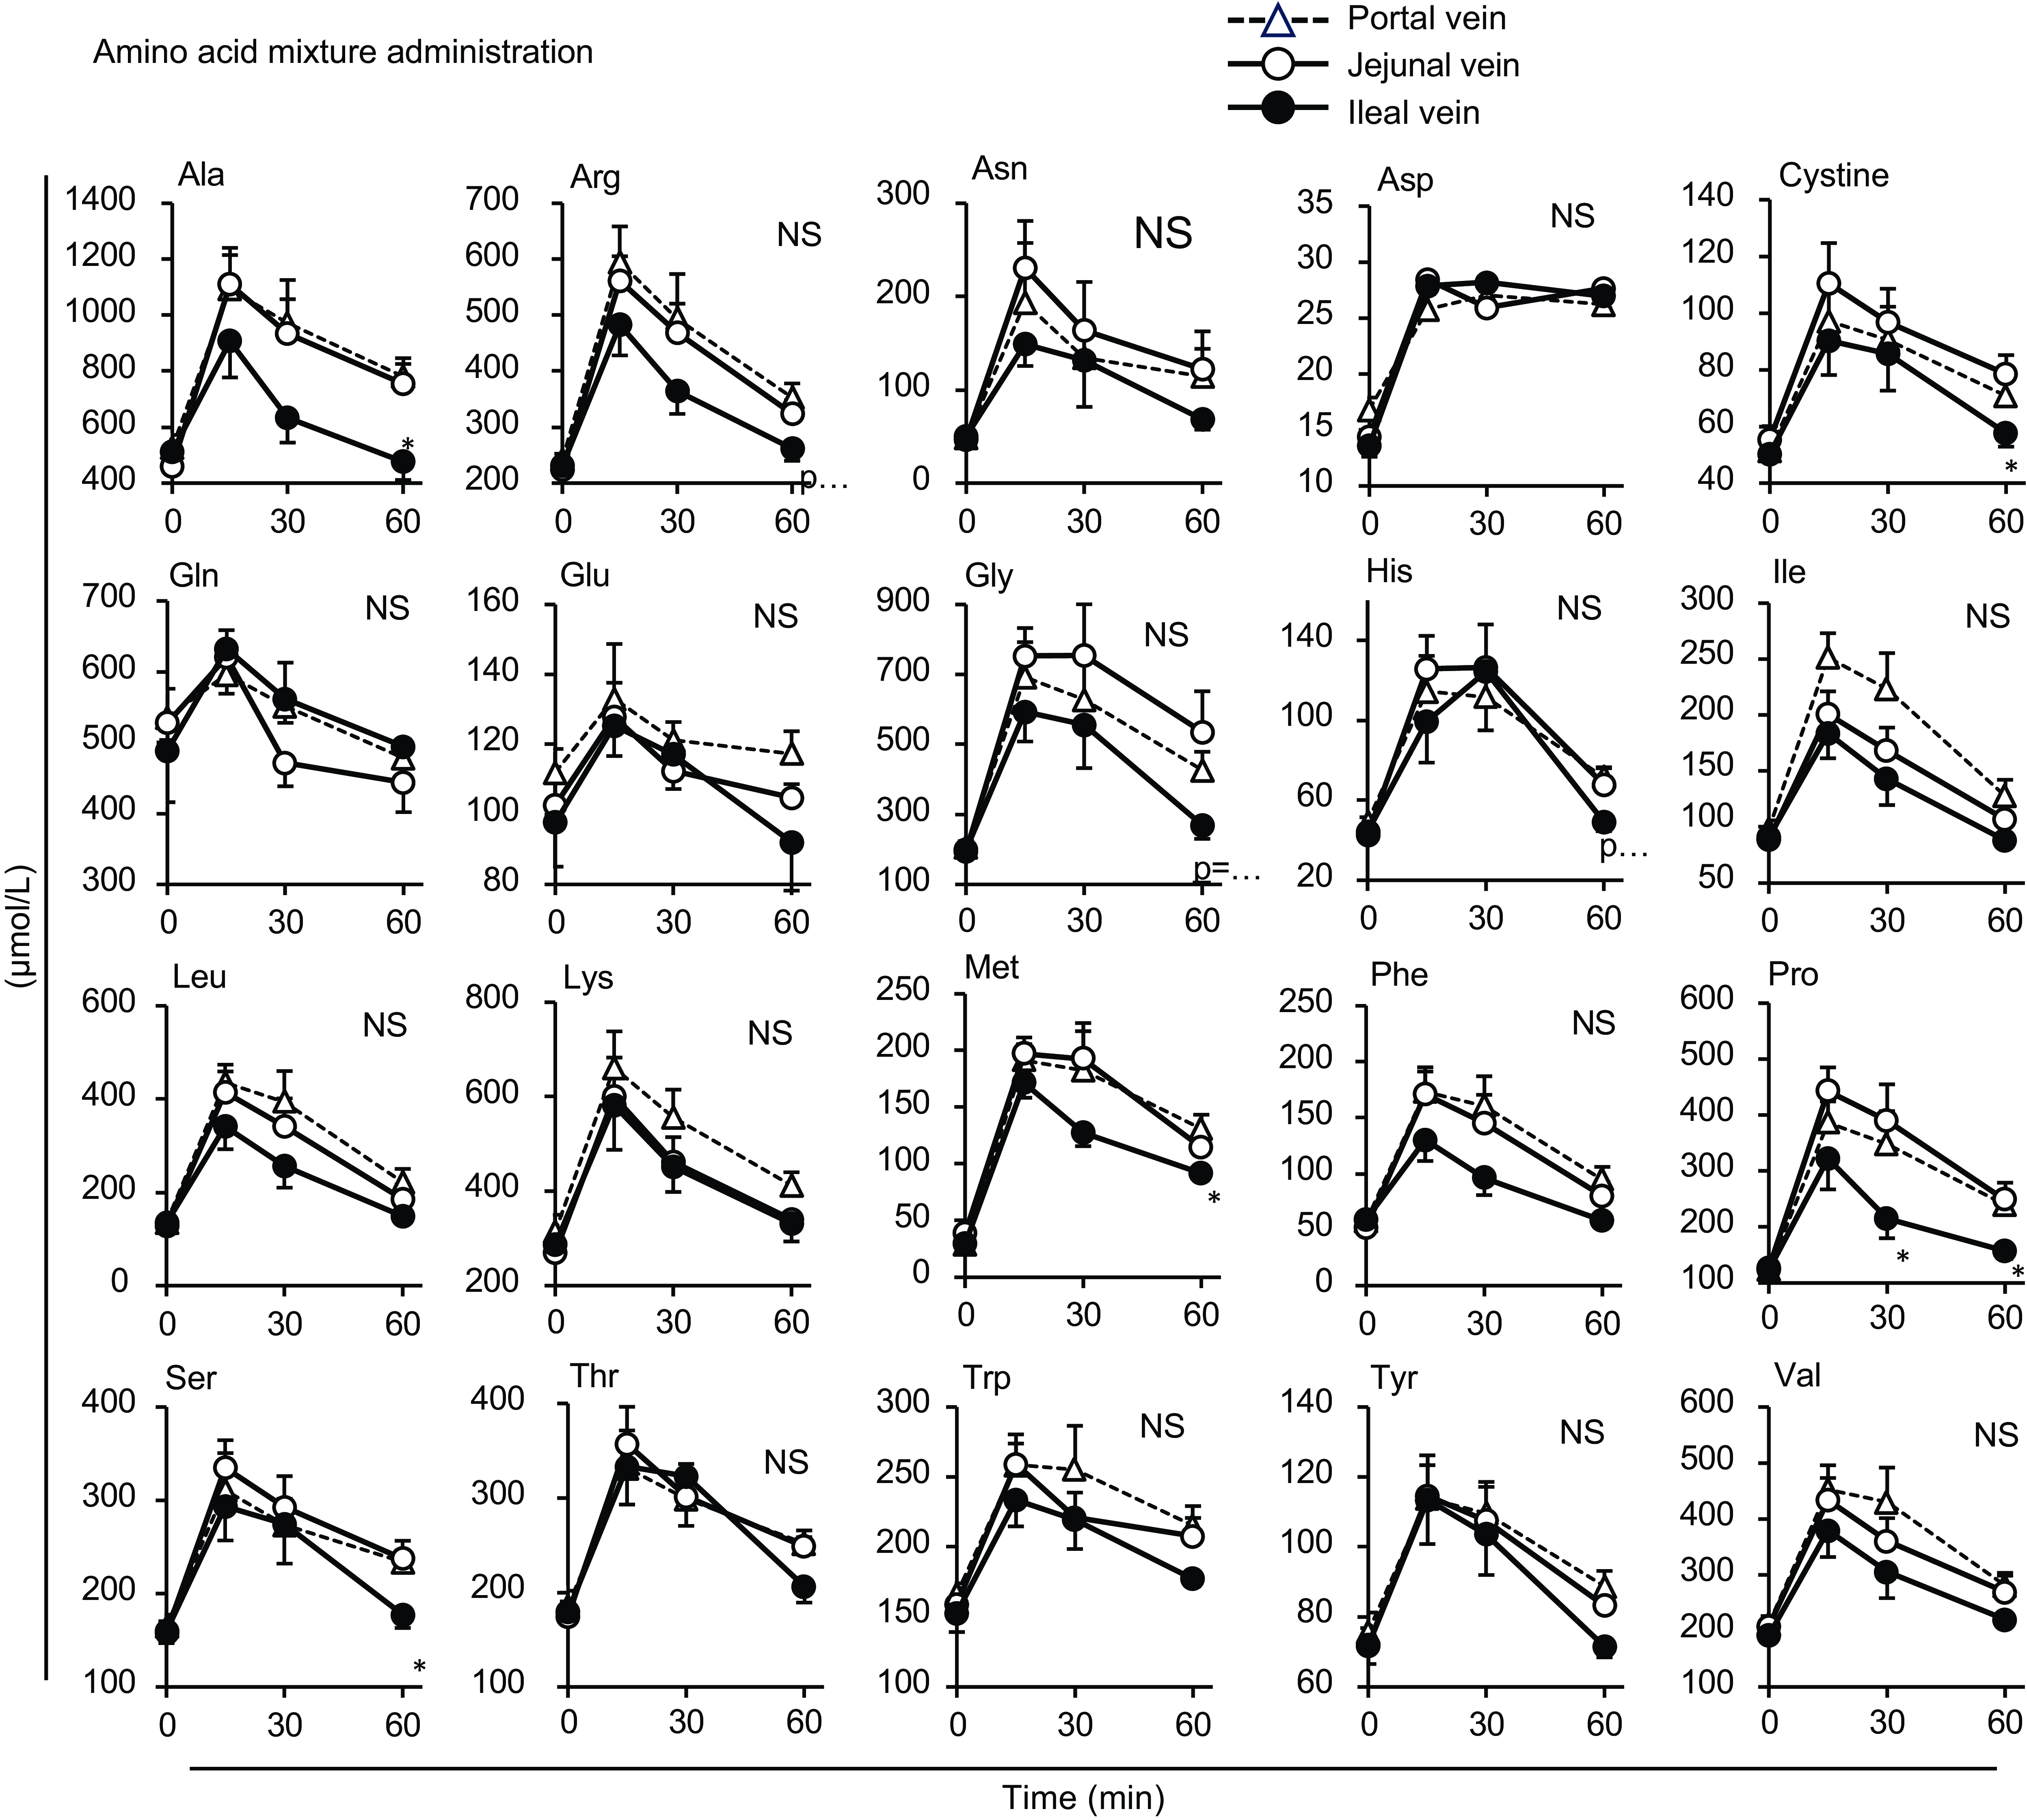
Individual amino acid concentrations in mesenteric veins after oral administration of the amino acid mixture. The amino acid mixture was orally administered to awake rats. Blood samples were collected from jejunal, ileal and portal veins. Values are expressed as means (sem) (n 6). Asterisks (*) indicate significant differences between values of the jejunal and ileal samples at the same time point (P< 0·05, Student’s t test), and ‘NS’ indicates no significant differences. The values of the portal samples were not included in the statistical comparisons because they were similar to those of the jejunal mesenteric samples.
After oral administration of the amino acid mixture, the plasma total amino acid concentration rapidly increased, peaking at 15 min with maximum concentrations from 6000 to 7000 µM in the portal, jejunal and ileal mesenteric veins (Fig. 2(a)). Subsequently, the total amino acid concentration gradually decreased over 60 min. Compared with the jejunal and portal veins, the ileal mesenteric vein tended to have a lower total amino acid concentration. The AUC of changes in the total amino acid concentration from the baseline of the ileal mesenteric vein was significantly lower than that of the jejunal mesenteric vein (1578 ± 278 v. 2493 ± 294 µmol × 1 h, P= 0·047). In the jejunal lumen, the total amino acid amount peaked at 15 min (∼80 µmol), followed by a gradual decrease to the basal level (Fig. 2(b)). The maximum amount (∼30 µmol) in the ileal lumen was much lower than that in the jejunum.
Oral administration of the diet (equivalent total amino acid content to that of the amino acid mixture) also induced an increase in plasma total amino acid concentrations in a manner similar to the administration of the amino acid mixture (Fig. 2(c)). However, the maximum concentrations (approximately 4000 µM) were lower than those observed after administration of the amino acid mixture (6000–7000 µM). There were no differences between the total amino acid concentrations in the jejunal and ileal mesenteric veins. After oral administration, the amount of luminal amino acids increased by 5 µmol in the jejunum but not in the ileum (Fig. 2(d)). Additionally, the increment resulting from diet administration was much smaller than that observed with the administration of amino acids (5 v. 70 µmol).
After the administration of the amino acid mixture, alanine (Ala), arginine (Arg), methionine (Met), phenylalanine (Phe), proline (Pro) and serine (Ser) had lower levels in the ileal mesenteric vein than in the jejunal mesenteric vein, whereas other amino acids in the ileal mesenteric vein had slightly lower or similar elevations to those in the jejunal mesenteric vein (Fig. 3).
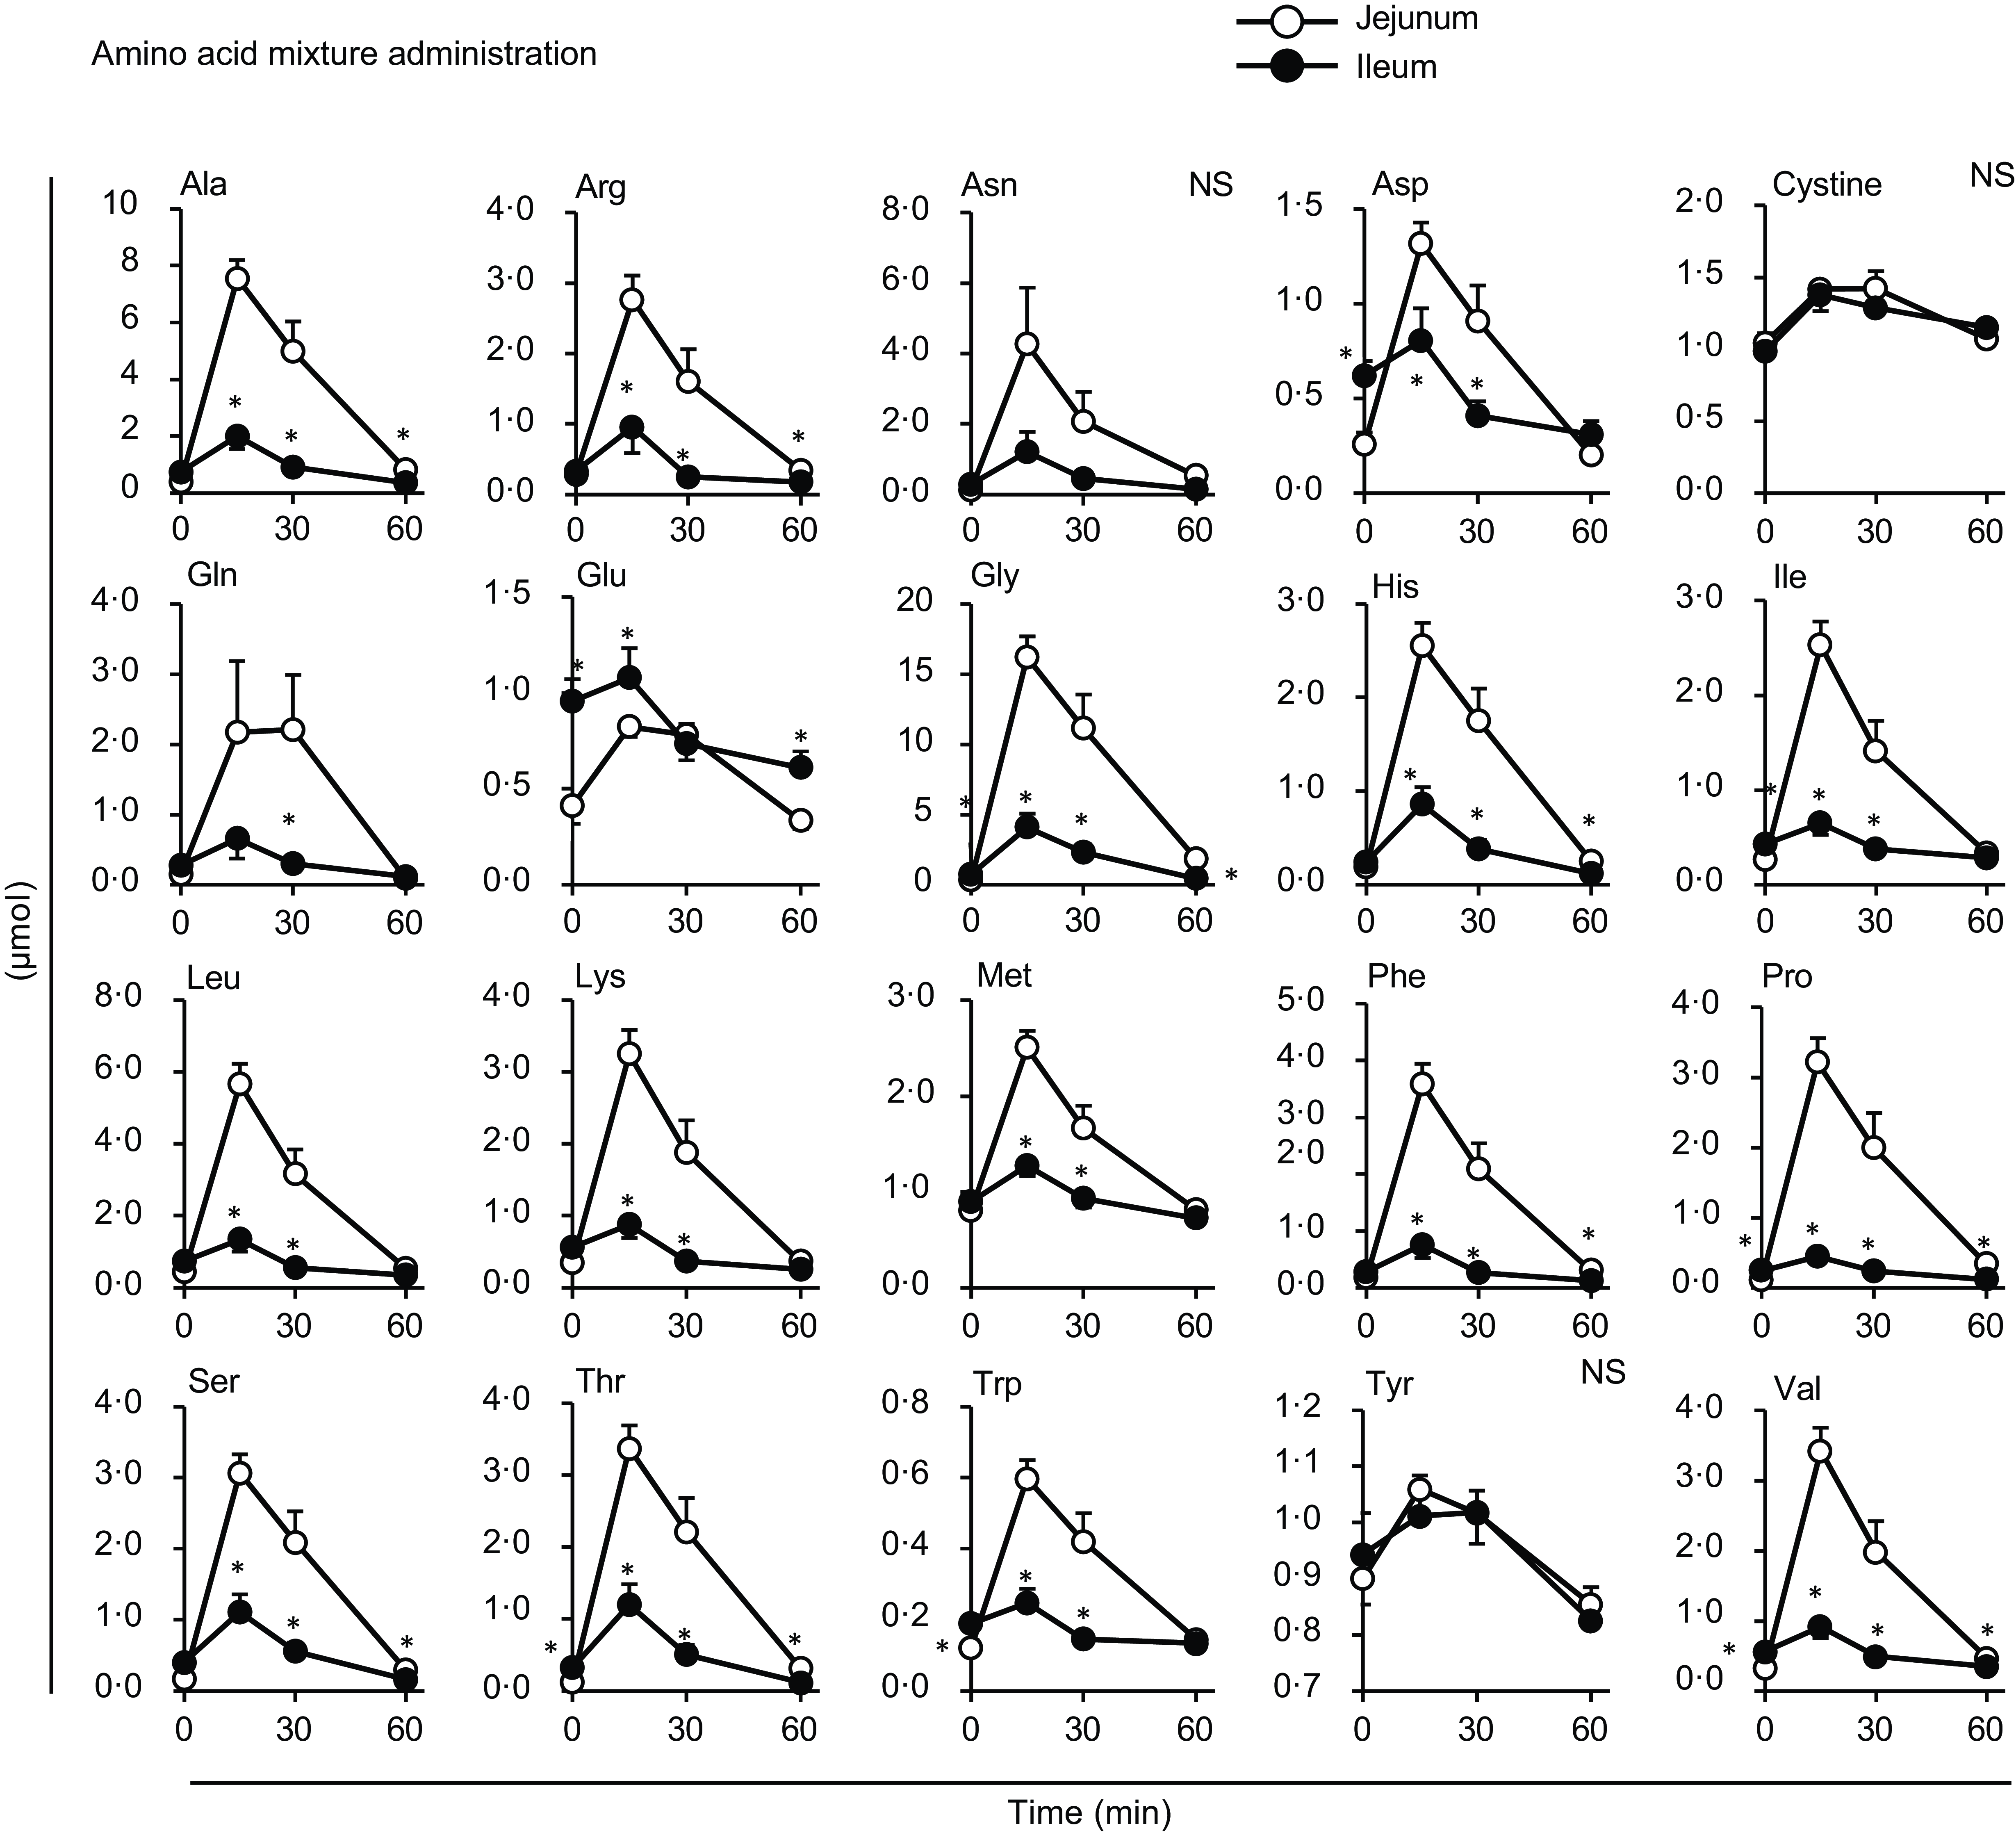
Most amino acids showed a minor increase after diet administration compared with the amino acid mixture administration, with no regional differences between the jejunal and ileal mesenteric veins (Fig. 4). Gln and Glu concentrations showed a transient and significant elevation solely in the ileal mesenteric vein, while they gradually decreased in the jejunal and portal veins. Similar to the total amino acids, the amounts of individual amino acids were higher in the jejunum than in the ileum after the administration of the amino acid mixture, except for cystine, Glu and tyrosine (Tyr) (Fig. 5). Several amino acids (Asp, Glu, Gly, isoleucine (Ile), Pro, threonine (Thr), Trp and valine (Val)) showed higher levels in the ileal lumen than in the jejunal lumen in the basal state (Figs. 5 and 6). These differences were much smaller than the increase in individual amino acids after the administration of the amino acid mixture.
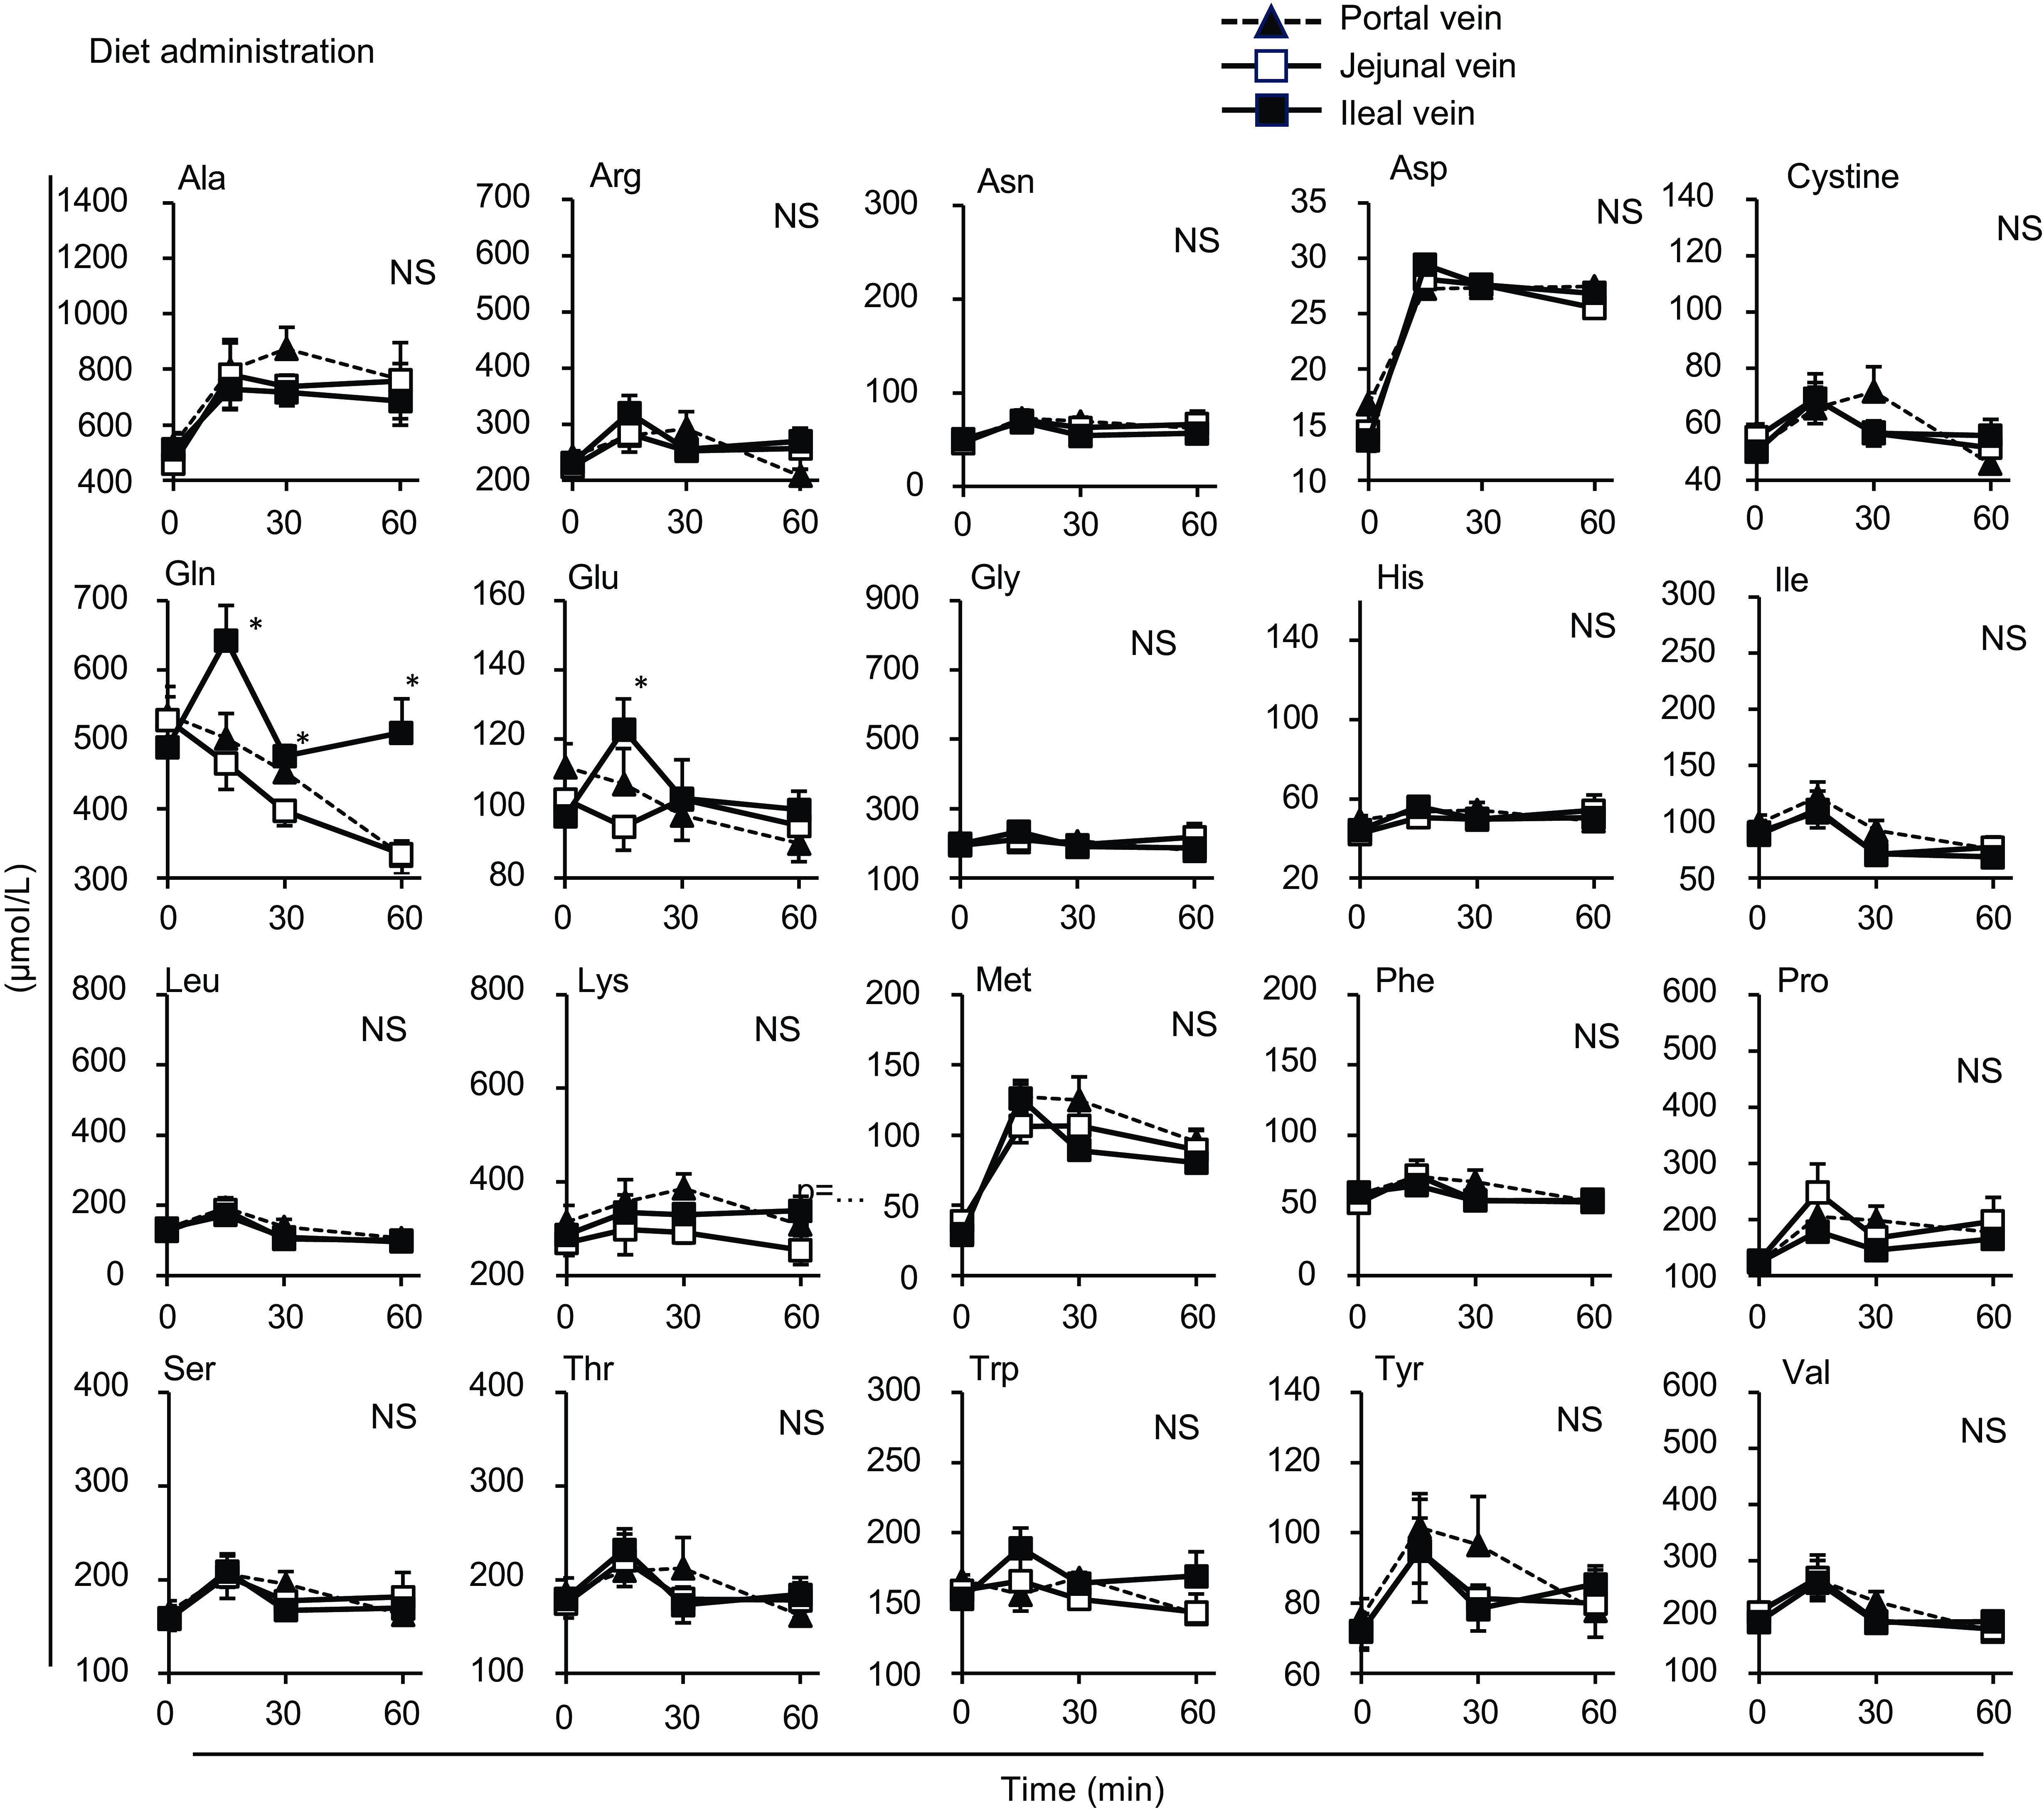
Individual amino acid concentrations in the mesenteric veins after oral administration of diet suspension. The diet suspension was orally administered to awake rats. Blood samples were collected from the jejunal, ileal and portal veins. Values are expressed as means (sem) (n 6). Asterisks (*) indicate significant differences between values of the jejunal and ileal samples at the same time point (P< 0·05, Student’s t test), and ‘NS’ indicates no significant differences. The values of the portal samples were not included in the statistical comparisons because they were similar to those of the jejunal mesenteric samples.
Individual amino acid concentrations in the lumen of the small intestine after oral administration of the amino acid mixture. The amino acid mixture was orally administered to awake rats. Luminal contents were collected from the proximal (jejunum) and distal (ileum) halves of the small intestine. Values are expressed as means (sem) (n 6). Asterisks (*) indicate significant differences between values of the jejunal and ileal samples at the same time point (P< 0·05, Student’s t test), and ‘NS’ indicates no significant differences.
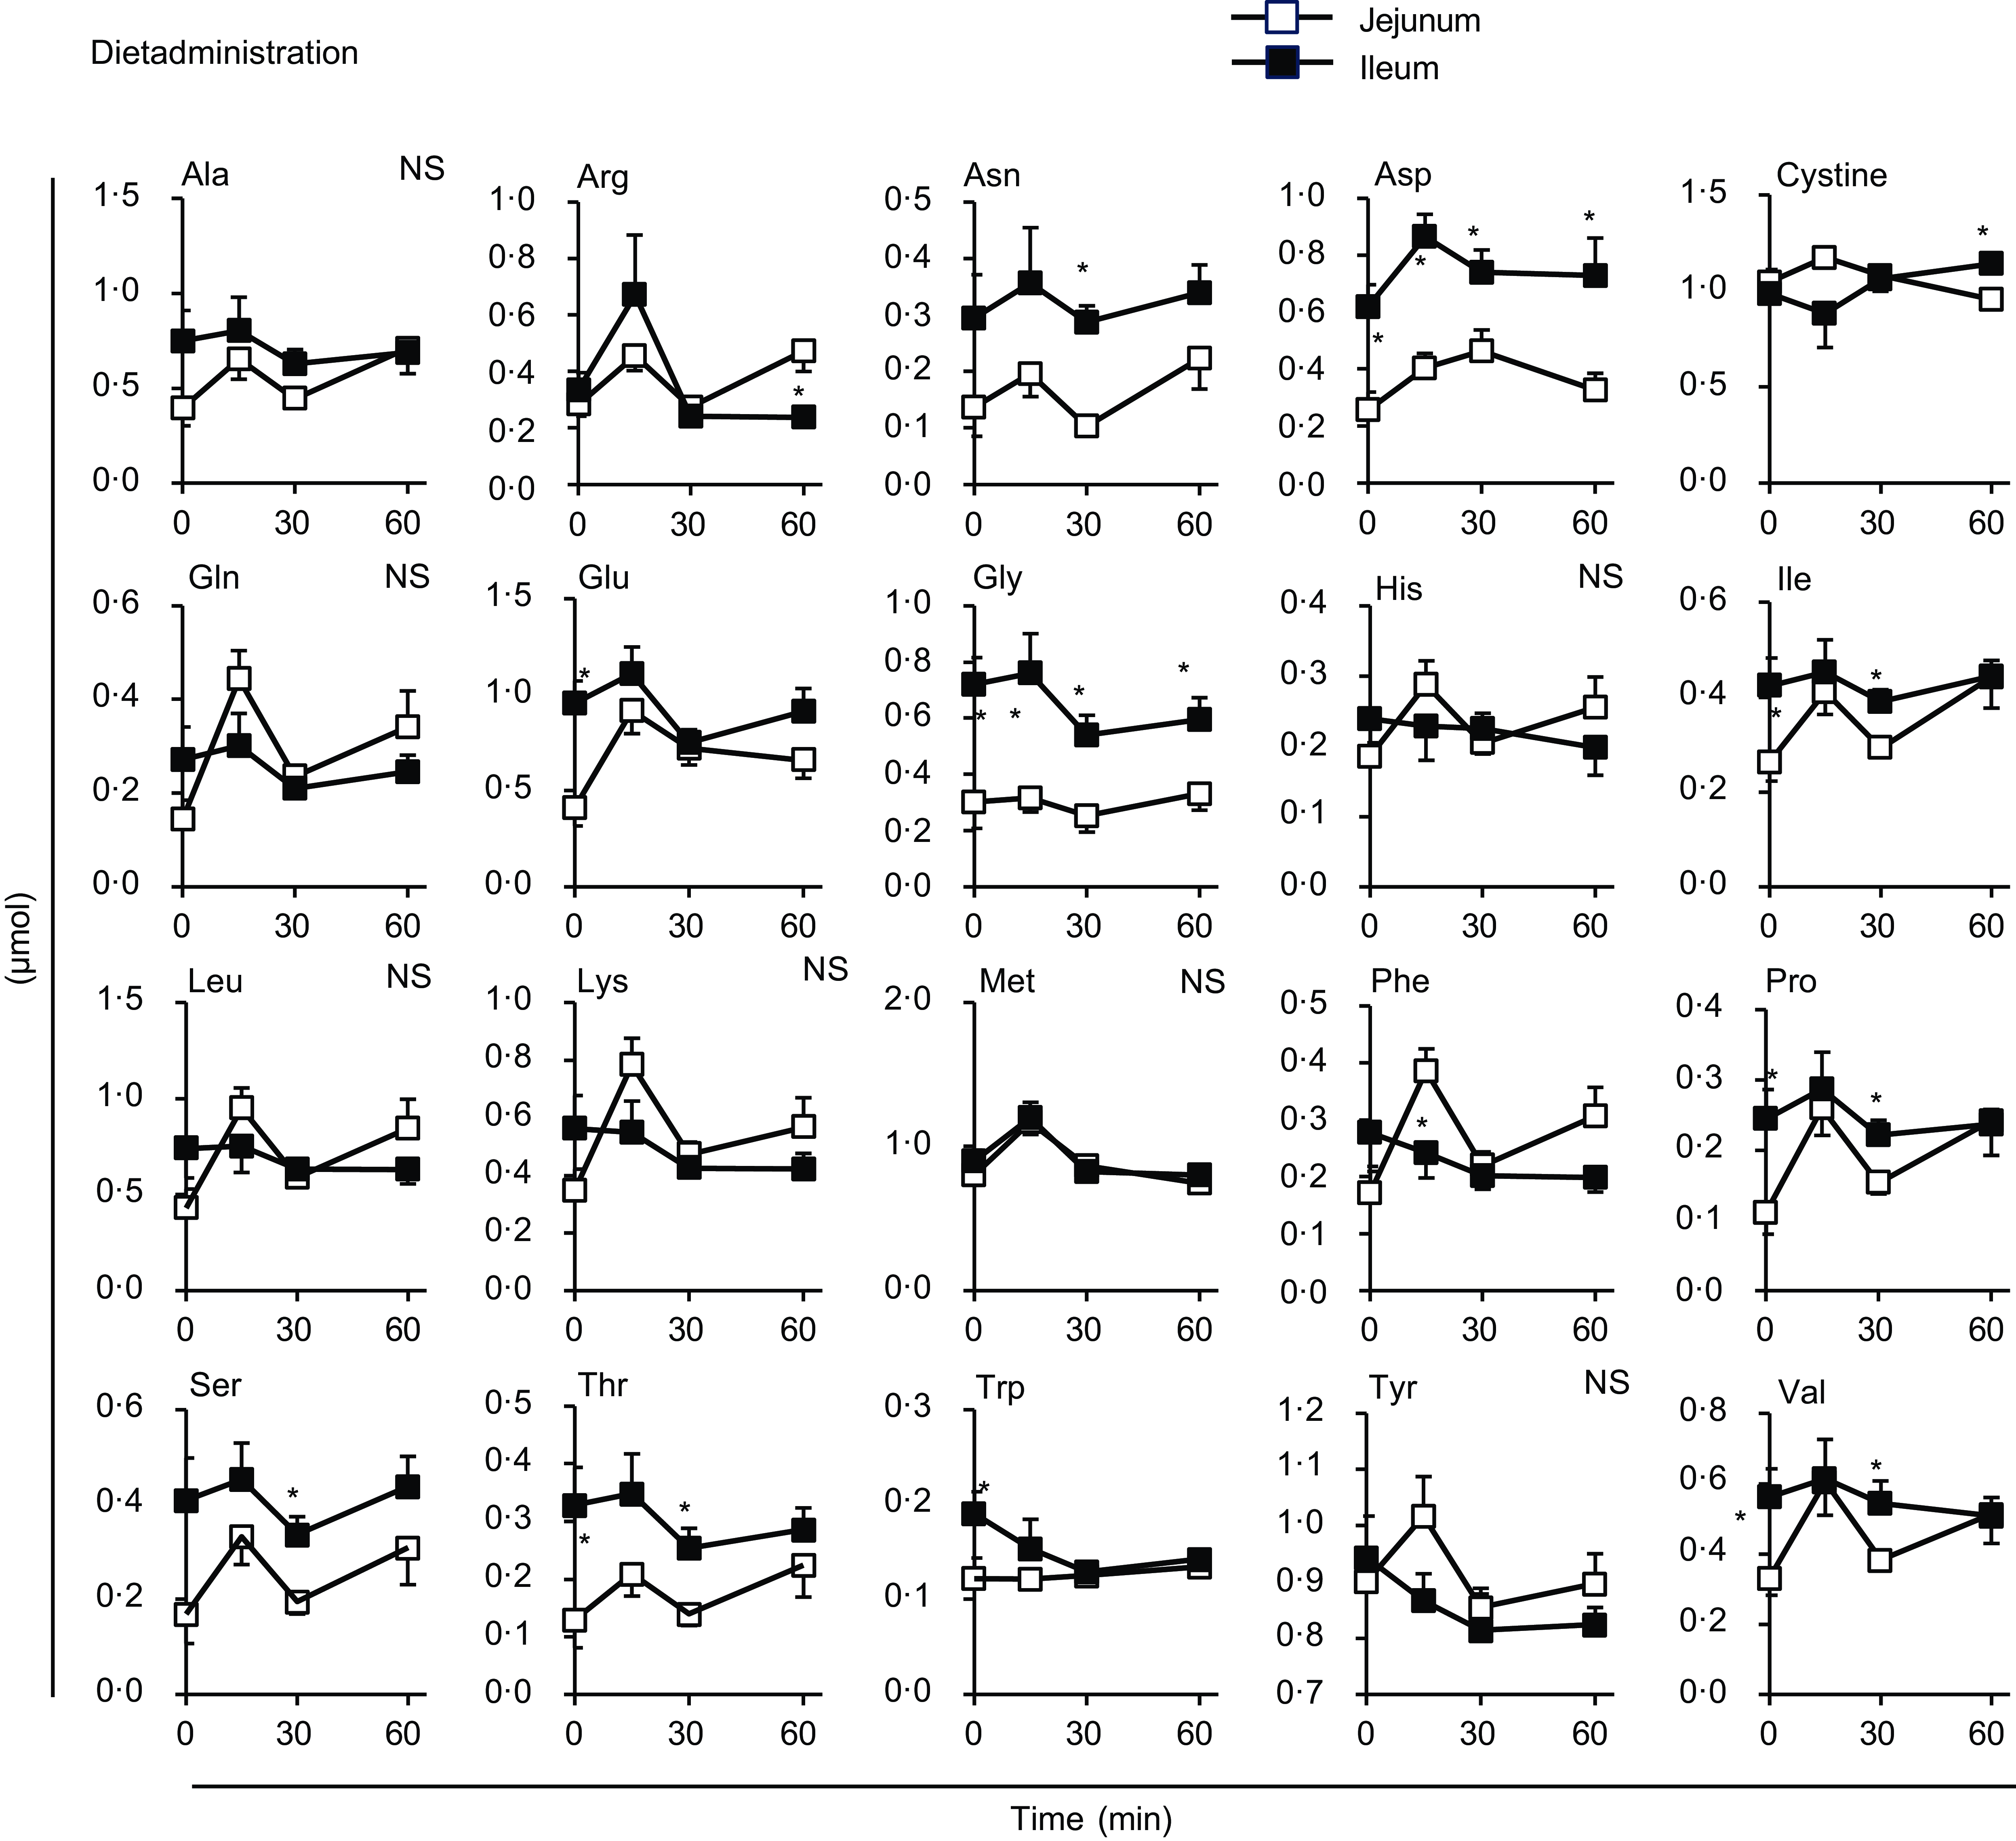
Individual amino acid concentrations in the lumen of the small intestine after oral administration of the diet. The diet suspension was orally administered to awake rats. Luminal contents were collected from the proximal (jejunum) and distal (ileum) halves of the small intestine. Values are expressed as means (sem) (n 6). Asterisks (*) indicate significant differences between values of the jejunal and ileal samples at the same time point (P< 0·05, Student’s t test), and ‘NS’ indicates no significant differences.
Expt 2 was conducted to directly compare the amino acid transport between the jejunum and ileum. The amino acid mixture was infused into the lumen of the jejunal or ileal loops of the anaesthetised rats. Because the empty lumen does not contribute to amino acid absorption, blood samples were collected from the portal vein rather than from the jejunal or ileal mesenteric veins.
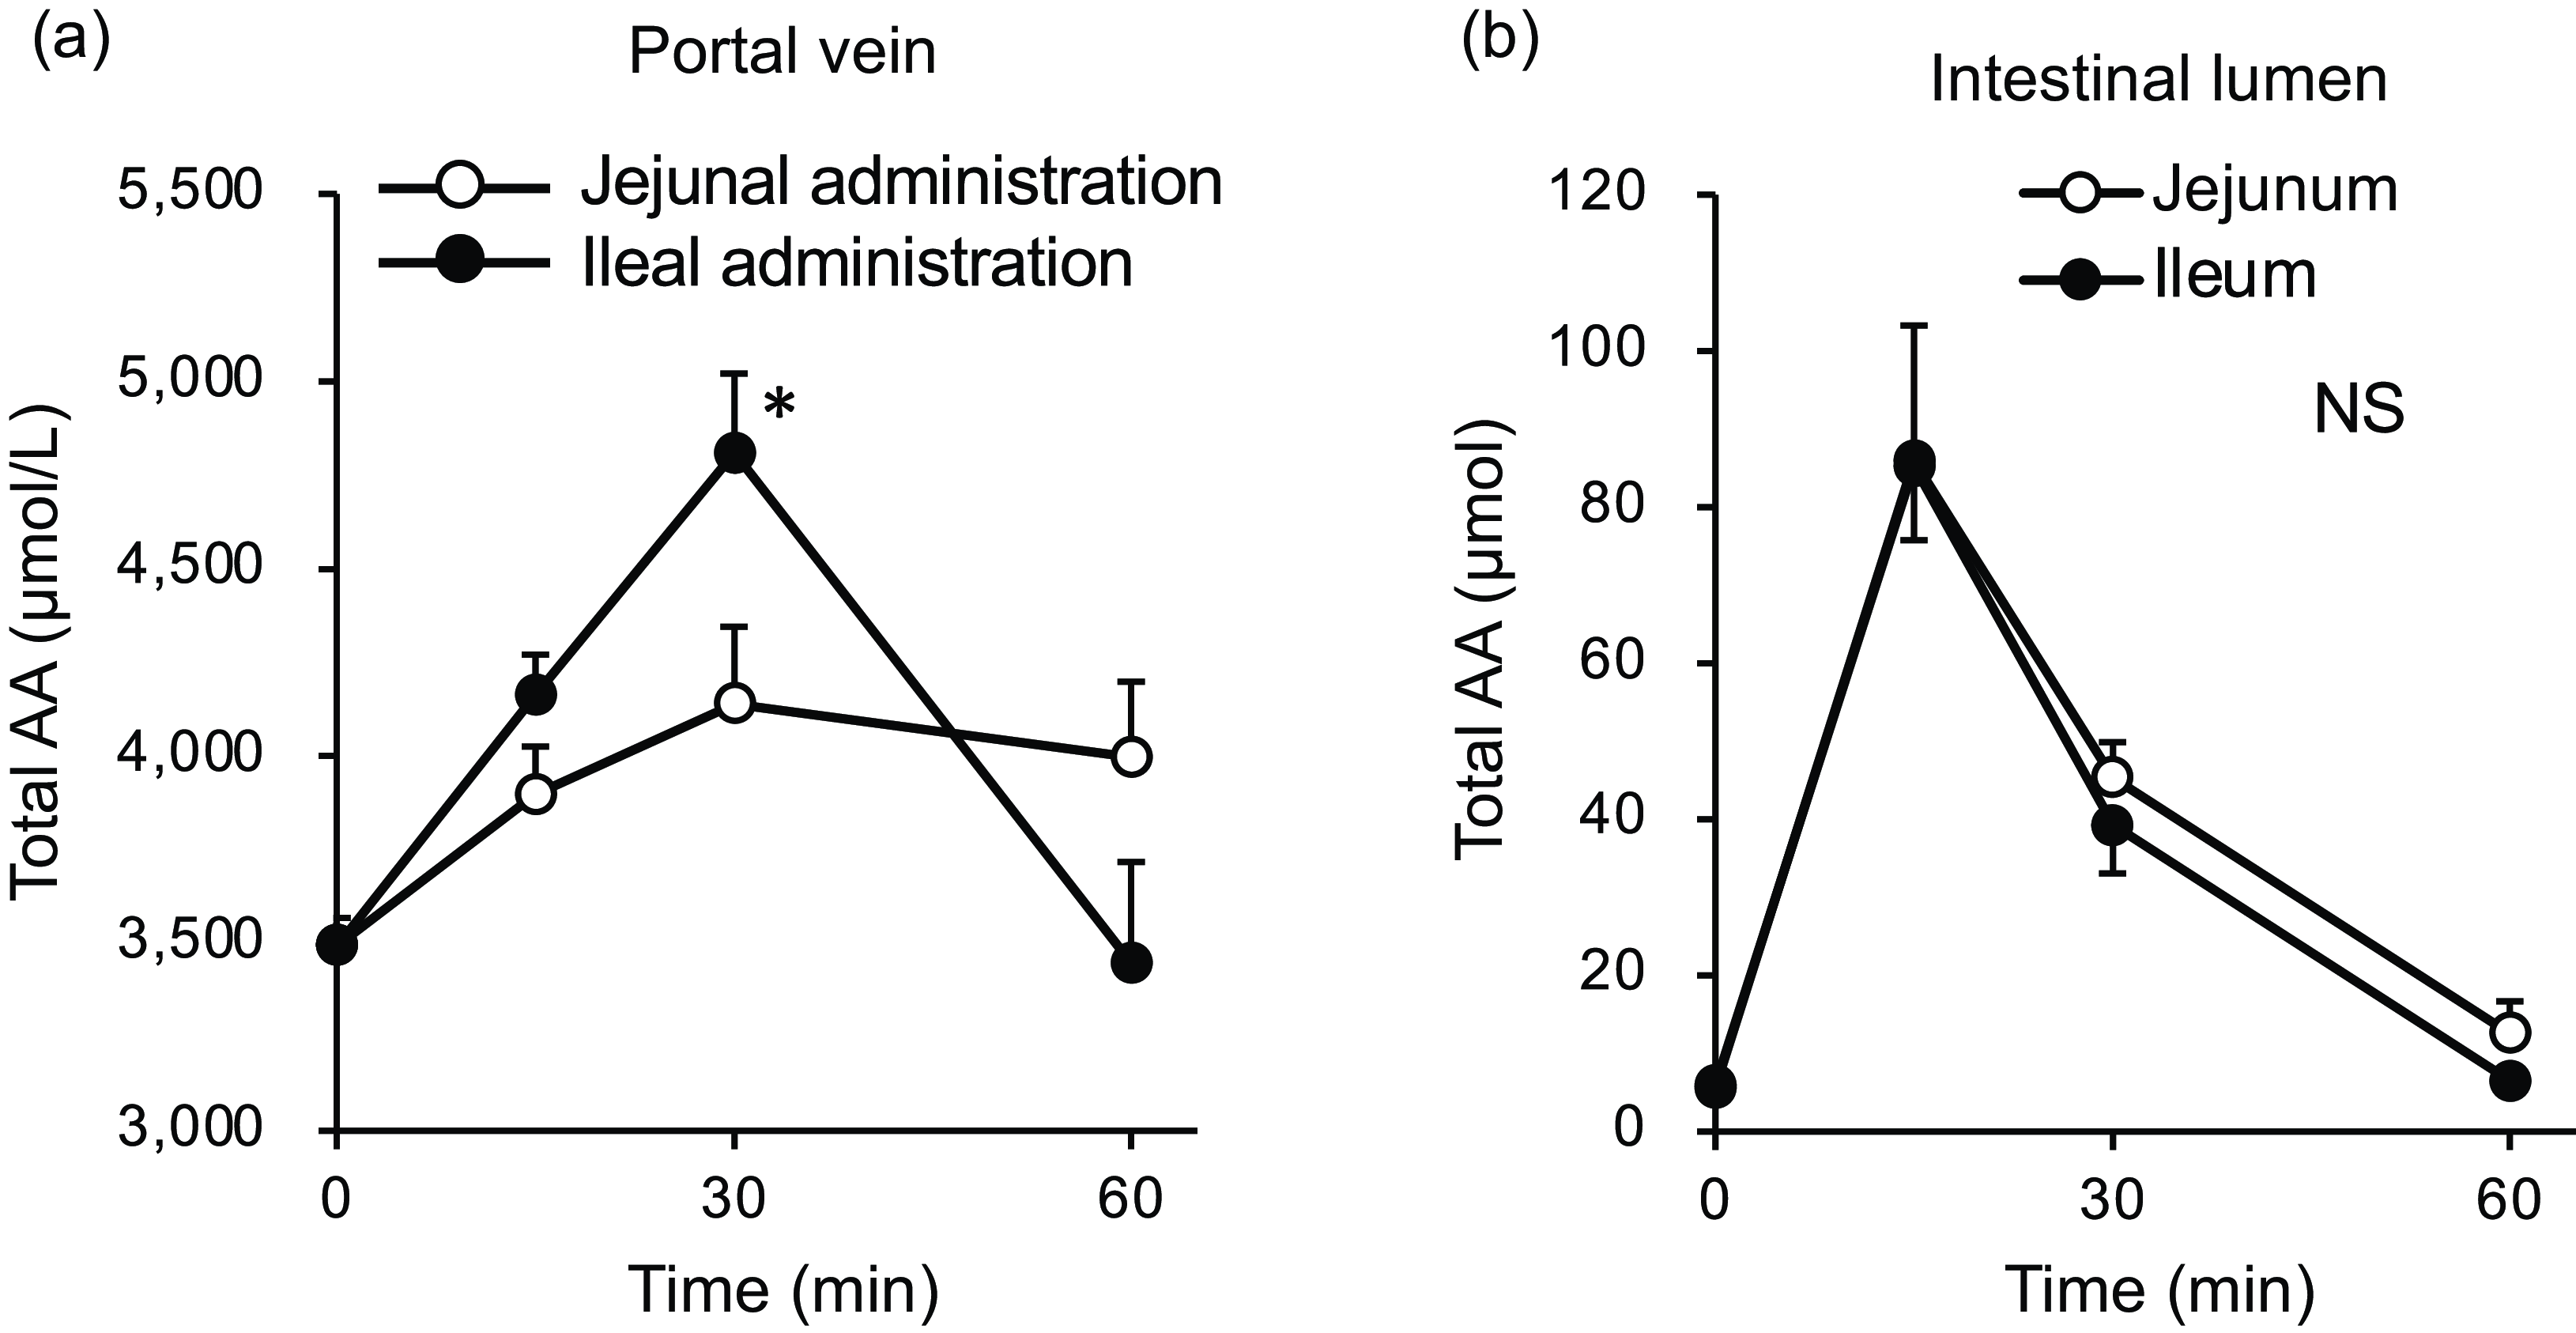
The total amino acid concentration in the portal vein peaked at 30 min in both groups (Fig. 7(a)); at this time point, the concentration in the ileal administration group was significantly higher than that in the jejunal administration group. Subsequently, in the ileal administration group, the total amino acid concentration returned to baseline after 60 min, whereas in the jejunal administration group, it remained elevated until 60 min. The total amino acid content in both the jejunal and ileal lumens peaked at 15 min and then gradually returned to baseline levels by 60 min, with no difference between the two regions (Fig. 7(b)).
Total amino acid concentrations in the portal vein and small intestinal lumen after administration of the amino acid mixture into the jejunal or ileal lumen. The amino acid mixture was administered to the jejunal or ileal lumen of anaesthetised rats. Blood samples (a) were collected from the portal vein 15, 30 and 60 min after administration. Subsequently, luminal contents (b) were collected from the proximal half (jejunum) and distal half (ileum) of the small intestine. Values are expressed as means (sem) (n 6). Asterisks (*) indicate significant differences between values of the jejunal and ileal administration groups at the same time point (P< 0·05, Student’s t test), and ‘NS’ indicates no significant differences.
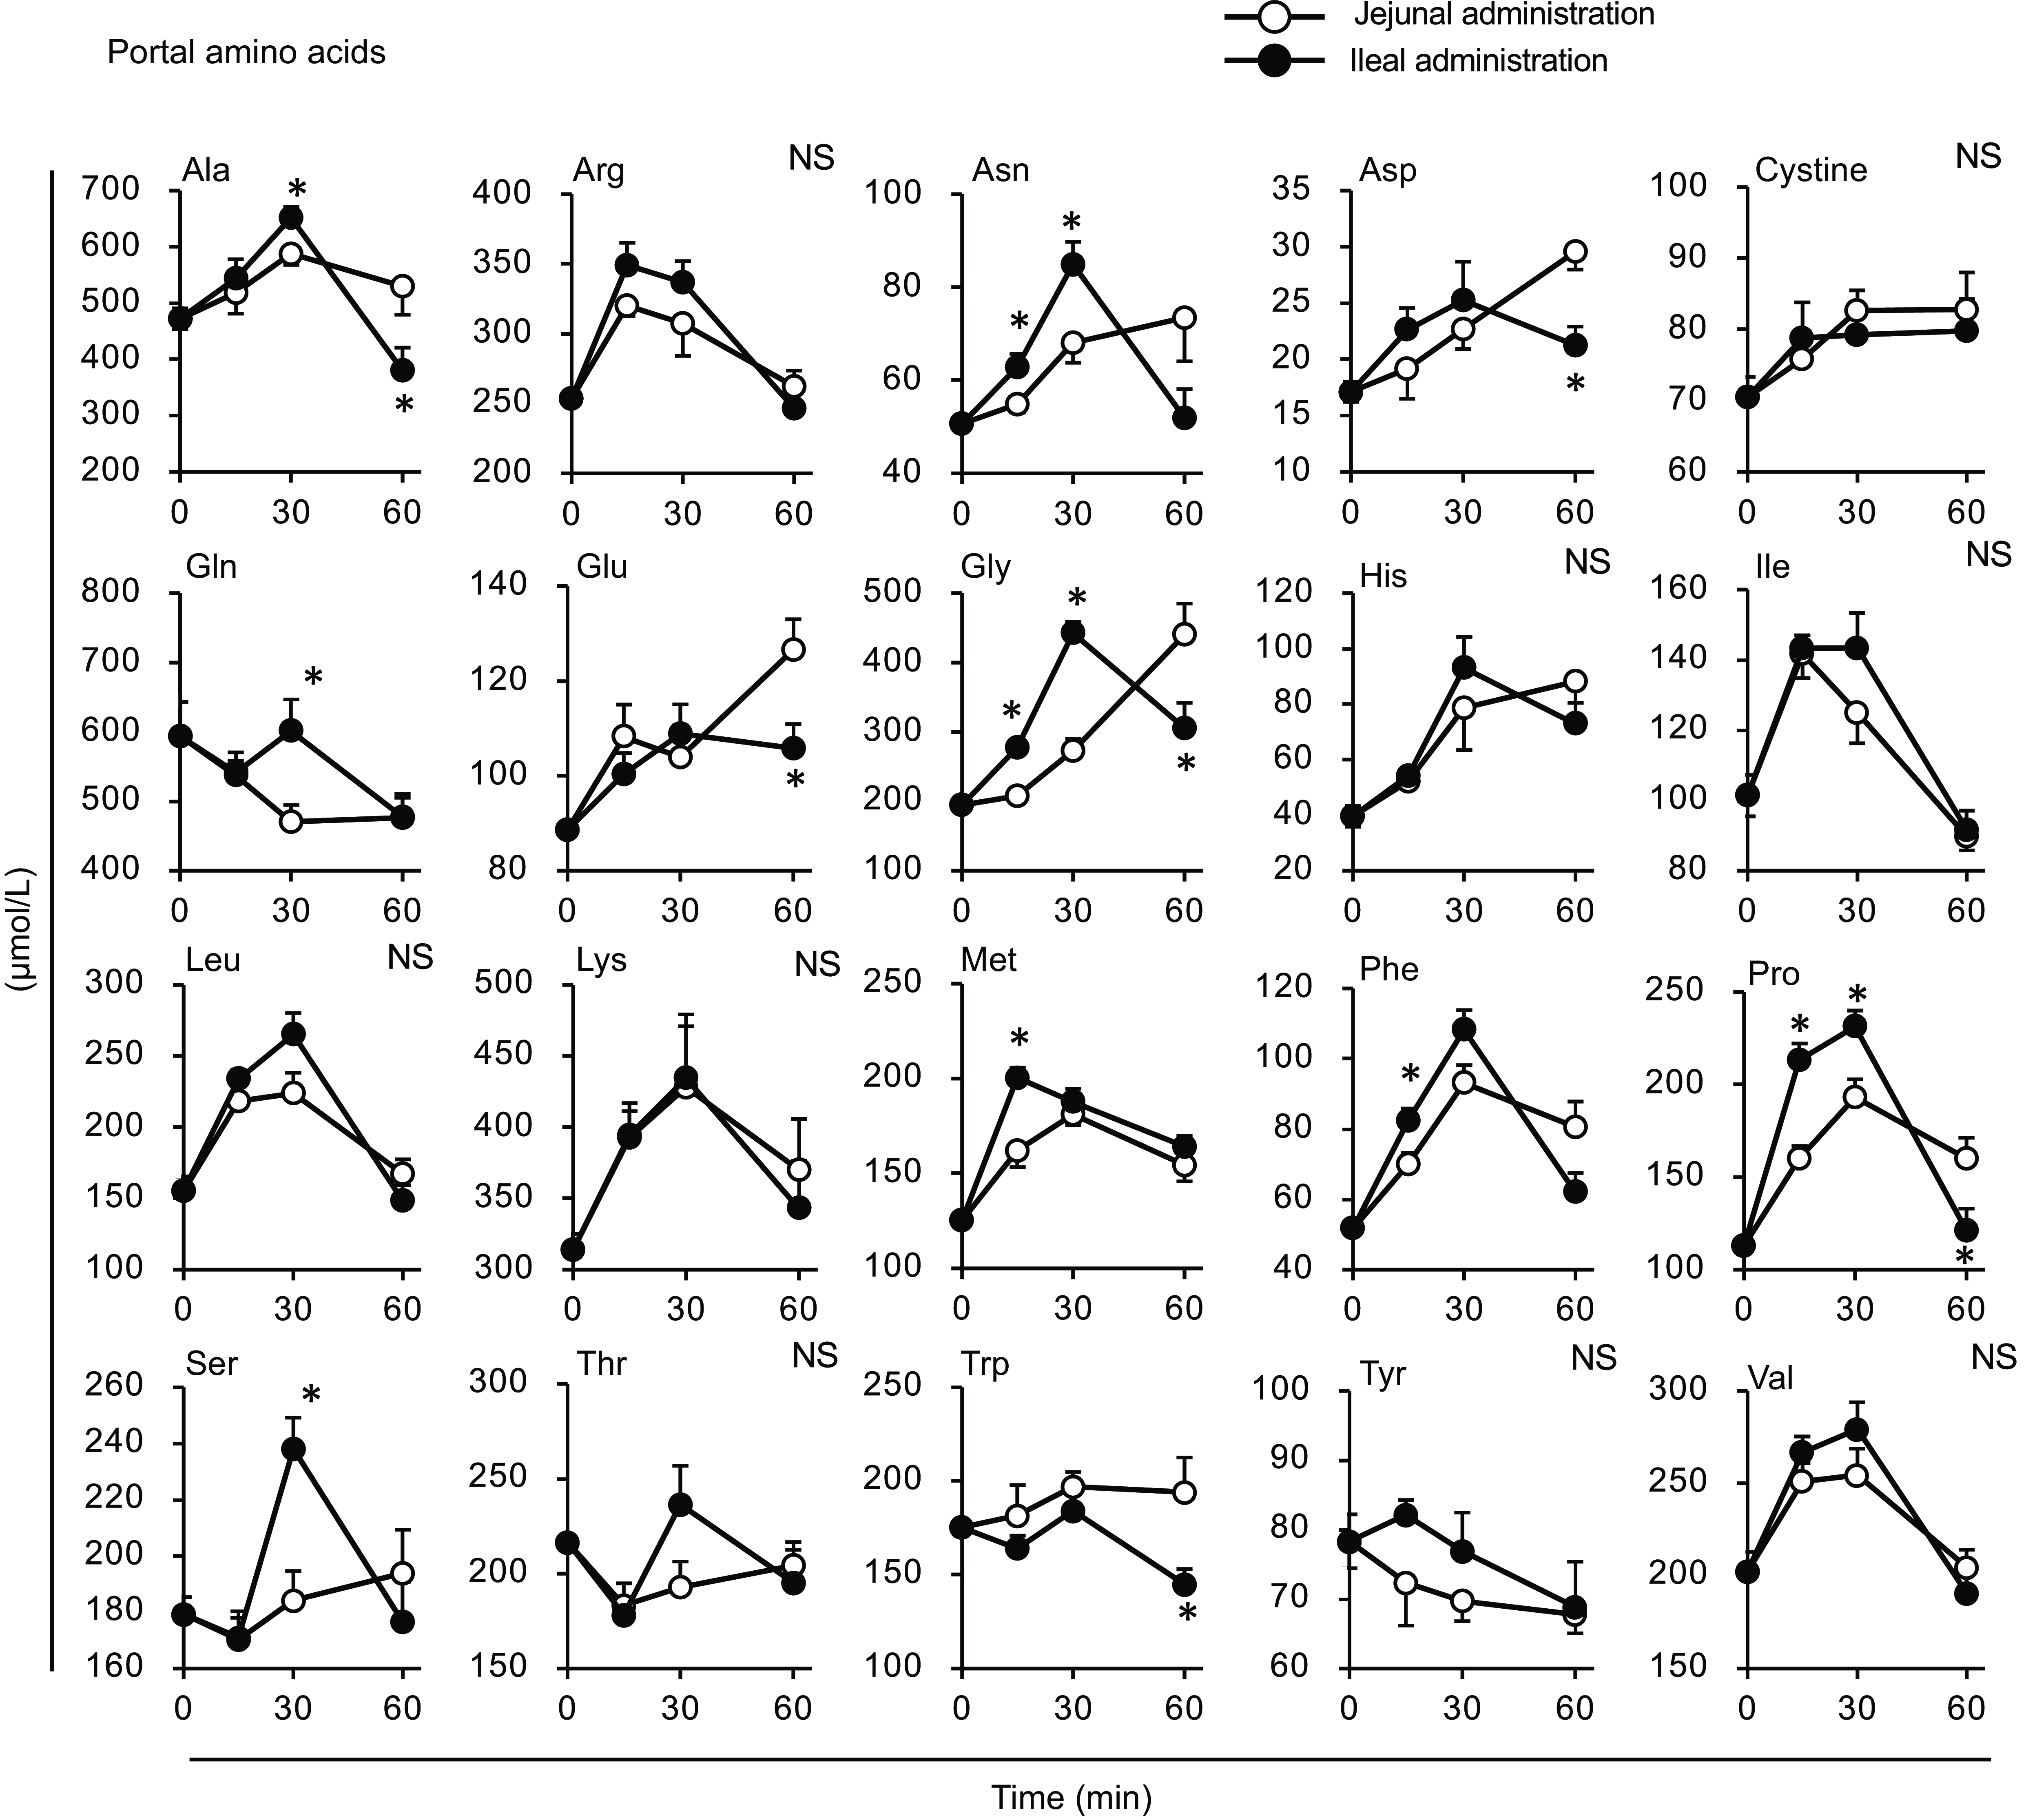
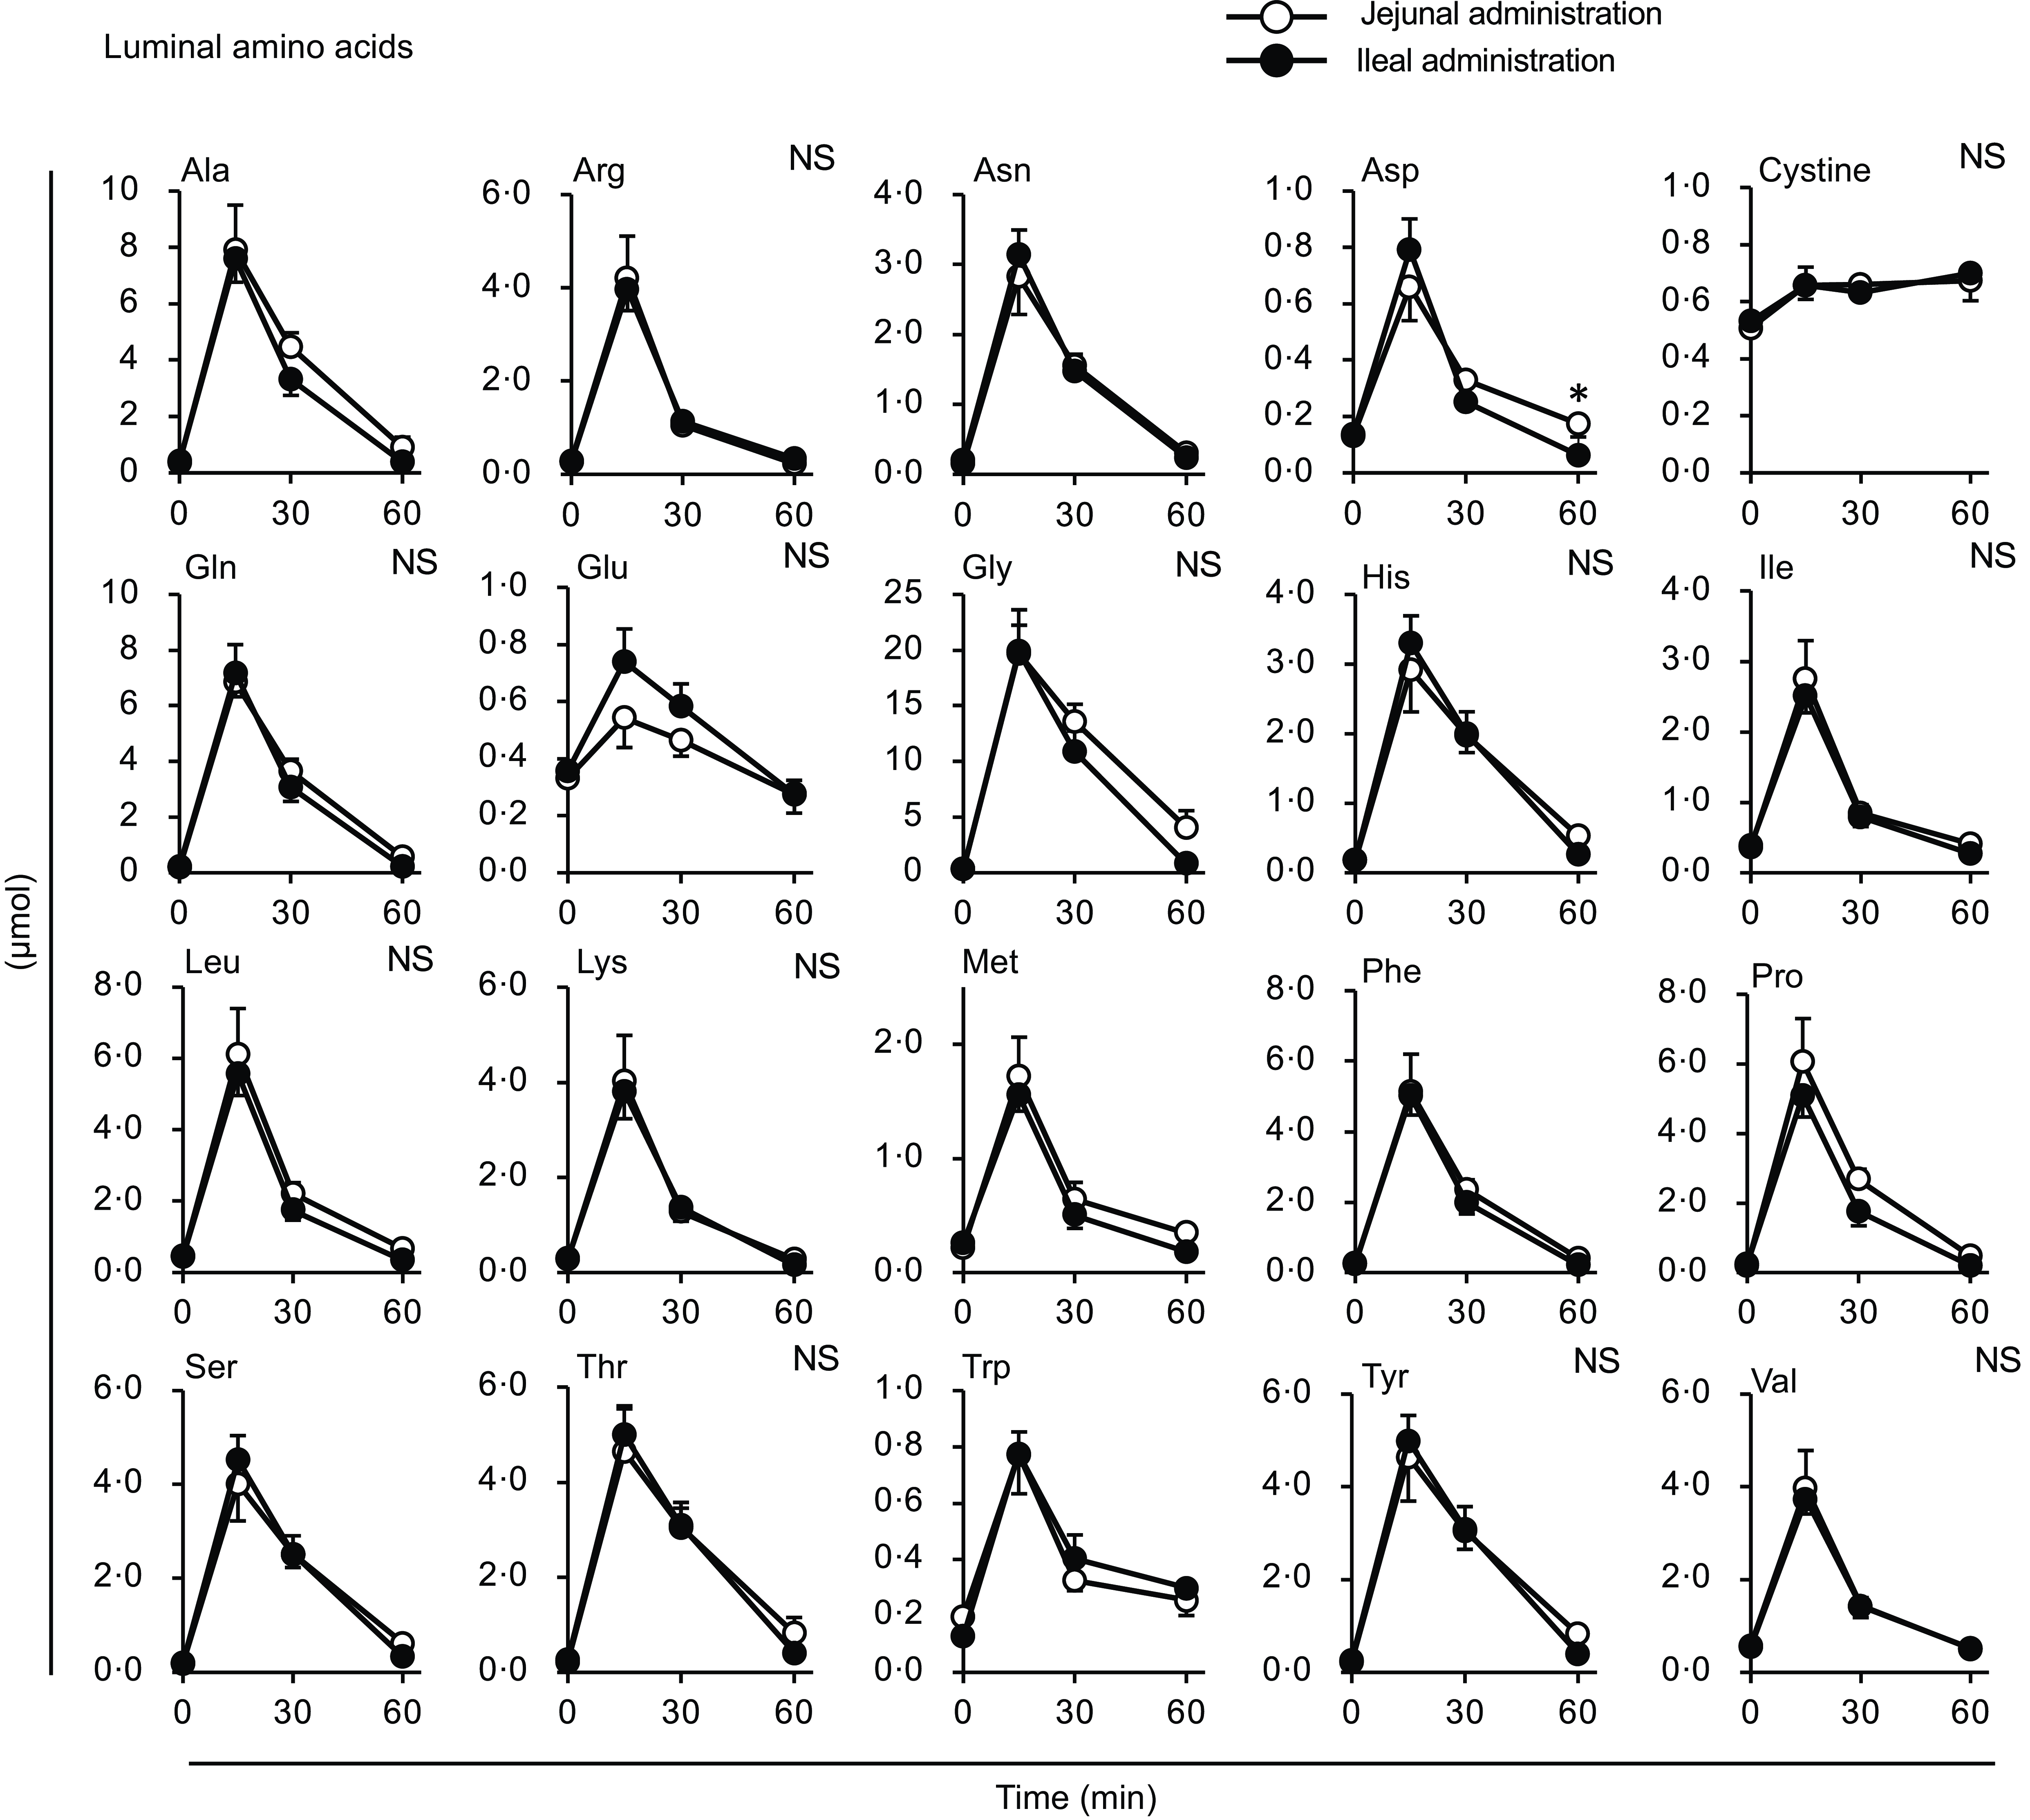
Most amino acid levels were higher in the portal vein of the ileal administration group (although not necessarily statistically significant) than those in the jejunal administration group (Fig. 8). The Ala, Arg, asparagine (Asn), Gln, Gly, Phe, Pro and Ser levels in the ileal administration group were significantly higher than those in the jejunal administration group at 15 and 30 min. Almost all amino acids showed a similar profile to the total amino acid amount in the intestinal lumen, except for cystine, which showed a slight increment (∼0·2 µmol) with no difference between the jejunum and ileum (Fig. 9).
Individual amino acid concentrations in the portal vein after administration of the amino acid mixture into the jejunal or ileal lumen. The amino acid mixture was administered to the jejunal or ileal lumen of anaesthetised rats. Blood samples were collected from the portal vein 15, 30 and 60 min after administration. Values are expressed as means (sem) (n 6). Asterisks (*) indicate significant differences between values of the jejunal and ileal administration groups at the same time point (P< 0·05, Student’s t test), and ‘NS’ indicates no significant differences.
Individual amino acid concentrations in the small intestinal lumen after administration of the amino acid mixture into the jejunal or ileal lumen. The amino acid mixture was administered to the jejunal or ileal lumen of anaesthetised rats. Luminal contents (b) were collected from the proximal (jejunum) and distal (ileum) halves of the small intestine 15, 30 and 60 min after administration. Values are expressed as means (sem) (n 6). Asterisks (*) indicate significant differences between values of the jejunal and ileal administration groups at the same time point (P< 0·05, Student’s t test), and ‘NS’ indicates no significant differences.
Discussion
To clarify the possible differences in postprandial amino acid transport between the jejunum and ileum, we monitored plasma amino acid responses in the jejunal and ileal mesenteric veins after oral administration in the first experiment. Subsequently, the amino acid responses in the portal vein were monitored after the amino acid mixture was directly administered into the jejunal or ileal lumen in the second experiment. The luminal amino acid levels in the jejunum and ileum were measured to estimate the amount of amino acids absorbed orally or luminally. In Expt 1, the amino acid concentrations in the jejunal mesenteric vein were slightly higher than those in the ileal mesenteric vein after oral administration of the amino acid mixture. However, in Expt 2, portal amino acid concentrations were elevated to a greater extent after injection into the ileal lumen than into the jejunal lumen. These results for the first time demonstrate the regional differences in in vivo amino acid transport dynamics.
It was not surprising that the amino acid mixture administration induced a much larger elevation in total plasma amino acid concentrations in the portal, jejunal and ileal mesenteric veins than the diet administration (Fig. 2(a) and (c)). This is because the diet containing protein (casein) needs to be digested in the gastrointestinal tract. The luminal amino acid content in the jejunum was higher than that in the ileum (Fig. 2(b)), suggesting that the orally administered amino acids predominantly remained in the jejunum and partially reached the ileum within 15 min. Free amino acids appeared to be rapidly transported to the mesenteric veins through the intestinal epithelium, as evidenced by the peak plasma amino acid concentrations observed at 15 min. The lower amounts of luminal amino acids in the ileum after the amino acid administration suggest that most amino acids are absorbed by the jejunum before reaching the ileum. However, the slightly, but not significantly, lower increase in plasma amino acid concentrations in the ileal mesenteric vein than in the jejunal mesenteric vein (Fig. 2(a)) suggested that the ileum actively transports luminal amino acids to the basolateral side. These results led us to compare amino acid transport between the jejunum and ileum in the second experiment employing direct administration of amino acids respectively into these regions. The relatively small or absence of an increase in free amino acids in the jejunal/ileal lumen after diet administration (Fig. 2(d)) may reflect the slow liberation of amino acids from ingested proteins and the rapid absorption of liberated amino acids.
If all amino acids were transported similarly in both the jejunum and ileum, all amino acids were expected to exhibit similar changes between the jejunum and ileum. Most amino acids exhibited similar changes in both mesenteric veins; however, certain amino acids (Ala, Met and Pro significantly, Arg, Phe and Ser insignificantly) exhibited lower elevations in the ileal mesenteric vein than in the jejunal mesenteric vein. These findings suggest a greater transport of these amino acids through the jejunum than through the ileum, whereas other amino acids are transported comparably through both regions. These results are partially supported by earlier studies using human subjects(Reference Silk, Webb and Lane24) demonstrating faster Ala absorption in the jejunum than ileum, and pig model(Reference Low11) demonstrating rapid absorption of Arg and Met in the jejunum.
Almost no differences were observed in individual amino acid responses between the jejunal and ileal mesenteric veins following oral diet administration, suggesting that most amino acids were transported through the jejunum and ileum similarly after a meal. Gln, Glu and Asp are thought to not enter the portal circulation after a meal because of their predominant metabolism within intestinal epithelial cells(Reference Wu25). However, in this study, although the increases were not substantial, the levels at 15 min post-meal were slightly or significantly higher than those at baseline (Fig. 3: Asp in all veins, Glu in the jejunal vein; Fig. 4: Asp in all veins; P< 0·05, Dunnett’s test). The higher Gln and Glu levels observed in the ileal mesenteric vein (Fig. 4) suggest that ileal epithelial cells may possess a lower capacity or activity for metabolising these amino acids. The doses of Cys and Tyr were the smallest among all the amino acids (Table 1), resulting in rapid absorption; consequently, changes in the amounts of cystine and Tyr in the intestinal lumen appeared to be small (Fig. 5). The reasons for the higher levels of certain amino acids (Asp, Glu, Gly, Ile, Pro, Thr, Trp and Val) in the ileum compared with those in the jejunum in the basal state remain unclear (Fig. 6). However, the differences (0·1–0·5 µmol) were relatively small compared with the increased levels observed after the administration of the amino acid mixture. Therefore, these results may have less, or possibly unexpected, physiological relevance.
In Expt 2 (Fig. 7(a)), the relationship between the jejunum and ileum appeared to be reversed compared with the results observed in Expt 1 (Fig. 2(a)). The total amino acid concentration in the portal vein of the ileal administration group was higher than that of the jejunal administration group (Fig. 7(a)), reflecting the responses of most individual amino acids (Fig. 8). Although the amino acid solution was directly infused into the lumen of the small intestine, the observed peak time (Fig. 7) was later than that observed after oral administration in Expt 1 (Fig. 2). This may be attributed to the lower dose of amino acids used (one-fourth of that used in Expt 1).
The amount of luminal free amino acids (Figs. 7(b) and 9) after administration of the amino acid mixture reflected the amount of amino acids remaining in the lumen, independent of digestion. There was no difference in the disappearance of total amino acids from either intestinal lumen (Figs. 7(b) and 9), suggesting that the jejunum and ileum uptook most amino acids in a similar manner and to similar extents when exposed to identical amino acid solutions. In contrast, the appearance of total and certain amino acids (Ala, Asn, Gln, Gly, Met, Phe, Pro and Ser) in the portal vein (Figs. 7 and 8) were higher after ileal administration than after jejunal administration. Although statistically significant differences were not detected, other amino acids exhibited similar trends (except for cystine, Glu, Lys and Trp). These results suggested that the transport activities of most amino acids were higher in the ileum than in the jejunum. This interpretation is consistent with a textbook describing that the absorptive capacity of amino acids is greater in the distal small intestine than in the proximal small intestine(Reference Bhutia, Ganapathy and Said1). In mice, Ile was mostly absorbed in the jejunum, whereas Trp was absorbed in the later segments of the small intestine(Reference Singer, Camargo and Ramadan12). In rats, the mRNA expression levels of most amino acid transporters (twelve out of fifteen apical and ten out of fifteen basolateral transporters) were higher in the ileum than in the jejunum(Reference Chen, Dinges and Green26). In contrast, previous studies have demonstrated higher absorption/transport activity in the jejunum than in the ileum. In humans(Reference Adibi27), Leu and Thr absorption were higher in the jejunum than in the ileum, while in pig models, Arg, Met and Tyr were the most rapidly absorbed amino acids in the jejunum(Reference Low11); additionally, the absorption rates of Asp and Pro were higher in the jejunal than in the ileal tissue(Reference Buddington, Elnif and Puchal-Gardiner28). Thus, the existence of regionally specific properties for handling individual amino acids (transport and metabolism) remains controversial.
One limitation of the present study is that the appearance of amino acids in the portal and mesenteric veins was not exclusively limited to those absorbed from the lumen. Certain amino acids, such as Gln, Glu and Asp, are metabolised as fuel and/or converted to other amino acids in epithelial cells(Reference Wu25,Reference Nakamura, Kawamata and Kuwahara29,Reference Nakamura, Kawamata and Kuwahara30) . The observed changes in plasma amino acids in these venous systems result from the absorption, breakdown and synthesis of amino acids. Therefore, differences in transport to the mesenteric and portal veins could include differences in the metabolic activity in the intestinal tissue. For instance, glutaminase, which breaks down Gln, has been reported to have higher activity in the jejunum than in the ileum of rats(Reference James, Lunn and Elia31). This may have contributed to the transient increase in the portal Gln levels observed after ileal administration (Fig. 8). The metabolic activities of other amino acids may be lower in the ileum than in the jejunum. The jejunal tissue has a more developed structure than the ileum, as it has thicker tissue, longer villi and a larger luminal surface area. Consequently, compared with the ileum, jejunal tissue likely utilise more amino acids for energy substrates and/or protein synthesis. The use of stable isotope-labelled amino acids is essential for accurately investigating individual amino acid metabolism in gastrointestinal tissues(Reference Buddington, Elnif and Puchal-Gardiner28,Reference Nakamura, Kawamata and Kuwahara29) . Future studies employing such techniques may lead to discoveries focusing on the regional differences in individual amino acid metabolism between the jejunum and ileum.
In conclusion, monitoring proteogenic amino acid dynamics in the jejunal and ileal mesenteric veins of rats demonstrated that amino acids are mainly absorbed and transported in the proximal small intestine after meals, owing to their regional advantages. However, direct administration of an amino acid mixture into the jejunum or ileum revealed that the ileum had a higher capacity for transporting amino acids than the jejunum. These findings highlight the importance of the ileum in postprandial amino acid absorption and metabolism.
Acknowledgements
None.
This work was supported by JSPS KAKENHI grant no. 18K19158.
K. K. carried out the study, analysed the data and interpreted the findings. T. H. formulated the research questions, designed the study, carried out the study, analysed the data, interpreted the findings and wrote the article.
All the authors declare none.


