Hypertension is a major cause of CVD and overall mortality( Reference Lewington, Clarke and Qizilbash 1 ). High dietary Na intake is a major risk factor for hypertension( Reference He, Li and MacGregor 2 , Reference He and MacGregor 3 ) estimated to be responsible for one in ten deaths from CVD events( Reference Mozaffarian, Fahimi and Singh 4 ). In 2010, the estimated mean global Na consumption was 3·95 g/d, with regional mean levels ranging from 2·18 to 5·51 g/d, exceeding the reference intake of 2·0 g Na/d( Reference Mozaffarian, Fahimi and Singh 4 , 5 ).
One of the main determinants of food intake, and potentially salt, is taste( Reference Sørensen, Møller and Flint 6 ). The ability to perceive a certain taste may be genetically determined( Reference Reed, Tanaka and McDaniel 7 ). More specifically, genetic variation in taste receptors may alter an individual’s taste function( Reference Dias, Rousseau and Duizer 8 ). However, to our knowledge, only one study reports the genetic predisposition to salt taste in humans. SNP in genes coding for ion channels, the epithelial Na channel (ENaC, SCNN1B) rs239345 and the transient receptor potential cation subfamily V member 1 channel (TRPV1) rs8065080, modified the salt taste perception in ninety-five white young adults( Reference Dias, Rousseau and Duizer 8 ). The effect of these genetic variants on actual Na intake has not been investigated and the results warrant further investigation. In addition, a link between salt taste perception and blood pressure (BP) is suggested. A number of studies reported that individuals with lower ability to taste salt (i.e. reduced salt taste sensitivity) exhibited higher BP compared with individuals with enhanced ability to perceive salty taste. This was observed both in adults and in children and across different populations( Reference Okoro, Uroghide and Jolayemi 9 – Reference Kirsten and Wagner 12 ). Moreover, research suggests an association between salt taste sensitivity and salt intake, albeit inconclusive( Reference Azinge, Sofola and Silva 13 , Reference Piovesana, Sampaio and Gallani 14 ). Considering the above with the notion that high salt intake is a major risk factor for raised BP( Reference He, Li and MacGregor 2 , Reference He and MacGregor 3 ), it can be hypothesised that reduced salt taste sensitivity would result in higher dietary salt intake and consequently in higher BP.
Furthermore, the mechanisms behind the possible link between salt taste perception and salt intake are unclear and confounded by other metabolic and physiological aspects of salt metabolism. The main confounder is salt sensitivity which is defined as an increase in BP in response to a high dietary salt intake( Reference Sullivan 15 ). Considering that some individuals do not exhibit such increase, the distinction is made between salt-sensitive and salt-resistant populations( Reference Weinberger 16 ). Salt sensitivity displays a strong heritable component and the genes involved in Na transport across the cell membrane have shown a strong effect on salt-sensitive changes in BP( Reference Hunt, Xin and Wu 17 , Reference Yang, He and Gu 18 ). Specifically, rs7571842 and rs10177833 in the SLC4A5 gene, coding for electrogenic sodium bicarbonate cotransporter 2, have been associated with salt sensitivity in Caucasian hypertensive and normotensive populations( Reference Carey, Schoeffel and Gildea 19 ). In addition to salt taste perception, the TRPV1 gene has been associated with salt sensitivity in animals( Reference Wang and Wang 20 , Reference Hao, Chen and Luo 21 ). Wang & Wang( Reference Wang and Wang 20 ) have reported that in Dahl salt-sensitive rats on a high-salt diet, TRPV1 expression and function are impaired rendering these rats sensitive to salt load in terms of BP regulation. Furthermore, the TRPV1 rs8065080 is a missense SNP resulting in amino acid change at position 585, from isoleucine to valine, potentially affecting protein function( Reference Ng and Henikoff 22 ). Cantero-Recasens et al.( Reference Cantero-Recasens, Gonzalez and Fandos 23 ) have tested its functional effect by expressing it in HeLa cells and showed a decreased channel activity in response to two typical TRPV1 stimuli, heat and capsaicin, in TRPV1-Val-585 cells compared with TRPV1-Ile-585. The loss of function effect of the rs8065080, together with reduced expression and activity of the TRPV1 reported in salt-sensitive animals, suggests this variant may also be involved in salt sensitivity in humans. Finally, several common variants of the ENaC SCNN1B gene, including the rs239345, have been associated with BP or hypertension in different populations( Reference Hannila-Handelberg, Kontula and Tikkanen 24 , Reference Jin, Hong and Lim 25 ).
Recent research in animals suggests an association between salt taste perception and salt-sensitive hypertension mediated by the renin–angiotensin aldosterone system (RAAS) dysfunction( Reference Sakamoto, Fujii and Saito 26 ). To the best of our knowledge, there are no studies in humans confirming this association. In addition, there are no studies comprehensively exploring the link between salt sensitivity of BP, salt taste perception and intake. Furthermore, salt sensitivity is present in 51 % of hypertensive and 26 % of normotensive populations and it is an independent cardiovascular and mortality risk factor( Reference Weinberger, Miller and Luft 27 , Reference Weinberger, Fineberg and Fineberg 28 ). Since reduction in salt intake may lead to significant reductions in BP in susceptible individuals( Reference Lewington, Clarke and Qizilbash 1 , Reference He, Li and MacGregor 2 ), detecting salt sensitivity in young and healthy individuals may result in more successful prevention of hypertension and consequently CVD( Reference Iatrino, Manunta and Zagato 29 ).
Considering the potential link between salt sensitivity, salt taste perception and dietary salt intake together with the underlying genetic basis, the aim of this study was to explore the genetic predisposition to salt sensitivity, expressed as the BP response to Na loading, in a healthy adult population and its effects on salt taste perception and dietary salt intake.
Methods
Subjects
The subjects were predominantly young Caucasians, eight males and twelve females. Subjects were recruited through advertisements, Internet postings and the institutional centre for workplace and community health. Eligibility criteria were clearly stated. More specifically, subjects were excluded with current stage-2 hypertension (systolic blood pressure (SBP) ≥160 mmHg and/or diastolic blood pressure (DBP) ≥100 mmHg), current or recent (<1 month before screening visit) use of antihypertensive medications or medications that affect BP. Further, those with secondary hypertension, history of CVD, chronic kidney failure and current diabetes were excluded. Also excluded were individuals with peptic ulcer disease or liver disease requiring treatment during the previous 2 years. In addition, pregnant women, underweight (BMI <18·5 kg/m2) and obese (BMI >30 kg/m2) individuals, individuals exceeding maximal recommended alcohol intake for the UK, those currently adhering to a low-Na diet or with an illness that permanently alters taste were also excluded from the study.
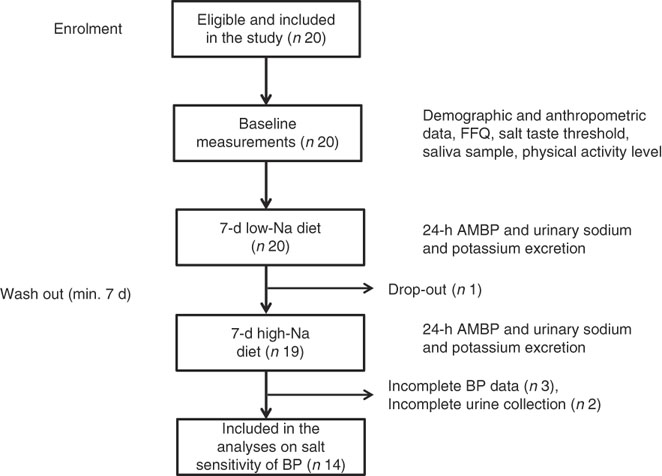
All twenty subjects completed the taste threshold determination test to assess salt taste perception, FFQ and provided a saliva sample. Out of twenty subjects, nineteen completed the low- and high-Na dietary protocols; however, five subjects were excluded due to incomplete 24-h BP or urinary excretion data (Fig. 1).
Overview of the study procedure. ABPM, ambulatory blood pressure monitoring device; BP, blood pressure.

This study was conducted according to the guidelines laid down in the Declaration of Helsinki, and all procedures involving human subjects were approved by the Institutional Ethics Committee. Written informed consent was obtained from each subject before the baseline data collection informing they can withdraw from the study at any point. The study is registered under Research Registry unique identification number: researchregistry1652.
Baseline measurements
Height and baseline BP and weight were measured during the first examination. Subjects were instructed to avoid alcohol, cigarette smoking, coffee/tea and exercise for at least 30 min before their BP measurement. Seated BP was measured with an automated BP monitor (Omron M24/7; Meditech Ltd) using an appropriate size cuff after 5 min of rest. In all, two measurements were performed within 5-min intervals and used for the analysis and calculation of the mean baseline SBP and DBP. In addition, demographic data (age, sex and race) were collected and assessed together with smoking habits and health status information. Physical activity was assessed with the general practice physical activity questionnaire. Participants were considered as active, moderately active, moderately inactive or inactive( 30 ).
Taste thresholds for salt
Identification of taste thresholds for salt (salt taste perception) was determined using the British Standard BS ISO3972:2011 methodology. Salt taste detection and recognition thresholds were determined using eight graded sodium chloride solutions (4, 6, 8, 12, 17, 24, 34 and 49 mmol/l). Solutions were prepared by dissolving food grade sodium chloride in spring water. All solutions were prepared on the day of the testing. Subjects were presented with a sample of each solution by order of increasing concentration starting with the lowest concentration of 4 mmol/l. The procedure was repeated three times. Three additional vessels containing dilutions of the same concentration as the preceding vessel were presented randomly within the sample series. The salt taste detection threshold (STDT) was identified as the lowest concentration of the sample where the subject can consistently perceive an impression but not identify the taste. The salt taste recognition threshold (STRT) was identified as the sample concentration where the subject consistently perceives the taste as salt( 31 ).
Habitual dietary salt intake
Baseline energy and dietary salt intake were assessed using a semi-structured validated FFQ. The questionnaires were analysed using the open source, cross-platform tool FETA( Reference Mulligan, Luben and Bhaniani 32 ) and information on forty-six nutrients, including Na, was obtained. Habitual dietary Na intake was energy adjusted and expressed as mg of Na/4184 kJ (1000 kcal). Information on the frequency of discretionary salt use was also obtained. Subjects recorded the frequency of adding salt while cooking and at the table by choosing one of the following: (1) never, (2) rarely, (3) sometimes, (4) usually and (5) always.
Dietary sodium intervention
Study subjects received a low-Na diet (3 g of salt or 51·3 mmol Na/d) for 7 d, followed by a high-Na diet (18 g of salt or 307·8 mmol Na/d) for an additional 7 d. Minimal wash-out period between the diets was 7 d. The low-Na diet was designed by investigators using the nutritional analysis software (Nutritics; Nutritics Ltd). A total of three meals and two snacks were designed to provide a total of 3 g salt/d and recommended macronutrient intake( 33 ). Total energy intake was determined based on individual requirements of each subject. Subjects were provided with detailed written instructions about the diets and they were also instructed to maintain their coffee, smoking and physical activity levels. The high-Na diet was formulated by supplementing the low-Na diet with additional 256·5 mmol Na/d (15 g salt/d) dispensed by research staff in small paper sachets each containing 1 g salt (NaCl). To monitor subject compliance with the diets, on the last day of each period, 24-h urine was collected for Na, K and creatinine excretion measurements. During the same period, 24-h BP measurements were performed with the 24-h ambulatory blood pressure monitoring device (ABPM).
24-h automated blood pressure monitoring
In all, 24-h ABPM was attached to the upper, non-dominant arm and BP was registered at 30-min intervals during daytime and 60-min intervals at night time. Data from the ABPM were downloaded using BP tracker software and mean SBP and DBP were calculated. Subject data with <30 successful measurements on each occasion were excluded from the analysis for salt sensitivity( Reference O’Brien, Parati and Stergiou 34 ). Pulse pressure (PP) was calculated according to the formula: PP=SBP−DBP and mean arterial pressure (MAP) as: MAP=DBP+1/3 PP. Salt sensitivity was defined as an increase of ≥3 mmHg in MAP when transitioning from the low- to high-Na diet, as suggested by Kurtz et al.( Reference Kurtz, DiCarlo and Pravenec 35 ). The change in BP between the high-Na and low-Na diet (ΔBP) was calculated as: ΔBP=high-Na diet BP−low-Na diet BP.
Biochemical measurements
The 24-h urinary Na and K were analysed using an automated clinical chemistry analyser (RX Daytona; Randox), with intra-assay CV <6 %. Estimated salt intake was calculated using the equation 17·1 mmol of Na=1 g of salt. Assessment of the completeness of the collection was assessed by measuring creatinine levels from the same urine samples. The following criteria were used: (1) incomplete urine=<0·7 of (mmol urinary creatinine×113)/(21×kg of body weight)( Reference Murakami, Sasaki and Takahashi 36 ) and (2) urinary creatinine <4 mmol/d for women, or <6 mmol/d for men or a 24 h urine collection of <500 ml for either sex and extreme outliers for urinary creatinine (i.e. >3 sd from the mean) considered as unacceptable( Reference Land, Webster and Christoforou 37 ). Subjects with incomplete urine collection from any of the dietary intervention periods, based on any of the two criteria, were excluded from the analysis.
SNP determination
Following the extensive literature review, four SNP were selected for genotyping: rs7571842 (A/G) and rs10177833 (A/C) in the SLC4A5 gene, rs239345 (T/A) in the SCNN1B and rs8065080 (T/C) in the TRPV1 gene. These SNP were chosen based on their previously reported associations with BP phenotypes, such as hypertension or salt sensitivity, and salt taste perception. This was combined with prevalence data (minor allele frequencies) for the SNP( Reference Dias, Rousseau and Duizer 8 , Reference Carey, Schoeffel and Gildea 19 , 38 ) (online Supplementary Table S1).
At baseline examination, a 2-ml saliva sample was collected into a collection vial (SalivaGene Collection Module II; Stratec Molecular GmbH). A stabiliser provided by the manufacturer was added to the saliva sample and it was stored at −20°C until DNA was extracted. Genomic DNA was extracted using a commercial kit PSP® SalivaGene 17 DNA Kit 1011 (Stratec Molecular GmbH) in accordance with the manufacturer protocol. Quality and quantity were assessed using Nanodrop (Thermo Fisher Scientific). Genotyping was performed using a predesigned TaqMan® SNP genotyping assays for the SNP: rs7571842, rs10177833, rs239345, rs8065080 and the StepOnePlus thermocycler (Applied Biosystems) with two technical replicates for each sample. The primers and the probes were predesigned by Applied Biosystems with the following codes (C____197439_10, C___1137534_10, C___2387896_30, C__11679656_10). The PCR amplification was performed under the conditions specified by the manufacturer. SNP were accepted when the quality threshold was above 98 %. All SNP had minor allele frequencies higher than or equal to 30 % and these reflected the ones reported in European populations( 38 ) (online Supplementary Table S2).
Statistical analysis
Sample size calculation was based on the 4 mmHg difference in MAP when transitioning from low- to high-Na diet. This difference in BP was observed in other studies investigating salt sensitivity in normotensive populations and with a 24-h ABPM( Reference de la Sierra, Giner and Bragulat 39 , Reference Sharma, Schorr and Cetto 40 ). A sample size of fifteen was calculated using an α of 0·05, power of 80 %, expected large effect size (d=0·8) and a standard deviation of 5 mmHg. This standard deviation was chosen due to lower variability of BP reported in younger and healthy individuals( Reference Sharma, Schorr and Cetto 40 , Reference Mancia 41 ).
All continuous variables are presented as means with their standard errors or median (interquartile range). Categorical variables are presented as absolute (relative) frequencies. Before further statistical analysis, continuous variables were tested for normality with the Shapiro–Wilk test. Differences in baseline characteristics by salt sensitivity status were assessed using an independent-samples t test (with Levene’s test for equality of variance) or Fisher’s exact test. The difference between clinical characteristics of subjects between the low- and high-Na diets was assessed using paired-samples t test. An independent-samples t test (with Levene’s test for equality of variance) or Mann–Whitney U test, as appropriate, was used to test for the difference in salt-sensitive changes in BP and dietary Na intake by genotypes of interest. The model used for the analysis was as follows: major allele homozygote v. heterozygote plus minor allele homozygote. A Cochran–Armitage test of trend was run to determine whether a linear trend exists between the genotypes of interest and the proportion of subjects with low and high STDT and STRT as well as the proportion of subjects in different tertiles of energy-adjusted Na intake. Considering there is no universal cut-off point provided to distinguish between the subjects with low and high salt taste thresholds, a median was used as a cut-off. Subjects with STDT ≤8 mmol/l and STRT ≤12 mmol/l were considered to have low thresholds.
To assess the relationship between salt taste thresholds and salt-sensitive changes in BP and salt taste thresholds and Na intake, Spearman’s correlation analysis was performed. Analyses were performed using the SPSS software package (version 22.0). All tests were two-tailed, with P<0·05 considered statistically significant.
Results
Subject characteristics and compliance with the dietary sodium intervention
A total of twenty subjects completed the baseline examination, taste threshold determination test and FFQ. Of these, fourteen subjects provided complete 24-h ABPM and 24-h urine excretion data and were included in the analysis on salt sensitivity of BP. A total of five subjects were considered salt-sensitive using the criteria of ≥3 mmHg increase in MAP when transitioning from low- to high-Na diet. The study population was normotensive, predominantly white, physically active and non-smoking with a median age of 28 years (Table 1). There was no significant difference in any of the baseline parameters between salt-sensitive and salt-resistant subjects.
Baseline characteristics of study subjects, total sample (n 20) and according to salt sensitivity status (n 14)* (Mean values with their standard errors; absolute and relative frequencies; medians and interquartile ranges)
DBP, diastolic blood pressure; SBP, systolic blood pressure.
*P value for difference between salt-sensitive and salt-resistant subjects (independent-samples t test, Fisher’s exact test).
In addition, there was no difference in BP between the low-Na and high-Na diet periods (Table 2). Urinary Na excretion results demonstrated good compliance with the diet (P<0·0005) whereas K intake remained similar in both diets (P=0·243).
Clinical characteristics of study subjects (n 14) on low- and high-salt diet* (Mean values with their standard errors)
SBP, systolic blood pressure; DBP, diastolic blood pressure; MAP, mean arterial pressure, PP, pulse pressure.
*P values for difference between low- and high-salt diets (paired-samples t test).
Genetic predisposition to salt sensitivity of blood pressure, altered salt taste perception and salt intake
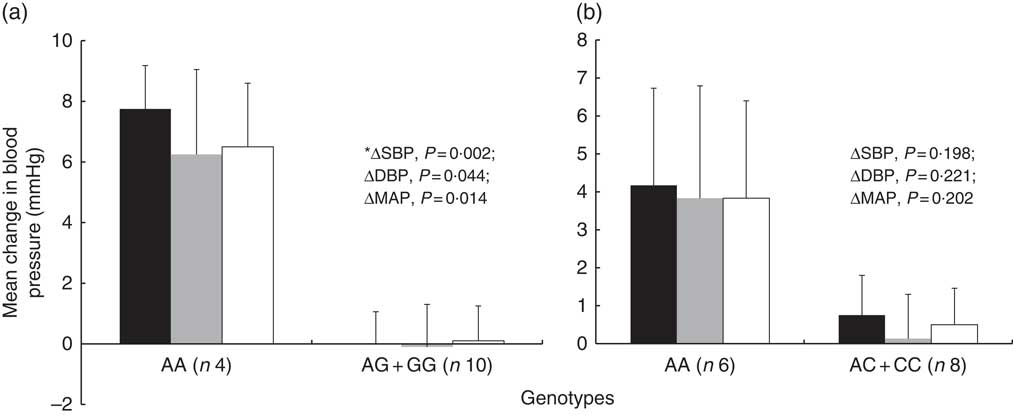
Regarding the genetic predisposition to salt sensitivity, the mean change in BP between the low- and high-Na diet differed according to SLC4A5 rs7571842 genotype (Fig. 2). The subjects with AA genotype had the highest increase in BP (∆SBP=7·75 (sem 1·44) mmHg, P=0·002, d=2·4; ∆DBP=6·25 (sem 2·81) mmHg, P=0·044, d=1·3; ∆MAP=6·5 (sem 2·10) mmHg, P=0·014, d=1·7). SNP rs10177833 (SLC4A5) (Fig. 2), rs239345 (SCNN1B) and rs8065080 (TRPV1) had no statistically significant effects on the BP response to dietary Na manipulation (data not shown). Moreover, the analysis was conducted to test for the possible difference in the prevalence of males and females, BMI and age, between the rs7571842 genotype groups. There was no difference in any of the variables between the AA and AG+GG group (P=1·000, P=0·846 and P=0·584 for sex, BMI and age, respectively).
Systolic blood pressure (SBP), diastolic blood pressure (DBP) and mean arterial pressure (MAP) change from low- to high-salt diet according to SLC4A5 rs7571842 (a) and rs10177833 (b) genotype status (n 14). Analysis conducted on the following model: major allele homozygote v. heterozygote plus minor allele homozygote. Values are means, with their standard errors represented by vertical bars (independent-samples t test, *Mann–Whitney U test). ![]() , Systolic blood pressure;
, Systolic blood pressure; ![]() , diastolic blood pressure;
, diastolic blood pressure; ![]() , mean arterial pressure.
, mean arterial pressure.
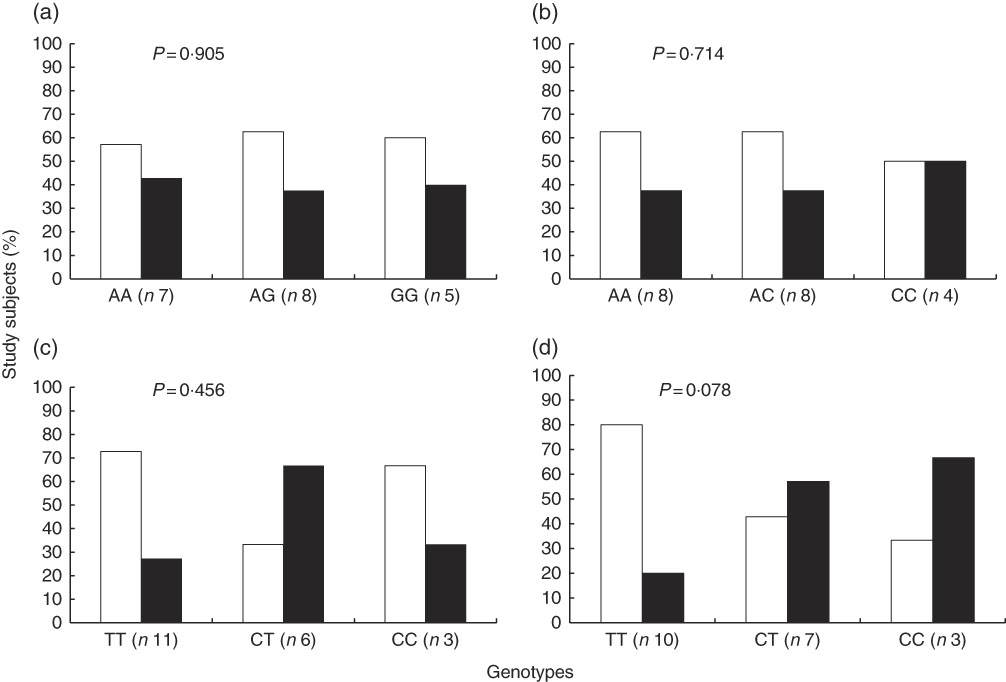
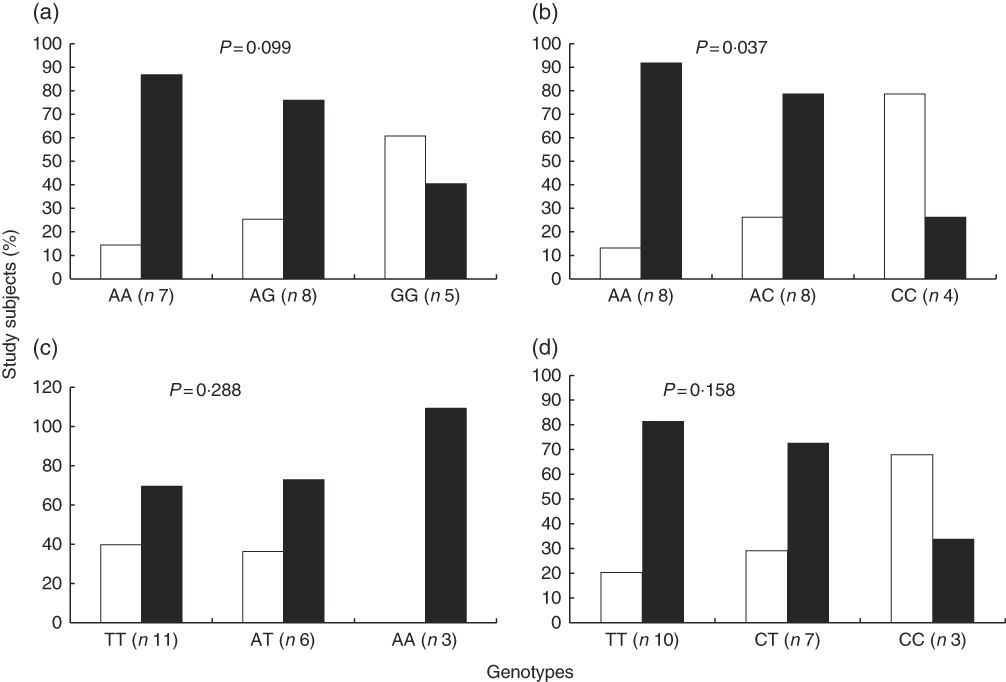
In contrast with the above described, the proportion of study subjects with low and high STRT was similar according to genotypes of interest (Fig. 3). The results of a Cochran–Armitage test of trend between the different genotype groups (homozygous major allele, heterozygous and homozygous minor allele) and the proportion of subjects with low and high STRT were: rs7571842 (P=0·905), rs10177833 (P=0·714), rs239345 (P=0·456), rs8065080 (P=0·078). Similar were observed for STDT (data not shown). However, a linear trend was observed regarding the distribution of subjects in the first or second+third tertiles of energy-adjusted Na intake according to the SLC4A5 rs10177833. With the increasing number of A alleles, Na intake increased (P=0·037, Fig. 4). The mean age and BMI as well as the distribution of sex did not differ between the rs10177833 genotype groups (P=0·129, P=0·551, P=1·000 for age, BMI and sex, respectively).
Proportion of subjects (n 20) with low and high salt taste recognition thresholds according to SLC4A5 rs7571842 (a) and rs10177833 (b), SCNN1B rs239345 (c) and TRPV1 rs8065080 (d) genotype. Low threshold (![]() ) and high threshold (
) and high threshold (![]() ) (Cochran–Armitage test of trend).
) (Cochran–Armitage test of trend).
Proportion of subjects (n 20) in the different tertiles of energy-adjusted sodium intake according to SLC4A5 rs7571842 (a) and rs10177833 (b), SCNN1B rs239345 (c) and TRPV1 rs8065080 (d) genotype. First tertile (![]() , <1241 mg/4184 kJ (1000 kcal)) and second+third tertiles combined (
, <1241 mg/4184 kJ (1000 kcal)) and second+third tertiles combined (![]() , ≥1241 mg/4184 kJ (1000 kcal)) (Cochran–Armitage test of trend).
, ≥1241 mg/4184 kJ (1000 kcal)) (Cochran–Armitage test of trend).
Associations between salt sensitivity of blood pressure, salt taste perception and salt intake
When exploring the associations between the main outcome variables, there was no correlation between the mean change in SBP, DBP and MAP, when transitioning from a low- to high-Na diet, and salt taste thresholds (Table 3). However, a positive moderate correlation was observed between the mean change in PP and STDT (r s 0·551, P=0·041). Sub-group analysis revealed a strong positive correlation between the change in PP and STDT in the SLC4A5 rs7571842 AG+GG group (r s 0·845, P=0·002). Similar was observed for the rs10177833. There was a strong positive correlation between the change in PP and STDT in the AC+CC group (r s 0·781, P=0·022, online Supplementary Table S3).
Correlation analysis between salt taste thresholds (mol/l) and mean change in BP (mmHg) from low- to high-salt diet, and salt taste thresholds (mol/l) and dietary sodium intake (mg sodium/4184 kJ (1000 kcal)) (n 14)*

SBP, systolic blood pressure; DBP, diastolic blood pressure; MAP, mean arterial pressure; PP, pulse pressure; STDT, salt taste detection threshold; STRT, salt taste recognition threshold.
*Spearman's ρ (P value).
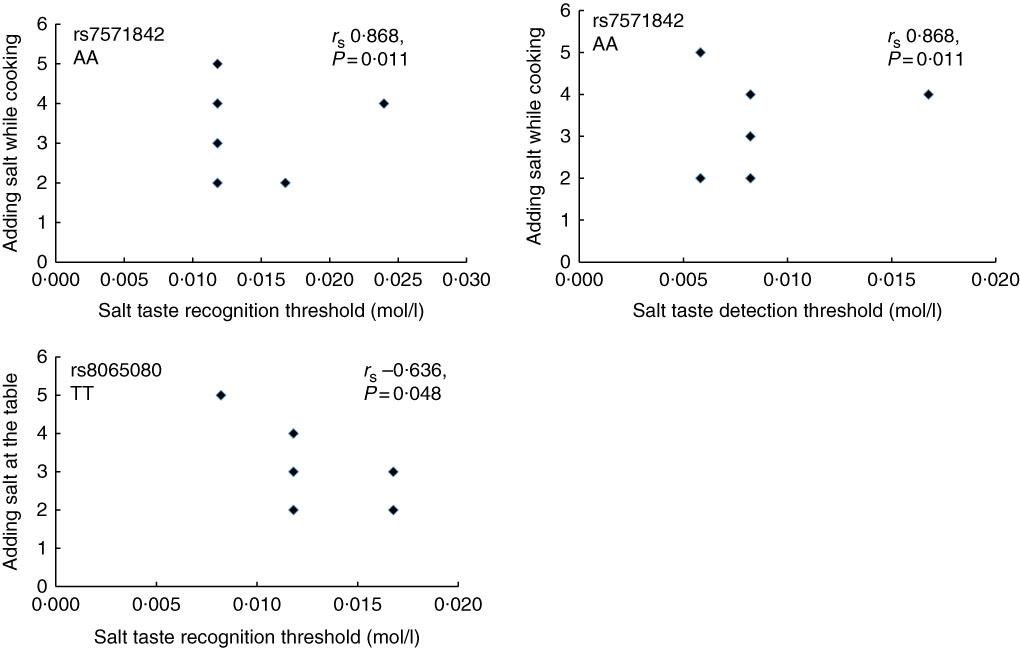
Furthermore, in the total study population, the correlation between the STDT and energy-adjusted Na intake was not significant (r s 0·069, P=0·774). Similar was observed for STRT (r s 0·025, P=0·918). In addition, the correlation between adding salt while cooking and at the table and salt taste thresholds was also investigated. No significant correlation was observed (STDT: r s 0·134, P=0·573 for adding salt at the table and r s 0·342, P=0·140 for adding salt while cooking; STRT: r s 0·083, P=0·727 for adding salt at the table and r s −0·071, P=0·767 for adding salt while cooking, online Supplementary Table S4). However, as shown in Fig. 5, when stratifying according to genotype, in the AA group of the SLC4A5 rs7571842, a strong and positive correlation was observed between adding salt while cooking and both STDT (r s 0·868, P=0·011) and STRT (r s 0·868, P=0·011). In addition, in the TT group of the TRPV1 rs8065080, a moderate and negative correlation was observed between adding salt at the table and STRT (r s −0·636, P=0·048).
Correlation between salt taste thresholds and discretionary salt use according to SLC4A5 rs7571842 (n 6) and TRPV1 rs8065080 (n 10) genotypes. Adding salt while cooking/table; 1 – always, 2 – usually, 3 – sometimes, 4 – rarely, 5 – never (Spearman’s correlation).
Discussion
Genetics of the blood pressure response to sodium loading, salt taste perception and salt intake
Findings from the present study suggest a genetic predisposition to salt sensitivity in the study population. Despite the small sample size, salt-sensitive increase in BP was detected. Moreover, other studies with similar sample sizes, fourteen to sixteen subjects, respectively, have successfully investigated and detected this phenomenon in normotensive populations( Reference Scuteri, Stuehlinger and Cooke 42 – Reference Nichols, Elijovich and Laffer 44 ). Finally, urinary markers of compliance with the diets, Na and K, were satisfactory showing an overall good compliance with the diets.
SLC4A5 gene, coding for a sodium hydrogen bicarbonate transporter involved in Na transport across the cellular membrane( Reference Sassani, Pushkin and Gross 45 ), affected salt-sensitive changes in BP. Carey et al.( Reference Carey, Schoeffel and Gildea 19 ) noted that SNP rs7571842 and rs10177833 had the most pronounced effects on salt sensitivity. One of these SNP, rs7571842, had the greatest effect in this study population, increasing BP in individuals with AA genotype and confirming the protective effect of the G allele( Reference Carey, Schoeffel and Gildea 19 ). A post hoc power calculation revealed that, with the two-tailed 0·05 significance level, this test had a power of 92 % to detect a difference in SBP between the two SLC4A5 rs7571842 genotype groups (mean values for ΔSBP 7·75 v. 0·00 mmHg and standard deviations 2·87 v. 1·06 mmHg). Regarding the rs10177833, the lack of confirmation of its effect may be due to its lower effect size that could potentially be detected in a larger sample size study. These results, however, align with Carey et al.( Reference Carey, Schoeffel and Gildea 19 ) where the effect of rs10177833 on salt sensitivity observed in the University of Virginia discovery cohort was not replicated in an International Hypertensive Pathotype (HyperPATH) study population. Other SNP investigated in the present study were not associated with salt sensitivity in previous studies conducted in humans. The SCNN1B SNP were associated with hypertension( Reference Hannila-Handelberg, Kontula and Tikkanen 24 , Reference Jin, Hong and Lim 25 ) but not salt sensitivity per se suggesting rs239345 may not have an effect on this specific phenotype in a healthy population. Finally, the TRPV1 rs8065080 appears to be functional and is associated with lower channel activity, a trait observed in salt-sensitive rats( Reference Wang and Wang 20 , Reference Cantero-Recasens, Gonzalez and Fandos 23 ). In this population, it did not have an effect on salt-sensitive changes in BP, suggesting that other variants in this gene may have more pronounced effects on BP.
Nevertheless, the A allele of the SLC4A5 rs7571842 is present in approximately half of the European descent population with a third of the population having the risky AA genotype( 38 ). Additionally, salt-sensitive rise in BP, following a high-Na diet, was expressed as a continuous variable. The risk of CVD increases continuously and with each 2 mmHg increase in SBP there is a 7 % increase in risk of mortality from IHD and a 10 % increase in the risk of mortality from stroke( 46 ). The increase in SBP in healthy subjects with the rs7571842 AA genotype was 7·75 mmHg, which emphasises the clinical relevance of these results. Moreover, it has been estimated that approximately a third of deaths attributed to BP occur in individuals with BP lower than the hypertensive range( Reference Appel 47 ). They may represent a salt-sensitive part of the population which reflects salt sensitivity prevalence of 36 % in this study. Considering the discrepancies in methods used in previous studies, it is difficult to draw any conclusion whether this prevalence could be expected in other populations with similar characteristics. Salt sensitivity prevalence of 26 % in normotensives was established using an intravenous protocol for diagnosis of salt sensitivity( Reference Weinberger, Miller and Luft 27 ). However, more recent work suggests that this method can lead to misclassification and incorrect diagnosis( Reference de la Sierra, Giner and Bragulat 39 , Reference Sharma, Schorr and Cetto 40 ). Another potential issue in comparison of different study results is the BP measurement. While most studies still use the conventional measurements, from the studies that employ 24-h BP measurements only a limited number is investigating salt sensitivity solely in healthy, normotensive populations( Reference Castiglioni, Parati and Brambilla 48 – Reference Brian, Dalpiaz and Matthews 50 ).
It should be noted, however, that this study primarily investigated the effects of Na loading on BP and as such, the above-described salt sensitivity prevalence should be regarded with caution. When identifying subjects as salt-sensitive or salt-resistant it is recommended that the low- and high-Na diets should be administered in a random order to achieve maximal reproducibility( Reference Kurtz, DiCarlo and Pravenec 35 ). When a low Na period precedes high Na period RAAS may not be uniformly suppressed( Reference Elijovich, Weinberger and Anderson 51 ). This may result in an increased BP response on a low-Na diet and would require larger sample size compared with the one in this study to detect the true effect of dietary Na manipulation on BP and estimate the salt sensitivity prevalence. Therefore, if the order of the diets was randomised and high-Na diet preceded the low-Na diet in a proportion of the study population, the RAAS may have been supressed to an extent where more uniformity in the BP response to dietary intervention may have been observed. This in turn, may have resulted in a statistically significant difference in BP when transitioning from the low- to the high-Na diet in the total study population.
Besides observed genetic predisposition to salt sensitivity of BP, the SLC4A5 rs10177833 was associated with salt intake. With increasing number of A alleles, there was a trend towards an increased energy-adjusted Na intake. The highest proportion of subjects in the second and third tertiles of energy-adjusted Na intake was in the AA genotype group with the majority of these subjects (85 %) having absolute Na intake above the recommendations( 5 , 52 ). Recently, Smith et al.( Reference Smith, Estus and Lennie 53 ) have reported how individuals with enhanced bitter taste perception genotype (GC and GG alleles for the bitter taste receptor gene TAS2R38) were significantly more likely than CC homozygotes to have daily Na intake higher than recommended. Furthermore, Kho et al.( Reference Kho, Song and Lee 54 ), in their genome-wide association study, have reported on several variants associated with salt intake. These variants were in genes coding for Na, K and Ca channels, suggesting that genes coding for Na transport proteins may be associated with increased salt intake, similar to the findings of this study. The mechanism behind this association is to be explored. It is not to exclude the potential expression of this cotransporter in taste receptor cells, as other Na-dependent transporters primarily expressed in other tissues have been localised in tongue( Reference Vinnikova, Alam and Malik 55 , Reference Merigo, Benati and Cristofoletti 56 ). However, impaired Na metabolism was reported as a consequence of rs10177833 induced increase in the SLC4A5 transcription under conditions of high Na intake( Reference Felder, Jose and Xu 57 ). Considering its strong linkage disequilibrium with rs7571842( Reference Carey, Schoeffel and Gildea 19 ), these two SNP are most likely inherited together making the carriers of this genotype at increased risk of developing hypertension and CVD.
Moreover, there was no genetic predisposition to altered salt taste perception. The discrepancy in the results of the present study and the one by Dias et al.( Reference Dias, Rousseau and Duizer 8 ) may be explained by the difference in thresholds measured. The taste quality of salt stimulus can be concentration dependent( Reference Wise, Hansen and Reed 58 , Reference Galindo-Cuspinera, Waeber and Antille 59 ) which may explain the associations observed with suprathresholds in Dias et al.( Reference Dias, Rousseau and Duizer 8 ) but not with lower concentrations (STDT, STRT) used in this study. Nevertheless, the borderline non-significant trend observed for the TRPV1 rs8065080 may be detected in a larger sample size study. For such study to be clinically meaningful, in addition to salt taste perception, dietary salt intake should be measured, as acknowledged by Dias et al.( Reference Dias, Rousseau and Duizer 8 ). It has been shown that the reduction in salt intake results in important falls in BP, in both hypertensive and normotensive salt-sensitive individuals( Reference He, Li and MacGregor 2 ), and a reduction in overall CVD risk( Reference Lewington, Clarke and Qizilbash 1 ).
Associations between salt sensitivity, salt taste perception and salt intake
Together with the observed effect of genetics, salt sensitivity expressed as a change in BP after Na loading was associated with taste thresholds for salt. In subjects that had complete dietary intervention data, PP was positively associated with STDT. PP is the difference between SBP and DBP and is argued to be a better predictor of cardiovascular risk than SBP( Reference Millar and Lever 60 ). PP may be genetically determined by the SLC4A5 rs7571842( Reference Stütz, Teran-Garcia and Rao 61 ). The mechanisms behind this association and the causality remain unknown. However, the hypothesis was that genetics may play a role in this relationship which aligns with the finding that this association was observed only in certain genotype groups of the SLC4A5 SNP. This subgroup analysis should, nevertheless, be replicated in a study with a larger sample size in each genotype group, to achieve appropriate statistical power, and as such considered preliminary in this study.
Sakamoto et al.( Reference Sakamoto, Fujii and Saito 26 ) reported that the ENaC activity may be the link between salt taste sensitivity and salt sensitivity of BP in animals. However, the SCNN1B rs239345 was not associated with salt sensitivity or salt taste thresholds in this study. In a larger sample size study potential effect of interactions between the SLC4A5 and ENaC SNP may be investigated and may provide insight into the mechanism behind this relationship. Nevertheless, the relevance of these findings lies in the actual relationship between salt taste thresholds and salt intake.
If there is a positive association between the thresholds for salt and salt-sensitive changes in BP, it can be theorised that salt-sensitive individuals with higher thresholds are at greater risk of developing hypertension due to their higher salt intake. In the present study, however, neither detection nor the recognition threshold for salt has been associated with total habitual dietary salt intake. Nevertheless, discretionary salt use accounts for approximately 15 % of salt intake in Western countries( Reference Elliott and Brown 62 ) and the results of the present study suggest it may be associated with salt taste thresholds. The association between salt taste perception and discretionary salt use may depend on the SLC4A5 and TRPV1 genotype, however these sub-group analyses should be replicated in a larger size study. This would, nonetheless, be in line with the notion that reduced salt taste sensitivity (i.e. higher salt taste threshold) drives individuals to consume more salt until reaching the salt concentration identified as pleasant( Reference Piovesana, Sampaio and Gallani 14 ). Conversely, improved ability to taste salt when the taste of salt is deemed pleasant may result in increased salt intake. Indeed, research suggests that the preference for salty taste may be one of the factors affecting salt intake in younger populations and that discretionary salt use is more frequent in younger compared with older populations( Reference Lee, Cho and Bae 63 , Reference Sarmugam, Worsley and Wang 64 ). Moreover, when salt content of processed food is reduced, consumers compensate its apparent lack by increasing the discretionary salt use( Reference Quader, Patel and Gillespie 65 ). Considering the evolving food supply and dietary habits of the UK population and worldwide, a better understanding of this behaviour could enable more targeted and effective public health interventions to reduce salt intake.
Strengths and limitations
This study has several strengths and limitations. A strength is the salt sensitivity phenotyping procedure with the dietary control of Na intake. Moreover, a 24-h ABPM procedure to determine the difference in BP between the diets provides many more measurements than conventional BP measurement reflecting usual BP more accurately. It also allows identification of individuals with a ‘white coat’ response or masked hypertension, and is a stronger predictor of cardiovascular morbidity and mortality than conventional measurement( Reference O’Brien, Parati and Stergiou 34 ). One of the limitations is a use of a FFQ to determine dietary salt intake. Even though FFQ represents dietary intake over a longer time-period, it relies heavily on respondents’ honesty and long-term memory. However, Na intake was energy adjusted, improving measurement accuracy. Freedman et al.( Reference Freedman, Commins and Moler 66 ) suggest that the attenuations and correlations with truth for the FFQ are improved when considering Na densities, utilised in this study. Regarding the associations between genetics and variables of interest, where possible, a Cochran–Armitage test of trend was used. The advantage of the Cochran–Armitage trend test is that it is not dependent on the Hardy–Weinberg equilibrium assumption and is suggested as the genotype-based test for association( Reference Sasieni 67 – Reference Clarke, Anderson and Pettersson 69 ). Finally, the small sample size in subgroup analyses of the correlations between salt taste perception, BP response to Na loading and salt intake warrants replication of these results in a larger sample size study.
In conclusion, this preliminary data suggest there is a genetic predisposition to salt sensitivity in healthy, adult Caucasians. The SLC4A5 rs7571842 was confirmed as the variant with the effect on salt-sensitive changes in BP. Another SLC4A5 variant, rs10177833, most likely inherited together with the rs7571842, is associated with salt intake. Moreover, the observed associations between salt taste perception and salt sensitivity, together with the association between salt taste perception and discretionary salt use may depend on the SLC4A5 and TRPV1 genotype. As there was no association between genetics and salt taste perception, the mechanisms behind these associations are to be further explored together with gene–gene interactions. Nevertheless, preference for salty taste may be a driver of salt intake in younger populations and warrants further investigation. Studies investigating these associations should comprehensively explore all potential variables, such as genetic predisposition, salt taste perception and salt intake to contribute towards more successful prevention of hypertension and CVD.
Acknowledgements
The authors would like to thank Professor Conor Gissane for his advice on the final version of this manuscript. The authors would like to acknowledge the contribution of the staff and subjects of the EPIC-Norfolk Study. EPIC-Norfolk is supported by the Medical Research Council programme grants (G0401527, G1000143) and Cancer Research UK programme grant (C864/A8257).
This research received no specific grant from any funding agency, commercial or not-for-profit sectors.
Y. M. and L. P. designed the experiment. L. P. conducted data collection, data analysis and wrote the manuscript. Y. M. supervised the project. Both authors discussed the results and implications and commented on the manuscript at all stages.
The authors declare that there are no conflicts of interest.
Supplementary material
For supplementary material/s referred to in this article, please visit https://doi.org/10.1017/S0007114518002027