




Policy Significance Statement
Efforts to prevent violence against women (VAW) are often constrained by limited prevalence data, leaving policymakers without a comprehensive picture of women’s safety. By shifting focus from incident-based measures to the societal and structural conditions that underpin safety, the Women’s Safety Index (WSI) offers a new way to assess protective environments across time and countries. Integrating indicators of these foundational conditions with data on conflict and disaster exposure allows for a more nuanced understanding of how crises disrupt women’s safety. This composite approach supports longitudinal and cross-national comparison, helping identify patterns, gaps, and progress in VAW prevention. The WSI provides policymakers, researchers, and advocates with a practical tool to monitor resilience, target interventions, and strengthen the systems that protect women before violence occurs.
1. Introduction
How safe are women within and across countries globally? Data on the prevalence of types of violence against women (VAW) is limited (VAW is any act of gender-based violence that is perpetrated against a person’s will, that are based on the gendered power relations in the society, that affects women and girls disproportionately, and that is likely to result in physical, sexual, or psychological harm or suffering to individuals, including threats of such acts, coercion, or arbitrary deprivation of liberty, whether occurring in public or in private life). However, qualitative research on the experiences and contexts of violence against women imparts considerable knowledge on women’s safety, including the conditions under which women are most likely to be safe and least vulnerable to violence. We consider these conditions to be the foundations of women’s safety, ensuring the protection from and prevention of VAW. To investigate country progress on the prevention of VAW, we have combined measures of these societal and structural conditions in a (new) Women’s Safety Index (WSI). Shocks such as conflicts and natural disasters often negatively impact the foundations of safety, indirectly affecting women’s experiences of safety and/or violence. Conflict and disaster data are thus integrated to enhance our understanding of women’s safety during and after a crisis. The Index offers longitudinal and comparative insights into VAW prevention, while facilitating further research and policy analysis of how, why, and where violence against women occurs.
This article is structured as follows: First, we explain why a Women’s Safety Index is needed. We discuss the purpose of an Index and its potential uses. Second, we propose that the foundations of women’s safety consist of three dimensions: Equity, Protection, and Resources. We discuss each of these dimensions of the Index and justify the selection of key indicators within them based on theory and evidence of their relationship to women’s safety. Third, we describe the statistical methodology and framework for constructing the Index. Finally, we validate how the Index captures shifts in women’s safety, particularly in response to shocks, using additional shock data and modeling its lasting impact.
1.1. Why a Women’s Safety Index?
Women’s risk of violence operates at multiple levels—individual, relationship/family, community, and societal (Heise, Reference Heise1998), and in the context of globalization, such as worldwide flows of people, technology, capital, and conflict (True, Reference True2012). Women’s risk of experiencing violence reduces with the presence of structural conditions or foundations, which can be seen as protective factors that enable the targeting of advocacy, resources, supports, and systems that mitigate risk. We can measure women’s safety based on their access to these foundational conditions at the national level and assess the impact of shocks in two ways: first, by observing how shocks alter these structural conditions, and second, by examining how shocks affect women’s safety over time, above and beyond their impact on structural foundations. Although some indices exist that capture elements of women’s safety and related concepts, we lack a consistent methodological approach to measuring women’s safety over time, particularly one that accounts for the impact of shocks.
Rigorous evidence and data are vital to advance gender equality worldwide. However, there are major gaps and deficits in gender data, and this is particularly apparent with the rise of global indices that measure conflict and peace, none of which include indicators that reflect women’s experiences of insecurity. For example, the Global Peace Index produced by the Sydney-based Institute for Economics and Peace includes a range of data on violence and conflict but not gender-based violence, while the Uppsala Conflict Data (UCDP, n.d.) only counts “battle-deaths” over an annual threshold involving conflict parties, which excludes gender-based violence that does not result in death. At the same time, the major Indices focused on gender equality, such as the World Economic Forum’s Global Gender Gap Index (GGGI) and the United Nations Development Programme Gender Development Index (GDI), exclude a focus on violence against women or women’s safety (WEF, 2025; UNDP, 2026). The Women, Peace, and Security (WPS) Index aimed to address some of these gaps to advance the Women, Peace, and Security agenda, drawing on the best available country-level data (Klugman, Reference Klugman, Davies and True2019; Klugman et al., Reference Klugman, Gaye, Dahl, Dale and Ortiz2019). Its focus is on measuring women’s inclusion, access to justice, and individual, community, and societal security in general as components of the WPS agenda. By contrast, the Global WSI has a different purpose. It consolidates the evidence-based conditions under which women are most likely to be safe and least vulnerable to gender-based violence, especially in the context of conflict and disaster shocks, in one composite Index.
1.2. The Women’s Safety Index (WSI) has five main aims
First, the Index seeks to provide a baseline assessment of women’s safety, combining key structural indicators that enable and/or enhance safety. It allows us to monitor a country or region’s baseline WSI over time and assess how well countries are positioned to protect women, particularly in times of shocks.
Second, the Index enables researchers and stakeholders to interact with secondary data on key indicators affecting women’s safety. It can assist situational analysis and reports for use when conducting gender rapid assessments. It can facilitate comparative analysis of women’s safety across countries and time. Moreover, by compiling country-level data on the three dimensions of women’s safety (Equity, Protection, and Resources) we can identify dimensions that are lagging. We can also identify gaps that local researchers and stakeholders can use to inform their efforts in strengthening women’s safety.
Third, the Index can help researchers to assess women’s safety before, during, and after shocks. It allows us to consider the structural conditions for safety, encompassing how they may cushion or buffer the effects of shocks on safety and violence. With the Index ranging from 0 to 100, we argue that countries positioned closer to 100 will be more able to absorb or counter the impact of a(ny) shock with lower incidence and less prolonged VAW (of all types).
Fourth, with an overarching approach to the measurement of the dynamic relationship between VAW protection, risks, and shocks, the Index can inform and influence national and regional research and policymaking. For example, the Index can support VAW safety risk assessment and mitigation in disaster/emergency/crisis prevention policy, planning, and preparedness. Our measures are based on “protective factors,” although not all VAW risks can be protected against, for instance, statuses such as gender, age, and ethnicity.
Fifth, the Index can serve as an advocacy and communication tool for civil society, donors, and international organizations. By offering a transparent, data-driven measure of women’s safety, it can help elevate attention to persistent structural challenges and regional disparities. The Index can also support resource mobilization and programmatic prioritization by highlighting areas most in need of investment. Its accessible format, as an online platform, can enable broader engagement and empower stakeholders to advocate for policy reform and increased accountability on women’s safety at local, national, and international levels (cevaw-evidence.org).
1.3. Approach to measuring women’s safety
To measure women’s safety and a country’s capacity to mitigate violence against women, we define the baseline Women’s Safety Index as a three-dimensional framework: Equity, Protection, and Resources (EPR). The EPR dimensions include indicators representing women’s equitable rights, protection of women’s bodily integrity, and women’s access to resources, respectively. To date, there has been no systematic, cross-country scoring on these baseline dimensions of safety yet they are vital for protection from the risk of VAW.
In particular, the literature suggests that these baseline dimensions of women’s safety are especially relevant for ensuring women’s safety during shocks, such as conflict and natural disasters. Shocks (including conflict and mass disasters) impact the levels and types of violence against women experienced during and after these events. Shocks are defined as an unplanned event that causes ecological, material, economic, and/or social disruption that negatively impact people’s livelihood, safety, and health. They are intense, acute, or sudden phenomena that overwhelm local capacity, often involving suffering, death, damage to infrastructure, and disrupted access to supplies and care (adapted from UNICEF, WHO, UNHCR, USAID, and SENDAI definitions of emergency, shock, and disaster). Studies have identified protective factors that may mitigate the risk of VAW escalation before, during, and after the impact of shocks (Thurston et al., Reference Thurston, Stöckl and Ranganathan2021; Le Masson, Reference Le Masson2022; Murphy et al., Reference Murphy, Ellsberg, Balogun and Garcia-Moreno2023), and research needs to look beyond individual-level factors to understand and develop protective strategies at societal and structural levels (Yodanis, Reference Yodanis2004; Heise, Reference Heise2011; True, Reference True2012).
While the EPR dimensions offer a baseline comparative measure of safety, overlaying shock indicators onto the WSI framework also captures the sudden disruption to the degree of risk protection and preparedness to prevent and mitigate VAW, which is known to occur and often be exacerbated during shocks.
The Index collates global indicators from secondary data sources, selected for their theoretical and empirical relevance. We also prioritized indicators with the greatest country-level availability and coverage across all global regions. Despite this, East Asia and the Pacific have the highest number of missing variables—largely due to the lack of comparable data for the Pacific Islands. This suggests that, in addition to gender bias in global datasets, there is also regional bias, with certain areas underrepresented in gender-disaggregated global data (Perez, Reference Perez2019). In a limited way, we aim to address this by including illustrations from East Asia and the Pacific in this article.
The WSI does not presume women are solely responsible for their protection or safety. Rather, it is underpinned by the assumption that society has a role and can play a role in establishing women’s safety, but there has been no attempt to measure this. While resilience is often emphasized in disaster and conflict contexts, it cannot be realized or sustained without the presence of safe and protective conditions. The Index focuses on measuring collective resilience, recognizing that communities are better able to withstand and recover from shocks when structural safeguards for women’s safety are in place.
By anchoring the Index in both theory and evidence, as set out in Section 2 of the article, we aim to establish its value not only for retrospective analyses but also for more accurate real-time insights. Specifically, the WSI can serve as a reliable proxy in contexts where direct data on VAW is unavailable, delayed, or underreported, offering an empirically informed estimate of safety and where it may be enhanced and/or reduced. The differences among the country scores across these indicators suggest potential protection areas and approaches for countries and institutions to strengthen to improve women’s safety. In Section 3 of the article, drawing on examples, we argue that there is also evidence that these indicators buffer the escalation and expansion of VAW during and after shocks.
2. Foundations of women’s safety
Safety is conceptualized as the set of structural, institutional, and socioeconomic conditions that minimize women’s vulnerability to violence and enhance their ability to navigate environments where violence may occur. These conditions are disaggregated into Equity, Protection, and Resource dimensions, which combine to promote women’s safety. With weak protective institutions and limited access to resources, individual women may be able to negotiate their safety, but women as a group will not be safe. Similarly, with access to resources but poor equity and protective institutions, individual women’s safety will be dependent on men’s affection and charity. The Equity dimension measures the fairness and inclusiveness of society across education, employment, parliamentary representation, poverty levels, and the absence of legal discrimination, which ensures that women’s capabilities are equitably recognized and represented, and they can have equal opportunity to protect themselves. The protection dimension measures the protection of women’s bodily integrity through women’s autonomy over fertility preferences, maternal mortality rates, nonviolent attitudes, and low prevalence of child marriage. These indicators specifically protect against situations in which women are most vulnerable. Last, the resources dimension measures a population’s, including women (who are the majority of country populations), access to essential resources, especially those resources that support women’s security and autonomy, including safe water and sanitation, electricity, mobile phone use, and financial services. These resources, moreover, have been found to be the most important in enabling women’s safety during shocks.
We have constructed an Index that scores country performance on three dimensions of women’s safety: Equity, Protection, and Resources (“EPR”). Country scores range from 0 to 100, with values closer to 100 indicating greater equity, protection, and availability of resources specifically aimed at supporting women’s safety and well-being within that country. The Index does not suggest that a country closer to 100 on the EPR dimension will not experience VAW; rather, a country may have greater capacity to introduce prevention and response (protective) measures to reduce the risk of this violence (its forms, prevalence, and severity). When analysed in relation to the prevalence of intimate partner violence, the Index illustrates this pattern. Similarly, greater equity, protection, and resources may enable a country to absorb or mitigate the negative impact of shocks on violence against women.
We argue that the EPR dimensions, and the indicators within them, are the foundations of women’s safety. They reflect the state of current structures and systems supporting gender equality, women’s empowerment, and gender-equitable human development in general. The EPR framework is evidence-based. It includes 13 indicators where there is research evidence that they are associated with, and/or enable and support safety. These indicators are drawn from existing studies of gender equality, women’s empowerment, and disaster response, giving us a strong reason to expect that they would affect the likelihood of women’s safety from violence.
Compared with the WPS Index (GIWPS/PRIO, 2026), the Global WSI aims to assess the conditions of women’s safety, which we expect to be associated with and, to some extent, predict the prevalence of violence against women. Each indicator in the three dimensions of the Index is specifically supported by research evidence (and systematic reviews of that evidence) that they contribute to women’s safety from violence. The theory underpinning the WSI is that when there are strong foundations of safety, women are least vulnerable to violence. Therefore, unlike the WPS Index, the WSI does not include measures of types of violence such as IPV or political violence targeting women, since its purpose is to establish the structural and protective foundations of women’s safety under which IPV and political violence are less or more likely to occur.
The Global WSI also models shocks (conflict and disasters) separately, whereas the WPS Index includes them as an element of its security dimension. The WSI aims to show how these shocks negatively affect women’s safety depending on the existing equal rights, protection safeguards, and access to resources. Research shows that shocks like wars or disasters often increase the levels and types of violence women experience. Societal and structural protections can reduce these risks. The WSI helps us measure both the baseline protections and how they hold up under shocks.
Compared with the OECD’s Social Institutions and Gender Index (SIGI), which measures gender discrimination (OECD, 2026), the Global WSI is based on quantitative indicators only, unlike the SIGI, which is a synthesis of qualitative judgments converted to scores along four dimensions. But like the SIGI, the WSI includes access to resources (productive and financial) and considers them important to measure as a foundation of safety.
A unique feature of the global WSI, in contrast to both the WPSI and SIGI, is its longitudinal design with a time series for every year from 1995 to 2024. Our intention is to annually update the Index with EPR and shocks data, utilizing the same methodology for analysis of change over time by country and by region. Such analysis is not possible in the other Indexes due to their data sources and change in methodology, which has limited their updates to every several years rather than annually. Unlike the SIGI and WPSI, the Global WSI does not provide a single number or ranking for countries (Klugman, Reference Klugman, Davies and True2019). It’s about insight across time as well as across countries and regions.
In selecting indicators that measure aspects of equity, protection, and resources, a major criterion was the degree of data availability across countries (and over time) and especially for the Indo-Pacific region, which includes many small island developing countries and resource-constrained states. We use both sex-disaggregated indicators, such as those related to education and employment, where the foundations of safety are accessed at the individual level, and societal or household-level indicators, such as access to electricity or water and sanitation, where disaggregation by sex is not meaningful or applicable. Some indicators, such as national poverty rates and maternal mortality, are influenced by broader socioeconomic factors and are not strictly gender-specific. They are included as practical proxies due to limitations in consistent cross-national gender-disaggregated data. These measures are generally at the household level, reflecting the premise that women in disadvantaged households typically experience greater constraints than those in non-disadvantaged households. Where available, these proxies are complemented by directly gendered indicators to strengthen the robustness of the framework.
No single metric can fully capture a complex underlying phenomenon (Karim and Hill, Reference Karim and Hill2024): The WSI is fundamentally a comparative tool assessing countries relative to one another, as well as tracking each country’s trajectory over time. The most informative data attributes are therefore their consistency and broad coverage of the foundations of women’s safety. If each indicator systematically tracks the same core concept in every country and year, the WSI will reliably highlight the relative strengths, gaps, and trends, even if each measure serves as a proxy.
While the dimensions that define the baseline EPR are conceptually distinct, we allow for (and expect) some correlation among indicators within each dimension, as they capture the same concept of structural foundations of safety from different angles. For example, indicators in the Resources dimension can share a latent driver such as the level of economic development, but each chosen indicator reflects a different pathway through which resources influence women’s safety. This is precisely what we intend to measure: each indicator offers a distinct/specific actualization of how structural conditions affect women’s safety, capturing different mechanisms (e.g., access, agency, and infrastructure) to build a fully comprehensive and robust measure when averaged within each dimension and combined to form the overall Index.
Some indicators shift more slowly over time, such as fertility rates or education levels, while others respond more quickly to change, including mobile phone use or legal reforms. To avoid imposing assumptions on the relative ‘importance’ of different indicators, we adopt an equal weighting approach within each dimension. Equal weighting is justified on the basis that each dimension captures a necessary (though not sufficient) condition for safety, and that overreliance on statistical weighting (e.g., PCA or regression-based methods) may also inadvertently discount slower-moving but structurally important indicators. Equal weighting also ensures transparency and interpretability by avoiding the biases introduced when statistical weighting methods assign importance based on variation (where differences in variation may largely be due to differences in data availability).
In what follows, we describe how we conceptualize the foundations of women’s safety by dimension and the evidence for the inclusion of each indicator. We then explain the measure used to capture it and its data source. These indicator data descriptions and sources are summarized in the Appendix Tables A1 and A2.
2.1. Equity
Equity is a dimension that measures the fairness and inclusiveness of society for women and girls across education, employment, parliamentary (decision-making) representation, poverty levels, and the absence of legal discrimination.
2.1.1. Education
Concept: Socioeconomic factors affect the status of women and the capacity for addressing women’s safety both in response to and in preventing violence against women. Higher levels of education have been found to reduce women’s risks of violence (Khalid and Choudhry, Reference Khalid and Choudhry2021), often in conjunction with other factors such as employment and income. In contrast, lower education status was found to increase the risk of VAW in the context of COVID-19 in India and Bangladesh (Razu, Reference Razu2022; Sharma and Khokhar, Reference Sharma and Khokhar2022). Shocks have an immediate impact on access to education, with girls most likely to be away from school longer and not return to school (Azcona et al., Reference Azcona, Bhatt, Davies, Harman, Smith and Wenham2020). Studies have also recorded that the girls who are unable to complete their education are more likely to be married at a young age, often without their consent, which in turn exposes them to heightened risks of intimate partner violence (IPV) (UNICEF, 2018). Moreover, higher relative levels of education are often associated with higher incomes, providing women with alternatives to being financially dependent on an intimate partner and the risk of violence, while offering a clear pathway to leaving a violent relationship. Educated women are also able to advocate for measures to enhance women’s safety. Thus, higher relative female education levels are expected to promote greater women’s safety, while lower relative female education levels do not improve women’s safety and are associated with women’s vulnerability to violence.
Measurement: To assess equity in education, specifically women’s education relative to men, the Index uses the “female to male ratio of average years of schooling at aged 25+.” Gender ratios in primary education are now less useful because parity has been achieved at the primary level (UNESCO, 2016). We utilise a ratio metric to capture the inequity, that is, the level of education of women compared to men, as opposed to the general level of education of women. Equity in educational access and the overall degree of educational access do not progress in lock step with each other. For example, in Nepal, female education rose (from just above 0 to 3.5 mean schooling years between 1971 and 2021), but the gender ratio of education increased even more significantly from 0.1 in 1971 to 0.6 in 2021. By contrast, in Afghanistan, the drop between 2021 and 2022 in mean schooling years from 2.3 to 1.2 years is (relatively) less than the decline in the gender ratio, which dropped from 0.7 to 0.3, due to girls being banned from schooling after the age of 12 in August 2021 (mean schooling years for males increased from 3.4 to 3.9 years during that time). By measuring girls’ educational access relative to boys, we capture equity, which is important for women’s ability to negotiate protection often vis-à-vis male family members or male-dominated institutions, whether that involves self-protection or access to services. If boys are already more educated than girls, even if girls are increasingly educated to a higher-level education, for instance, their relative inequality can affect their household bargaining power or their access to protection (Ranganathan and Mendonca, Reference Ranganathan and Mendonca2023).
2.1.2. Employment
Concept: Gender inequality in access to decent work and employment is an environment in which VAW thrives. Secure employment gives women economic independence to enhance their safety and avoid home and work situations where they are more vulnerable to violence (Vyas et al., Reference Vyas, Mbwambo and Heise2015). Shocks can intensify economic insecurity by disrupting employment, deepening poverty, and reducing access to financial resources, particularly for women and marginalized groups. Studies have documented economic insecurity as a major risk factor for women exposed to IPV during the Covid-19 pandemic (e.g., see Nimble, Reference Nimble2021; Clisby and Choudhury, Reference Clisby and Choudhury2022). The lack of employment safeguards among informal workers, especially a reliable wage, places women at significant risk of economic insecurity during shocks (SE Davies et al., Reference Davies, Eslick, Calsado, Juanico, Oo, Roberts, Yadanar and Woyengu2024). However, this employment must be accompanied by supportive policies to combat discrimination and harassment at work. Employment must be accompanied by protections against discrimination and harassment. Precarious work and backlash to female employment can threaten women’s safety (Heath, Reference Heath2014; Anderberg et al., Reference Anderberg, Rainer, Wadsworth and Wilson2016; Pillinger, Reference Pillinger2017), underscoring the need to address gender norms alongside economic empowerment.
Measurement: The percentage of females aged between 25 and 64 years who are employed provides a valid measure of women’s employment across countries using ILO data sources from the World Bank database.
2.1.3. Parliamentary representation
Concept: Feminist political scientists have established a body of evidence showing a demonstrable connection between the rise of women in public life, as manifest in their increasing political representation, the inclusion of pro-women policies on government agendas, and greater public service responsiveness to female citizens (Iyer et al., Reference Iyer, Mani, Mishra and Topalova2012; Bashevkin, Reference Bashevkin2014). Policies to combat violence against women, for instance, have only been advanced once women have reached the highest level of government and have the political power to advocate for women’s safety across state institutions and society and initiate policies and programs that increase women’s safety not only under normal circumstances but also during shocks. The presence of women in positions of political power as parliamentary representatives is a significant factor promoting the development and implementation of gender-responsive policy and programs to address violence against women (Weldon, Reference Weldon, Goertz and Mazur2008; Htun and Weldon, Reference Htun and Weldon2012; True and Riveros-Morales, Reference True and Riveros-Morales2019). Thus, we would expect that countries with a higher proportion of women parliamentarians would have high levels of safety and lower prevalence of actual violence against women.
Measurement: The number of seats held by women members in lower and upper chambers of national parliaments, expressed as a percentage of all occupied seats. This indicator is derived by dividing the total number of seats occupied by women by the total number of seats in parliament. This data is sourced from the Inter-Parliamentary Union (IPU, 2026).
2.1.4. Poverty alleviation
Concept: Women of all socioeconomic statuses experience violence. However, generally, women are more able to protect themselves from violence and to leave violent homes and workplaces when they have good socioeconomic status. Agarwal and Panda (Reference Agarwal and Panda2007) found that ownership of land or income-earning property by women reduced their likelihood of experiencing domestic violence by 50%. Studies in economics suggest that improvements in women’s economic standing and decision-making power within households can reduce intimate partner violence (see Aizer, Reference Aizer2010; Green et al., Reference Green, Blattman, Jamison and Annan2015; Oduro et al., Reference Oduro, Deere and Catanzarite2015; Hidrobo et al., Reference Hidrobo, Peterman and Heise2016). Conversely, poverty could enhance male violence against women, denying women’s opportunities, decision-making, and access to services. This cycle of violence maintains and deepens women’s economic dependence on men, which in turn increases their vulnerability to further violence (Terry, Reference Terry2004). Strategies for empowering women economically through self-employment, collective income-generating arrangements, and formal employment in the labor force have shown some of the best evaluated outcomes in terms of reducing women’s experience of violence. Some epidemiological studies also find that violence against women is more probable in poorer households (Yitbarek et al., Reference Yitbarek, Woldie and Abraham2019).
Measurement: We measure poverty alleviation in terms of the percentage of the population living above the poverty line. Data are compiled from official government sources or are computed by World Bank staff using the international poverty line (World Bank, 2026d). This is also an SDG indicator (1.1.1) under Goal 1 end poverty in all its forms everywhere (United Nations, 2025a). This indicator is not sex or age disaggregated because women’s safety is affected not only by women’s own poverty, which increases their vulnerability to violence, but also by poverty alleviation for family and community members whose socioeconomic situation can influence their violent behavior or perpetration. We find that both male- and female-disaggregated data follow the general trend almost exactly over time.
2.1.5. Legal protection
Concept: Laws that prohibit gender-based discrimination across public and private spheres form a foundational layer of protection against violence and abuse. The absence of legal safeguards or the presence of discriminatory laws can normalize harmful practices, restrict women’s autonomy, and reduce their ability to seek justice. Legal protections influence not only women’s recourse to support systems but also shape societal norms around the acceptability of violence and gender inequality. Evidence suggests that stronger legal frameworks are associated with lower prevalence of violence against women, particularly when enforcement mechanisms are accessible and responsive (UN Women, 2011; Klugman et al., Reference Klugman, Hanmer, Twigg, Hasan, McCleary-Sills and Santamaria2014). Conversely, weak or poorly implemented laws can deter women from leaving abusive relationships, reduce the costs of perpetration, and reinforce impunity. Legal reforms, when accompanied by awareness campaigns, judicial training, and service accessibility, can help shift both behavior and institutional responses, enhancing women’s safety in both domestic and public settings.
Measurement: Indicators of discrimination in law across eight areas: Mobility, Workplace, Pay, Marriage, Parenthood, Entrepreneurship, Assets, and Pension. This measure is based on the Women, Business, and the Law 1.0/2.0, a comprehensive project by the World Bank that analyses laws and regulations affecting women’s economic opportunities and the constraints they face in various countries. This measure was adopted to include variables that were consistent across both versions of the Women, Business, and the Law Index.
2.2. Protection
Protection is a dimension that measures the protection of women’s bodily integrity through fertility preferences, maternal mortality rates, nonviolent attitudes, and the absence of child marriage.
2.2.1. Gender-equitable births
Concept: The preference for males over females (or vice versa) at birth in any given society reflects discriminatory gender norms that can be expected to negatively affect women’s safety throughout their life course. The lack of gender equity has been reflected historically in a skewed sex ratio of births in several countries, especially in Asia, as shown by Hudson and Den Boer (Reference Hudson and Den Boer2004) in their study, “Bare Branches.” They argue that this practice, which has involved female infanticide as well as the use of technology to abort females, leads to other forms of violence against women, including kidnapping and forced marriage of girls and young women in situations where there is a paucity of partners for the larger male population. A substantial body of research uses “son bias” (or son preference), often operationalized through skewed sex ratios, fertility stopping behavior, or stated child preferences as a proxy indicator of deeper discriminatory gender norms, reflecting what Sen (Reference Sen2003), Klasen and Wink (Reference Klasen and Wink2003), and Sen (Reference Sen1999) describeed as the phenomenon of “missing women.”
Measurement: The Index uses the sex ratio of births (male to 100 females) drawn from the World Population Prospects (WPP) by the UN Department of Economic and Social Affairs, Population Division. Later, we invert the normalized score of this ratio to reflect the desired measure, and that an increase in gender-equitable births increases protection. For example, in 1995, Afghanistan had 105.8 males to 100 females. This resulted in a measure of gender equitable birth score of 0.69. A year later, son bias worsened to 106 males per 100 females, resulting in a reduction of gender-equitable births (and protection) to 0.67. The gender-equitable births indicator is constructed as the inverse of son bias in sex ratios at birth, which is widely used and validated in the literature as a proxy for discriminatory gender norms; its inversion allows the indicator to capture the presence of gender-equitable norms and protective conditions for girls at birth rather than the absence of them.
2.2.2. Maternal survival
Concept: Maternal survival and safe maternity care are associated with women’s and children’s safety throughout the life course. There is strong and consistent evidence that the converse, maternal mortality due to death in childbirth, inadequate or lack of antenatal care, and maternal suicide, is associated with violence against women, especially IPV and sexual violence (Devries et al., Reference Devries, Kishor, Johnson, Stöckl, Bacchus, Garcia-Moreno and Watts2010; World Health Organization, 2021). Lower rates of maternal mortality indicate safe access to maternal care and services, which indicate women are safer in that environment (SE Davies and Harman, Reference Davies and Harman2020; Souza et al., Reference Souza, Day, Rezende-Gomes, Zhang, Mori, Baguiya, Jayaratne, Osoti, Vogel, Campbell, Mugerwa, Lumbiganon, Tunçalp, Cresswell, Say, Moran and Oladapo2024).
Maternal survival, while influenced by health system capacity, is also determined by service utilization. Particularly, women’s decision-making power, mobility, and financial autonomy shape health-seeking behaviors of women, directly affecting exposure to preventable mortality and forming a core dimension of women’s safety (Tadele et al., Reference Tadele, Tesfay and Kebede2019; Gebeyehu et al., Reference Gebeyehu, Gelaw, Lake, Adela, Tegegne and Shewangashaw2022). VAW incidents during pregnancy can further reduce maternal survival, as women experiencing physical or sexual violence may avoid health facilities to conceal injuries, driven by shame, fear, or potential stigma (Kaur and Garg, Reference Kaur and Garg2008).
Measurement: Survival of mothers per 100,000 live births. Data were sourced from the Sustainable Development Goals (SDG) Indicators Database, which is a comprehensive online resource by the UN Department of Economic and Social Affairs, Statistics Division.
2.2.3. Non-violent attitudes
Concept: Violence against women is shaped by prevailing social beliefs that men should hold dominance roles within households and intimate relationships, and that they have the right to enforce this dominance through physical, sexual, or emotional means. These social norms are important foundations of women’s safety because normalization or acceptance of the use of violence within a social setting, such as a community or country, creates impunity for violence against women (Heise, Reference Heise1998; World Health Organization, 2010; Jewkes et al., Reference Jewkes, Flood and Lang2015). If attitudes against violence are widespread in a society, we expect that violence against women will be recognized as a problem, and that there will be greater social sanctioning of those perpetrating violence against women.
Measurement: To measure attitudes against violence, we selected the World Values survey and calculated the percentage of the population who agreed in response to the following question “[is it] justifiable for a man to beat his wife.” We considered World Bank survey data on attitudes, but there was insufficient data for many countries.
2.2.4. Child marriage absence
Concept: Child marriage (below the UN-recognized age of adulthood at 18 years) as a cultural and religious practice reflects gender norms that entrench the subordination of women to men, that expect girls and women to be submissive to male authority, and that value women more as a wife than a daughter (see True, Reference True2020, 67–69). Young girls may be married off as an economic survival and coping strategy (Asadullah et al., Reference Asadullah, Islam and Wahhaj2021), and as child brides separated from their extended families, they are extremely vulnerable to other forms of gender-based violence, such as female genital mutilation/cutting and sex trafficking (Rai et al., Reference Rai, True and Tanyag2019; Kalam et al., Reference Kalam, Asif, Afroz, Hoang, Whitfield and Talukder2025). The practice can lead to dangerous early pregnancy and associated developmental complications for mother and child. Societies that condone child marriage and have a high presence of the practice are likely to have higher levels of other types of VAW, while societies with the absence of child marriage are likely to have greater provisions for women’s safety across the life cycle. In extreme cases, early and child marriage has resulted in suicide and femicide.
Measurement: Percentage of women who were not first married by the age of 18 years (of women ages 20–24 years). This measure is obtained from the World Development Indicators (World Bank, 2026e), which source data from the United Nations Children’s Fund (UNICEF). This is also the Sustainable Development Goal indicator 5.3.1 (United Nations, 2025b).
2.3. Resources
Resources are a dimension that measures women’s access to essential resources that support security and autonomy, including safe water and sanitation, electricity, mobile phone use, and financial services.
2.3.1. Water sanitation access
Concept: Both the use and collection of clean water are known to have particular impacts on women and gender equality and access to sanitation facilities (such as flush/pour flush [to piped sewer system, septic tank, and pit latrine], ventilated improved pit [VIP] latrine, pit latrine with slab, and composting toilet) that ensure hygienic separation of human excreta from human contact and may be particularly important for women’s health and participation. They have relevance to women’s safety because women across countries experience violence when their homes and communities do not have good water and sanitation facilities, and they must travel to access them, sometimes at nighttime when they are vulnerable to perpetrators of violence outside their homes and neighborhoods (Amnesty International, 2011). Water, sanitation, and hygiene (WASH) are known in the international development community to be major issues for women (menstruation, reproductive health, maternal health, and survival), and attention to them can help achieve greater gender equality. As such, WASH programs are a major feature of gender equality development programs and mitigating the risk of violence against women.
Measurement: Percentage of population using basic drinking water and basic sanitation services (combined as a weighted average with a ratio of 1:2)
2.3.2. Electricity access
Concept: Access to electricity is a vital women’s safety resource. It can enable women’s access to services through phone and internet, as well as provide light to ensure safe access to toilet facilities, water, and public spaces for shelter during shocks. Displacement and overcrowding in public spaces pose a high risk for violence, especially sexual violence (Thurston et al., Reference Thurston, Stöckl and Ranganathan2021; Murphy et al., Reference Murphy, Ellsberg, Balogun and Garcia-Moreno2023). Women report that their personal safety improves with access to reliable and affordable electricity, due to an overall improvement in their physical environment and reduced labor (Johnston and Matte, Reference Johnston and Matte2020; Bhukta et al., Reference Bhukta, Pakrashi, Saha and Sedai2024).
Measurement: Access to electricity is the percentage of the population with access to electricity. Electrification data are collected from industry, national surveys, and international sources (World Bank, 2026a).
2.3.3. Mobile phone use
Concept: Access to mobile phones plays a critical role in women’s empowerment and safety. Sustainable Development Goal 5 focuses on achieving gender equality and empowering all women and girls. Within this goal, target 5b highlights the importance of promoting access to enabling technologies, particularly information and communication technologies, to support and strengthen women’s empowerment. Studies show that mobile technology facilitates women’s access to income-generating opportunities, financial inclusion, and market information, thereby strengthening their bargaining power and economic independence (Rahman et al., Reference Rahman, Haque, Afrad, Hasan and Rahman2023). Mobile phones can also connect women to emergency services, helplines, and social support networks, enabling them to seek help or report abuse more discreetly and effectively. A recent Mobile Gender Gap Report documents that more than 75% of females surveyed in 15 countries reported that owning a mobile phone makes them feel safer (GSMA Connected Women, 2020). Ghoshal et al. (Reference Ghoshal, Patil, Gadgil, Nathani, Bhandarkar, Kale and Roy2023) find that among various components of women’s empowerment in India, mobile phone ownership is significantly associated with reduced risk of all three forms of intimate partner violence (IPV): physical, sexual, and emotional, highlighting its potential as a protective factor against IPV. Thus, mobile access is increasingly recognized as a foundational enabler of women’s safety and autonomy, especially in resource-constrained or remote settings.
Measurement: Mobile cellular subscriptions (per 100 people). While not specific to women due to a lack of data availability, this indicator serves as a proxy for the overall accessibility and penetration of communication infrastructure in a country. Data were sourced from the International Telecommunication Union (ITU) World Telecommunication/ICT Indicators Database (World Bank, 2026c).
2.3.4. Financial inclusion
Concept: Financial inclusion empowers women economically, giving them greater options to control their income and mobilize resources to protect their safety by accessing services or seeking alternative housing and livelihood arrangements to exit violent relationships. Financial inclusion may have an impact on violence against women, for instance, bank account ownership and joint control over a husband’s income were associated with reduced IPV in a large-scale, longitudinal study in India (Raj et al., Reference Raj, Silverman, Klugman, Saggurti, Donta and Shakya2018). In Pakistan, Naveed et al. (Reference Naveed, Habib and Akhtar2022) found that women’s financial autonomy and ownership of assets protected them from experiencing IPV. Further, Barnes et al. (Reference Barnes, Johnson, Mcatee and Vyas2025) argue that women’s economic rights are a key prevention to conflict-related sexual violence. By contrast, financial insecurity during the Covid pandemic (such as women losing informal employment and income loss of family) has been identified as a risk factor for VAW in several studies (Nimble, Reference Nimble2021; Rasheedh et al., Reference Rasheedh, Dastagir, Khan, Farooq and Saeed2021; UN Women, 2021).
Measurement: Percentage of females with a financial institution account aged 15 years and above. This data is sourced from the Global Findex Database, a comprehensive dataset developed by World Bank (2026b) that provides insights into how adults around the world save, borrow, and make payments.
2.4. External disruptions to safety: Shocks
To capture the external disruptions that may compromise women’s safety, we include three indicators reflecting exposure to conflict and disasters. First, proximity to conflict measures the percentage of a country’s population living within 50 km of conflict zones, indicating potential exposure to instability and insecurity. Conflict zones are defined as having collectively over 25 battle-related deaths per year (per dyad per country) ( Gleditsch et al., Reference Gleditsch, Wallensteen, Eriksson, Sollenberg and Strand2002; Davies et al., Reference Davies, Pettersson, Sollenberg and Öberg2025). Conflict impacts women’s safety through direct impacts and indirect impacts because of the destruction of infrastructure affecting access to protection and resources, the loss of a breadwinner affecting livelihoods, and social roles.
Disaster-related deaths reflect the severity of natural hazards and the strain they place on government resources, often diverting attention and funding away from other societal vulnerabilities, including violence against women. Third, the population affected by disasters captures broader disruptions to daily life and community functioning of such events through displacement, injury, or loss of livelihood.
The disaster indicators are measured as a percentage of the total population, with data sourced from EM-DAT (Centre for Research on the Epidemiology of Disasters (CRED), 2026), while the conflict dataset follows UCDP (n.d.). We include both disaster-related deaths and the number of people affected to capture the full range of disaster impacts. As seen in the data, some types of disasters (i.e., storms, epidemics, and earthquakes) cause high fatalities but affect proportionately fewer people overall, while others (i.e., droughts and floods) disrupt large populations with relatively fewer direct deaths. By including both indicators, we account for the varied nature of disaster impacts and their potential to undermine women’s safety in both acute and prolonged ways.
Conceptually, although these metrics directly measure exposure (proximity to conflict or disaster impact), they also serve as proxies for the broader indirect consequences of conflict and disasters, like the breakdown of safety systems, disrupted services, food insecurity, weakened institutions, and reduced access to healthcare. These secondary effects are not always captured in official statistics, yet heighten women’s vulnerability during and in the aftermath of times of crisis, which we illustrate in Section 4 of the article.
3. Statistical methodology
3.1. Baseline index construction: Equity, Protection, and Resources
In constructing the Index, we follow established methodological guidelines for composite indicators (Kaur and Garg, Reference Kaur and Garg2008). To make each indicator comparable despite differing units and scales, we first apply a min–max normalization that rescales every raw value,
$ {x}_i $
 , to the
$ \left[0,1\right] $
, to the
$ \left[0,1\right] $
 interval:

This ensures that a low raw score always maps near 0 and a high raw score near 1, so each indicator contributes on the same footing. We recognize that this approach is sensitive to extreme values; however, observed outliers were consistent with real country conditions rather than data errors and were therefore retained. Truncating these values would risk understating meaningful cross-national disparities. For indicators where lower raw data values signify better outcomes (e.g., low child-marriage rates indicate better protection), we apply a complementary transformation,
$ \left(1-{x}_i^{\prime}\right) $
 , to ensure that higher indicator values contribute positively to the overall dimension (see Appendix). We have named the indicators to reflect this positive association accordingly.
Within each of the three dimensions, we then compute a simple arithmetic mean of its normalized indicators, treating them as equally important:


Then, the Women’s Safety Index (baseline) is defined as the geometric mean of those three-dimension scores:

Using the geometric mean ensures that poor performance in any one dimension pulls down the composite index, highlighting the need for balanced progress across all three dimensions.
3.2. Modeling the impact of shocks
As above, we normalize and combine the shock indicators into a dimension:

To account for persistence in the effects of shocks over time, we apply an Exponentially Weighted Moving Average (EWMA) to the shock events. This averaging method gives greater weight to more recent shocks while still retaining information from past periods. Formally, the smoothed shock at time
$ t $
 is defined recursively as:

Here,
$ \lambda $
 is a smoothing factor between 0 and 1 that determines the relative weight given to recent versus past shocks. This approach reflects the idea that the impact of shocks on women’s safety may persist past the shock event itself, and diminish gradually over time.
3.3. Final index construction: Incorporating the impact of shocks
Finally, we build up to the final formulation of the Women’s Safety Index by introducing each of its key components step by step. We treat external shocks separately from the baseline Women’s Safety Index (WSI) to preserve the conceptual integrity of the Equity, Protection, and Resources (EPR) dimensions as enduring foundations of women’s safety. Shocks, by contrast, represent short- to medium-term disruptions in safety with potentially lasting effects.
Rather than introducing shocks as a fourth dimension, we instead adjust the baseline Index for the impact of shocks using a difference model:

Here,
$ \alpha $
 is a scaling parameter reflecting the sensitivity of women’s safety outcomes to shocks. Taking a Bayesian perspective, we treat
$ \alpha $
is a scaling parameter reflecting the sensitivity of women’s safety outcomes to shocks. Taking a Bayesian perspective, we treat
$ \alpha $
 as an unknown parameter with a uniform prior,
$ \alpha \sim \mathrm{Uniform}\left(0,1\right) $
as an unknown parameter with a uniform prior,
$ \alpha \sim \mathrm{Uniform}\left(0,1\right) $
 , to capture uncertainty in how shocks impact safety. For illustration, we set
$ \alpha =0.5 $
, to capture uncertainty in how shocks impact safety. For illustration, we set
$ \alpha =0.5 $
 . See Appendix Figure A2 for examples showing how the WSI varies across the full range of
$ \alpha $
. See Appendix Figure A2 for examples showing how the WSI varies across the full range of
$ \alpha $
 values.
This formulation reflects the idea that strong foundational safety conditions (captured by Equity, Protection, and Resources) are essential, yet their effectiveness in sustaining overall safety can be disrupted by significant external shocks.
To reflect evidence that countries with stronger baseline safety conditions (captured by the EPR dimensions) are better equipped to withstand shocks, we adjust the impact of shocks using a nonlinear weighting term,
$ {\exp}^{-{WSI}_{baseline}} $
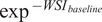 . Incorporating this dynamic scaling factor means that countries with higher baseline safety experience a smaller impact from the same shock.
Finally, the Women’s Safety Index (WSI) is defined by:

See Figure 1 for an illustration of the Index formulation.
Schema for constructing the Women’s Safety Index (WSI).

Figure 1. Long description
The flowchart is organized into three vertical tiers leading to a baseline index, which is then modified by external shocks.
Top Tier: Three light blue boxes contain lists of indicators that are summed and then divided by the number of indicators to create dimensions.
* Left: Education score plus Employment score plus Parliamentary Representation score plus Poverty Alleviation score plus Legal Protection score. This sum is divided by 5 to yield the Equity Dimension.
* Center: Gender-equitable Births score plus Maternal Survival score plus Non-violent Attitudes score plus Child Marriage Absence score. This sum is divided by 4 to yield the Protection Dimension.
* Right: Water Sanitation Access score plus Electricity Access score plus Mobile Phone Use score plus Financial Inclusion score. This sum is divided by 4 to yield the Resources Dimension.
Middle Tier: The Equity, Protection, and Resources Dimensions are combined using a geometric mean, represented by three cube root symbols multiplied together. This yields the Women's Safety Index Baseline.
Bottom Tier: The final index is calculated by subtracting the Impact of Shocks from the W S I Baseline.
* The Impact of Shocks is derived from a fourth box on the right containing Disaster Affected score plus Disaster Deaths score plus Proximity to Conflict score. This sum is divided by 3 and processed through an Exponentially Weighted Moving Average E W M A.
* A mathematical formula beta equals alpha times exponential of negative W S I baseline connects the baseline to the shock impact.
* The final result at the bottom is the Women's Safety Index W S I.
3.3.1. Treatment of missing values
Imputation for partial missingness: For country indicators with partial missingness, missing values are first imputed using linear interpolation between at least two existing values, ensuring a smooth transition between known values. Any remaining missing values in a country’s time series are filled by carrying forward the last known value or carrying backward the first available value, ensuring continuity and completeness in the dataset. In cases where a country has only one available data point for an indicator, we still include it to anchor the indicator for comparative analysis. While this means we cannot observe changes over time for that variable, the single value still provides meaningful insight when comparing across countries.
Imputation for complete missingness: For countries with no data available for an indicator, we use the regional or income-group average. See Table A3 in the Appendix for country-group classifications used. To support transparency, we mark where actual (observed) values are used in the analysis (indicating higher certainty) while inferred values are flagged accordingly. This helps users interpret the data with appropriate caution, especially in observing temporal trends.
3.3.2. Threshold for inclusion
A country must have data for a minimum proportion of indicators (at least 8 of 13 indicators) across the baseline dimensions to be included in the Index. If a country lacks sufficient data, it is excluded from the Index calculation to prevent inaccuracies due to excessive imputation. Figures A6–A12 in the Appendix shows data-missingness visualizations, illustrating the applied threshold and indicating which countries are included or excluded in each region.
4. Assessing the validity of the index
In this part of the article, we aim to validate the utility of the baseline Women’s Safety Index (WSI Baseline) and the final Women’s Safety Index (WSI), including the impact of shocks, with some cross-national, comparative, and country-level analysis. This analysis demonstrates two key arguments: first, that the baseline WSI is a theoretically and empirically grounded proxy for women’s safety; and second, that the WSI can capture shifts in women’s safety, particularly due to the impact of shocks, which may not be fully reflected in the baseline Index alone.
We have suggested that the WSI Baseline and its three dimensions of Equity, Protection, and Resources are a good measure of safety. If that is the case, we would expect higher country scores on the WSI Baseline to be associated with lower prevalence of VAW, acknowledging that reported/measured violence is not actual violence but remains a useful proxy, nonetheless. To test this assumption, we analyzed the bivariate relationship between countries’ WSI Baseline scores and a key indicator of women’s safety: the prevalence of intimate partner violence (IPV). IPV is defined as the percentage of ever-partnered women aged 15–49 years who experienced physical violence, sexual violence, or both by a current or former intimate partner within the previous 12 months. We used the 2018 data (the year with the most comprehensive global coverage) based on modeled estimates produced by the United Nations Inter-Agency Working Group on Violence Against Women Estimation and Data (VAW-IAWGED). As shown in Figure 2, lower WSI Baseline estimates for each country are indeed associated with higher modeled estimates of IPV prevalence (which, by definition, equates to poor safety). The figure shows a clear overall pattern whereby higher levels of women’s safety are associated with lower prevalence of intimate partner violence. The bivariate analysis reveals a strong negative linear correlation
$ \left(r=-0.77\right) $
 , with the fitted regression line given by
$ y=-0.77x+85.99 $
, with the fitted regression line given by
$ y=-0.77x+85.99 $
 (see Appendix Figure A4 for additional dimension-level plots). This association provides empirical support for the WSI baseline as a valid and policy-relevant measure of women’s safety.
Intimate partner violence: Proportion of women (%) subjected to physical and/or sexual violence in the last 12 months, against the Women’s Safety Index score, per country (colored by global region). Countries with lower WSI Baseline scores tend to exhibit higher modeled prevalence of intimate partner violence, reflecting poorer safety conditions. The bivariate association indicates a strong negative linear relationship
$ \left(r=-0.77\right) $
 .
.
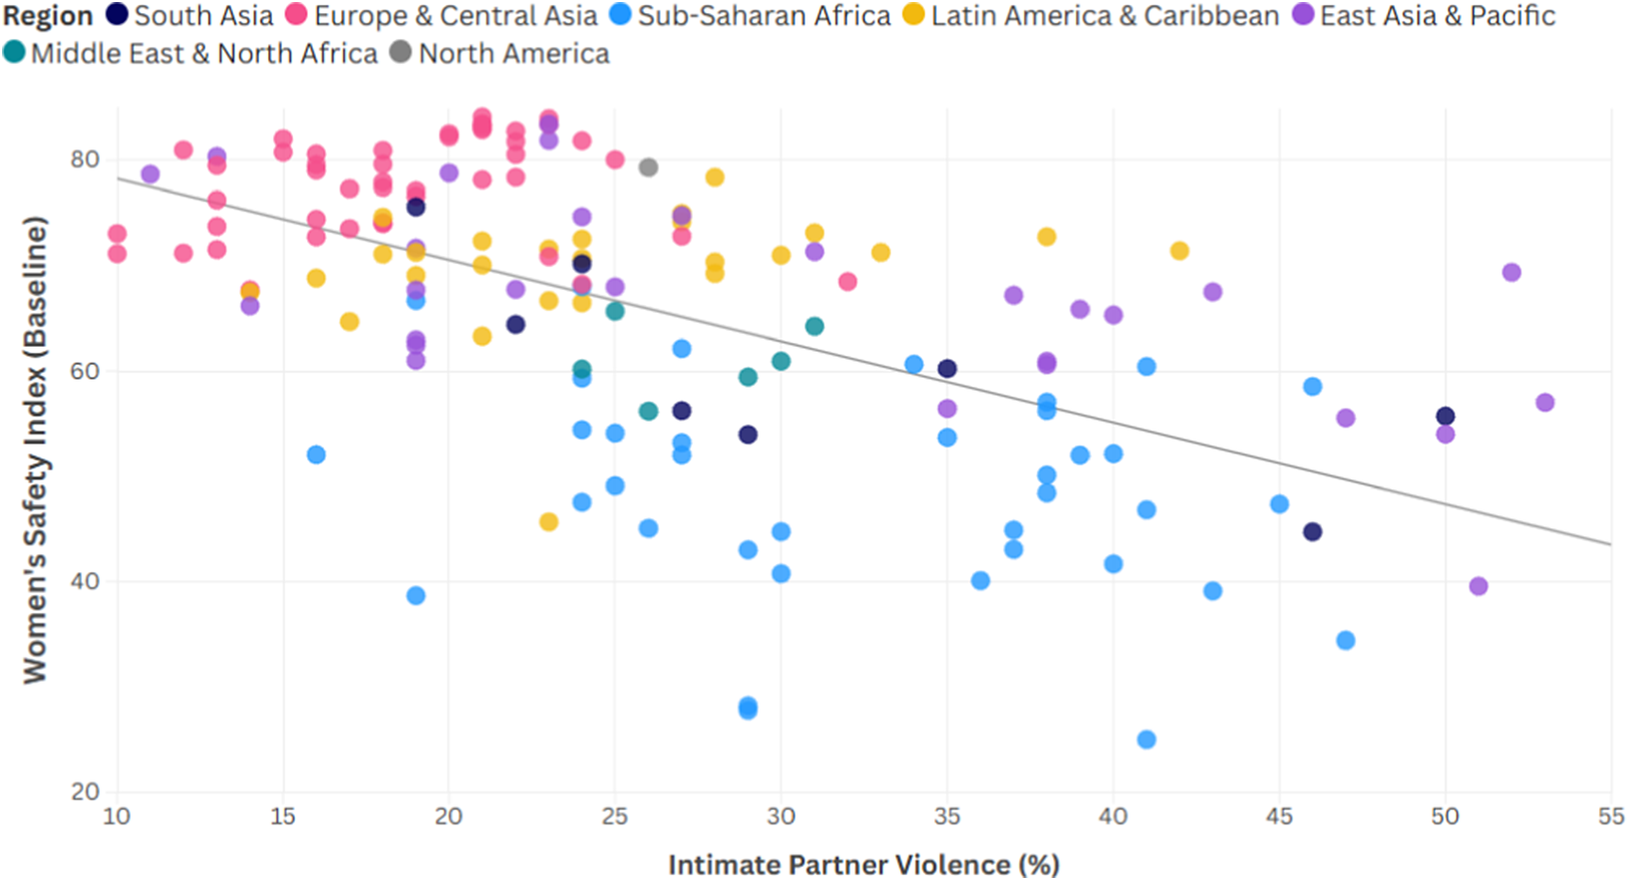
Figure 2. Long description
The scatter plot uses a horizontal X axis representing Intimate Partner Violence percentage ranging from 10 to 55 and a vertical Y axis representing the Women's Safety Index Baseline score ranging from 20 to 80. A downward sloping regression line indicates that as violence increases, safety scores decrease.
Data points are color-coded by region.
* Europe and Central Asia points (pink) are concentrated in the top-left quadrant, showing high safety scores between 70 and 85 and low violence rates between 10 and 25 percent.
* Sub-Saharan Africa points (light blue) are primarily located in the bottom-right quadrant, with safety scores ranging from 25 to 60 and violence rates between 25 and 50 percent.
* Latin America and Caribbean points (yellow) and East Asia and Pacific points (purple) are scattered across the middle of the trend line.
* South Asia (dark blue), Middle East and North Africa (teal), and North America (grey) points are also distributed along the central and upper portions of the regression line.
The overall distribution confirms a strong negative correlation where lower W S I scores correspond to higher modeled prevalence of intimate partner violence.
Notably, countries in South Asia, East Asia, and Pacific regions display a broad range of IPV values, making it a particularly informative region for examining how variations in safety conditions may relate to violence.
Regression analyses (Appendix Figure A5) show that WSI scores explain additional variation in intimate partner violence beyond GDP per capita. While economic development supports women’s safety, the WSI provides a gender-specific lens that highlights persistent vulnerabilities, offering insights beyond conventional development metrics. Analyses begin with GDP-only models and extend to models, including WSI; full specifications, results, and residual diagnostics are provided in the Appendix. Further robustness checks used principal component analysis (PCA) to assess the validity of the index dimensions. Results, including an alternative PCA-based weighting comparison and indicator correlations, are presented in the Appendix (Figures A1 and A3).
Next, we have claimed that the WSI Baseline is incomplete as a measure of women’s safety during times of shock, as it does not account for the additional impacts (and duration) that various shocks have on safety. A study of natural disasters occurring in 141 countries between 1981 and 2002 (Neumayer and Plümper, Reference Neumayer and Plümper2007, 551) found that disasters lower the life expectancy of women drastically more than that of men. In their words, it is “the socially constructed gender-specific vulnerability of females built into everyday socioeconomic patterns that leads to the relatively higher female disaster mortality rates.” Where there is greater gender equality, the gap between women’s and men’s expected mortality is less (True, Reference True2012, 164). For instance, natural and climate-induced disasters impact communities through death/injury, displacement, loss of infrastructure, services and income, and through increases in violence against women. An example of this impact was the December 2004 Indian Ocean, “Asian” Tsunami, which affected 14 countries, with Indonesia and Sri Lanka being the most impacted (True, Reference True2012, 168-173). The Tsunami resulted in nearly 300,000 deaths, with many more deaths of women and children than men. During and after this disaster, there was a large increase in reports of physical abuse, rape, and forced and early marriage of women (Oxfam International, 2005; Felten-Biermann, Reference Felten-Biermann2006; Fisher, Reference Fisher2010). Both the visibility of women and girls’ experiences of violence during the Asian Tsunami and the documented gender discrimination in aid delivery and compensation for recovery led to greater attention to women’s safety, and societal equity, protection, and resources to address it. Given the large scale of this disaster, some but not all impacts of the Tsunami, are visible in country baseline EPR scores for Indonesia, for instance, access to electricity declined and poverty rates increased as shown in Figure 3.
Normalized indicator scores by dimension for Indonesia. The gray shaded area (2004–2006) marks the aftermath of the 2004 Asian Tsunami. During this period, both Poverty Alleviation (Equity) and Electricity Access (Resources) declined, followed by a subsequent recovery.

Figure 3. Long description
The figure consists of three panels titled Equity Indicators, Protection Indicators, and Resources Indicators. All panels share a horizontal X axis for Year ranging from 1995 to 2024 and a vertical Y axis for Score ranging from 0.00 to 1.00. A vertical gray shaded region spans 2004 to 2006 across all graphs.
* Left Panel: Equity Indicators. Poverty Alleviation shows a sharp rise around 2002, a dip during the gray period, and a steady climb to nearly 1.00. Education and Legal Protection remain stable near 0.50. Employment stays flat around 0.50. Parliamentary Representation remains the lowest, fluctuating between 0.00 and 0.25.
* Middle Panel: Protection Indicators. Non-violent Attitudes and Maternal Survival maintain high, stable scores between 0.75 and 1.00. Child Marriage Absence shows a gradual upward trend from 0.60 to 0.75. Gender-Equitable Births remains flat at approximately 0.65.
* Right Panel: Resources Indicators. Electricity Access starts at 0.65 and reaches nearly 1.00 by 2024. Water Sanitation Access shows a linear increase from 0.50 to 0.90. Cell Phone Use starts at 0.00 and rises sharply after 2005 to 0.40. Financial Inclusion remains at 0.20 until 2010, then climbs to 0.50 by 2017 and plateaus.
However, disasters can be more localized and shorter in duration, and thus unlikely to affect the slow-moving national aggregate measures of Equity, Protection, and Resources. Yet, we need to be able to account for their impacts on women’s safety. We also need to account for the shocks that have a longer duration, such as prolonged droughts due to changes in weather patterns. The final WSI (adjusted for shocks) is precisely designed to capture such safety impacts from disasters. During and after a shock, by construction, the WSI drops (in proportion to the magnitude of the shock) to reflect the systemic disruption that typically occurs and its impact on women’s safety.
We can further validate shock adjustment to the WSI baseline to account for women’s safety with research evidence on the effects of conflict on violence against women. Conflict shocks are frequently associated with deterioration in women’s safety, as shown by reports of sexual and gender-based violence against women and girls during armed conflict (Wood, Reference Wood2006; Davies et al., Reference Davies, True, Morales, Oo, Osei-Tutu and Banfield2024). Stojetz and Brück (Reference Stojetz and Brück2023) find that exposure to wartime collective gender-based violence in Angola caused intimate partner violence by ex-combatants in the long run. Reports of sexual violence continue into the post-conflict period, sometimes at very high levels (Cohen and Nordås, Reference Cohen and Nordås2014), indicating an enduring impact on women’s safety, which the final WSI aims to capture.
In Sri Lanka, for example, there was an intense period of fighting before the end of the war in May 2009. As the Sri Lankan government mobilized 300,000 troops to enter the North province to wipe out the LTTE and end the civil war, an estimated 40,000 civilians were killed due to shelling and direct fire, and atrocities including rape and other sexual violence were perpetrated on women and men combatants and civilians (OHCHR, 2015). The LTTE had also abducted girls for forced marriage and combat and forcibly detained women and children as “human shields” (Watch, Reference Watch2013; Davies and True, Reference Davies and True2017). Figure 4 shows that between 2005 and 2009, the WSI (baseline) rises from 61.9 to 65.6, while the overall WSI declines from 53.7 to a low of 52.4, reflecting the disruption to safety during conflict as documented in the evidence above.
Trends in the Women’s Safety Index (WSI) and WSI baseline in Sri Lanka, 2000–2024. While the baseline Index rises from 61.9 (2005) to 65.6 (2009), the overall WSI declines from 53.7 (2005) to 52.8 (2008), capturing the deterioration in women’s safety during the period of intense conflict.

Figure 4. Long description
The X-axis represents the Year from 2000 to 2024. The Y-axis represents the Index Score ranging from 30 to 80.
Two data series are plotted:
* W S I Baseline: A dark blue line that shows a steady linear increase from approximately 60 in 2000 to just over 70 by 2024.
* W S I: A light blue shaded area under a line that starts at approximately 49 in 2000. It shows a slight decline between 2005 and 2008, followed by a significant upward inflection point around 2009. From 2010 to 2015, the line rises steeply, eventually converging with the baseline around 2020.
The gap between the two lines is widest between 2000 and 2010, narrowing significantly after 2010 until they nearly overlap in the final five years of the chart.
Lastly, countries with higher positive scores related to Equity, Protection, and resources are expected to have less violence against women, a smaller range of types of VAW, and to be able to reduce the likelihood of increased or exacerbated VAW during and after shocks. For instance, in countries experiencing a similar shock, the impact on VAW will depend on its WSI Baseline. The Equity, Protection, and Resources dimensions can either exacerbate or buffer the impact of shocks on women’s safety. To illustrate this argument, consider two countries experiencing a similar geophysical shock in scale/depth: Haiti and the 2010 earthquake, New Zealand and the 2011 Christchurch earthquake. In the case of New Zealand, domestic violence services and women’s shelters were already considered frontline essential services and part of disaster planning (Collins, Reference Collins2006; Houghton, Reference Houghton2009). In addition, there was a spontaneous societal response to protect at-risk groups and preexisting institutional networks and infrastructure that facilitated women’s protection from violence in the immediate aftermath of the earthquake. By contrast, in Haiti, the lack of disaster planning and governance, dependence on international aid, and limited services available for victim-survivors of violence exacerbated the earthquake’s impacts on women (Schuller, Reference Schuller2015). Recovery efforts further increased VAW with humanitarian workers perpetrating abuse in the context of weak protection and widespread impunity (The Guardian, 2018).
New Zealand’s existing societal structures, reflected in the relatively high WSI baseline, mitigated the impacts of the shock on women’s safety and recovery (True, Reference True2013). However, Haiti’s poor access to resources and societal equity and protections, reflected in the country’s low WSI baseline, contributed to a severe deterioration in women’s safety during and after the earthquake shock. Weitzman and Behrman (Reference Weitzman and Behrman2016) found that exposure to the earthquake devastation increased the probability of both physical and sexual IPV 1–2 years following the disaster, negatively affecting women’s access to social networks. Displacement was also positively associated with IPV in particular. These comparative findings provide new insights into the multidimensional effects of shocks on women’s safety, validating the assumptions built into the final WSI model.
Open-source index construction
To facilitate full transparency and replication, and further research, all materials used in the construction and analysis of the Index are openly available. The complete codebase, including scripts for processing raw data inputs, constructing the index, and reproducing the empirical analysis reported in the Appendix, is hosted on GitHub (https://github.com/KatieBuc/WSI). The full index, dimensions, and indicators dataset are also accessible via Bridges (Buchhorn et al., Reference Buchhorn, True, Davies, Mahmood and Oo2025a). A companion website has also been developed to support the translation and broader dissemination of the index and its applications on cevaw-evidence.org. This data platform provides interactive access to the Index, alongside country profiles, visualizations, and extended analytical outputs that demonstrate potential applications of the data. Together, these resources are intended to facilitate further development, comparative research, and policy-relevant analysis and applications using the Global Women’s Safety Index.
5. Conclusion
The baseline and final Women’s Safety Index (WSI) facilitate analysis and insight on women’s safety across countries and across time. By anchoring the Index in both theory and evidence, we aim to establish its value not only for retrospective analyses but also for forward-looking applications. Specifically, the WSI can serve as a reliable indicator in contexts where direct data on violence against women (VAW) is unavailable, delayed, or underreported—offering an empirically informed estimate of likely impacts.
In addition to consolidating and making the secondary data publicly available, the Women’s Safety Index is published on a dedicated platform with full exploratory and data visualization capabilities. Users will be able to interact with the data through comparative tools, enabling them to explore trends across countries, regions, and years. With these tools, we aim not only to deepen understanding of women’s safety worldwide, but also to support more timely, targeted, and evidence-based responses where women’s safety is most at risk.
Researchers and stakeholders can use the Index to generate, explore, and test many different hypotheses with the secondary data brought together as indicators of equity, protection, and resources in this global Index. Country scores on the WSI can be explored and enriched with qualitative analyses and comparative analyses of patterns of violence against women and/or women’s vulnerability to violence. Investigating how changes in WSI scores correspond with real-world experiences during and after crises can generate new insights into the structural drivers of women’s safety and the pathways through which shocks impact vulnerability. Ultimately, the WSI aims to advance both research and action, providing a vital tool for anticipating risk, informing policy, and improving outcomes for women everywhere.
Data availability statement
Replication data and code can be found on GitHub (Buchhorn et al., Reference Buchhorn, True, Davies, Mahmood and Oo2025b). Digital data platform: https://www.cevaw-evidence.org/, source of map visualization in Figure A13.
Author contribution
Conceptualization-Equal: J.T., S.D.; Data Curation-Equal: K.B.; Formal Analysis-Equal: K.B.; Methodology-Equal: K.B., J.T., S.D.; Software-Equal: K.B.; Visualization-Equal: K.B.; Writing – Original Draft-Equal: K.B., J.T., S.D., R.M., P.P.O.; Writing – Review & Editing-Equal: K.B., J.T., S.D., R.M., P.P.O.
Funding statement
This research was conducted by the Australian Research Council Centre of Excellence for the Elimination of Violence Against Women (Project number CE230100004) and funded by the Australian Government.
Competing interests
The authors declare none.
Appendix
A. Complimentary transform
We define a complementary score transformation as:
$ 1-x $
 . For the following indicators, the data inputs required transformation to ensure that higher values contribute positively to the overall dimension: Poverty Alleviation, Gender-Equitable Births, Maternal Survival, Non-Violent Attitudes, and Child Marriage Absence. For example, in the Protection dimension, the percentage of child marriage is a metric where lower values signify stronger protection. Taking the complement ensures that as protection improves (i.e., instances of child marriage decrease), the indicator values contribute positively to the overall dimension, maintaining alignment between the indicator values and the concept it represents.
A.1. Principal component analysis of baseline index indicators
A principal component analysis (PCA) of the Index indicators was conducted to explore the underlying structure of the data. Most indicators load positively onto the first principal component (PC1), suggesting a common latent dimension related to women’s safety. Loadings on PC1 range from –0.08 to 0.49, with higher values for indicators in the Resources dimension, while PC2 aligns more closely with Equity indicators (see Figure A1). Together, the first three components explain 78.42% of the total variance.
Internal consistency was high for Resources (Cronbach’s
$ \alpha $
 = 0.86), moderate for Equity (
$ \alpha $
= 0.86), moderate for Equity (
$ \alpha $
 = 0.62), and lower for Protection (
$ \alpha $
= 0.62), and lower for Protection (
$ \alpha $
 = 0.45), likely reflecting limited variability and data sparsity across some of the Protection indicators. This relatively low value of Cronbach’s alpha for the Protection pillar reflects the multidimensional nature of Protection, which includes indicators capturing gender-equitable births, maternal survival, attitudes against violence, and child marriage. These indicators measure related but conceptually distinct aspects of women’s protection, and thus some degree of heterogeneity is expected. Low alpha values are common and considered acceptable in composite indices that are intentionally multidimensional, where the aim is to capture multiple distinct but theoretically related constructs rather than a single latent trait (Streiner, Reference Streiner2003). While a low alpha signals that the indicators are not highly intercorrelated, it does not undermine the theoretical or empirical relevance of the pillar. For transparency and further assessment, we present the correlation matrices of the individual indicators within each pillar in Figure A3.
Principal component loadings for each indicator in the Women’s Safety Index.

Figure A1. Long description
The heatmap consists of two rows labeled P C 1 and P C 2 on the y-axis and twelve columns on the x-axis. A color scale on the right indicates that dark blue represents high positive values around 0.4, white represents 0.0, and orange represents negative values down to negative 0.2.
Row 1, P C 1 loadings from left to right.
* Education: 0.19
* Employment: 0.015
* Parliamentary Representation: 0.053
* Poverty Alleviation: 0.31
* Legal Equity: 0.18
* Gender-Equitable Births: negative 0.081
* Maternal Survival: 0.23
* Non-violent Attitudes: 0.2
* Child Marriage Absence: 0.27
* Water Sanitation Access: 0.45
* Electricity Access: 0.49
* Cell Phone Use: 0.15
* Financial Inclusion: 0.44
Row 2, P C 2 loadings from left to right.
* Education: negative 0.0067
* Employment: 0.55
* Parliamentary Representation: 0.19
* Poverty Alleviation: negative 0.21
* Legal Equity: 0.52
* Gender-Equitable Births: 0.099
* Maternal Survival: negative 0.11
* Non-violent Attitudes: negative 0.051
* Child Marriage Absence: negative 0.0092
* Water Sanitation Access: negative 0.17
* Electricity Access: negative 0.29
* Cell Phone Use: 0.13
* Financial Inclusion: 0.45
A.2. Robustness and sensitivity checks
To assess robustness, we also constructed a PCA-based version of the Index. Trends over time and across countries were found to be broadly consistent with the equally weighted version, with a strong correlation (r = 0.982), supporting the reliability of the Index.
Women’s Safety Index (WSI) over time for selected countries (Indonesia, Sri Lanka, and Cambodia). The plots show WSI adjusted for the impact of shocks for a range of
$ \alpha $
 values (0, 0.25, 0.5, 0.75, and 1.0), with colored lines representing different
$ \alpha $
values (0, 0.25, 0.5, 0.75, and 1.0), with colored lines representing different
$ \alpha $
 .
.

Figure A2. Long description
A three-panel line graph displays the Women’s Safety Index, or W S I, shock-adjusted over time. The x-axis represents Year from 1995 to 2024. The y-axis represents W S I shock-adjusted on a scale from 0 to 100. A solid black line represents the Baseline W S I in all panels.
* Panel 1 Indonesia. The baseline shows a steady linear increase from approximately 48 in 1995 to 70 in 2024. The colored lines for alpha values 0, 0.25, 0.5, 0.75, and 1.0 are tightly clustered and nearly identical to the baseline starting from the year 2000.
* Panel 2 Sri Lanka. The baseline starts at 60 and remains relatively flat until 2010, then rises to 70 by 2024. Between 2000 and 2012, there is significant divergence. The alpha 0 line is closest to the baseline. As alpha increases to 1.0, the lines drop lower, with alpha 1.0 reaching a trough near 38 around the year 2000 before gradually converging back to the baseline by 2015.
* Panel 3 Cambodia. The baseline starts at 32, dips slightly in 1999, then rises steadily to 65 by 2024. Similar to Sri Lanka, there is a divergence between 2000 and 2005 where higher alpha values show lower W S I scores, with alpha 1.0 dipping to approximately 25 before all lines converge with the baseline by 2010.
A legend at the bottom identifies alpha 0 as dark blue, alpha 0.25 as light orange, alpha 0.5 as green, alpha 0.75 as pink, and alpha 1.0 as purple.
Correlation matrix between each indicator in the Women’s Safety Index.

Figure A3. Long description
A heatmap displays the Pearson correlation coefficients between 12 indicators. A vertical color bar on the right ranges from negative 0.4 in dark red to 1.0 in dark blue, with 0.0 in white. The matrix is divided by thick black lines into a 3 by 3 grid of thematic blocks.
Clusters and Indicators:
* Equity: Education, Employment, Parliamentary Representation, Poverty Alleviation, and Legal Equity.
* Protection: Gender-Equitable Births, Maternal Survival, Non-violent Attitudes, and Child Marriage Absence.
* Resources: Water Sanitation Access, Electricity Access, Cell Phone Use, and Financial Inclusion.
Key Data Trends:
* The diagonal from top-left to bottom-right consists of dark blue squares with a value of 1, representing each indicator's correlation with itself.
* Strong positive correlations (dark blue, 0.7 to 0.93) are concentrated in the Resources block, particularly between Water Sanitation Access and Electricity Access (0.93) and Poverty Alleviation and Electricity Access (0.85).
* Gender-Equitable Births shows consistent negative correlations (red) with almost all other indicators, ranging from negative 0.09 to negative 0.43.
* Employment and Parliamentary Representation show the weakest correlations overall, with many values near 0.0 (white or light orange/blue).
Scatter plots of intimate partner violence (IPV, % of women subjected to physical and/or sexual violence in the last 12 months) against the Women’s Safety Index, and its dimensions Equity, Protection, and Resources, per country, colored by global region. Linear fits are shown in dashed black lines, and the Pearson correlation coefficient
$ (r) $
 is reported for each. The plots illustrate that countries with higher WSI/dimension scores generally have lower IPV prevalence.

Figure A4. Long description
A four-panel scatter plot grid. The shared horizontal axis is Intimate Partner Violence I P V percentage, ranging from 0 to 60. The shared vertical axis is Dimension or Index score, ranging from 0 to 100. A legend in the center-right identifies seven global regions by color.
* Top-left panel Equity. A dashed black line shows a negative linear trend with r equals minus 0.51. Data points are concentrated between 10 and 50 on the horizontal axis and 40 and 80 on the vertical axis.
* Top-right panel Protection. A dashed black line shows a negative linear trend with r equals minus 0.43. Data points are clustered higher on the vertical axis, mostly between 60 and 95.
* Bottom-left panel Resources. A dashed black line shows a negative linear trend with r equals minus 0.59. This plot shows the steepest decline, with Sub-Saharan Africa points in blue reaching the lowest vertical scores near 10.
* Bottom-right panel Women's Safety Index. A dashed black line shows a negative linear trend with r equals minus 0.58.
Across all panels, Europe and Central Asia in peach and North America in tan are clustered in the top-left (low I P V, high index), while Sub-Saharan Africa in blue and South Asia in dark green are clustered toward the bottom-right (higher I P V, lower index).
A.3. Development indicators and the WSI
To assess the relationship between economic development, women’s safety, and intimate partner violence (IPV), we first estimated a GDP-only regression:

where
$ {\mathrm{IPV}}_i $
 is the prevalence of intimate partner violence and
$ {\mathrm{GDP}}_i $
is the prevalence of intimate partner violence and
$ {\mathrm{GDP}}_i $
 is the gross domestic product per capita for the country
$ i $
is the gross domestic product per capita for the country
$ i $
 . The GDP-only model yielded
$ {R}^2=0.226 $
. The GDP-only model yielded
$ {R}^2=0.226 $
 , indicating that GDP explains roughly 23% of the variation in IPV. The GDP coefficient was small but statistically significant (
$ {\beta}_1=-0.0002 $
, indicating that GDP explains roughly 23% of the variation in IPV. The GDP coefficient was small but statistically significant (
$ {\beta}_1=-0.0002 $
 ,
$ p<0.001 $
,
$ p<0.001 $
 ), suggesting a slight negative association.
We then added the Women’s Safety Index (WSI) to the model:

This extended model increased
$ {R}^2 $
 to 0.328, an improvement of
$ \Delta {R}^2=0.102 $
to 0.328, an improvement of
$ \Delta {R}^2=0.102 $
 , indicating that WSI explains an additional 10% of IPV variation beyond GDP. In this model, the GDP coefficient became nonsignificant (
$ {\beta}_1=-6.9\times {10}^{-5} $
, indicating that WSI explains an additional 10% of IPV variation beyond GDP. In this model, the GDP coefficient became nonsignificant (
$ {\beta}_1=-6.9\times {10}^{-5} $
 ,
$ p=0.135 $
,
$ p=0.135 $
 ), whereas WSI had a strong, significant negative effect (
$ {\beta}_2=-0.345 $
), whereas WSI had a strong, significant negative effect (
$ {\beta}_2=-0.345 $
 ,
$ p<0.001 $
,
$ p<0.001 $
 ). This demonstrates that WSI is not merely a proxy for economic development but captures additional aspects of women’s safety that are relevant for IPV outcomes.
Residual plots further illustrate this pattern. Figure A5 shows residualized IPV values (after removing GDP effects) plotted against residualized WSI values. A clear negative trend indicates that countries with higher WSI than expected based on GDP tend to have lower IPV than expected based on GDP, confirming the independent explanatory power of the WSI.
Scatter of residualized IPV versus residualized WSI (both after removing GDP effects). The negative trend indicates that WSI explains variation in IPV beyond GDP.

Figure A5. Long description
The chart is titled Partial regression W S I controlling for G D P. The horizontal x-axis is labeled W S I residuals with a scale from negative 30 to 10. The vertical y-axis is labeled I P V residuals with a scale from negative 10 to 20. A dense cluster of blue circular data points is concentrated between negative 10 and 10 on the x-axis. A solid black regression line starts at approximately 11 on the y-axis when x is negative 30 and slopes downward to approximately negative 5 on the y-axis when x is 13. The data points are widely dispersed around the line in the negative x-range and become more tightly packed as the x-values increase toward 10.
A.4. Global Women’s Safety Index scores
Table 3 presents the Global Women’s Safety Index (WSI) scores for countries globally by region, illustrating both historical and contemporary conditions of women’s safety. The table includes baseline WSI scores from 1995, baseline WSI scores for 2024, and the most recent WSI (shock-adjusted) measurements where available. Blank entries indicate that no index was computed, due to data missingness in the underlying indicators.
Equity, protection, and resources indicators

Table A1. Long description
The table is organized into three main sections.
1. Equity Section:
- Education: Ratio of female to male mean years of schooling for population aged 25 plus. Source: UNESCO Institute for Statistics (U I S).
- Employment: Female employment-to-population ratio for women aged 25 to 64. Source: International Labour Organisation (I L O S T A T).
- Parliamentary representation: Women’s share of seats in national parliament. Source: Inter-Parliamentary Union (I P U) Parline.
- Poverty alleviation: Population below international poverty line. Source: World Bank, World Development Indicators.
- Legal equity: Legal discrimination indicators across mobility, workplace, pay, marriage, parenthood, entrepreneurship, assets, and pension. Source: World Bank, Women, Business and the Law (W B L).
2. Protection Section:
- Gender-equitable births: Ratio of boys to girls at birth. Source: United Nations, World Population Prospects (W P P).
- Maternal mortality: Maternal deaths per 100,000 live births. Source: United Nations, S D G Indicators.
- Non-violent attitudes: Percentage of population agreeing that a man is justified in beating his wife. Source: World Values Survey.
- Child marriage absence: Percentage of women aged 20 to 24 first married by age 18. Source: United Nations, S D G Indicators.
3. Resources Section:
- Water and sanitation access: Weighted population using basic drinking water and sanitation services. Source: World Bank, Gender Statistics.
- Electricity access: Percentage of population with access to electricity. Source: World Bank, World Development Indicators.
- Cell phone use: Mobile cellular subscriptions per 100 people. Source: World Bank and International Telecommunication Union (I T U).
- Financial inclusion: Percentage of females aged 15 plus with a financial institution account. Source: World Bank, Global Findex Database.
Shock exposure indicators
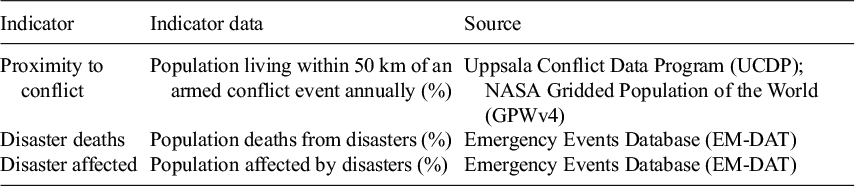
Table A2. Long description
The table consists of three columns: Indicator, Indicator data, and Source.
Row 1: The indicator is Proximity to conflict. The indicator data is the percentage of the population living within 50 km of an armed conflict event annually. The sources are the Uppsala Conflict Data Program U C D P and NASA Gridded Population of the World G P W v 4.
Row 2: The indicator is Disaster deaths. The indicator data is the percentage of population deaths from disasters. The source is the Emergency Events Database E M dash D A T.
Row 3: The indicator is Disaster affected. The indicator data is the percentage of the population affected by disasters. The source is the Emergency Events Database E M dash D A T.
Global Women’s Safety Index scores

Table A3. Long description
The table contains six columns: Region, I S O code, Economy, W S I baseline 1995, W S I baseline 2024, and W S I 2024. Data is organized by region:
* East Asia and Pacific: Scores range from a 1995 low of 31.9 in Papua New Guinea to a 2024 high of 83.9 in New Zealand. Notable increases include Cambodia from 32.4 to 66.0 and Vietnam from 55.7 to 71.6.
* Europe and Central Asia: This region shows high overall scores. Denmark and Finland lead with 2024 scores of 84.3 and 84.5 respectively. Significant improvements are seen in Moldova from 57.6 to 76.6 and Uzbekistan from 51.7 to 69.8.
* Latin America and Caribbean: Scores are generally in the 60s and 70s. Haiti has the lowest score in the region at 43.0 for 2024. Uruguay and Argentina both score 76.5 in 2024.
* Middle East and North Africa: The United Arab Emirates has the highest 2024 score at 80.2. Conflict-affected areas show declines or low scores, such as Yemen at 29.2 and Syria at 37.4.
* North America: Canada and the United States show stable high scores, both reaching 81.0 or higher in 2024.
* South Asia: Scores vary widely, with Afghanistan at the lowest 2024 score of 29.0 and Maldives at the highest for the region at 74.8.
* Sub-Saharan Africa: This region contains the lowest overall scores, including South Sudan at 25.5 and Chad at 31.6. However, some nations like Mauritius 72.9 and Seychelles 75.8 show significantly higher safety indices.
A.5. Data missingness and inclusion threshold applied
If data are missing for a country but available for others within the same geographic or economic group, we impute using the mean of that group. For each region, the figures show missing indicator data by country and indicate how the inclusion threshold was applied to determine which countries are included in the Index calculation.
Data availability overview for indicators related to the baseline Women’s Safety Index in East Asia and Pacific countries.

Figure A6. Long description
A heatmap titled Data Missingness: East Asia and Pacific. The vertical Y-axis lists I S O codes for 40 countries from A S M at the top to W S M at the bottom. The horizontal X-axis lists 14 indicators: Education, Employment, Parliamentary Representation, Poverty Alleviation, Legal Equity, Gender-Equitable Births, Maternal Survival, Non-violent Attitudes, Child Marriage Absence, Water Sanitation Access, Electricity Access, Cell Phone Use, Financial Inclusion, and a final column for Included in Index.
Data Presence is categorized by four colors: dark green for 2 plus datapoints, light green for 1 datapoint, light gray for 0 datapoints, and white with diagonal black stripes for Imputed data. The Included in Index column uses blue for Yes and pink for No.
Key observations:
- Gender-Equitable Births, Water Sanitation Access, and Electricity Access show the highest data density with almost all countries having 2 plus datapoints.
- Non-violent Attitudes and Child Marriage Absence show significant data gaps or imputation across many countries.
- Countries like A U S, J P N, and N Z L have nearly complete dark green rows.
- Small island nations and territories such as A S M, C O K, G U M, and N I U have high levels of missing data (light gray) and are mostly marked pink (No) in the final column.
- The Included in Index column shows a mix of blue and pink, with approximately 60 percent of the listed countries included in the final calculation.
Data availability overview for indicators related to the baseline Women’s Safety Index in Sub-Saharan African countries.

Figure A7. Long description
A heatmap titled Data Missingness Sub-Saharan Africa. The horizontal X-axis lists 14 indicators: Education, Employment, Parliamentary Representation, Poverty Alleviation, Legal Equity, Gender-Equitable Births, Maternal Survival, Non-violent Attitudes, Child Marriage Absence, Water Sanitation Access, Electricity Access, Cell Phone Use, Financial Inclusion, and a final column for Included in Index. The vertical Y-axis lists 48 I S O country codes from A G O at the top to Z W E at the bottom.
Data Presence Legend:
* Dark green: 2 plus datapoints.
* Light green: 1 datapoint.
* White: 0 datapoints.
* Diagonal black stripes: Imputed data.
Key Observations:
* The majority of the grid is dark green, showing high data availability.
* The Non-violent Attitudes column shows the highest missingness, with most countries represented by diagonal stripes indicating imputed data.
* Education, Employment, and Poverty Alleviation show scattered light green or striped cells for countries like B W A, C A F, E R I, G A B, and G N Q.
* Financial Inclusion has several imputed cells in the lower half of the chart, including S T P, S Y C, and S W Z.
* The final column, Included in Index, is a solid blue bar for all countries, with the legend indicating Yes in blue and No in pink.
Data availability overview for indicators related to the baseline Women’s Safety Index in Europe and Central Asian countries.

Figure A8. Long description
A heatmap grid titled Data Missingness Europe and Central Asia. The vertical Y-axis lists 54 country I S O codes from A L B at the top to X K X at the bottom. The horizontal X-axis lists 14 indicators: Education, Employment, Parliamentary Representation, Poverty Alleviation, Legal Equity, Gender-Equitable Births, Maternal Survival, Non-violent Attitudes, Child Marriage Absence, Water Sanitation Access, Electricity Access, Cell Phone Use, and Financial Inclusion. A final column is titled Included in Index.
Data Presence Legend:
* Dark green: 2 plus datapoints.
* Light green: 1 datapoint.
* White: 0 datapoints.
* Diagonal black stripes: Imputed data.
Included in Index calculation Legend:
* Blue: Yes.
* Pink: No.
Key observations:
* Most cells are dark green, indicating high data availability.
* Non-violent Attitudes and Child Marriage Absence show the highest frequency of imputed data (diagonal stripes) or missing data (white).
* Countries like C H I, F R O, G I B, G R L, I M N, M C O, and X K X have significant horizontal bands of white (missing data) and are marked pink in the final column, indicating they are not included in the index.
* The majority of countries are marked blue in the final column, indicating inclusion in the index calculation.
Data availability overview for indicators related to the baseline Women’s Safety Index in Latin America and Caribbean countries.

Figure A9. Long description
A heatmap titled Data Missingness Latin America and Caribbean. The vertical Y-axis lists 44 I S O country codes from A B W at the top to V I R at the bottom. The horizontal X-axis lists 14 indicators: Education, Employment, Parliamentary Representation, Poverty Alleviation, Legal Equity, Gender-Equitable Births, Maternal Survival, Non-violent Attitudes, Child Marriage Absence, Water Sanitation Access, Electricity Access, Cell Phone Use, Financial Inclusion, and a final column for Included in Index.
Data Presence Legend:
* Dark green: 2 plus datapoints.
* Light green: 1 datapoint.
* Light gray: 0 datapoints.
* Diagonal black stripes: Imputed data.
Included in Index Legend:
* Blue: Yes.
* Pink: No.
Key Observations:
* Water Sanitation Access, Electricity Access, and Cell Phone Use show the highest data density with almost universal dark green coverage.
* Non-violent Attitudes and Financial Inclusion show significant amounts of imputed data (striped) or missing data (gray) across many countries.
* The Included in Index column on the far right shows that countries like A R G, B O L, B R A, C H L, C O L, C R I, D O M, E C U, G T M, H N D, M E X, P A N, P E R, P R Y, S L V, and U R Y are included (blue), while many smaller island nations or territories are excluded (pink).
Data availability overview for indicators related to the baseline Women’s Safety Index in Middle East and North African countries.

Figure A10. Long description
A heat map titled Data Missingness Middle East and North Africa. The Y-axis lists I S O codes for 20 countries including A R E, B H R, D J I, D Z A, E G Y, I R N, I R Q, I S R, J O R, K W T, L B N, L B Y, M A R, O M N, P S E, Q A T, S A U, S Y R, T U N, and Y E M. The X-axis lists 13 indicators. Education, Employment, Parliamentary Representation, Poverty Alleviation, Legal Equity, Gender-Equitable Births, Maternal Survival, Non-violent Attitudes, Child Marriage Absence, Water Sanitation Access, Electricity Access, Cell Phone Use, and Financial Inclusion. A final column on the right is titled Included in Index.
Data Presence Legend.
* Dark green square. 2 plus datapoints.
* Light green square. 1 datapoint.
* White square. 0 datapoints.
* White square with diagonal black stripes. Imputed.
Included in Index calculation Legend.
* Blue square. Yes.
* Pink square. No.
Data Trends.
* Most indicators show high data presence (dark green) across all countries.
* Non-violent Attitudes and Child Marriage Absence show the highest frequency of missing or imputed data, particularly for A R E, B H R, I S R, K W T, L B Y, O M N, and S A U.
* Poverty Alleviation has imputed data for B H R, K W T, L B Y, O M N, and Q A T.
* Education is imputed for L B Y and M A R.
* All countries are marked with a solid blue bar in the final column, indicating they are all included in the index calculation.
Data availability overview for indicators related to the baseline Women’s Safety Index in North American countries.

Figure A11. Long description
The chart features a vertical Y axis labeled I S O Code with two rows for C A N and U S A. The horizontal X axis lists 14 indicators and a final column for index inclusion.
Indicators from left to right are Education, Employment, Parliamentary Representation, Poverty Alleviation, Legal Equity, Gender-Equitable Births, Maternal Survival, Non-violent Attitudes, Child Marriage Absence, Water Sanitation Access, Electricity Access, Cell Phone Use, Financial Inclusion, and Included in Index.
Data Presence Legend
* Dark green represents 2 plus datapoints.
* Light green represents 1 datapoint.
* Light gray represents 0 datapoints.
* Diagonal black stripes represent Imputed data.
Included in Index calculation Legend
* Blue represents Yes.
* Pink represents No.
Data Matrix
* For C A N (Canada), all indicators from Education through Non-violent Attitudes and Water Sanitation Access through Financial Inclusion are dark green. Child Marriage Absence is marked with diagonal stripes indicating imputed data. The final column is blue.
* For U S A (United States), the pattern is identical to Canada. All indicators are dark green except for Child Marriage Absence, which is imputed, and the final column is blue.
Data availability overview for indicators related to the baseline Women’s Safety Index in South Asian countries.

Figure A12. Long description
A heatmap titled Data Missingness South Asia. The vertical Y axis on the left is labeled I S O Code and lists eight countries from top to bottom. A F G, B G D, B T N, I N D, L K A, M D V, N P L, and P A K. The horizontal X axis at the top lists 14 indicators. Education, Employment, Parliamentary Representation, Poverty Alleviation, Legal Equity, Gender-Equitable Births, Maternal Survival, Non-violent Attitudes, Child Marriage Absence, Water Sanitation Access, Electricity Access, Cell Phone Use, Financial Inclusion, and Included in Index.
Data Presence Legend.
Dark green represents 2 plus datapoints.
Light green represents 1 datapoint.
Light gray represents 0 datapoints.
White with black diagonal slashes represents Imputed data.
Included in Index calculation Legend.
Blue represents Yes.
Pink represents No.
Grid Data.
All countries are marked blue for Included in Index.
Most indicators for all countries are dark green. Notable exceptions include.
A F G is imputed for Poverty Alleviation and Non-violent Attitudes.
B G D is light green for Non-violent Attitudes.
B T N is imputed for Non-violent Attitudes and light green for Child Marriage Absence and Financial Inclusion.
I N D is dark green for all indicators.
L K A is imputed for Non-violent Attitudes and light green for Child Marriage Absence.
M D V is light green for Non-violent Attitudes and Financial Inclusion.
N P L is imputed for Non-violent Attitudes.
P A K is dark green for all indicators.
Digital data platform illustrating a map view of the Women’s Safety Index.

Figure A13. Long description
The interface is titled C E V A W Evidence Platform at the top left. A navigation bar includes dropdown menus for Country and Dimension, with Women's Safety Index Baseline selected.
The central world map uses a color gradient where red represents lower safety scores and blue represents higher safety scores.
- North America and Greenland are shaded in dark blue.
- Europe is predominantly dark blue, with some lighter blue shades in the East.
- Asia shows a mix of light blue in the North and East, with white and light red patches in the South and West.
- Africa is the most concentrated area of red and orange, particularly in Central and Northern regions like Sudan and Niger.
- South America is shaded in various tones of blue.
- Australia and New Zealand are dark blue.
At the bottom, a timeline slider spans from 1995 to 2024, with the current selection set to 2024. A legend in the bottom right corner shows a scale from 0.17 in red to 0.85 in blue, with a World Average for 2024 marked at 0.67.
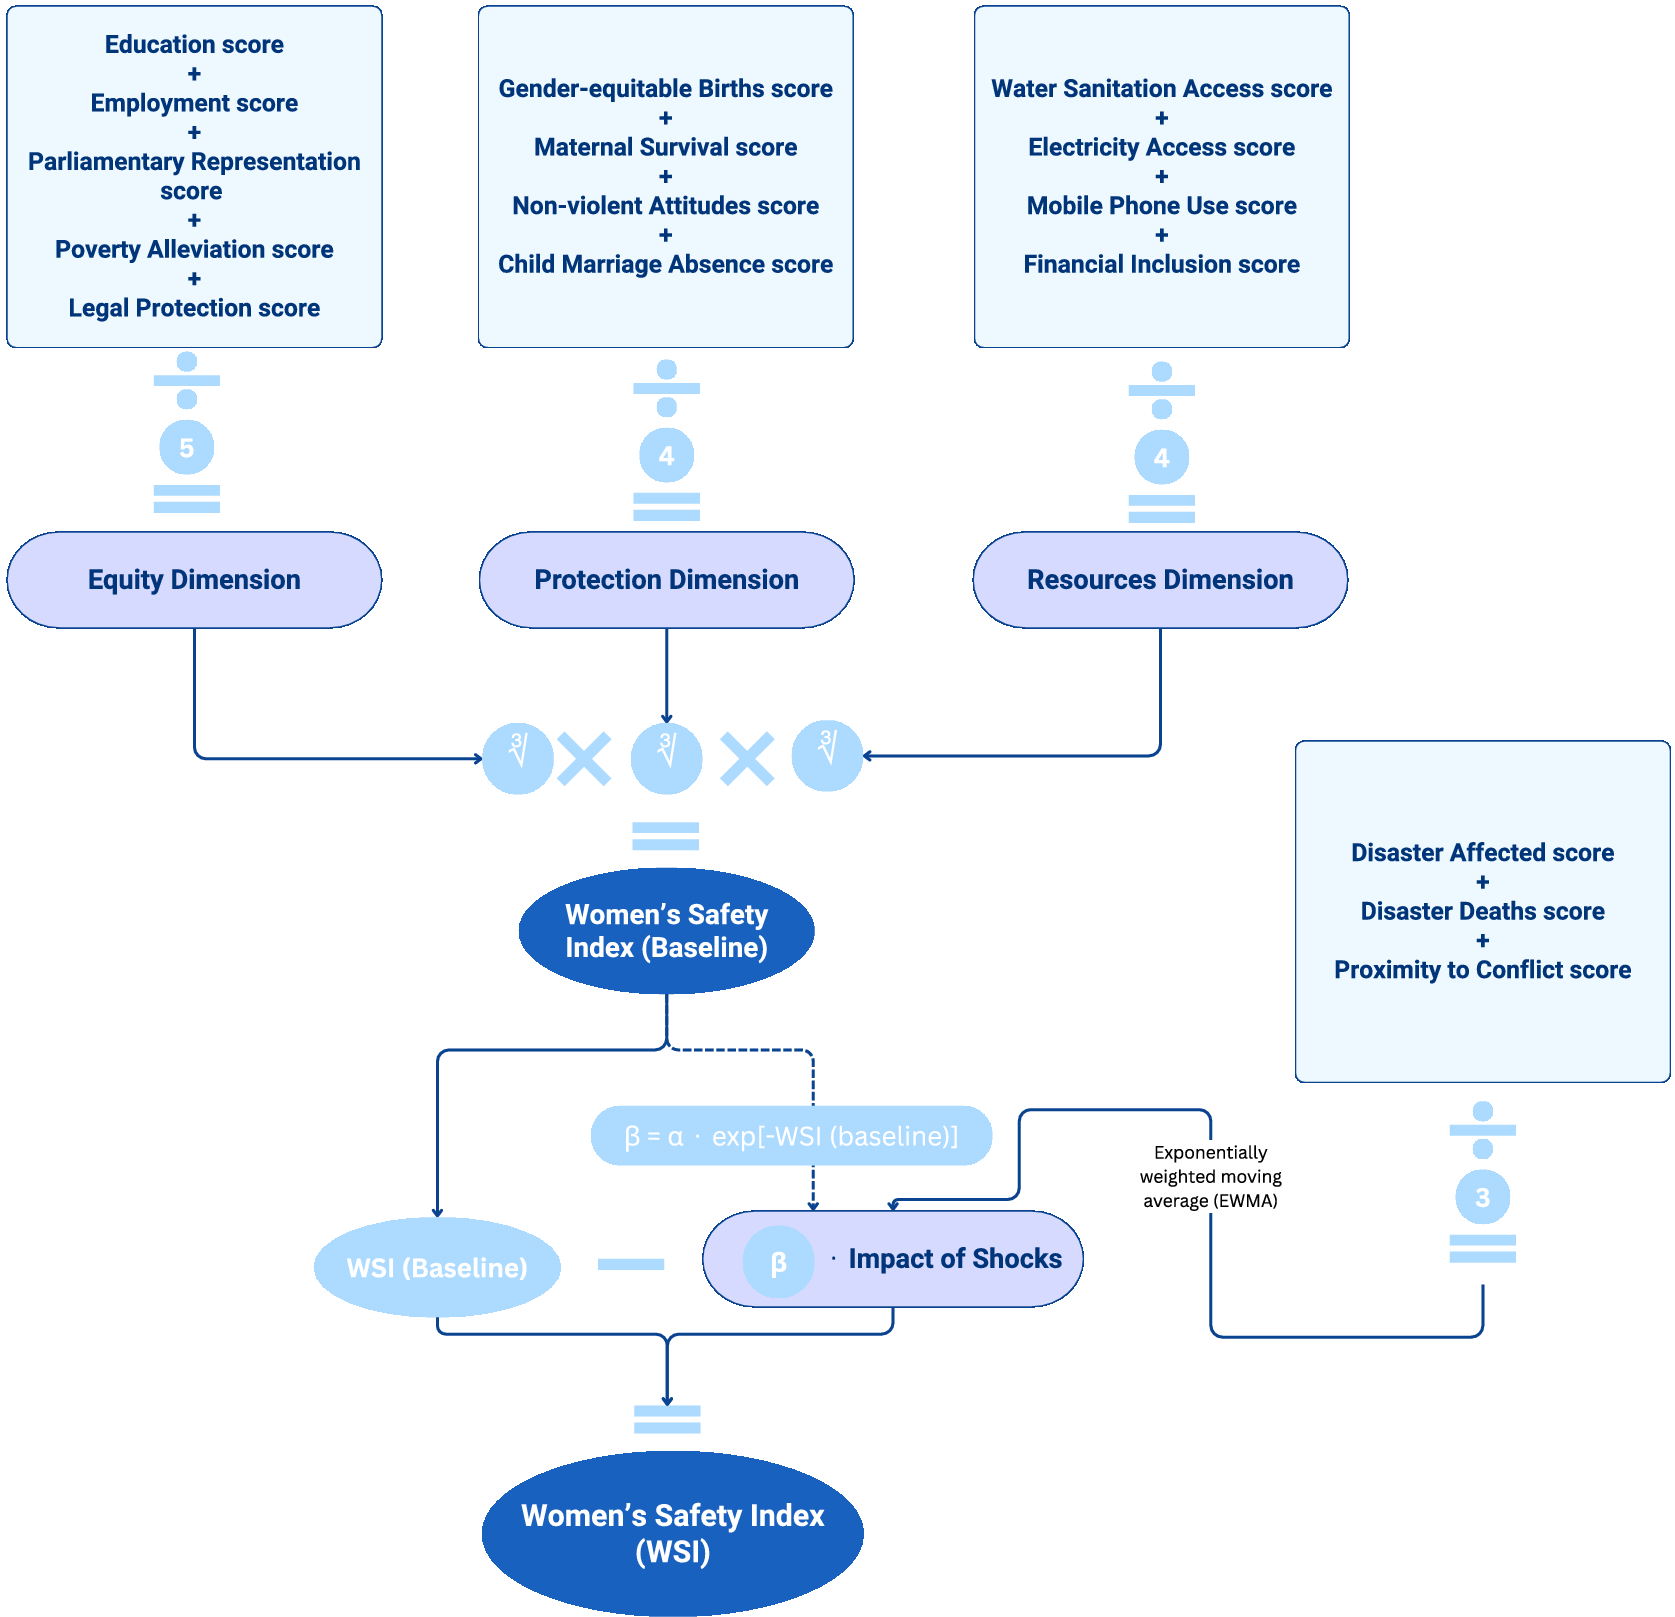
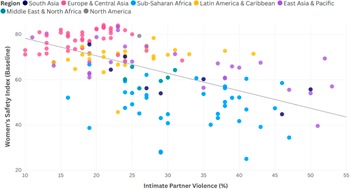

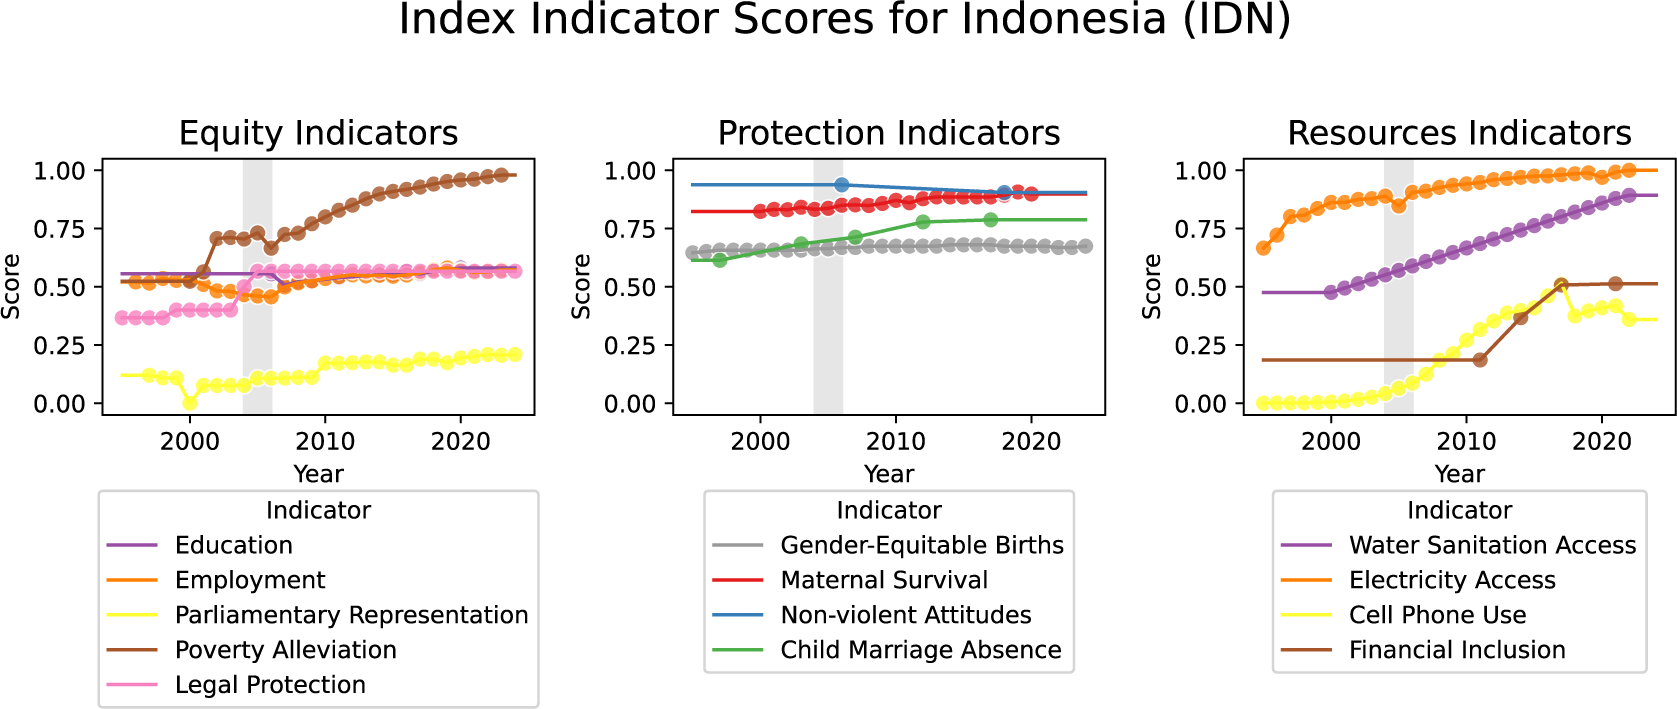
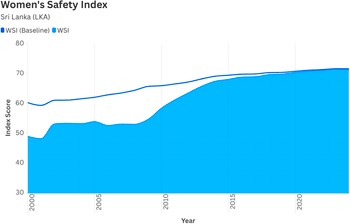
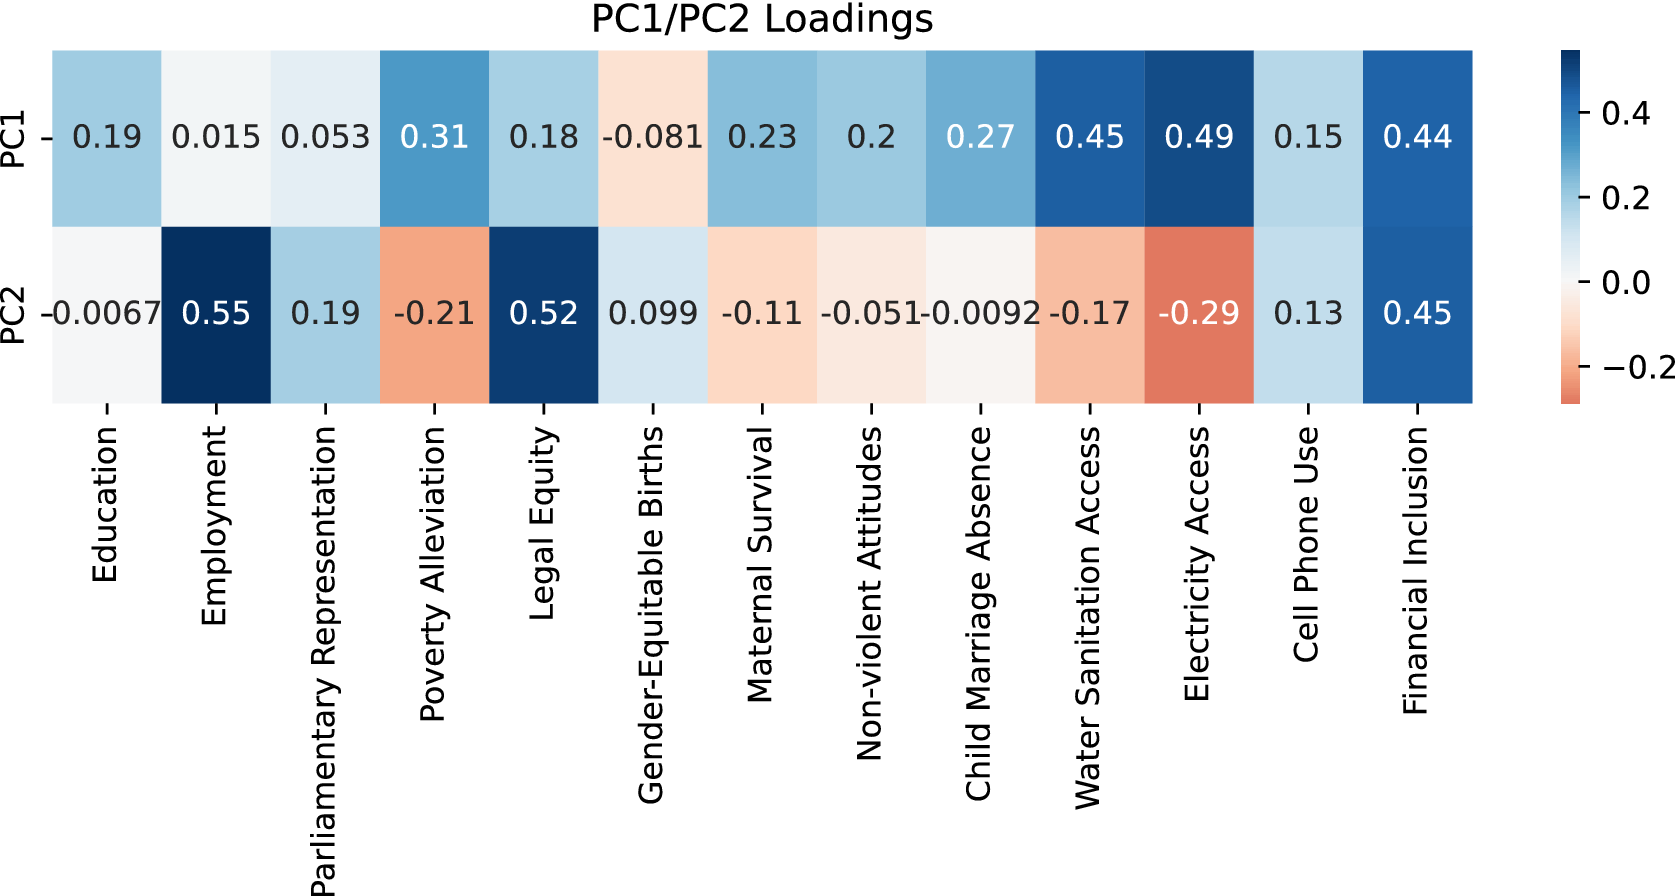
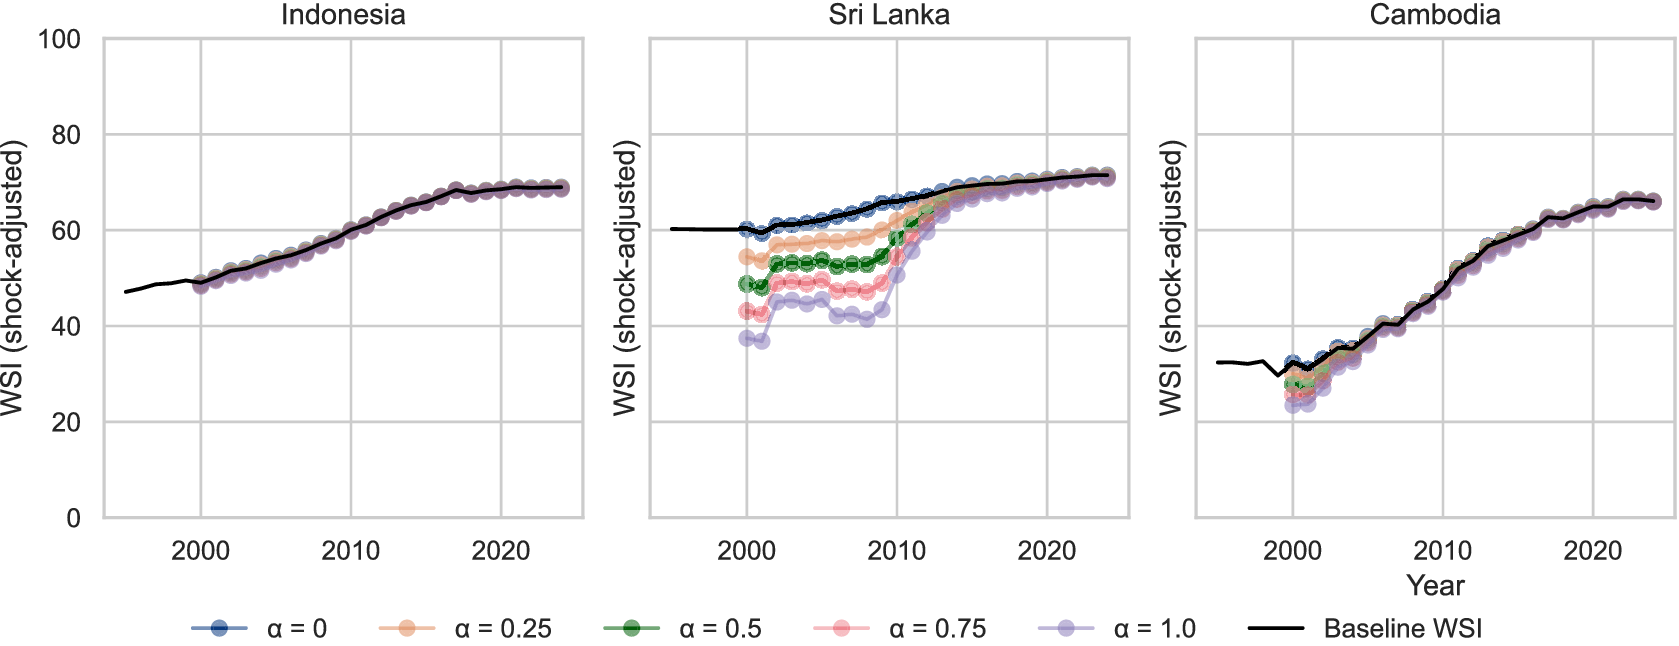


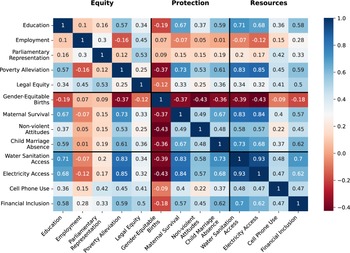
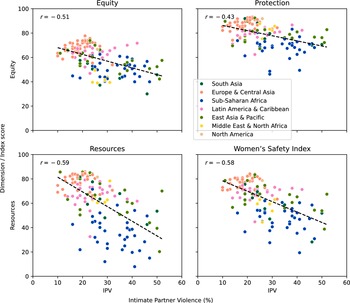

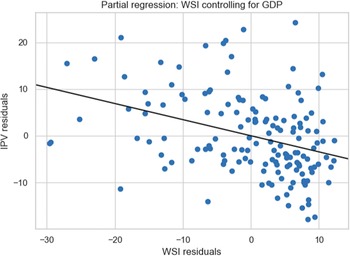
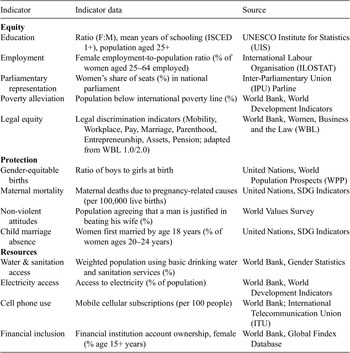
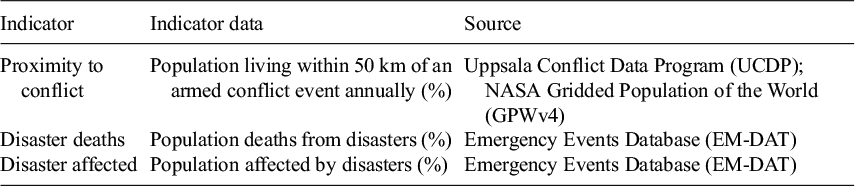

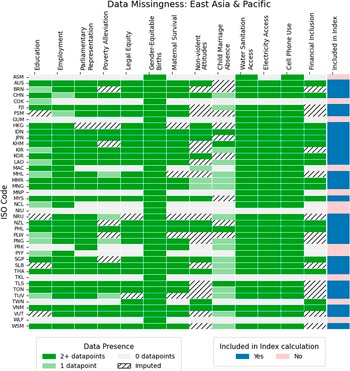
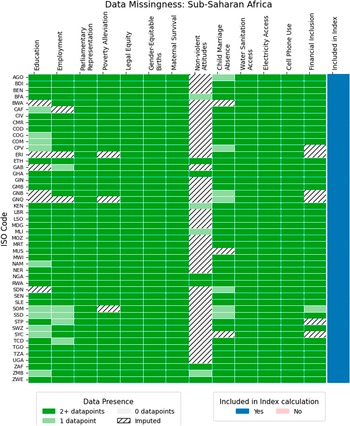
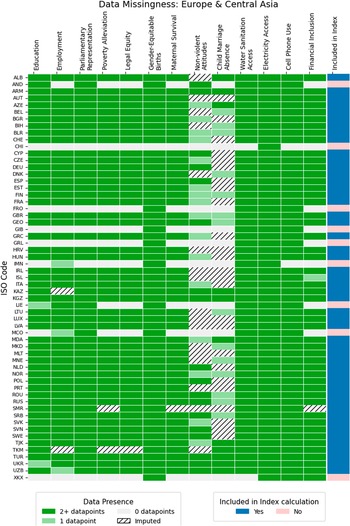
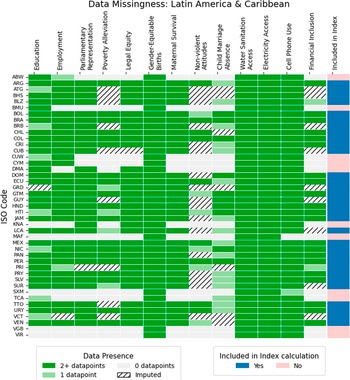
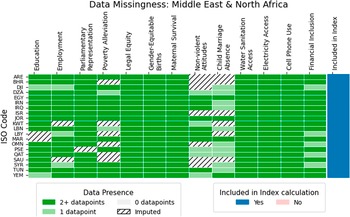
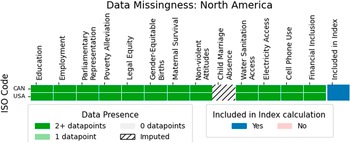

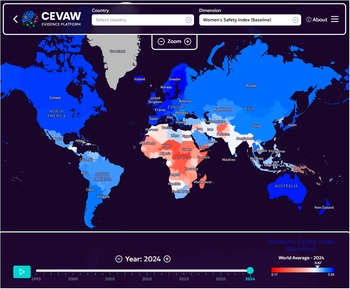

 Open access


Comments
No Comments have been published for this article.