


Introduction
The conflict between the increase of the polycrystals material’s strength by different strengthening mechanisms and the frequently observed simultaneous decrease of toughness and ductility is an everlasting problem in materials science [Reference Ritchie1]. Among various strengthening mechanisms, the nowadays mostly discussed one originates from the works of Hall and Petch on pure metals or metallic alloys [Reference Hall2, Reference Petch3], where by means of decreasing the grain size below 1 µm (ultrafine-grained, UFG) or even below 100 nm (nanocrystalline, NC), material strengths in the GPa range can be achieved. Although decreasing grain size offers strength increases, recent studies show a simultaneous dramatic decrease of the uniform elongation strain from ∼30% to ∼0–3% for different bcc and fcc UFG and NC metals [Reference Lu4]. This is explained by the higher proportion of grain boundaries (GBs) existing in UFG and NC materials compared to coarse-grained (CG) materials. These GBs are considered as favorable sites for strain localization and crack growth. Thus, higher probabilities exist for cracks to initiate and propagate along GBs in very fine-grained materials, causing this ductility decrease and thus the lower fracture toughness of UFG and NC materials. Because of this behavior, lower strength alloys are often selected for engineering applications, as their higher fracture toughness is decisive for the safety of structural applications [Reference Ritchie1].
At this point, one can state that producing ultrahigh strength metals through grain size refinement, but at the same time with enhancing GBs bonding strength, can be promising to promote plasticity in UFG materials. In other words, it is known from the Hall–Petch effect that the stress level reached in smaller grains to nucleate dislocations is high because of the limited space for dislocations to pile up and accommodate plastic deformation. Unfortunately, for low GBs cohesion, cracks along GBs can initiate and propagate before reaching this stress, causing the material to fail in a brittle manner. Consequently, by enhancing the GBs bonding, dislocation nucleation and emission ahead of the crack tip can occur, and promoted ductility in this zone can serve to blunt the crack and preventing brittle crack propagation.
A promising way for the synthesis of UFG and NC metals are given by different methods of severe plastic deformation methods. Among them, high pressure torsion (HPT) is a highlighted method for producing UFG and NC metallic samples [Reference Pippan, Scheriau, Taylor, Hafok, Hohenwarter and Bachmaier5], with grain sizes in the range of few hundreds of nanometers and well below. Indeed, pure metallic bcc and fcc UFG metals produced by HPT show remarkably higher strength because of smaller grain sizes [Reference Hohenwarter and Pippan6]. However, their fracture toughness is at best equal or mostly lower than their counterparts with larger grain size (>1 µm). Moreover, the fracture toughness is also observed to be strongly dependent on the direction of the notch introduced for a desired crack path with respect to the grain shape, which is frequently found to be strongly elongated to the respective shearing during deformation. Nevertheless, this anisotropy in fracture toughness presented in UFG HPT samples allows exceptional toughness–strength relationships [Reference Leitner, Hohenwarter and Pippan7, Reference Pippan and Hohenwarter8].
The fracture types of UFG materials are well described in Ref. Reference Pippan and Hohenwarter8. In latter work, UFG fcc metals tested at room temperature (RT) showed ductile fracture. The underlying process can be described by the following steps: first, the crack tip blunts, and at the same time, ahead of the crack tip, voids initiate and coalesce with the crack tip, and finally the crack propagates along these large voids. This is evidenced from a dimple surface observed afterward with fractographic investigations. However, the majority of tested bcc UFG metals fail brittle at RT with crack propagation along GBs. On one hand, the origin of the embrittlement is not fully clear, and possible reasons could be associated to chemical embrittlement as usually observed, for example, in steels. But on the other hand, the calculated critical crack tip opening displacement (CTOD) suggests that a specific amount of plasticity is involved in the material separation process, which could not be evidenced by now.
To better understand the origin of the fracture process of bcc UFG metals failing in a macroscopically brittle manner, we conducted scale-bridging fracture experiments on UFG Cr with a grain size around 160 nm produced by HPT. Cr chosen as a model bcc metal for fundamental investigations on toughening strategies. In addition, Cr-based materials are promising candidates for structural materials in fusion technology due to their low neutron–induced radioactivity. However, their brittleness at RT and high brittle ductile transition temperature (BDTT) are main drawbacks [Reference Wadsack, Pippan and Schedler9]. To measure bulk K IC of the material, three-point bending tests on bulk samples extracted from an UFG Cr HPT disk are performed. Also, we executed miniaturized fracture experiments at the microscale in situ in the scanning electron microscope (SEM) on microscale specimens obtained from the same HPT disk for comparison with the bulk properties. In situ SEM tests allow us to monitor the crack path with respect to the grain shape and sample orientation. Moreover, we performed in situ transmission electron microscopy (TEM) tests on even smaller nanoscale samples. The in situ TEM allows us to deliberately introduce a notch either within a grain or along a GB and thus to monitor in situ in the TEM the dislocation processes involved before and during crack propagation. Samples from all different length scales are prepared from the same material to exclude chemical influences and in such a way that the notch orientation with respect to grain shape and texture is identical, i.e., all samples have the same notch direction with respect to the principal directions in an HPT disk.
Materials and methods
Sample preparation
The as-received polycrystalline Cr plate (Plansee, Reutte, Austria) has a grain size of few 100 µm as shown in the SEM image in Figs. 1(a) and 1(a) and purity higher than 99.95 wt% (N: <5 μg/g, C: <49 μg/g, O: <210 μg/g, S: <11 μg/g). The Cr plate was cut by Electrical Discharge Machine (EDM, Brother HS-3100) to a disk with a diameter of 30 mm and a height of 7.3 mm.
(a) SEM image showing the microstructure of the as-received polycrystalline Cr sheet with average grain size ∼200 µm. (b) SEM image of the UFG Cr microstructure after HPT processing, with an average grain size of ∼160 nm.
Subsequently, this disk was deformed through HPT [Reference Pippan, Scheriau, Taylor, Hafok, Hohenwarter and Bachmaier5, Reference Valiev and Alexandrov10]. The process was conducted at a nominal pressure of 4.2 GPa at a temperature of 200 °C for 20 rotations, resulting in a final thickness after deformation of 4.2 mm and a maximum shear strain of ∼450 at a radius of 15 mm. This allows to reach the UFG microstructure with an average grain size ∼160 nm as shown in Fig. 1(b). Microhardness measurements along the disk radius resulted in a plateau hardness of around 425 HV for radii between 5 and 15 mm, indicating a rather uniform microstructure within this regime.
Macrosample preparation for three-point bending tests
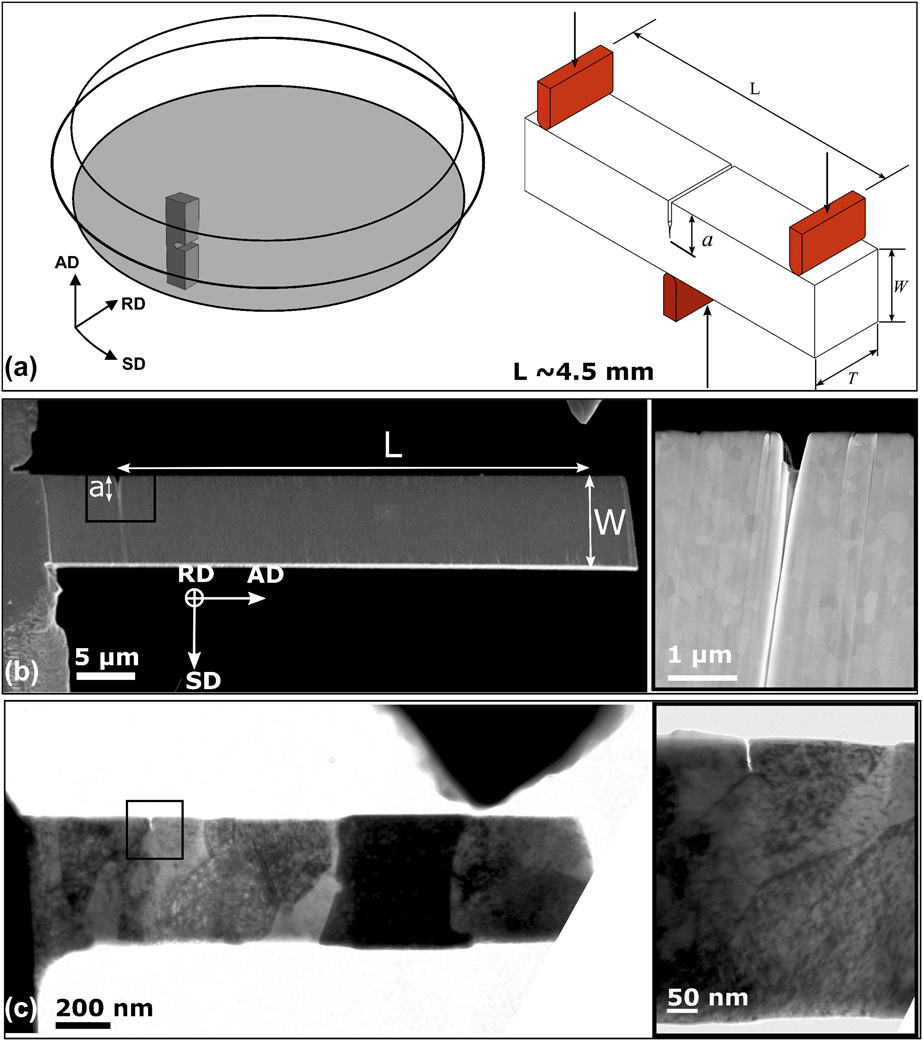
For macroscopic fracture experiments, three-point bending specimens, see Fig. 2(a), were extracted from the HPT disk. The specimens had a length, L, of 4.2 mm, a width, W, of 1.4 mm, a thickness, T, of 1.4 mm, and a typical a/W ratio of 0.3, where a refers to the initial crack length. To introduce a sharp crack, the specimens were prenotched with a wire saw followed by razor blade cutting to sharpen the notch. Finally, a precrack was introduced by compression–compression fatigue loading using a stress ratio, R, of 20 and typical stress intensity factor ranges, ΔK, of 12 MPa m1/2.
(a) Scheme showing the extracted sample orientation with respect to the chosen coordinate system consisting of shear (SD), radial (RD), and axial direction (AD). Inset: Scheme of the three-point bending test. (b) SEM image of a typical FIB-prepared UFG Cr microbending beam. Inset: Higher magnification SEM image showing the notch introduced by FIB milling with a radius of ∼30 nm. (c) TEM image of a typical FIB-made UFG Cr nanobending beam before in situ TEM testing. Inset: TEM image showing the sharpness of the electron beam notch with only few nm radius tip.
Microbending beam preparation by FIB for in situ SEM tests
Wedge-shaped samples were prepared by conventional wire cutting, gentle grinding, and subsequent electrochemical etching to remove any deformation layer [Reference Wurster, Treml, Fritz, Kapp, Langs, Alfreider, Ruhs, Imrich, Felber and Kiener11]. Fabrication of miniaturized bending beams along this sample is conducted using a focused ion beam (FIB). A single notch cantilever bending test geometry is chosen. The bending beams are clamped from one side, as shown in Fig. 2(b), to reflect the most common fracture experiment geometry used at small scales [Reference Jaya, Wheeler, Wehrs, Best, Soler, Michler, Kirchlechner and Dehm12, Reference Matoy, Schönherr, Detzel, Schöberl, Pippan, Motz and Dehm13, Reference Wurster, Motz and Pippan14]. This geometry was proven to be the most tolerant for misalignment problems between the indenter tip and the sample surface. Also, the free end avoids residual stresses that could be imposed in double-clamped bending beams [Reference Jaya, Kirchlechner and Dehm15].
We use a FIB LEO 1540XB (Zeiss, Oberkochen, Germany) operating at 30 kV, and coarse milling to make a thin lamella at the thin sample wedge top is conducted with a milling current of 5 nA. A lower milling current is used for shaping the bending beams, and final cuts are made using a 500 pA milling current to remove redeposited material layers. The bending beams aspect ratio is chosen to be roughly ∼(1 × 1 × 5) or ∼(1 × 2 × 10) for (T × W × L). For single notch cantilever bending tests (in SEM and TEM), L is the distance between the notch and the contact point of the wedge tip with the free end of the specimen. A typical microbending beam is shown in Fig. 2(b), with dimensions of 4.6 × 8 × 37 µm, for (T × W × L). Notching the bending beams was conducted using the line milling mode. A FIB current of 500 pA and a milling time per length of milling of 6.5 s/µm resulted in a notch depth of ∼1.5 µm. The best combination of a and W that allows to obtain K IC is a/W ≈ [0.2–0.3], as shown in Refs. Reference Hintsala, Bhowmick, Yueyue, Ballarini, Syed Asif and Gerberich16 and Reference Jaya and Jayaram17. In this case, the plane strain condition  $\left( {W - a} \right) \ge \left( {{T \over 2}} \right)$ is respected.
Nanobending beam preparation by FIB and procedure for in situ TEM tests
Similarly, for nanobending beams, the FIB is used for sample fabrication. However, smaller milling currents are used. Coarse milling is conducted with a milling current of 2 nA to make a thin lamella and final cuts are done using 50 to 5 pA milling currents. Notching the bending beams is conducted in the TEM JEOL 2100F (JEOL, Tokyo, Japan) operating at 200 kV. At high magnification (600 kX), we condense the electron beam to the smallest spot size; thus, its intensity becomes very high in a condensed spot. For few minutes, energetic electron–material interactions cause removal of atoms. This is consecutively repeated on small areas of few atomic column’s width until material through the thickness of the beam over a length a is removed. Notches made this way are very sharp with a radius that varies from few atomic columns to ≤2 nm, making them comparable to ideal notches obtained from fatigue precracking, as shown in inset of Fig. 2(c). The notch length a is chosen to be equal to ∼W/3, allowing a useful fracture experiment and stable crack. Notably, this sharp notch is much closer to a perfect crack than what can be obtained with the FIB, where a usual radius is ∼30 nm [Reference Pippan, Wurster and Kiener18]. A typical nanobending beam is shown in Fig. 2(c), with dimensions of 180 × 400 nm × 1.23 µm. To prevent any ambiguity with all effects of FIB damage, Ga+ implantation, amorphization layer, and preexisting dislocations on the mechanical behavior of samples of these small thicknesses (range of ∼100 nm), an additional annealing process is conducted for some samples. The annealing is conducted for 20 min at ∼900 °C in the TEM, i.e., under high vacuum condition using a double tilt heating sample holder, Model 652, tantalum® from GATAN Pleasanton, California, United States, Inc. This temperature of 0.54 T m (melting temperature) was shown to be sufficient to remove preexisting crystal defects such as dislocations and amorphization layers in nanosamples [Reference Kiener, Zhang, Šturm, Cazottes, Imrich, Kirchlechner and Dehm19].
Fracture experiments
The macroscale experiments were performed using a three-point testing device from Kammrath and Weiss with a stroke displacement speed of 1 µm/s.
In situ SEM tests are performed using a Hysitron Picoindenter PI-85 from Hysitron, Inc. Billerica, Massachusetts, United States, running feedback loop–enabled displacement-controlled experiments. Tests are performed at RT using the SEM column of a FIB LEO 1540XB equipped with a field emission gun (FEG-SEM) for imaging. A wedge diamond tip is used for bending the notched cantilevers. Fracture tests are performed at a displacement rate of 1 µm/min, and 8 µm set as maximum displacement. Data collected from individual tests consist of load and displacement as a function of time collected with 200 points per second, and a synchronized video of the test recorded in SEM mode with a time resolution of 0.5 s. Moreover, to better understand the fracture type and behavior, short loading–unloading cycles are performed to observe any possible change in the stiffness of the beam and that can be used to evaluate any crack length change.
The in situ TEM loading experiments were performed using a Hysitron Picoindenter PI-95, from Hysitron, Inc., with feedback loop–enabled displacement-controlled experiments. Tests are generally performed at a displacement rate of 1 or 2 nm/s. Load–displacement data were collected with 200 points per second, and a synchronized video of the test was recorded in bright field TEM mode with a frame duration of 33 ms and a pixel resolution of 1.28 nm.
Data evaluation
LEFM is used to calculate the critical stress intensity at fracture K C using Eq. (1), which is expected to deliver reliable values when small-scale yielding (SSY) conditions prevail [Reference Jaya, Wheeler, Wehrs, Best, Soler, Michler, Kirchlechner and Dehm12, Reference Matoy, Schönherr, Detzel, Schöberl, Pippan, Motz and Dehm13],
 $${K_{\rm{C}}} = \left( {{{F \cdot L} \over {T \cdot {W^{{3 / 2}}}}}} \right) \times f\left( {{a \over w}} \right)\quad ,$$
where F is the force at fracture, and f(a/W) is a geometrical factor depending on the ratio a/W.
For macroscale, f(a/W) is used as given by ASTM E399 [20], for specimens tested in a three-point bending test, as follows:
 $$f\left( {{a \over w}} \right) = {{3{{\left( {{a \over w}} \right)}^{{1 / 2}}}\left[ {1.99 - \left( {{a \over w}} \right)\left( {1 - {a \over w}} \right)\left( {2.15 - 3.93\left( {{a \over w}} \right) + 2.7{{\left( {{a \over w}} \right)}^2}} \right)} \right]} \over {2\left( {1 + 2{a \over w}} \right){{\left( {1 - {a \over w}} \right)}^{{3 / 2}}}}}\quad .$$
For microscale and nanoscales tests, f(a/W) is calculated for a single notch cantilever bending test as given by Eq. (3) [Reference Wurster, Motz and Pippan14],
 $$f\left( {{a \over W}} \right) = 4{{\left\{ {3{{\left( {{a \over W}} \right)}^{0,5}}\left( {1,23 - \left( {{a \over W}} \right)\left( {1 - {a \over W}} \right)} \right)\left( { - 6.09 + 13.96\left( {{a \over W}} \right) - 14,05{{\left( {{a \over W}} \right)}^2}} \right)} \right\}} \over {2\left( {1 + 2\left( {{a \over W}} \right)} \right){{\left( {1 - {a \over W}} \right)}^{1,5}}}}\quad .$$
Even though the macrotests can deliver results meeting the criteria for SSY, we refrain of calling the fracture toughness K IC as defined in the ASTM standards because it could cause confusion with the result obtained with the other test setups at microscales and nanoscales.
For clarifications, for the macroscale and microscale tests, we refer to the fracture toughness, obtained in the frame of LEFM, by K C. For the nanoscale tests, where after the elastic loading, dislocation emission was observed, and no fracture is encountered by the two tested specimens, we refer to K e (K emission), a critical stress intensity factor for dislocation emission, rather than K C, which would suggest crack propagation, calculated using the force F at the elastic limit. This is to acknowledge that due to the smaller sample volumes after the elastic limit, a different mechanical behavior is encountered. To a large extent, this is due to the large plastic zone compared to the sample dimensions at the nanoscale.
Moreover, as it is shown in the above sections in more details the microscale and nanoscale tests, some ductility before fracture or crack growth is observed. In this context of elastoplastic loading, we performed a J-integral analysis to incorporate crack tip plasticity into the description of the fracture behavior. The J-integral approach consists of the sum of elastic and plastic components as follows:
 $$J = {{K_{\rm{C}}^2\left( {1 - {\nu ^2}} \right)} \over E} + {{\eta \cdot {A_{{\rm{pl}}}}} \over {T \cdot \left( {w - a} \right)}}\quad ,$$
Here, ν = 0.21 is the Poisson’s ratio and E = 294 GPa the Young’s modulus of Cr, η = 2 is a constant, and A pl represents the plastic area underneath the load–displacement curve [Reference Wurster, Motz and Pippan14]. To compare fracture toughness values from elastic–plastic fracture mechanics (J-integral) to results from LEFM (K C), J is converted to
 $${K_{{\rm{C,J}}}} = \sqrt {{{J \cdot E} \over {\left( {1 - {\nu ^2}} \right)}}} \quad .$$
Further analysis are provided in the results and discussion sections.
Results
Macroscopic three-point bending test
A typical load–displacement curve of the macroscale fracture test at RT, i.e., the three-point bending test, is presented in Fig. 3(a). Linear elastic loading is apparent from the curve until fracture of the specimen occurs in a brittle manner (the nonlinearity at the beginning of the loading curve is an artifact of the used testing setup). The evaluation of K C was performed for three specimens using the maximum load in the test record for Eq. (1) and the respective geometry factor using Eq. (2), yielding a K C of 3.1 ± 0.2 MPa m1/2. As an indicator for the systematic error, the standard deviation is taken. This brittle fracture is also obvious from SEM images of the fracture surface taken after the test, as seen in Figs. 3(b) and 3(c).
(a) Load displacement curve of a macroscale test. (b) Fractography showing intergranular fracture. Red dashed line indicates the separation of the area of the fatigue-induced precrack and the overload fracture created in the fracture experiment. (c) Only very few grains exhibit transcrystalline cleavage. The green dotted line shows a grain that encountered transcrystalline cleavage.
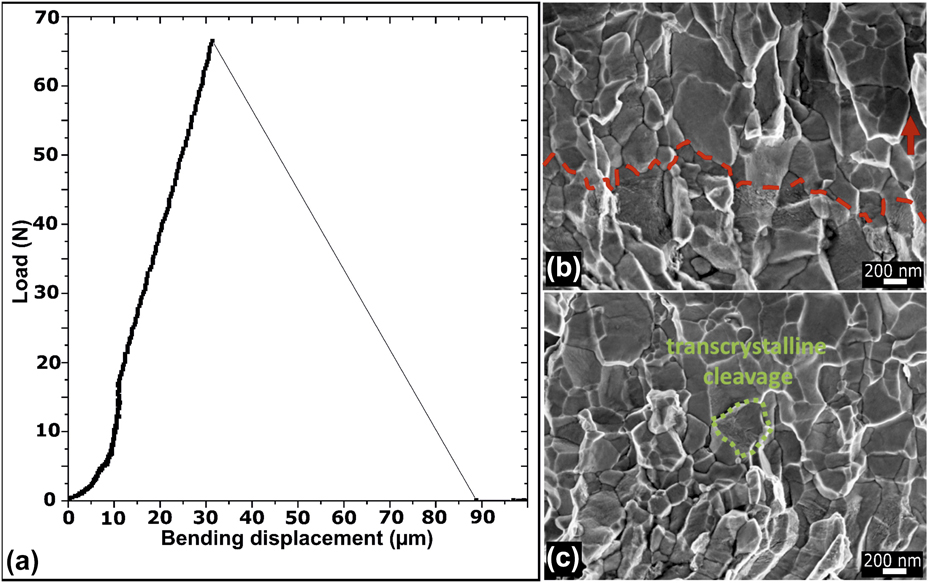
Figure 3(b) shows an SEM image of the fracture surface of a fractured sample. The dashed line separates the area of the fatigue-induced precrack and the overload fracture created in the actual fracture experiment. Moreover, the crack propagation direction is indicated by an arrow. As already observed for other UFG bcc metals, intercrystalline fracture prevails, which is typical for the crack parallel to the shear direction [see also Fig. 2(a)].
Interestingly, in some zones, cleaved grains, i.e., transcrystalline cleavage [Fig. 3(c)], can be found. Latter is signature for dislocation activity during fracture causing blunting for crack propagation and thus toughening. Although some toughness increasing factors are observed in specific areas from this fractography, including its roughness and the occurrence of some cleavage facets, the overall fracture behavior seems to be very brittle at this length scale. This is clearly seen in the overall fracture surface, the load–displacement data presented in Fig. 3(a), and a comparison with literature data [Reference Ashby21], for example, considering the CG state of the same material [Reference Wadsack, Pippan and Schedler9].
In situ SEM fracture test
Two specimens were tested at the microscale. The microbending beam presented in Fig. 4 has dimensions of 4.6, 8, and 38 µm for T, W, and L, respectively. This specimen was tested in situ in the SEM at RT. No distinct elastic–plastic transition is visible from the load–displacement data presented in Fig. 4(a).
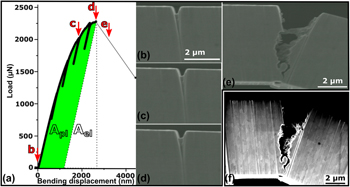
(a) Load–displacement curve of the microscale fracture test. J-integral analysis is performed considering calculation of the area under curve. (b–e) SEM images of the bending beam correlated to different points in the load–displacement curve. (f) SEM image of the crack area after the test showing intergranular fracture.

Figures 4(b)–4(e) show SEM images of the notch at different displacements (points b–e) of the test and are correlated to the load–displacement curve. After 1 µm bending displacement, the load–displacement data deviate slightly from a linear elastic response. After 1.5 µm loading displacement, i.e., at point c, the notch is already somewhat opened and expanded until point d by around 10%, but no crack length change is observed. Just after this point, fast crack propagation commences accompanied by a distinct load drop. The corresponding frame after the fracture point is presented in Fig. 4(e). Higher resolution postmortem SEM image of the specimen is presented in Fig. 4(f).
Notably, crack propagation could also occur within the volume of the sample, which could remain unresolved in SEM that is only able to monitor the surface. Therefore, four small elastic unloading sequences are performed during loading. This explains the four load reversals observed in the load–displacement curve [see Fig. 4(a)]. These short unloading sequences serve to measure any change in the stiffness of the bending beam, in other words any crack length change. Comparison of the slope of the four unloading cycle curves did not reveal any change in the stiffness of the specimen. Thus, crack propagation during the test was neither detectable from stiffness change measurement nor from SEM images during testing. This implies finally that the nondistinct elastic–plastic transition in the test record originates from plastic deformation of the ligament. The SEM image in Fig. 4(e) and the postmortem SEM image in Fig. 4(f) reveal that the fracture occurs along GBs. However, one can assume some plasticity before the final fracture from the load–displacement response of the test and from the postmortem SEM image presented in Fig. 4(f).
K C is first evaluated with linear elastic fracture mechanics (LEFM) [Eqs. (1) and (3)] and amounts to ∼2.7 ± 0.2 MPa m1/2. Incertitude arises from the curvature of the diamond tip giving a margin of L measurements. The maximum force of the test record is used in the calculations (important to note is that the ASTM standard for LEFM would not use the maximum force for the observed force–displacement behavior). This value of K C of the microspecimens is close to that obtained for the macroscale specimens under the preassumption of SSY conditions.
As mentioned above, plasticity is observable in the test record. Therefore, the J-integral in an elastic–plastic approach is evaluated by calculating the plastic and elastic areas beneath the load–displacement curve, as shown in Fig. 4(a). Using Eqs. (4) and (5), we obtain K C,J ∼ 7.5 MPa m1/2.
The entire area underneath the curve is evaluated by the integrating force–displacement data. Using the force value at maximum displacement (before crack) multiplied by the displacement at zero force supposing an elastic unload with slope equal to the loading one [see graph in Fig. 4(a)], this area obtained is divided by two to obtain the elastic area as indicated in the graph of Fig. 4(a). The plastic area is obtained by subtracting the elastic area from the entire area underneath the curve. Using Eq. (4), we obtain J and using Eq. (5), we can evaluate K c,J. Here, K C,J is considered an upper bound of the fracture toughness of this UFG material for the specifically used dimensions of the sample. Indeed, we believe that the value could be an overestimation because of the large radius of the FIB notch and a possible FIB damage.
In situ TEM fracture test
The known problem of large FIB notch radius and possible damage in the notch tip zone is eliminated in the specimens tested at the nanoscale in situ in the TEM. As mentioned previously, we introduce a very sharp notch by condensing the electron beam in the TEM in the desired area along the notch for few minutes. Besides producing a sharp notch, by correlating the load–displacement curve to the video test, any dislocation process and its effect on the mechanical behavior and measured parameters can be monitored and evaluated. In total, four TEM specimens were tested. In this section, we present two TEM tests results used for the comparative scale-bridging study, where the notches in both TEM samples were introduced along GB.
In Fig. 5, the load displacement curve of an UFG Cr nanobending beam is presented and correlated at certain displacements to corresponding TEM images. This bending beam has 180 nm, 400 nm, and 1230 nm, for T, W, and L, respectively. The notch length a is equal to 80 nm and the notch tip radius is ∼1 nm. This notch is introduced along a GB, as seen in Fig. 5(1). This is more evidenced in the dark field (DF) TEM image obtained on this specimen and presented in SI-3, Fig. S3(c).
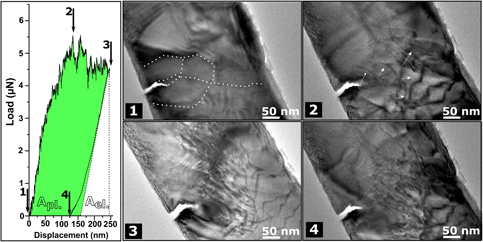
Graph of the load–displacement curve of a fracture test at the nanoscale. J-integral analysis is performed considering calculation of the area under the curve. (1–4) Consecutive TEM images at different displacements correlated to the load–displacement curve. (1) At zero load and GBs are denoted by the dotted line, (2) at the elastic limit, (3) before unload, and (4) at zero load after test.
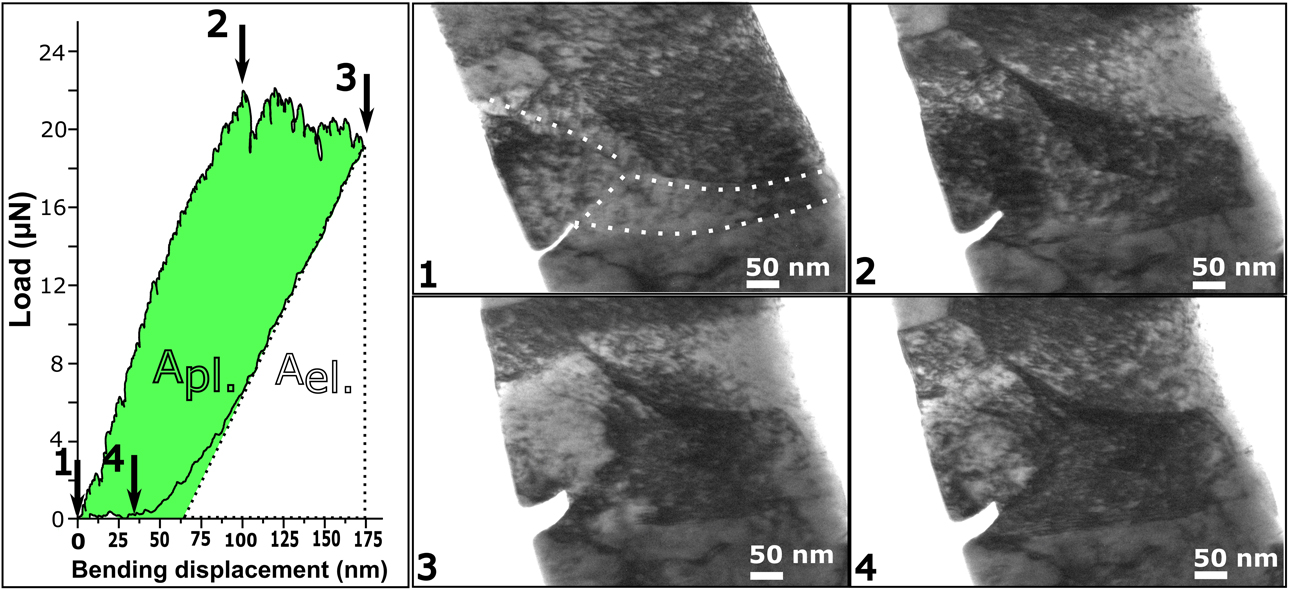
One can see from the graph of Fig. 5, a more or less linear elastic loading correlated to no dislocation activity at the notch tip zone [Fig. 5(1)]. This bending beam was not thermally treated before testing. Thus, under certain load, these preexisting dislocations show some mobility in certain grains, but no dislocation nucleation from sources is detected before the elastic limit. At point 2, the transition from the elastic to plastic regime is reached. This is correlated to pronounced dislocation nucleation and emission from the notch tip and surrounding GBs. Under further loading, dislocation annihilation at GBs and near free surfaces is also observed and some grains nearby the notch tip are observed to be nearly pristine. This renders observation of dislocation nucleation and emission processes clearer, as seen in Fig. 5(3). One must point out that in this experiment the crack does not propagate but only blunts [compare Figs. 5(1) and 5(3)]. A second loading–unloading cycle is performed on this specimen. Emitted dislocations from the notch tip could also be characterized, and the Burgers vector b direction explains the specific crack opening direction. See SI-1 for more details.
To remove any ambiguity concerning the FIB damage and potential influences of preexisting defects, we performed tests also on samples annealed at 900 °C (∼0.54 T m of Cr) for 20 min in the TEM, as mentioned previously. After annealing, all grains are quasi-pristine as seen in Fig. 6(1).
Graph for the load–displacement data for an annealed Cr nanofracture experiment. (1–4) Consecutive TEM images correlated to different points of the load–displacement data. (1) At zero load and GBs are denoted by the dotted line, (2) first dislocation emission observed in TEM image, (3) just before unload, and (4) at zero load after the test.

This bending beam has ∼100 nm, 370 nm, and 1270 nm for T, W, and L, respectively, and a ≈ 70 nm. This notch is also introduced along the GB, as also evidenced in SI-3, Fig. S3(d). Similarly to the not annealed bending beam, the load–displacement response consists of an elastic regime followed by a plastic regime, see graph in Fig. 6. No dislocation activity is observed before the elastic limit. At this elastic limit, Fig. 6(2), first dislocations are nucleated and emitted from the notch tip and surrounded GBs and triple junctions, as indicated by the arrows in Fig. 6(2). Sources of these dislocations, easily identified in the video test, are indicated by the start points of the arrows, and their directions denote the direction of the dislocation motion. Under further load, until the end of the loading [see Fig. 6(3)], multiple dislocation nucleation events from the notch tip and close GBs, and their glide motion away from the crack are observed. Upon unloading to zero load, dislocations in the notch zone area persist in the grains, see Fig. 6(4). A second cycle of loading–unloading was performed on this specimen; besides further dislocations emissions and activities at the crack tip zone and near GBs, this time the crack shows some extension accompanied by further dislocations activity, see SI-2.
K e of both bending beams is evaluated first using a LEFM approach using Eq. (1) and the geometry factor is calculated using Eq. (3). The F value used is the maximum load at the elastic limit, which stays more or less constant until unloading. This is due to the deformation mechanism encountered by the specimen: dislocation emission–accommodation processes. At a critical stress, dislocations are emitted from different sources, accompanied by small load drops, a process that prevails in the plastic regime of the load–displacement curve (see graphs in Figs. 5 and 6). Accommodation of these dislocations occurs at nearby GBs and at proximate surfaces. This renders grains to end in a lower dislocation density state. Under further loading, other dislocation emission processes occur, which induces the large plastic strain observed.
Evaluated K e are ≈3.13 ± 0.2 MPa m1/2 for the nonannealed bending beam and ≈2 ± 0.2 MPa m1/2 for the annealed one. Similarly, incertitude arises from the curvature of the diamond tip radius giving a margin of L measurements. K e of the non-preannealed specimen assuming LEFM is surprisingly close to K C of UFG Cr bending beams tested at the microscale and the macroscale, also in the LEFM approach. However, the preannealed specimen has a lower K e, and this is well explained by the fact that GB relaxation and annihilation of preexisting dislocations occurred during annealing. This can induce this lower K e as no local shielding stresses are caused by preexisting dislocations.
The J-integral analysis gives a value of ∼5.1 ± 0.2 MPa m1/2 for K C,J for the non-annealed specimen and 4.8 ± 0.2 MPa m1/2 for the annealed one. Again, the entire area underneath the curve is calculated by integrating force–displacement data. Using the force value at maximum displacement (before unloading) is multiplied by the displacement at zero force again as denoted by the dotted line in the graphs of Figs. 5 and 6, and divided by two to obtain the elastic area. The plastic area is obtained by subtracting the elastic area from the entire area underneath the curve. Similarly, using Eqs. (4) and (5), we obtain J and K c,J. Herein, K C,J is considered as a lower bound in the elastic–plastic approach, especially since the specimens do not show a physical crack extension in the first loading step. Thus, this value of K c,J could be higher if a higher maximum displacement was applied in the test.
Discussion
Fracture experiments performed at RT reveal a fracture toughness close to 3 MPa m1/2 for UFG Cr with a grain size of ∼160 nm in the frame of LEFM approach (excluding the preannealed specimen).
Cr is bcc metal, where we can estimate  ${K_{{\rm{griffith}}}} = \sqrt {2\gamma E} \; \sim \;1.2$ MPa m1/2, with γ = 2.3 J/m2 and E = 294 GPa [Reference Bolep and De Klerk22]. By a simple comparison of the K C for the macrospecimen obtained herein to K griffith of Cr, one can deduce that some other forms of energy dissipation besides forming of the two fracture surfaces occur. Moreover, fracture occurs along GBs as shown in the macroscale and microscale tests, rather than transcrystalline cleavage like in CG Cr. In the latter case, this cleavage fracture causes higher fracture toughness with K C being around 7.7 MPa m1/2 [Reference Wadsack, Pippan and Schedler9]. In UFG Cr, the higher toughness compared to the minimum value given by Griffith cannot simply be explained by the very few areas that show transcrystalline cleavage as observed in fractography of the macrospecimens, especially since the overall fracture surface shows intercrystalline fracture. Another factor raising the toughness is also the roughness of the fracture surface causing local crack deflections of the fatigue precrack. Nevertheless, further factors contributing to the toughness could probably exist in UFG or NC materials that undergo brittle intercrystalline fracture, which are however not commonly established in the literature.
Herein, the scale bridging experiments from macroscale down to nanoscale explicitly show dislocation emission from the crack tip and nearby GBs affected by the stress tip singularity just before crack growth in nanosamples. In larger samples and even in the nanosample, this causes a crack tip blunting before fracture, which is an obvious sign for the higher fracture toughness compared to K griffith. This was evidenced in the in situ TEM images extracted from the test videos and presented in Figs. 5 and 6.
Indeed, after dislocation emission from the crack tip in the three different scale samples, different fracture behaviors, for instance, different characteristics of the force–displacement record, are encountered. This can be related to the plastic zone size in relation to the specimen dimensions in the macrosamples and microsamples where still continuum mechanics can be applied. However, in nanospecimens, this plastic zone is large compared to the sample dimensions causing different dislocations processes at near free surfaces. This will be discussed more in detail in the following section “Fracture behavior of UFG Cr at different length scales”. Surprisingly, the maximum load reached at the smallest scale leads to similar values for the fracture toughness obtained at the microscale and macroscale analyzed in the LEFM approach. The consecutive section “Fracture toughness of UFG Cr” provides a comparison of the strength and K C of UFG Cr to CG Cr and perspectives to obtain a high strength UFG bcc metal with at the same time significantly high fracture toughness.
Fracture behavior of UFG Cr at different length scales
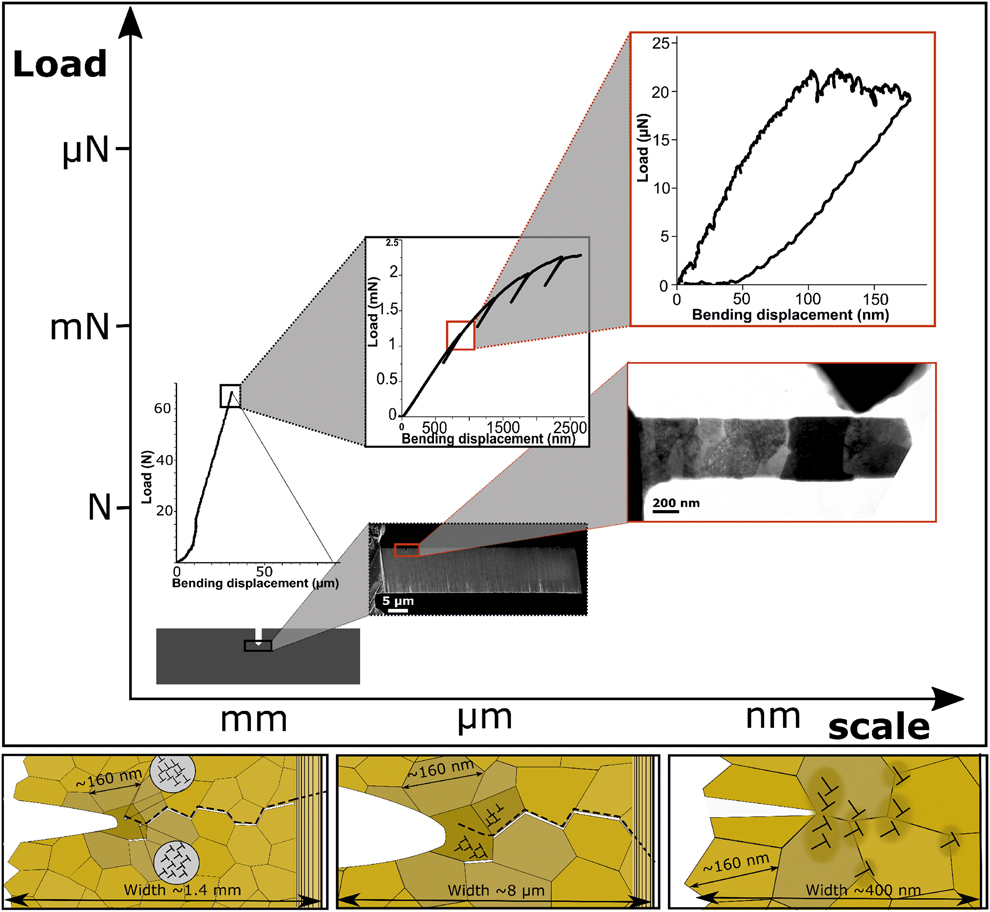
After dislocation emission from the notch tip, different fracture behaviors are encountered, and we report this to different plastic zone size relations to specimens’ dimensions at different scales. This is illustrated in the schematic graph and scheme below (Fig. 7) and more detailed in the following.
Schematic graph including experimental load–displacement data and images at different scales, linking fracture behavior at the macroscale toward dislocation processes at the nanoscale. Below, a scheme indicates dislocation process zones compared to sample dimensions before failure at different scales.
Fracture behavior of macrospecimens
The macrosamples fractured brittle and the fracture occured along GBs. After reviewing the results obtained on the nanoscale, we consider that this occurred first by dislocation emission from the crack tip and nearby GBs lying in the high stress field of the tip singularity. Regarding the small grain sizes in the range of 100 nm and the limited space for dislocations to pile up, and due to the large dimensions of the specimen compared to the plastic zone, SSY before cracking (see scheme in Fig. 7) prevails. As a conservative estimation for the plastic zone size, one can calculate the plastic zone size for plane stress conditions after Irwin [Reference Irwin23] with
 $${r_{{\rm{pl}}}} = {1 \over \pi }{\left( {{{{K_{\rm{C}}}} \over \sigma }} \right)^2}\quad .$$
Considering a strength of approximately 2 GPa [Reference Fritz, Wimler, Leitner, Maier-Kiener and Kiener24] and a fracture toughness of 3 MPa m1/2, one can calculate a plastic zone size of 0.7 µm. This implies that all dimensions are very large compared to the plastic zone so that SSY conditions are well fulfilled. Because of the small size, the remaining plasticity involved in the fracture process can however not be seen in the test record, implying a macroscopic brittle fracture behavior of the specimen regarding the test record in Fig. 3(a). However, the plasticity causes a blunting of the crack tip and thus increases the resistance to crack extension. In addition, transcrystalline cleavage observed in few areas in postmortem SEM images of the fracture surface indeed shows a signature of dislocations activity. This is well described by the symmetrical slip on the system 1/2〈111〉{110} occurring in bcc metals, resulting in immobile edge dislocation on {100} planes as detailed in section “Comparison to CG and single crystal (SXX) Cr”.
Fracture behavior of microspecimens
In the microspecimens, plasticity is somewhat more pronounced in the load–displacement data, as one can see from Fig. 7. This behavior may have several reasons: (i) Since within the sample are still many grains compared to the sample dimensions, the same considerations for the plastic zone size as for the large sample can be applied. The specimen dimensions, however, are in the order of micrometers and thus SSY is not fulfilled anymore (r pl is not ≪ specimen dimensions). Nevertheless, there are still several grains involved in the fracture process, leading to no clear transition in the curve to indicate the initiation of dislocation emission before failure. (ii) This trend is further supported by the rather large crack tip radius introduced by the FIB. Also, the FIB damage in the notch zone is well known to cause crack blunting, because preexisting defects in the notch tip are activated at lower stress levels and thus local dislocation processes are involved during the elastic loading, also supporting this nondistinct linear elastic loading–plastic transition.
Fracture behavior of nanoscale specimens
The problem of large FIB notch radius and FIB damage at the crack tip zone is prevented in the in situ TEM tests. The notches introduced in TEM have radii varying from few atomic columns to 2 nm maximum.
The in situ TEM tests, presented in section “Results” with notches along GBs, revealed the fact that at the elastic limit, dislocation emission from the notch tip and from GBs triplet point junctions ahead occurred. Under further load, annihilation of these dislocations at GBs and at near surfaces of the nanosamples induces further dislocation emissions to occur. Consequently, an ideal plastic deformation is evident in the load–displacement curve, as also seen in the TEM images. Different than microspecimen and macrospecimen, this plastic zone is large enough to create dislocation plasticity and prevents any crack nucleus to initiate in the tip singularity. This also explains partly the lack of failure occurring in these two tests. Another factor why crack propagation may not occur is the missing of additional GBs or triple junction within the process zone, which are known to be preferential hotspots to connect with the main crack [Reference Kumar, Suresh, Chisholm, Horton and Wang25].
Fracture toughness of UFG Cr
Comparison to CG and single crystal (SXX) Cr
Fritz et al. [Reference Fritz, Wimler, Leitner, Maier-Kiener and Kiener24] showed in compression tests performed from macrosamples down to 500 nm pillar dimension on similar UFG Cr that the yield strength is around 2 GPa. This is at least four times larger than CG [Reference Wadsack, Pippan and Schedler9] or SXX Cr [Reference Fritz, Wimler, Leitner, Maier-Kiener and Kiener24] having yield strengths in the range of ∼0.5 GPa [see Fig. 8(a)]. This higher strength obtained in UFG compared to CG is explained by the Hall–Petch strengthening effect.
(a) Compressive yield stress of single crystal (SXX) Cr [Reference Fritz, Wimler, Leitner, Maier-Kiener and Kiener24], UFG [Reference Fritz, Wimler, Leitner, Maier-Kiener and Kiener24], and CG [Reference Wadsack, Pippan and Schedler9]. (b) K e and K c (black dots) of UFG Cr tested at macro (mm) scale, microscale, and nanoscale, and CG Cr obtained from Ref. Reference Wadsack, Pippan and Schedler9. Gray dots denote K C,J obtained for microspecimens as upper bound for the fracture toughness (denoted by the downward arrow) and lower bound for nanospecimens, as they did not show any fracture (denoted by the upward arrow).

However, the K C of UFG Cr obtained here is ∼3 MPa m1/2 compared to 7.7 MPa m1/2 obtained by Wadsack et al. [Reference Wadsack, Pippan and Schedler9]. This is lower than that of CG Cr by at least a factor of 2 [Fig. 8(b)]. It is proposed that in CG bcc metals such as iron, symmetrical slip on the system 1/2〈111〉{110} in one grain can involve a large number of intersecting pile-up dislocations and thus produce sessile edge dislocations of Burgers vector 1/2〈100〉 along one {100} slip plane as follows [Reference Armstrong26]:
 $$\left( {{a \over 2}} \right){\left[ {1\bar{1}1} \right]_{\left( {110} \right)}} + \left( {{a \over 2}} \right){\left[ {11\bar{1}} \right]_{\left( {1\bar{1}0} \right)}} \to a{\left[ {100} \right]_{[001]}}\quad .$$
The resulting edge dislocation is immobile being on the plane (010), which is not a common slip plane in bcc metals. Therefore, this is of higher energy than the initial dislocations and at a critical stress acts as crack nucleus along a {100} cleavage plane [Reference Cottrell27]. However, this is not the case for UFG polycrystals, where lower numbers of pile-up dislocations are involved, because the slip plane lengths are severely restricted due to the nanoscale dimensions [Reference Armstrong26]. Therefore, intercrystalline fracture occurs, as reported in NC iron [Reference Hohenwarter and Pippan28] and herein in this work on UFG Cr. This difference in the evolving dislocation structure ahead of the crack due to the different grain sizes is supposed to be one main factor explaining the higher fracture toughness in CG compared to UFG Cr.
K C,J calculated using the elastic–plastic approach is around 5 MPa m1/2 for specimens tested in TEM and around 7 MPa m1/2 for microspecimen tested in SEM. The reasons for the higher values compared to the macrosample, which can be clearly described in the frame of LEFM, are versatile. In comparison with the microsample at first, the introduced cracks differ strongly. In the case of the macrosample, an atomistic sharp crack was introduced by fatigue, whereas for the microsample, one has a larger FIB notch radius and a possible FIB damage zone ahead of the notch. This disadvantage is compensated in the smaller TEM sample, which is, however, more or less in the same size as the plastic zone calculated for the large macrosample. Despite this, the measurement of the crack tip opening displacement at initiation (CTODi) in the TEM sample and the comparison with the theoretical one that can be derived from the large sample gives an interesting result.
For the large sample, the CTOD can be calculated as follows [Reference Anderson29]:
 $${\rm{CTO}}{{\rm{D}}_{\rm{i}}} = {{K_{{\rm{IC}}}^2} \over {{\sigma _{\rm{y}}}E\left( {1 - {\mu ^2}} \right)}}\quad ,$$
yielding a value of approximately 12 nm. For specimens tested in TEM, at the elastic limit the CTODi measured in the corresponding TEM image is ∼8 nm and the maximum value without crack propagation becomes ∼20 nm (after test, at zero load) and therefore lying in the same range of the macrospecimens. This again underlines that the processes deduced by the in situ TEM experiments are the same that also control macroscopic failure of the material.
Promising strategy for increasing the fracture toughness UFG materials
The two nanospecimens presented in the results section “In situ TEM fracture test” are, as mentioned previously, notched along GB. Dislocations emission from the notch, the notched GB, near GBs of different grains in the notch zone, and from triplet junctions is observed and considered as an energy dissipation form preventing any crack nucleus to initiate. An interesting question that arises from our observations is whether the fracture behavior changes when the crack is intentionally placed into the grain to support transcrystalline fracture.
To investigate this aspect, we introduced in two other nanospecimens, notches situated within the grain as shown in Fig. 9(a) rather than along the GB as presented before and consecutively tested in situ in the TEM (see SI-3 for TEM images of different notches introduced either along a GB or within an individual grain).
(a) TEM image of a notched cantilever with the notch situated in a grain, at an early stage of dislocations emission. (b) TEM image showing the fracture occurring along a GB. (c) Nominal uniaxial bending stress at ligament of a specimen notched along the GB (red curve) with two cycles of loading–unloading and other notched in a grain (blue dotted curve), as a function of the bending displacement. Inset: TEM images after tests of (from top to down) the specimen with the notch situated in the grain and below the two specimens notched along GBs. With the TEM image at bottom corresponding to the red curve. (d) Schematic graph showing the stress required to allow a crack to propagate along a GB, higher than that required to nucleate dislocations. However, both are well below the theoretical shear strength of Cr.
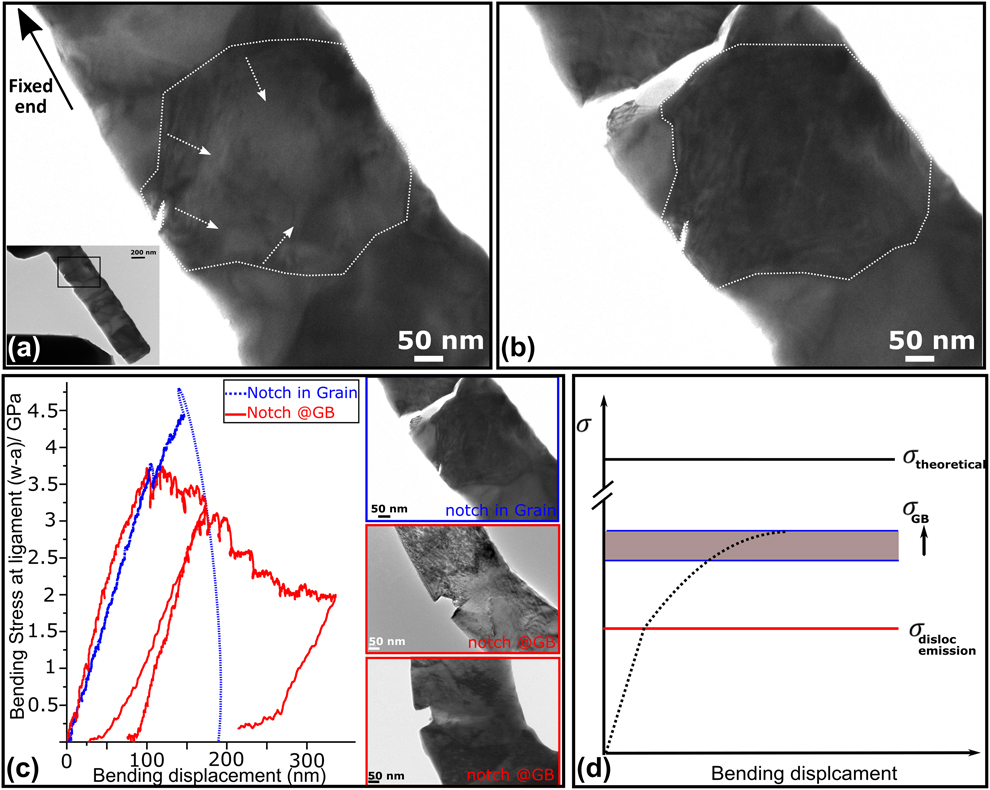
After linear elastic loading [blue dotted data in Fig. 9(c)], dislocation emission from the notch and GBs of the notched grain is observed [see Fig. 9(a)]. This emission is correlated to the stress drop in the bending stress-displacement data, which occurs at a similar bending stress (∼3.5 GPa) as that required to nucleate dislocations from the bending beam notched along the GB [red curve in Fig. 9(c)]. However, under further load, the specimen notched within the grain fractured along the next GB [see Fig. 9(b)], closer to the fixed end of the cantilever, i.e., where the global stress is considered somewhat larger than along the other extremity of the specimen, even though no stress concentrator, i.e., prenotch is present. To refer to the fixed end, see inset of Fig. 9(a). This behavior is encountered by both specimens (notched with a crack within a grain). Because fracture occurs without emanating from the crack or notch, a description in the frame of fracture toughness is therefore very difficult.
The observation of the preferential crack path along the GB can be related to the fact that in the case of a notch along a GB or near a GB triple point as presented in the experiments (shown in Figs. 5 and 6), a large number of dislocations in different grains near the notch zone are nucleated, promoting more plasticity. This was clearly observed in the TEM tests shown in Fig. 6(2–3). This can be different in the case of a notch introduced along a single grain. Dislocations are mainly observed to be emitted from the notch and from GBs of this specific grain, as shown in Figs. 9(a) and 9(b). Under further increasing load and due to the small space available for dislocations to pile up, before further dislocation emission processes from other GBs, a high enough bending stress is reached, and energy dissipation occurs by cracking along the GB close to the fixed end. Notably, no crack growth was observed in these two tests within the grain.
For these two tests, we consider that by strengthening the cohesion of GBs in UFG materials, i.e., shifting the strength of GBs upward in Fig. 9(d), further dislocation emission processes can take place from GBs of different grains in the notch area, thereby promoting local ductility and thus causing toughening. In fact, strengthening of GBs bonds can be achieved by adding adhesion improving impurities such as carbon or boron for instance. We believe, however, that this aspect requires an in-depth study, because the amount of local segregation and thus modification in GBs cohesion will also depend on the atomistic grains boundary configuration in front of the notch and the grain boundary character.
Conclusion
Fracture experiments on UFG Cr were performed on the same material (purity and specimen orientation) at different scales from macroscale down to nanoscale (in situ in the TEM). Latter tests revealed the fact that dislocation emission from a sharp notch (radius ≤2 nm) and near GBs occurs before failure upon brittle intercrystalline fracture, which is observed in macroscale and microscale tests. However, after dislocation emission form the notch tip, different fracture behavior is encountered at small scale due to the large plastic zone compared to the specimen dimensions, causing dislocation annihilation at near free surfaces and thus reducing dislocation–dislocation interactions processes and promoting further ductility. Moreover, this plastic zone is large enough to prevent any stable crack to initiate in the stress tip singularity.
Moreover, in situ TEM fracture experiments on notched cantilevers with notches situated in the grain showed less ductility and fracture along the next GB, closer to the fixed beam end. The bending stress measured for these samples is larger at fracture than the two bending beams that showed only ductility when the notch is introduced along the GBs. This shows that the stress needed to allow a crack to propagate along GBs is higher than that required to emit dislocations. It underlines that dislocation emission occurs before intercrystalline brittle fracture. Based on these tests, one can conclude that by strengthening GBs, it should be possible to promote ductility and induce additional toughness in UFG bcc materials.
Supplementary material
To view supplementary material for this article, please visit https://doi.org/10.1557/jmr.2019.140.


 Open access