1. Introduction
Climate change poses significant challenges to the global economy, the environment and society. As the world transitions towards a low-carbon economy, understanding the perspectives of those involved in shaping and implementing related policies and strategies is of paramount importance. This paper seeks to contribute to the growing body of research on the subject by examining the opinions of economics and finance professionals, researchers, and public sector regulators on the impact of the transition to a low-carbon economy and the roles of different stakeholders. The motivation for this study stems from the need to comprehend the diverse views of key stakeholders in the transition to a low-carbon economy. Gaining insight into these perspectives can help inform effective policy-making, identify potential areas of agreement and disagreement, and contribute to a more successful and inclusive transition. This paper aims to bridge the gap in the literature by providing a comprehensive analysis of the opinions of professionals from various backgrounds who are directly or indirectly involved in shaping the low-carbon transition.
In our research, we surveyed 286 respondents, including economics and finance professionals, researchers, and public sector regulators. We assessed their views on various aspects of the low-carbon transition, such as the financial sector’s role, the responsibilities of different stakeholders, preferred policy tools, and the impact of recent global shocks such as the COVID-19 pandemic and the war in Ukraine. We found a notable degree of consistency in the respondents’ opinions across various characteristics such as location, professional role and political typology. This indicates that the prevailing views on the transition to a low-carbon economy tend to be similar across these different factors. However, despite the overall uniformity in the majority of the responses, our study identifies statistically significant and systematic differences in opinion for specific characteristics.
We discovered that environmental consciousness, measured through the respondents’ self-reported contribution to reducing the carbon footprint, is the most critical factor driving this heterogeneity. Furthermore, the respondents’ positions (researcher vs. non-researcher) and their affiliated institutions (university, central bank, other) also play a significant role in shaping their opinions. We highlight a few key results:
(i) For the financial sector, the respondents consider the transition to a low-carbon economy more an opportunity than a risk. For banking and investment activities, the transition is considered an opportunity two times more often than a risk. For insurance activities and pension funds, it is 1.4 times more.
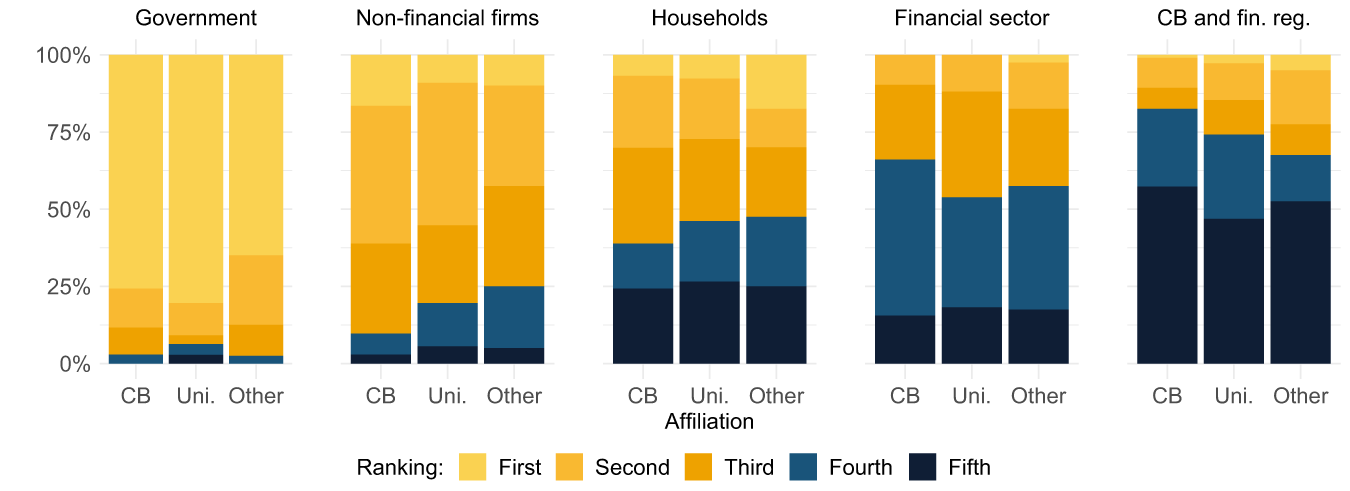
(ii) Of all the potential stakeholders, governments should be the most responsible for climate mitigation policies, and central banks and financial regulators the least responsible. The respondents’ expectations of the financial sector’s involvement are rather small. This assessment remains fairly consistent across the respondents’ affiliations, with central bankers assigning a lower level of responsibility to central banks and the financial sector compared to others (Figure 1).
(iii) The respondents do not expect a large increase in banking risks due to the transition. Most respondents indicate that the transition will not affect liquidity and operational risk and will lead to only some increase in credit and market risk. However, this opinion, like many others, differs between respondents we identified as more and less environmentally conscious.
(iv) While the COVID-19 pandemic is expected to have a neutral or somewhat positive effect on the transition to a low-carbon economy, the war in Ukraine is expected to have a negative impact, significantly contributing to missing climate goals.
(v) According to the majority of the respondents, greenwashing can impact a company’s market valuation, but it is sometimes hard to tell what greenwashing is. Worryingly, 64 per cent believe that financial and non-financial institutions engage extensively in greenwashing. Additionally, the respondents, on average, perceive ‘green’ assets to be correctly valued by the market.
Who should be responsible for the transition to a low-carbon economy? Breakdown by respondents’ affiliation.

In our analysis, we also explore patterns in the respondents’ perspectives that can be attributed to climate optimism or financial stability risk concerns. We find that those who view climate goals as achievable are significantly more likely to see the transition as an opportunity than as a risk. Additionally, we observe a strong connection between the participants’ views on changes in banking risks, the attainability of climate goals and their evaluation of the transition as a risk or opportunity across various sectors. Specifically, participants anticipating an increase in banking risks are more likely to see the transition as a risk than an opportunity in most sectors. This differentiation does not create a definitive separation, dividing all the respondents into two uniform groups. Instead, it sheds light on other possible factors beyond the respondents’ characteristics in evaluating the various anticipated economic and financial consequences of the transition to a low-carbon economy.
This paper contributes to the literature in several ways. Firstly, it offers a comprehensive analysis of the opinions of key stakeholders involved in the transition to a low-carbon economy, building on previous work that explores stakeholder perspectives and the dynamics of the low-carbon transition (Steg et al., Reference Steg, Perlaviciute, van der Werff and Lurvink2014; Geels et al., Reference Geels, Sovacool, Schwanen and Sorrell2017; Stroebel and Wurgler, Reference Stroebel and Wurgler2021; van Benthem et al., Reference van Benthem, Crooks, Giglio, Schwob and Stroebel2022), the financial implications of climate change (Dietz et al., Reference Dietz, Bowen, Dixon and Gradwell2016; Ilhan et al., Reference Ilhan, Sautner and Vilkov2021), the role of the financial sector in supporting the low-carbon transition (Campiglio et al., Reference Campiglio, Dafermos, Monnin, Ryan-Collins, Schotten and Tanaka2018; Hartzmark and Sussman, Reference Hartzmark and Sussman2019) and the integration of Environmental, Social and Governance (ESG) factors into investment decisions (Engle et al., Reference Engle, Giglio, Kelly, Lee and Stroebel2020; Krueger et al., Reference Krueger, Sautner and Starks2020). Secondly, it highlights the impact of environmental consciousness and professional roles in shaping these opinions, extending the findings of prior research on the factors influencing stakeholder perspectives (Riedl and Smeets, Reference Riedl and Smeets2017; Choi et al., Reference Choi, Song and Jiang2020; Bolton and Kacperczyk, Reference Bolton and Kacperczyk2021).
Our findings can also be linked to recent developments in the literature on theoretical models of climate finance, such as those by Battiston et al. (Reference Battiston, Mandel, Monasterolo, Schütze and Visentin2017) and Pástor et al. (Reference Pástor, Stambaugh and Taylor2021). Battiston et al. (Reference Battiston, Mandel, Monasterolo, Schütze and Visentin2017) develop a theoretical framework for climate risks in financial networks, highlighting the importance of direct and indirect exposures. Their research shows that considerable portions of investors’ equity portfolios are exposed to climate-policy-relevant sectors, underscoring the importance of well-timed climate policies. These conclusions align with our observation that stakeholders view the low-carbon transition as an opportunity rather than as a risk for the financial sector, although they anticipate a rise in banking risks. Pástor et al. (Reference Pástor, Stambaugh and Taylor2021) explore how sustainable investing impacts asset pricing and capital reallocation, showing that increased sustainable investing leads to higher valuations for green assets and encourages firms to adopt sustainable practices. This is particularly relevant to our findings, as it supports the idea that respondents perceive the transition to a low-carbon economy more as an opportunity than as a risk, particularly in the financial sector. Their prediction is also in line with our observation that the respondents anticipate a shift in financial institutions’ portfolios from brown to green assets following pro-climate policy actions such as the 2015 Paris Climate Agreement and President Biden’s 2021 decision to rejoin the Agreement.
Moreover, this paper provides valuable insights that can inform policy-making, fostering a more successful and inclusive low-carbon transition. In particular, our findings contribute to the literature on the effectiveness of climate policies in shaping economic outcomes (Bolton et al., Reference Bolton, Despres, Pereira da Silva, Samama and Svartzman2020), the role of ESG factors in risk management (Bolton and Kacperczyk, Reference Bolton and Kacperczyk2021; Ilhan et al., Reference Ilhan, Sautner and Vilkov2021) and the growing recognition of the importance of expert surveys in economics and finance (Ambrocio et al., Reference Ambrocio, Hasan, Jokivuolle and Ristolainen2020; Choi and Robertson, Reference Choi and Robertson2020; Stroebel and Wurgler, Reference Stroebel and Wurgler2021; Malovaná et al., Reference Malovaná, Hodula, Gric and Bajzík2023). In our survey, we expand upon the work of Stroebel and Wurgler (Reference Stroebel and Wurgler2021), which focuses on a limited set of questions concerning climate finance, including risk types and asset pricing. In contrast, our survey aims to provide a more comprehensive overview of opinions regarding the risks and opportunities associated with the transition to a low-carbon economy across various sectors, the factors influencing the transition, optimal climate policy design, the response of the financial sector and the achievability of climate goals. As such, the two surveys should be regarded as complements rather than substitutes. By integrating these diverse perspectives, this study offers a nuanced understanding of the challenges and opportunities associated with the low-carbon transition and its implications for various stakeholders.
In the rest of the paper, we first describe the survey process, methods and respondent characteristics. Next, we analyse the prevailing opinions and highlight significant differences between respondent groups. After that, we examine selected factors more rigorously using probability models and cluster analysis, and then we conclude.
2. Survey method and respondents
We aimed to gather the views of finance and economics academics, professionals, and public sector regulators on the impact of the transition to a low-carbon economy and on the roles of different stakeholders.Footnote 1 We acknowledge that this is a complex and interdisciplinary issue, opinions on which can be strongly influenced by the sociodemographic characteristics and subjective beliefs of each respondent. Therefore, we designed the questionnaire to take into account various aspects and maintain a balance between the level of detail, clarity and simplicity of the questions asked. Given the complexity of the issues analysed, the survey questionnaire was pilot-tested several times. The resulting questionnaire consisted of 10 questions about the impact of the transition to a low-carbon economy and another seven optional questions about the respondent’s background, behaviour and beliefs. The complete questionnaire is provided in Appendix A.
We distributed the survey among respondents from academia and policy institutions due to our desire to obtain the views of both groups. While we expect the opinions of academics to encompass the latest research findings, the expert opinions of professionals should draw on the practical experience gained from decision-making processes within policy institutions. We created a list of about 10,000 email addresses based on the respondents’ expertise and affiliations using the IDEAS/RePEc database.Footnote 2 By limiting ourselves to this database, we may be omitting the potentially valuable opinions of experts who do not have any research publications or those who have chosen not to be listed in the database. Therefore, we encouraged the respondents addressed to forward the questionnaire to their colleagues who may potentially be interested in participating. Because the survey contains questions on the respondents’ professional backgrounds, we can filter the responses afterward and are not limited by the distribution of our initial list of respondents.
The survey was launched online on 22 June 2022 and closed after one month on 22 July 2022. We received 566 questionnaires, of which 286 had answers to all 10 climate questions, and we thus included them in our study. This gave us an overall response rate of about 3 per cent.Footnote 3
Sample selection bias is a concern for any such survey. In our case, the main worry was that individuals more interested in or knowledgeable about climate finance might be more inclined to complete the questionnaire. Depending on the topic, this type of selection is not necessarily undesirable, since for many questions it may be preferable to capture the views of the best informed rather than those of the general population. However, a more problematic scenario would arise if predominantly environmentally conscious respondents or those particularly optimistic about climate solutions chose to participate, potentially skewing our results.
To mitigate this concern and directly explore its implications, we collected detailed information on the respondents’ self-reported contributions to reducing the carbon footprint and their broader opinions on climate change and the search for solutions, alongside other demographic and socioeconomic characteristics. This allowed us not only to document how responses vary with environmental attitudes but also to explicitly test the robustness of our results.
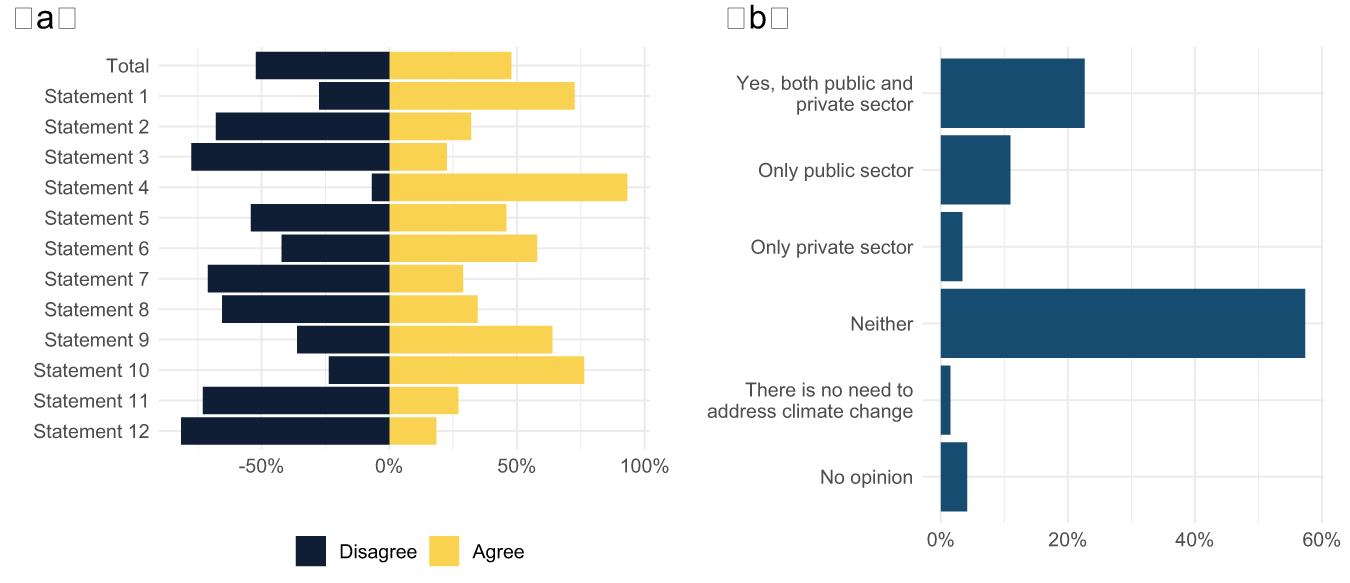
Reassuringly, the distribution of respondents is fairly even between those who contribute and those who do not contribute to reducing the carbon footprint (e.g., through consumption behaviour, financial decisions and environmental activism; refer to panel (a) of Figure 2). Only around 30 per cent indicate that their job position is directly or indirectly related to combating climate change, reducing the carbon footprint, or advocating for relevant activities (Statement 7). Moreover, nearly 60 per cent believe that neither the public nor the private sector pays adequate attention to climate change and the pursuit of a solution, while the remaining 40 per cent agree that at least one of them does (panel (b) of Figure 2).
Respondents’ environmental consciousness and views on climate change and solutions. (a) Do you agree/disagree with the following statements about your contribution to reducing the carbon footprint? (b) In your opinion, do both the public and private sectors pay sufficient attention to climate change and the search for a solution?
Although the questionnaire is anonymous, the survey platform allows us to obtain a list of respondents who have completed the questionnaire, without assigning any specific response to a particular respondent.Footnote 4 To better understand who responded to our survey and the informativeness of the results, we sought additional information about these respondents. Specifically, we collected information from resumes, university websites and personal websites about their home institution, position and publication activity (Table A1 in Appendix B). As for job position, almost a quarter of our respondents are university professors, mostly economics professors. An additional 10 per cent are associate professors and 7 per cent are assistant professors. Next, about 14 per cent of the respondents hold a leading position, such as director, deputy director, or head. Almost 20 per cent of the respondents work as (senior) economists and an additional about 20 per cent as (senior) researchers, advisors, or analysts. The remaining few respondents work as lecturers. If we focus on publication activity, more than three quarters of our respondents published their research in the top 25 per cent of economics and finance journals (Q1). In addition, a fifth of the respondents published their research in at least one of the top 15 economics and finance journals. Furthermore, about 80 per cent of our respondents have published in economics or finance journals in the last three years, showing that our sample consists primarily of active researchers. The average and median period between the first and the last journal publication is 16.5 and 15 years, respectively, indicating that our respondents have solid research experience.Footnote 5
Table A2 in Appendix B contains summary statistics of the demographic information reported by the survey participants. Half of our respondents come from academia, another 36 per cent from central banks and the remaining 14 per cent from other institutions. Regarding job position, researchers predominate over non-research professionals in our sample. Naturally, the vast majority of the researchers (71 per cent) work at universities, followed by central banks (24 per cent). Furthermore, the respondents working in central banks are divided relatively evenly between researchers (44 per cent) and non-researchers (56 per cent).
Regarding location, the respondents reside mainly in Europe – both the North-West (37 per cent) and the South-East (33 per cent). About 12 per cent come from North America and 10 per cent from the rest of the world. The respondents are distributed relatively evenly by their environmental consciousness, with about 45 per cent being more environmentally conscious than the other 55 per cent.Footnote 6 In terms of political typology, most of the respondents would describe themselves as right-wing and liberal.
3. Bird’s eye view of survey results
The survey consists of 10 questions, which we categorize into 5 thematic groups that we examine in the following 5 sub-sections. To summarize and compare the respondents’ opinions effectively, we plot the percentage shares of the responses for the full sample alongside the quantified mean responses for various subgroups of respondents based on their characteristics.
Given that the answer options in our questionnaire are verbal, we have to convert them to numerical values. We quantify the response options on a discrete scale between  $-$1 and 1, with positive values assigned to responses that agree or are positive in some other sense (e.g., ‘increase’, ‘overvalued’ or ‘achievable’). On the other hand, we assigned negative values to responses that disagree or are otherwise negative (e.g., ‘decrease’, ‘undervalued’ or ‘not achievable’). The average of these numerical values (the quantified mean responses) then gives us information about the average opinion on a given question and allows us to compare the answers to individual questions as well as the opinions of selected groups of respondents.
Furthermore, we conduct two non-parametric statistical tests, the Mann–Whitney–Wilcoxon test and the Kruskal–Wallis test, to determine if there are important differences between respondent groups. Based on these tests, we discover that environmental consciousness, measured as the respondents’ self-reported contribution to reducing the carbon footprint, is the most significant factor contributing to variations in the responses. This is followed by the respondents’ roles (researcher vs. non-researcher) and affiliations (university, central bank, other). As a result, we display the quantified mean responses for these groups to emphasize the most crucial differences.
We summarize the quantification of the individual answers in the tables in Appendix C. The appendix also contains a detailed overview of the percentages of all the respondents’ answers across various characteristics and the full tables of the quantified mean responses.
3.1. Is the transition to a low-carbon economy an opportunity or a risk?
Numerous studies have confirmed that climate change reduces well-being by negatively affecting the economy’s future potential growth and labour productivity and diverting resources from investment in productive capital to climate change adaptation (Burke et al., Reference Burke, Hsiang and Miguel2015; Burke and Emerick, Reference Burke and Emerick2016; Dafermos et al., Reference Dafermos, Nikolaidi and Galanis2018; IMF, 2018). Different regions and industries have different degrees of sensitivity to climate change (OECD, 2015; NGFS, 2018). Agriculture and carbon-intensive industries are often cited as the most affected due to both physical risks from climate events and transition risks from tightening climate change policies. However, financial institutions are also increasingly exposed to both categories of risks. If not anticipated, materialization of these risks may potentially lead to significant revaluation losses on financial assets (Dietz et al., Reference Dietz, Bowen, Dixon and Gradwell2016).
Climate change and the transition to a low-carbon economy can also provide opportunities. Tightening environmental regulations can induce efficiency and encourage innovations that help improve commercial competitiveness (Zeqiraj et al., Reference Zeqiraj, Sohag and Soytas2020). This is the ‘Porter Hypothesis’, which was formulated in the mid-1990s (Porter and van der Linde, Reference Porter and van der Linde1995). We are already seeing some sectors developing rapidly, such as research into new energy sources, carbon capture and storage systems, new types of energy storage systems, including batteries, and new types of building materials (for a detailed review, see, e.g., Napp et al. (Reference Napp, Hills, Soltani, Bosch and Mazur2017)).Footnote 7 The new technologies also provide an opportunity for financial market outreach and expansion. The funding of the transition to a low-carbon economy may partially compensate for the negative impact of the risks mentioned above.Footnote 8
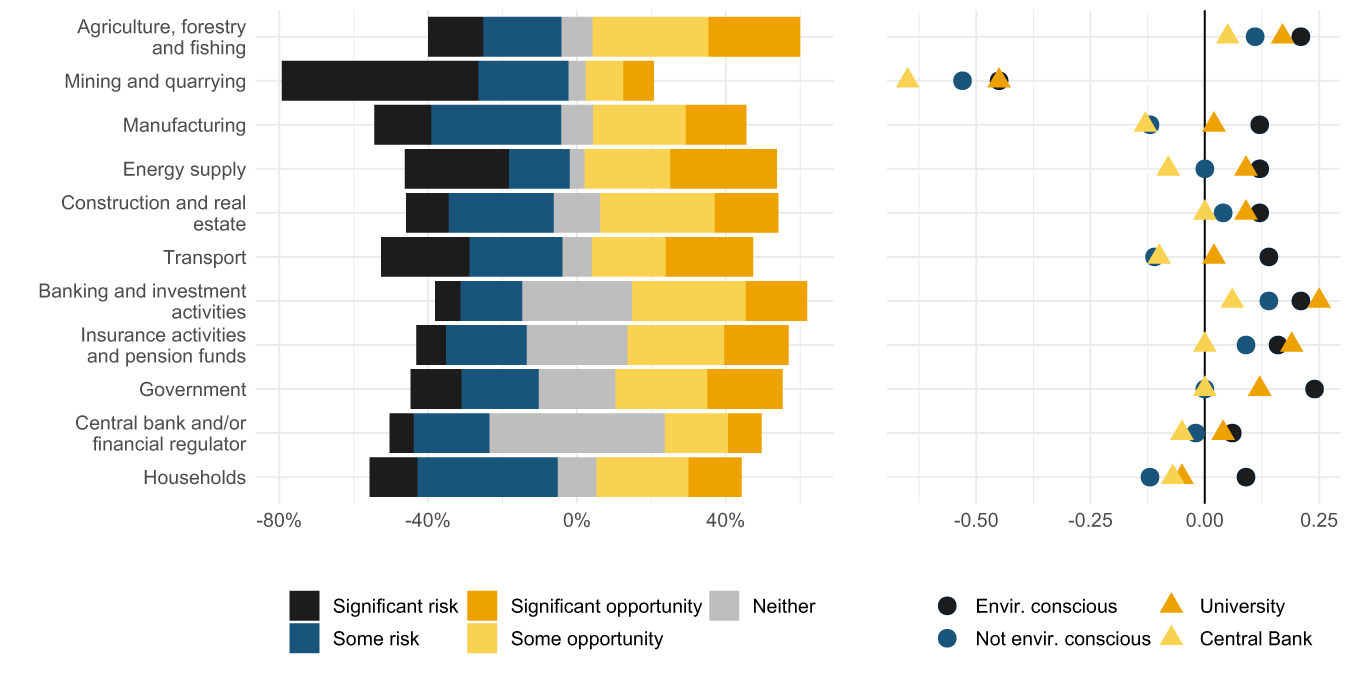
In our questionnaire, we asked the respondents to evaluate whether the transition to a low-carbon economy is an opportunity or a risk (significant or some) for different financial and non-financial sectors (Figure 3). On average, the respondents recognize the transition to a low-carbon economy as an opportunity for the financial sector (both banks and non-banks, such as investment funds and insurance and pension companies) and agriculture, forestry and fishing. On the other hand, the respondents clearly recognize the transition as a risk for mining and quarrying. For the rest of the sectors, the respondents are fairly evenly divided between those recognizing opportunities and those recognizing risks, bringing the quantified mean response close to zero.
Is the transition to a low-carbon economy an opportunity or a risk for the following sectors?

Regarding cross-sectional heterogeneity, the opinions are more or less consistent across the respondents’ locations. However, the opinions differ concerning the respondents’ professional roles. Specifically, respondents from central banks and those working in non-research positions are generally more pessimistic, recognizing more risks than opportunities across all sectors (light yellow symbols, right panel). On the other hand, respondents from universities and researchers are more optimistic, with their quantified mean response being more positive across all sectors. The difference between these two groups of respondents is statistically significant, especially for the financial sector, but to a lesser extent for other sectors as well. Another characteristic that plays a vital role is whether the respondent is considered to be environmentally conscious. Those categorized as more conscious are generally more optimistic, i.e., recognizing the transition as more of an opportunity than a risk across all sectors (dark blue symbols, right panel).
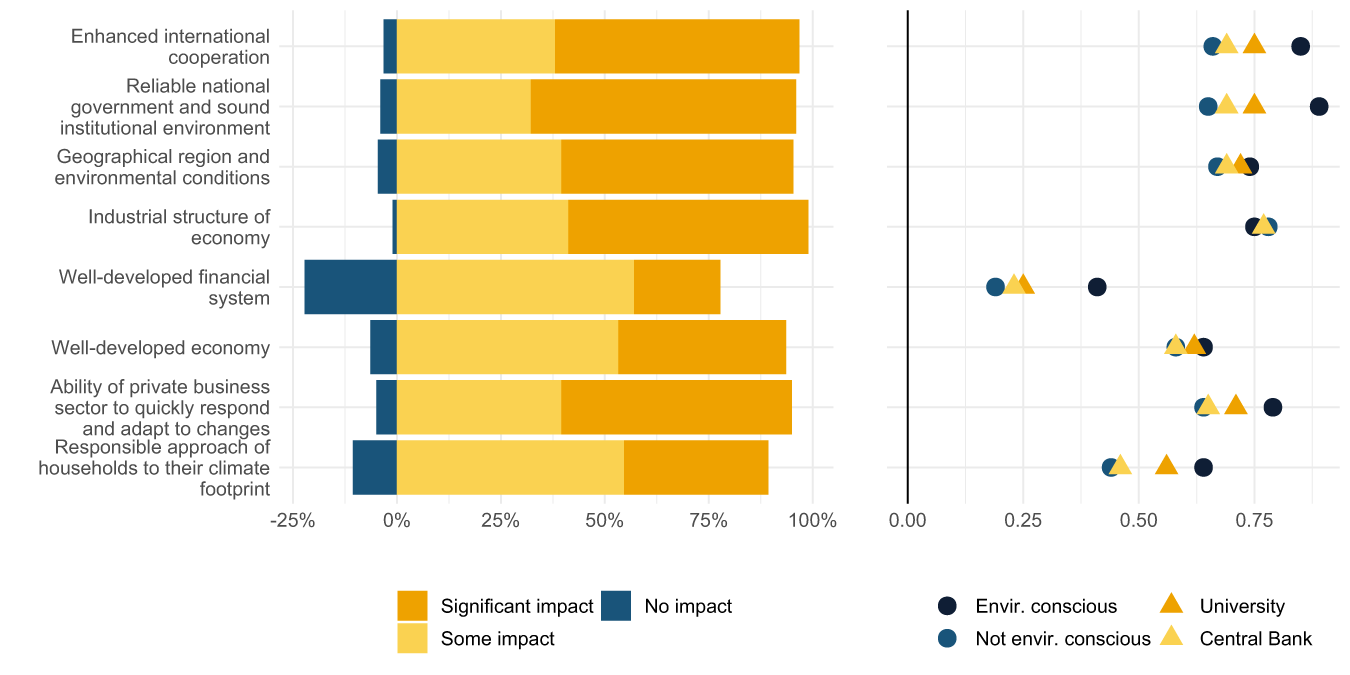
As an accompanying question to the previous one, we asked what impact the selected factors will have on the transition to a low-carbon economy in a given country or region (Figure 4). On average, most of the listed factors received high scores, identifying them as significant influences. The respondents attach the greatest weight to the industrial structure of the economy, a reliable national government, a sound institutional environment and enhanced international cooperation. They also rank highly the geographical location and overall environmental conditions and the ability of the private business sector to respond and adapt to changes quickly. On the other hand, they see a lower influence of households’ approach to their carbon footprint and financial system development, although not a negligible one. The heterogeneity among the respondents is driven primarily by their environmental consciousness, with more environmentally conscious individuals placing greater importance on the listed factors and less environmentally conscious respondents more frequently choosing options indicating some or no impact (dark vs. light blue symbols, right panel).Footnote 9
What impact will the following factors have on the transition to a low-carbon economy in a given country or region?

3.2. How important should the contributions and responsibility of different sectors be?
To be successful and timely, the transition to a low-carbon economy will require not only changes in relative prices and large-scale public and private investment in new technologies and practices, but also changes in consumer behaviour, production, land use and agricultural processes (IPCC, Reference Masson-Delmotte, Zhai, Pörtner, Roberts, Skea and Shukla2018). Fiscal policy naturally offers itself as one of the central policies for this transition, as it has a wide range of instruments at its disposal. Carbon pricing policies, such as carbon taxes and cap-and-trade systems, are critical to any successful climate mitigation strategy. However, the cost of carbon emissions is highly uncertain and extremely difficult to quantify (Gollier, Reference Gollier2012; Barnett et al., Reference Barnett, Brock and Hansen2020). Nevertheless, carbon taxes and emissions trading schemes seem to effectively reduce carbon emissions and generate significant revenues for the national budget (Farid et al., Reference Farid, Keen, Papaioannou, Parry, Pattillo and Ter-Martirosyan2016). Carbon pricing then motivates private firms to innovate more in clean technologies (Aghion et al., Reference Aghion, Dechezleprêtre, Hémous, Martin and van Reenen2016).
Financial flows play a vital role in transitioning to a low-carbon economy, as they drive technological transformations. Public investment is necessary, but private investment in production capacity, infrastructure, and research and development is crucial. Monetary and regulatory policy instruments can also play a role in promoting private climate finance. Some options are within most central bank mandates (consideration of climate risks in asset purchase programs or eligible collateral). In contrast, others may be more controversial (green asset purchases, credit allocation policies and adjustment of monetary policy frameworks). The existing literature offers little on the appropriate mix of climate mitigation policies. However, it points out that policy coordination will be crucial in this regard (Fay et al., Reference Fay, Hallegatte, Vogt-Schilb, Rozenberg, Narloch and Kerr2015).
Reflecting on this complex and vital issue, we asked our respondents how significant the contribution and responsibility of selected sectors – government, non-financial corporations, households, financial industry and central bank/financial regulator – should be in the transition to a low-carbon economy. Specifically, we asked them to rank the sectors from the most to the least important. In a follow-up question, we asked the respondents what were the most effective measures taken by the sector they ranked first. They were allowed to choose up to three listed measures (see the appendix for a detailed list).
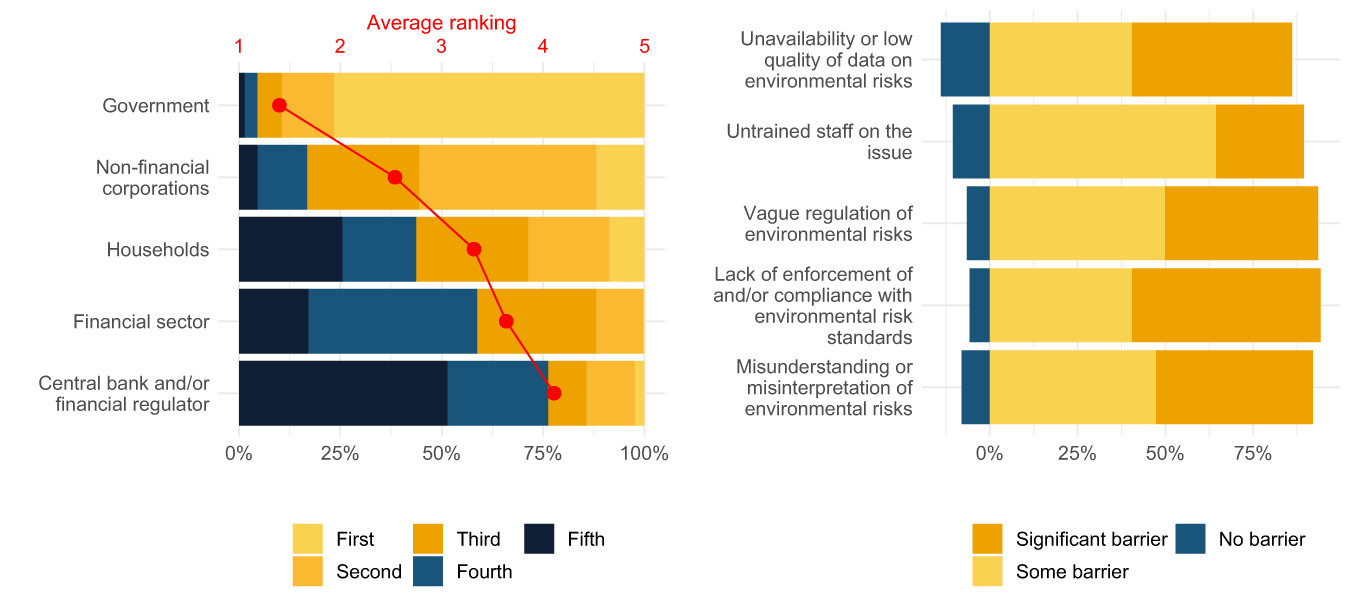
The vast majority of the respondents believe that government should be the primary sector responsible for, and the main contributor to, the low-carbon transition (left panel of Figure 5). About 77 per cent of the respondents ranked government first, while only 13 per cent ranked it second, usually after non-financial corporations. Likewise, the respondents were consistent in their opinion of which government measure is the most effective in supporting the transition. More than 60 per cent of respondents stated that carbon taxes are the most effective. At the same time, an additional 40 per cent voted for cap-and-trade systems and regulatory policies for the non-financial sector, such as limits on car emissions. Only 18 per cent believe that enforcing disclosures of climate-related activities could be an effective measure, and only 8 per cent would opt for issuing sovereign green bonds. These views are relatively consistent across the respondents’ characteristics.
The second most important stakeholder contributing to mitigating the impact of climate change should be non-financial corporations, most respondents believe. About 45 per cent ranked this sector second after government, while an additional 28 per cent ranked it third, and 12 per cent ranked it first. Reducing firms’ carbon footprint and investing in innovation in climate technologies are considered the most effective measures taken by non-financial firms. As for the remaining stakeholders, households and the financial sector ranked, on average, third and fourth, respectively, while the central bank and the financial regulator ended up at the bottom of the list.Footnote 10 We do not see much heterogeneity among the respondents. Interestingly, respondents from central banks ranked the central bank lower and non-financial corporations higher than the other respondents.
As an accompanying question to the previous two, we asked what could be the barriers for the public and private sectors in the assessment and mitigation of environmental risks. We gave the respondents five options (right panel of Figure 5). These options received, on average, very similar ratings, with quantified mean responses ranging between 0.45 and 0.66. The respondents identified the lack of enforcement of and compliance with environmental risk standards as the most significant barrier, followed by vague regulation of environmental risks and misunderstanding and misrepresentation of environmental risks. Unavailability or low quality of data and untrained staff are perceived as less severe barriers.
How important should the responsibility of different sectors be, and what are the barriers to the assessment and mitigation of environmental risks?

3.3. Bank risks, asset valuation and portfolio reallocation – does the low-carbon transition matter?
As we mentioned earlier, the financial sector and its behaviour will play a vital role in the impact of climate change on the global economy and the effectiveness of climate mitigation policies. For instance, financing projects that will speed up the transition to a low-carbon economy will make alternatives to fossil fuels more attractive (Mazzucato and Perez, Reference Mazzucato and Perez2014; Krueger et al., Reference Krueger, Sautner and Starks2020). However, financial institutions are also increasingly exposed to both physical and transition risks, which may potentially lead to significant revaluation losses on financial assets. We can therefore expect reallocation from financial investments with high environmental risks to more climate-friendly investments with lower risks. Various events may trigger such reallocation, such as the announcement of new climate policies, increasing public awareness and large unexpected shocks, such as the COVID-19 pandemic or the war in Ukraine.
Carbon risk, or the financial risk associated with carbon emissions, affects carbon-intensive firms due to the anticipated adoption of climate policies. For example, some fossil fuel firms may face devaluation if they cannot utilize their existing fossil fuel reserves (McGlade and Ekins, Reference McGlade and Ekins2015). However, carbon risk extends beyond fossil fuel companies to any firm with a high carbon footprint. A transition risk premium has been observed in equity and options markets, particularly during periods of heightened climate change awareness (Bolton and Kacperczyk, Reference Bolton and Kacperczyk2021; Ilhan et al., Reference Ilhan, Sautner and Vilkov2021, Ramelli et al., Reference Ramelli, Wagner, Zeckhauser and Ziegler2021b). Additionally, Kleimeier and Viehs (Reference Kleimeier and Viehs2016) found that firms voluntarily disclosing carbon dioxide emissions enjoy lower credit costs than their non-disclosing counterparts. Similarly, Alessi et al. (Reference Alessi, Ossola and Panzica2021) show that European individual stock returns exhibit a negative greenium – a risk premium linked to a firm’s environmental performance and transparency.
The existing literature confirms that climate-related policy events, such as the Paris Climate Agreement of 2015 (COP21) and the UN Climate Action Summit in 2019 and related protests, affect the financial sector’s decisions. COP21 increased banks’ awareness of carbon risk (Krueger et al., Reference Krueger, Sautner and Starks2020) and drew their credit away from polluting firms (Reghezza et al., Reference Reghezza, Altunbas, Marques-Ibanez, d’Acri and Spaggiari2022). Furthermore, Delis et al. (Reference Delis, de Greiff and Ongena2018) show that banks have begun pricing the risk of stranded fossil fuel reserves after COP21. The first global climate strike in March 2019Footnote 11 caused a decrease in the stock prices of carbon-intensive firms and led to a downgrade of longer-term earnings forecasts on carbon-intensive firms (Ramelli et al., Reference Ramelli, Ossola and Rancan2021a).
Regarding the COVID-19 pandemic and the war in Ukraine, we still have only limited evidence of their long-term impact on the transition to a low-carbon economy and sustainable investing. Such unexpected shocks can cause governments and investors to lose sight of their environmental consciousness and reevaluate their climate change policy commitment, which inevitably increases (climate policy) uncertainty. Recent studies show that higher political uncertainty is associated with lower equity returns and higher volatility (Brogaard and Detzel, Reference Brogaard and Detzel2015; Brogaard et al., Reference Brogaard, Dai, Ngo and Zhang2020). However, some studies show that sustainable stocks experienced lower volatility (Shields et al., Reference Shields, Ajour El Zein and Vila Brunet2021) and higher resilience (Albuquerque et al.; Reference Albuquerque, Koskinen, Yang and Zhang2020, Engelhardt et al., Reference Engelhardt, Ekkenga and Posch2021) during the COVID-19 period. There are several possible reasons why investors in turbulent times prefer to hold shares of more sustainable firms and limit their exposure to stocks of less sustainable firms. For instance, investors may place higher trust in sustainable firms (Lins et al., Reference Lins, Servaes and Tamayo2017), be more loyal to them (Albuquerque et al., Reference Albuquerque, Koskinen, Yang and Zhang2020; Broadstock et al., Reference Broadstock, Chan, Cheng and Wang2021) or simply have a higher preference for sustainable funds (Riedl and Smeets, Reference Riedl and Smeets2017; Hartzmark and Sussman, Reference Hartzmark and Sussman2019).
In what follows, we reflect on the existing literature to examine the respondents’ views on the relationship between the financial sector and climate mitigation policies. We focus on their expectations regarding banks’ risks, their assessment of green financial asset valuations, and whether financial institutions have altered their asset allocations in response to particular (climate policy) events.
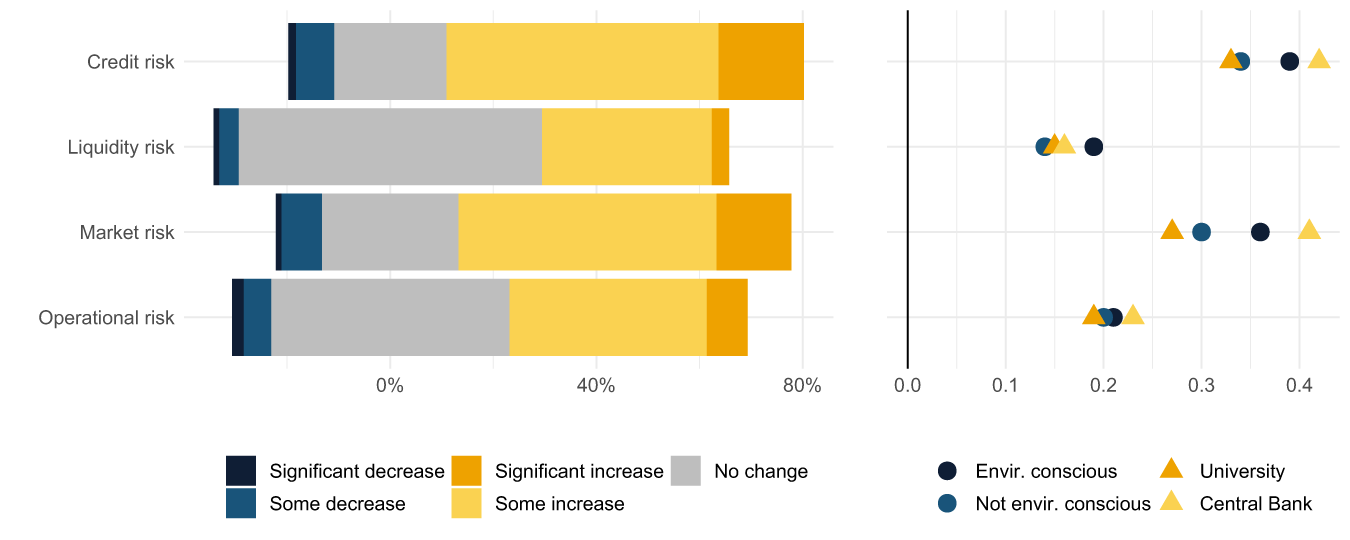
Regarding banks’ risks, we asked how the transition to a low-carbon economy will affect credit, liquidity, market and operational risks. On average, the respondents expect a modest increase in all bank risks, with credit and market risks increasing more than operational and liquidity risks (Figure 6). About 50 per cent of the respondents expect credit and market risks to increase somewhat, while approximately 20–25 per cent anticipate no change. Conversely, 55 and 43 per cent foresee no change in liquidity and operational risks, respectively, and around one-third expect a slight increase in these risks. These views remain consistent across the respondents’ characteristics, except for environmental consciousness and professional roles, where more environmentally conscious respondents (dark blue symbol, right panel) and central bankers (light yellow symbol, right panel) expect a larger increase in banks’ risks due to the transition, with a statistically significant difference for market and liquidity risks.
How will the transition to a low-carbon economy affect banks’ risks?

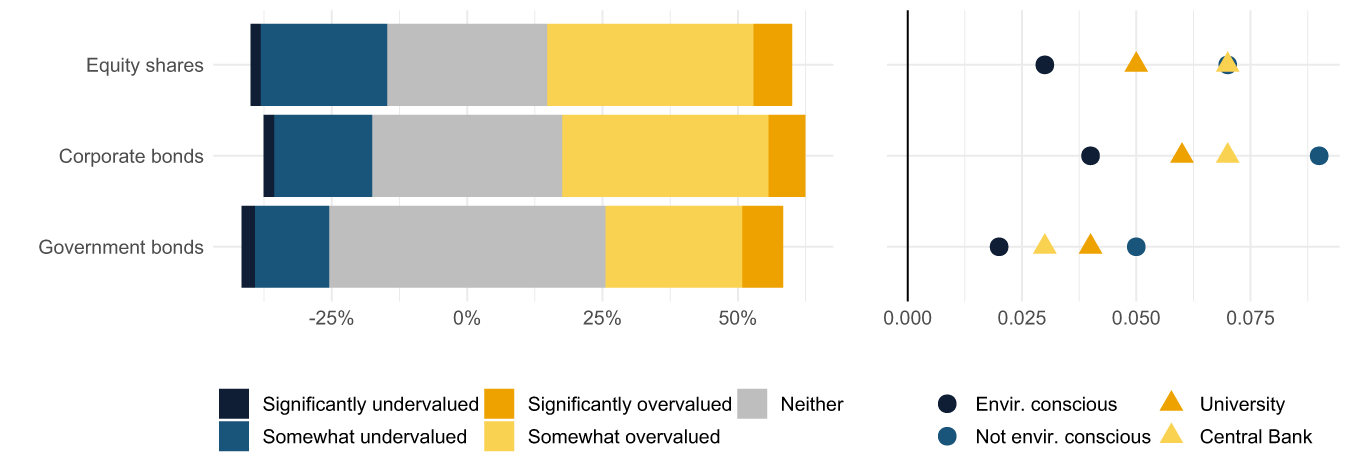
Next, we asked how the respondents would generally describe the market valuation of green financial assets, i.e., assets that investors perceive as environmentally sustainable. According to Figure 7, the respondents, on average, believe that green financial assets (equities, corporate bonds and government bonds) are more or less correctly valued or only slightly overvalued. We found this opinion consistent across the respondents’ characteristics, except for environmental consciousness. Less environmentally conscious respondents are more likely to perceive green financial assets as overvalued, with a statistically significant difference for equities and corporate bonds but not for government bonds.
How would you generally describe the market valuation of green financial assets?

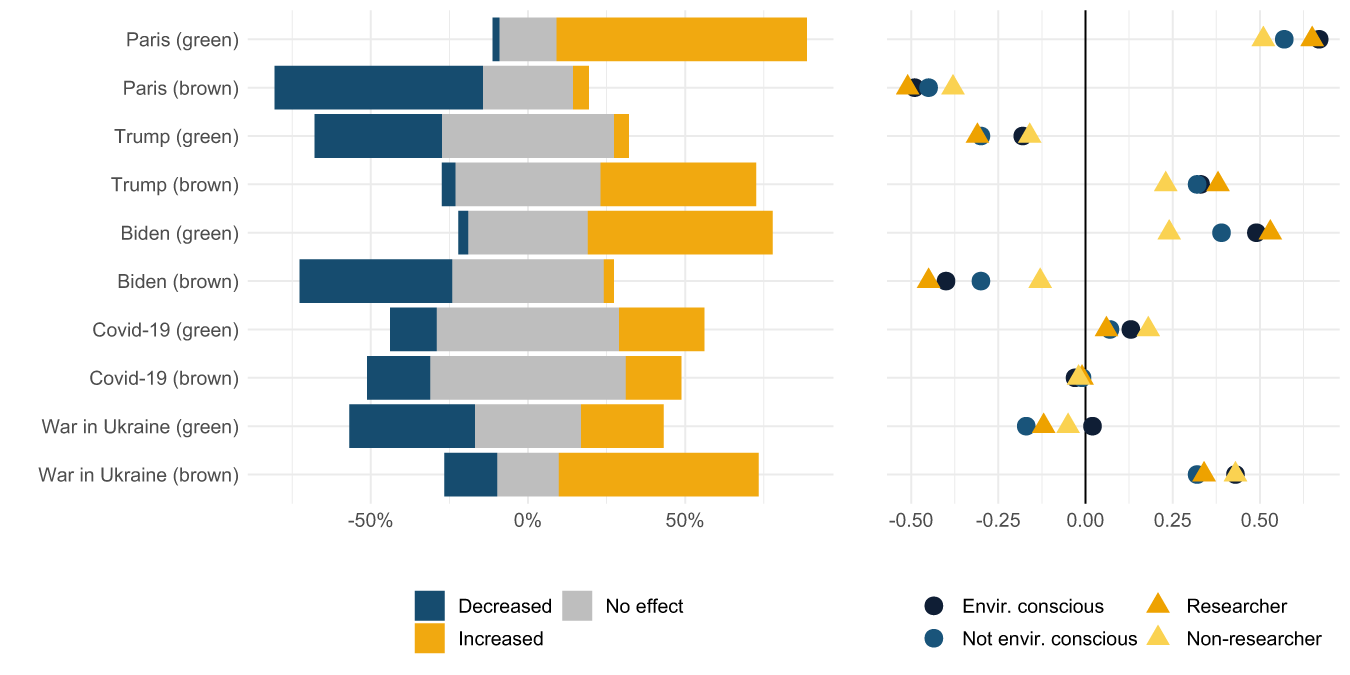
Last but not least, we asked how financial institutions likely altered their exposure to green and brown firms in response to specific climate policy events (COP21, President Trump’s withdrawal from COP21 and President Biden’s rejoining of COP21), the COVID-19 pandemic and the war in Ukraine. As shown in Figure 8, the respondents’ beliefs generally align with intuition for climate policy events. They assume that exposure to green firms increased following COP21 and President Biden’s announcement, and decreased after President Trump’s withdrawal. Conversely, exposure to brown firms is believed to have decreased after COP21 and President Biden’s announcement, and increased following President Trump’s withdrawal.
How have financial institutions changed their exposure to green and brown non-financial corporations in response to the following events?

Interestingly, contrasting expectations exist for the impact of the COVID-19 pandemic and the war in Ukraine. The respondents believe the pandemic had a neutral or slightly positive effect on the transition, increasing exposure to green firms and reducing exposure to brown firms, whereas the war in Ukraine is expected to have a strongly negative impact, with a prevailing belief that exposure to brown firms has increased and/or will increase. The respondents’ opinions significantly differ based on their environmental consciousness and professional roles, with more environmentally conscious respondents (dark blue symbol, right panel) and researchers (orange symbol, right panel) expecting more pronounced portfolio reallocation after climate events.
3.4. How big is the problem of greenwashing?
We usually understand greenwashing to mean a form of marketing used deceptively to convince the public that an organization’s products, goals and policies are environmentally friendly. With the increasing demand for green products and responsible investments in recent years, some companies may have resorted to greenwashing. The literature shows that better ESG performance improves firm reputation (Martínez-Ferrero et al., Reference Martínez-Ferrero, Banerjee and García-Sánchez2016), access to capital (El Ghoul et al., Reference El Ghoul, Guedhami, Kwok and Mishra2011; Cheng et al., Reference Cheng, Ioannou and Serafeim2014) and firm value (Ferrell et al., Reference Ferrell, Hao and Renneboog2016). Although the proportion of companies reporting ESG activities has grown, ESG data in sustainability reports often lack auditing. As for the extent of the problem, for example, Dumitrescu et al. (Reference Dumitrescu, Gil-Bazo and Zhou2022) show that 24 per cent of mutual funds in the US market engage in greenwashing.
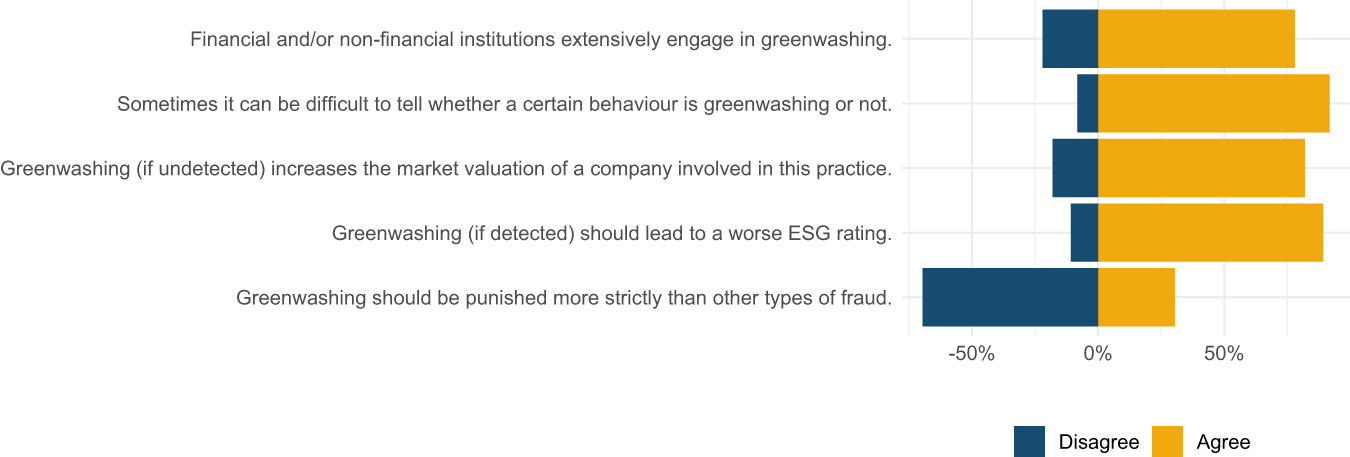
To gauge our respondents’ opinions on the prevalence and significance of greenwashing, we asked them to agree or disagree with various statements. The results in Figure 9 reveal that 90 per cent find it difficult to recognize greenwashing, 81 per cent believe undetected greenwashing increases a company’s market valuation and 71 per cent think detected greenwashing should lead to a worse ESG rating. While 60 per cent feel that institutions extensively engage in greenwashing, only 26 per cent support stricter punishment for it compared to other types of fraud.
Do you agree with the following statements regarding greenwashing?

3.5. How will the COVID-19 pandemic and the war in Ukraine affect the achievement of climate goals?
To put all the other questions into a broader context, we asked the respondents to evaluate the achievability of climate policy goals and the impact of the COVID-19 pandemic and the war in Ukraine on the ability to achieve these goals. The answers should help us see if our respondents perceive the existing climate goals as realistic in light of recent developments. We were interested in the respondents’ opinions on the attainability of three goals: (i) the long-term goal of keeping the increase in the global average temperature to well below two degrees Celsius above pre-industrial levels, (ii) the short-term goal of reducing emissions by more than 50 per cent by 2030 (relative to 1990 levels for the EU and relative to 2005 levels for the US) and (iii) the goal of climate neutrality by 2050 (EU and US goal).
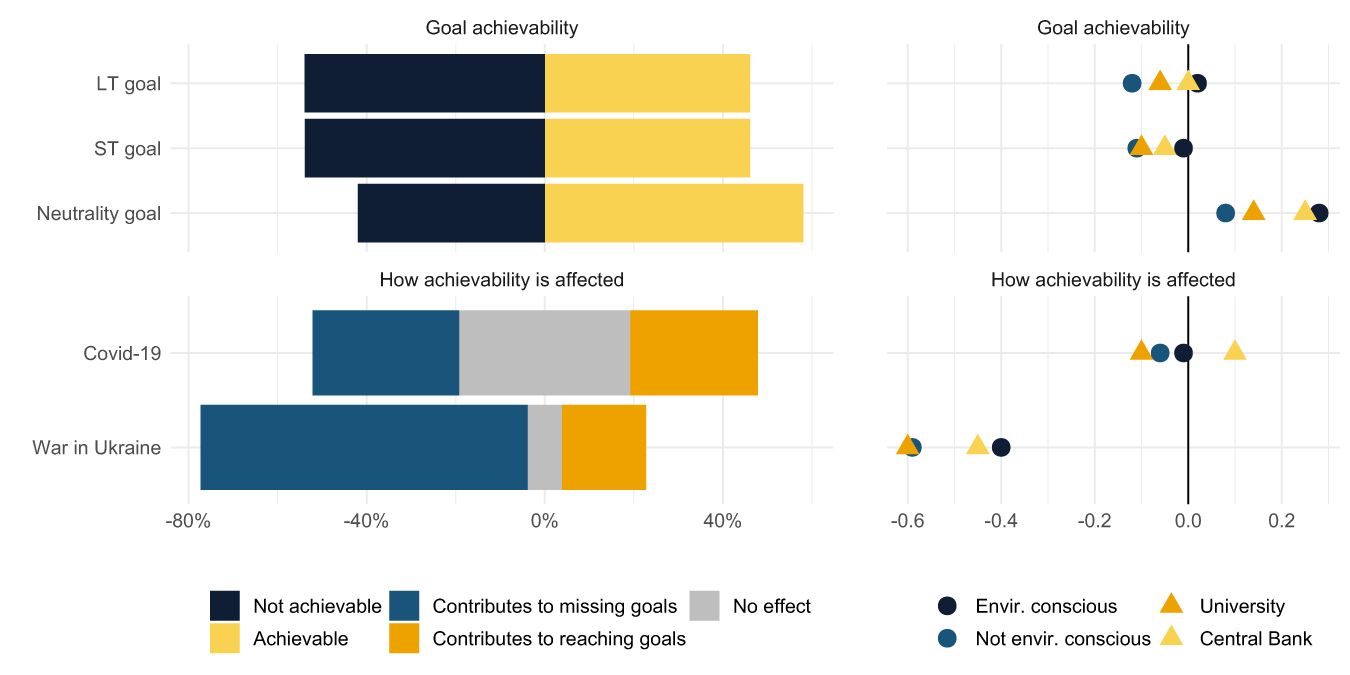
The results in Figure 10 show that respondents are generally more optimistic about achieving the climate neutrality goal than the other two goals. Specifically, about 55 per cent consider it possible to achieve climate neutrality, while about 40 per cent do not. On the other hand, 51 per cent perceive the other two goals as unattainable and about 44 per cent as attainable. All in all, our respondent pool is split roughly half and half on the issue of climate goals. This opinion is relatively consistent across the respondents’ characteristics, with a few exceptions. More environmentally conscious respondents (dark blue symbol, right panel) and central bankers (light yellow symbol, right panel) are more optimistic about the attainability of climate goals, though the difference is not statistically significant.
Are the following goals achievable? How will the COVID-19 pandemic and the war in Ukraine affect reaching these goals?

Regarding the impact of the COVID-19 pandemic and the war in Ukraine, the respondents, on average, expect the war in Ukraine to contribute to missing the climate goals. In contrast, the COVID-19 pandemic is expected to have a limited to no effect. There are notable differences in opinion between respondents from different regions. Respondents in South and Eastern Europe are generally more pessimistic about the impact of the war in Ukraine, with 78 per cent stating that the war will contribute to missing the climate goals. This result is expected, given the high energy demand of industry in these regions. On the other hand, the impact of the COVID-19 pandemic on climate goals is perceived more negatively in North America than in other regions. Surprisingly, respondents from central banks are more optimistic about the impact of both COVID-19 and the war in Ukraine relative to their peers, although they still expect the war to contribute to missing the goals. Environmentally conscious respondents are also, on average, more optimistic, consistent with the pattern seen for other questions.
4. Empirical analysis
In the previous section, we revealed the non-negligible heterogeneity of the respondents’ answers with regard to their demographic and socioeconomic profiles. However, we only looked at these differences individually. In order to reveal underlying patterns based on multiple demographic characteristics, we perform a cluster analysis where we let the data ‘speak for itself’ in terms of identifying related groups of respondents. This approach can uncover additional insights that might not be apparent when each variable is considered individually. We perform hierarchical agglomerative clustering and use different statistics to determine the number of clusters. We use the respondents’ demographic characteristics as inputs into the cluster analysis and identify four clusters. Table A13 in Appendix D compares the demographic characteristics of the respondents in the clusters.
The clustering results reveal four distinct groups. We label these as (1) Environmentally Conscious Researchers, (2) Environmentally Less Conscious Researchers, (3) Libertarian Non-Researchers and (4) Authoritarian Non-Researchers. This classification reflects that among researchers, who are generally more exposed to climate-related studies and thus likely share similar information sets, differences are primarily driven by their environmental preferences. In contrast, for non-researchers, political orientation plays a more prominent role in shaping their views.
Therefore, as a next step, we establish testable hypotheses and formally examine the role of these characteristics in the context of all the respondents’ characteristics. The first two hypotheses relate to these characteristics:
Hypothesis 1. Environmentally conscious respondents are generally more optimistic in evaluating the impact of the transition to a low-carbon economy while being aware of the risks.
Hypothesis 2. The professional role of the respondents systematically affects their opinion on the impact of the transition to a low-carbon economy.
On top of the respondents’ characteristics, we hope to shed more light on the recorded heterogeneity stemming from the cross-dependency of the individual answers. To identify any systematic patterns in the responses that go beyond demographic and socioeconomic characteristics, we take a two-step approach. Firstly, we evaluate the dependency between the responses to pairs of questions using Pearson’s Chi-squared contingency coefficients and associated p-values. The contingency coefficient serves as a non-parametric counterpart to the correlation coefficient, specifically for categorical data, and quantifies the level of association between two variables on a scale of 0 (no association) to 1 (perfect association). However, unlike the correlation coefficient, the contingency coefficient can only determine the strength of the relationship and not its direction. Therefore, we use it to suggest associations between responses for generating testable hypotheses. Appendix E contains further information on the contingency coefficients.
Secondly, to verify these hypotheses, we supplement the contingency analysis with a linear probability model in the following sub-sections, estimating the probability of participants answering two specific questions in a particular way while controlling for other characteristics. This approach allows us to detect how the probability shifts (i.e., declines or rises) based on the various answer choices of the respondents.
The contingency analysis reveals that the respondents generally exhibit consistency in their opinions within one question. For example, they consistently perceive the transition to a low-carbon economy as a risk or opportunity across sectors. Similarly, they maintain coherence in assessing individual bank risks, the overvaluation of different asset classes, portfolio rebalancing in response to different events and the achievability of different climate goals. We also identify a notable interdependence among certain question groups, such as between evaluating the low-carbon transition as a risk or opportunity and the expected change in banking risks, or between the views on the attainability of climate goals and the impact of COVID-19 and the war in Ukraine.
In terms of the direction of the dependence between the answers, two distinct lines of the respondents’ views may emerge – a more optimistic perspective on climate issues and their solutions or a comparatively pessimistic view highlighting financial stability risk concerns. We do not directly measure the climate optimism of our respondents or the financial stability risks they perceive to be associated with the transition. However, we can derive this from a combination of patterns identified in their answers. For instance, we can assume that those who are more climate optimistic are more likely to perceive the transition to a low-carbon economy as an opportunity than a risk. We also expect these respondents to hold a rather more optimistic attitude towards the impact of the transition across multiple questions in our survey. Similarly, we can assume that respondents having financial stability risk concerns are more likely to perceive the transition as a risk and, at the same time, hold a more pessimistic view of other areas connected with the impact on the financial sector. Additionally, we expect these patterns to explain the variability in the answers on top of the respondents’ demographic and socioeconomic characteristics, notwithstanding their environmental consciousness.
Based on these dependencies, we define two additional hypotheses to clarify the direction of the association between the responses. We then formally test the probability of answering pairs of questions in such a way that would be consistent with climate optimism (Hypothesis 3) and financial stability risk concerns (Hypothesis 4):
Hypothesis 3. Respondents who are more optimistic about the potential of climate solutions are more likely to have positive attitudes towards the transition to a low-carbon economy.
Hypothesis 4. Respondents who are more pessimistic about the potential of climate solutions are more likely to have financial stability concerns about the transition to a low-carbon economy.
In the next part, we test all four hypotheses formally using a linear probability model.
4.1. Is it all about environmental consciousness?
We start by examining the first two hypotheses, which connect the respondents’ opinions on the economic impact of the transition to their demographic and socioeconomic characteristics. We estimate the impact of these characteristics on the probability of specific answers according to Equation (1).
 \begin{equation}
BinaryAnswer_{i}^{q} = \alpha^{q} + \beta^{q} EnvinConscious_{i} + \gamma_1^{q} Position_{i} + \gamma_2^{q} Institution_{i} + \delta^{q} X_{i} + \epsilon_{i}^{q}.
\end{equation}
\begin{equation}
BinaryAnswer_{i}^{q} = \alpha^{q} + \beta^{q} EnvinConscious_{i} + \gamma_1^{q} Position_{i} + \gamma_2^{q} Institution_{i} + \delta^{q} X_{i} + \epsilon_{i}^{q}.
\end{equation} The dependent variable  $BinaryAnswer_{i}^{q}$ is a binary indicator equal to one if the answer of respondent $i$ to question $q$ is ‘agree’ or positive in some other sense (e.g., ‘increase’, ‘overvalued’ or ‘achievable’). In other words, responses that were assigned positive values in our calculation of the quantified mean response are now assigned a value of one. The variable $EnvinConscious_{i}$ is our measure of environmental consciousness, a characteristic that emerged as a statistically significant determinant in most questions. The variables $Position_{i}$ and $Institution_{i}$ are dummy-coded variables for the respondent’s primary position (researcher vs. non-researcher) and institution (university, central bank, other). The vector $X_{i}$ contains all the remaining dummy-coded demographic variables. We estimate the model only for selected questions where we have identified significant heterogeneity. Coefficient $\beta^{q}$ allows us to verify Hypothesis 1, while coefficients $\gamma_1^{q}$ and $\gamma_2^{q}$ help us to evaluate Hypothesis 2.
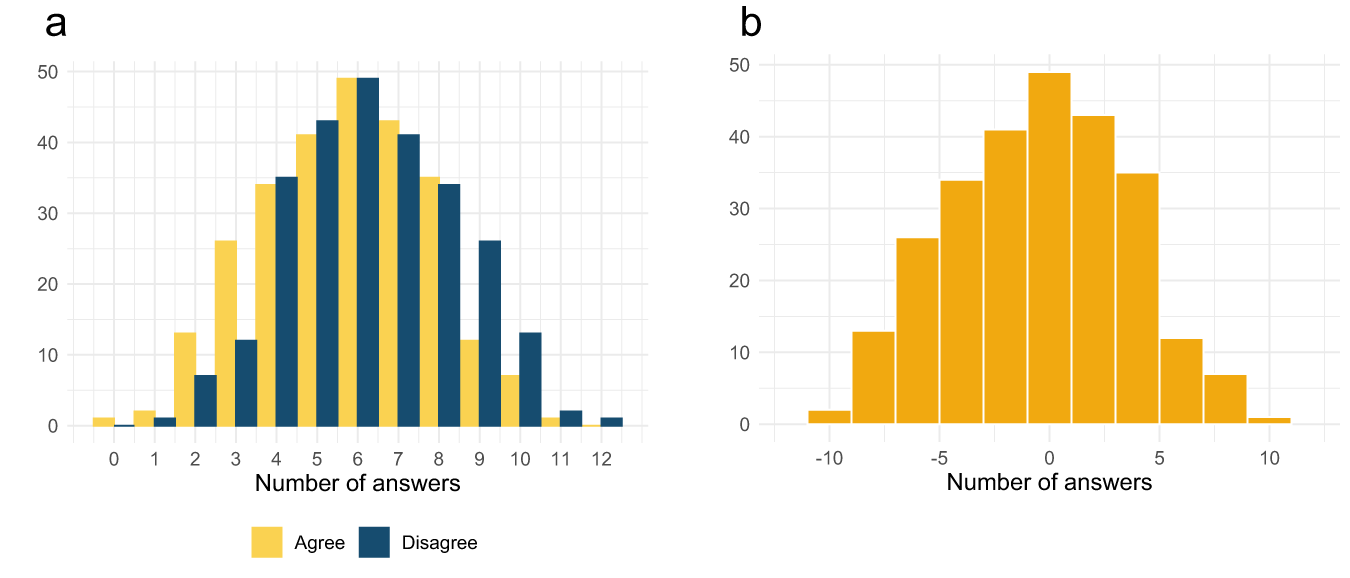
In the previous sections, we divided our respondents into two groups based on their self-reported personal contribution to reducing the carbon footprint. For this purpose, we asked them to express whether they agreed or disagreed with 12 statements describing different ways of reducing the carbon footprint (e.g., through their consumption behaviour, financial decisions and environmental activism; see panel (a) of Figure 11). For a detailed list of these statements, see the Appendix. We defined a respondent as environmentally conscious if the number of her ‘agree’ answers was higher than the number of ‘disagree’ answers. We now take a different approach when constructing the variable  $EnvinConscious_{i}$. The previous analysis shows that the simple division into two groups significantly affects the respondents’ answers. We therefore now focus more on the intensity of this relationship and define the variable $EnvinConscious_{i}$ not as a binary indicator but as the number of ‘agree’ responses minus the number of ‘disagree’ responses. We then show the distribution of such answers in panel (b) of Figure 11.
Respondents’ contribution to reducing the carbon footprint. (a) Number of agreeable and disagreeable answers to 12 statements about carbon footprint reduction. (b) The difference between the number of agreeable and disagreeable answers.

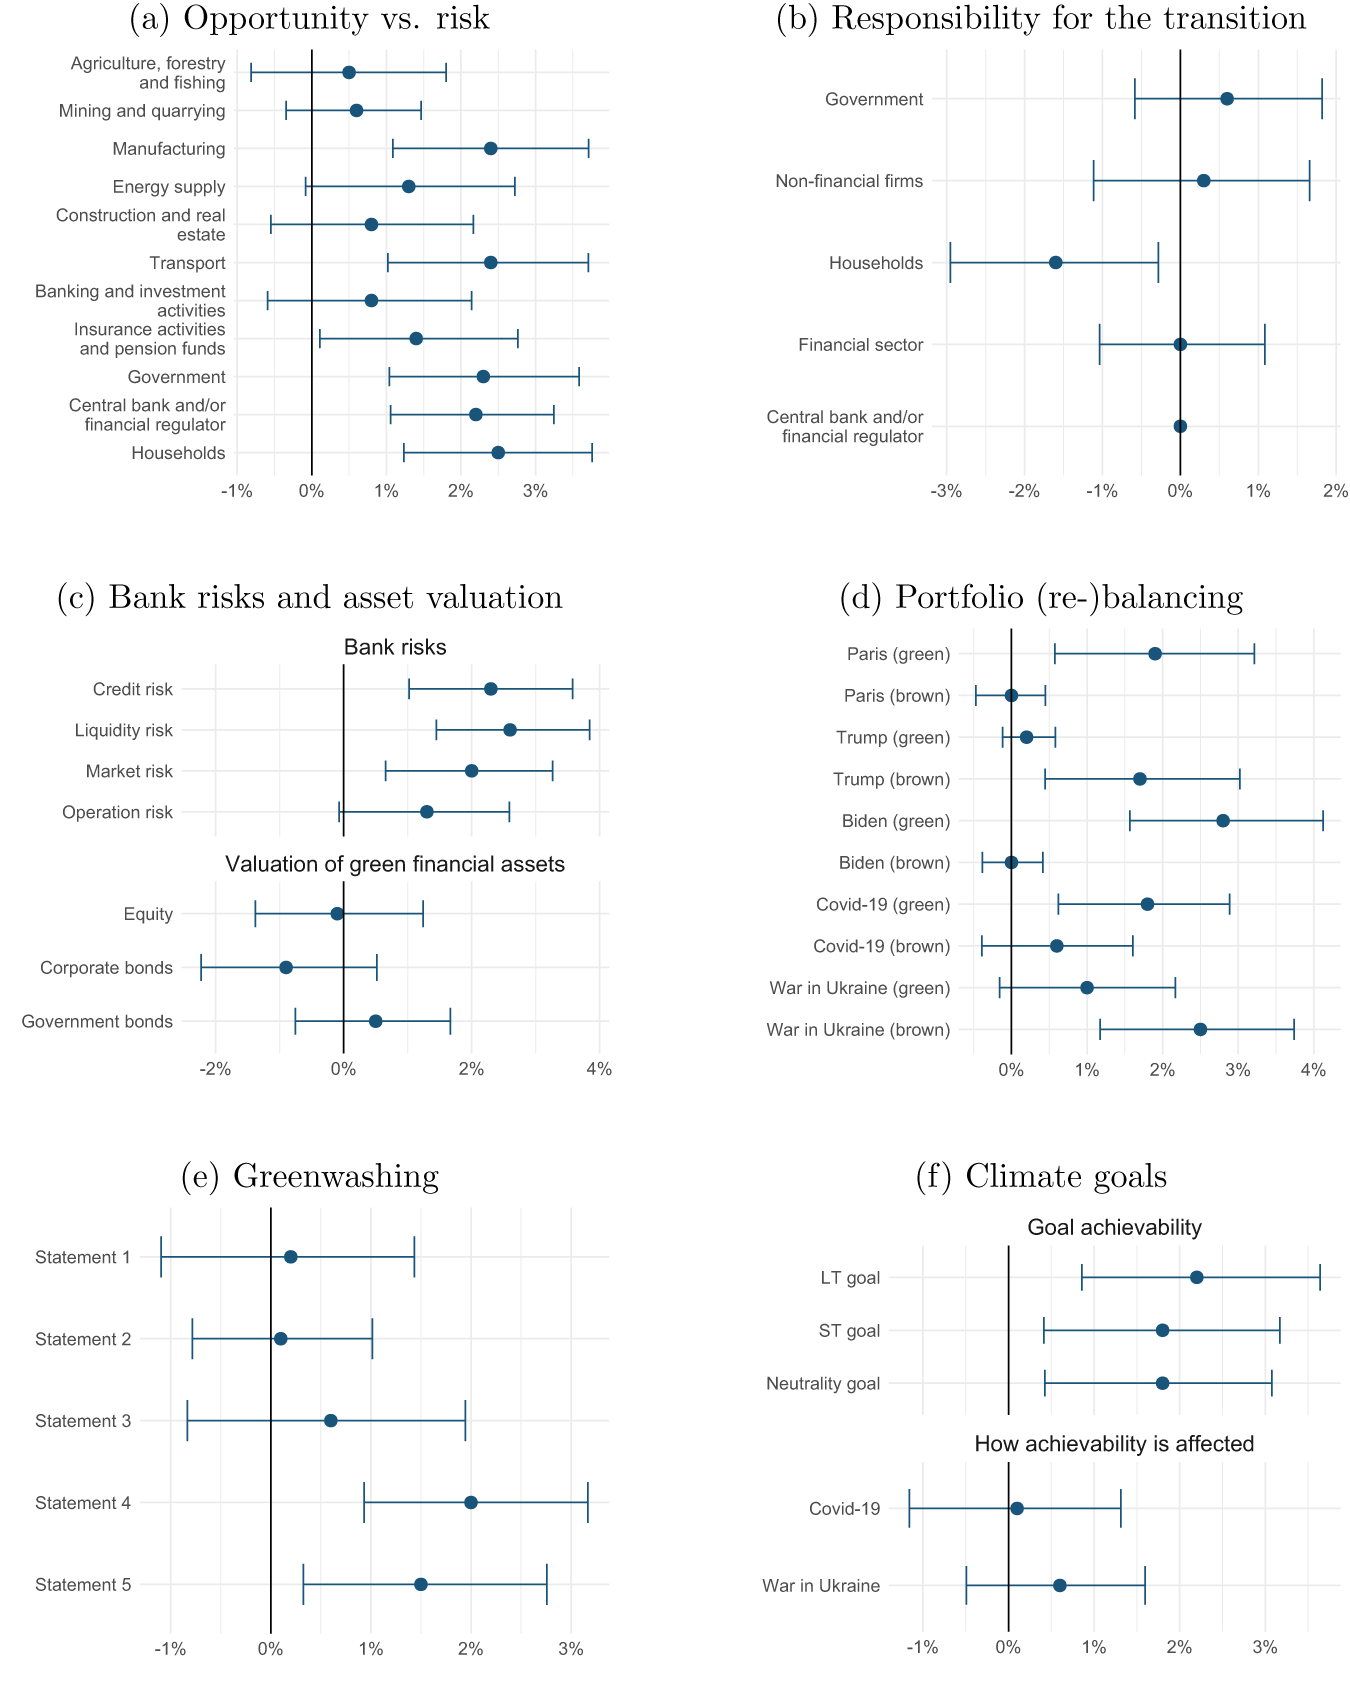
The results of the linear probability model are presented in Figure 12. Each panel visually presents the estimated coefficient  $\beta^{q}$ on the relationship between the respondents’ environmental consciousness and the quantified answer to question $q$ together with 90 per cent confidence intervals. The full regression results are given in Appendix F.
Firstly, the full regression results confirm that environmental consciousness is the most crucial determinant of the differences in the respondents’ opinions, with  $EnvinConscious_{i}$ usually being the most significant determinant across all questions (Hypothesis 1). In Section 3.1, we find that environmentally conscious respondents are generally more optimistic, as they are more likely to view climate protection policies as an opportunity than a risk. In panel (a) of Figure 12, we show that this remains true across multiple industries even if we account for the ‘intensity’ of this consciousness. Specifically, one more ‘agree’ answer to one of the 12 statements about reducing one’s personal carbon footprint translates into about a 1–2 per cent higher probability of seeing the transition as an opportunity. Regarding responsibility for the transition, more environmentally conscious respondents are more likely to rank the contribution of households lower than other respondents (panel (b)). The ranking of other sectors, however, remains very similar across the majority of respondents, regardless of their characteristics.
Linear probability model – the effect of environmental consciousness. (a) Opportunity vs. risk, (b) responsibility for the transition, (c) bank risks and asset valuation, (d) portfolio (re-)balancing, (e) greenwashing and (f) climate goals.

Furthermore, more environmentally conscious respondents are more likely to expect an increase in bank risks due to the transition to a low-carbon economy (panel (c)) and a stronger reallocation of financial assets between green and brown industries in response to specific (climate policy) events (panel (d)). The opinion about the market valuation of green financial assets is not significantly affected by the respondents’ environmental consciousness (panel (c)). Regarding the statements about greenwashing, environmentally conscious respondents are more inclined to impose stricter penalties for greenwashing and are also more likely to concur that detected greenwashing should result in a lower ESG rating (panel (e)). Last but not least, environmentally conscious respondents are more likely to see climate goals as achievable (panel (f)).
Secondly, the full regression results stored in Appendix F confirm the important role of the respondents’ profession in some questions, even though it turns out to be significantly much less frequent than environmental consciousness (Hypothesis 2). Similarly to what we found in Section 3, when we only looked at the respondents’ characteristics individually, central bankers are more likely to identify the transition as a risk than an opportunity (Table A20 in Appendix F) and expect an increase in bank risks in response to the transition (Table 21 in Appendix F). They are also much less likely to punish greenwashing more strictly than other types of fraud (Table A23 in Appendix F).
To address potential concerns about selection bias – particularly given the central role of environmental consciousness in shaping our results – we perform two complementary robustness checks, inspired by the approach of Stroebel and Wurgler (Reference Stroebel and Wurgler2021). Firstly, we construct an alternative index of environmental consciousness and, secondly, we split the sample into two groups based on the original index. The details on robustness checks and their results are provided in Appendix G.
4.2. Climate optimism vs. financial stability risk concerns
In the next step, we extend the right-hand side of Equation (1) by including answers to additional questions from the survey so that we can study the relationship between pairs of those questions. This allows us to identify patterns in respondents’ opinions that might be consistent with Hypotheses 3 and 4. The extended specification is in Equation (2).
 \begin{equation}
BinaryAnswer_{i}^{q_m} = \alpha^{q} + \beta^{q} QuantifiedAnswer_{i}^{q_l} + \gamma^{q} X_{i} + \epsilon_{i}^{q}.
\end{equation}
\begin{equation}
BinaryAnswer_{i}^{q_m} = \alpha^{q} + \beta^{q} QuantifiedAnswer_{i}^{q_l} + \gamma^{q} X_{i} + \epsilon_{i}^{q}.
\end{equation} The dependent variable  $BinaryAnswer_{i}^{q_m}$ remains a binary indicator equal to one if the answer of respondent $i$ to question $q_m$ is ‘agree’ or positive in some other sense (e.g., ‘increase’, ‘overvalued’ or ‘achievable’). The new variable $QuantifiedAnswer_{i}^{q_l}$ is the answer of respondent $i$ to question $q_l$ quantified on a discrete scale between $-$1 and 1 according to Table A3 in Appendix C, with ‘agree’ or positive answers (e.g., ‘increase’, ‘overvalued’ or ‘achievable’) being assigned positive values. The vector $X_{i}$ contains all the dummy-coded demographic variables, including the respondent’s environmental consciousness and professional role. Similarly to Equation (2), we estimate the model only for selected pairs of questions where we have identified significant cross-dependencies based on the contingency coefficient.
The results are shown in Figures A2 and A3 in Appendix F. Each panel visually presents the estimated coefficients  $\beta_{q}$ of Equation (2) together with 90 per cent confidence intervals. Figure A2 shows the links between questions more in support of the climate optimism hypothesis (Hypothesis 3), while Figure A3 presents results more indicative of the opinions reflecting the financial stability risks associated with the transition to a low-carbon economy (Hypothesis 4).
Regarding climate optimism, we found a positive link between the perceived attainability of climate objectives and viewing the transition as an opportunity. Specifically, individuals who believe climate goals are achievable tend to see the transition as an opportunity rather than a risk, with the likelihood reaching 10 per cent (as seen in panel (a) of Figure A2). This is particularly evident in the energy supply, construction and real estate, transportation and financial sectors.
Similar insights emerge from the relationship between portfolio reallocation following some climate policy events. For example, respondents who believe that the COVID-19 pandemic has contributed to achieving climate goals are more likely to consider an increase in green exposures and a reduction in brown exposures after both COVID-19 and the war in Ukraine (panel (c) of Figure A2). Likewise, those who think the war in Ukraine will help reach climate objectives are more likely to anticipate a rise in green exposures and a fall in brown exposures after the conflict. However, in absolute terms, only a few respondents believe the war will positively impact the attainability of climate goals.
Additionally, those who assume a decline in green exposures after Trump’s withdrawal from COP21 are more likely to view the transition as an opportunity across industries. This suggests that these individuals are more climate optimistic (panel (b) of Figure A2). Conversely, those anticipating a decrease in brown exposures following COP21 and Biden’s rejoining of COP21 are more inclined to see the transition as a risk than as an opportunity. This implies that these respondents are rather pessimistic about the low-carbon transition.
Regarding financial stability risk concerns, we observe a strong connection between participants’ views on changes in banking risks, the attainability of climate goals and their evaluation of the transition as a risk or opportunity across various sectors. Specifically, participants anticipating an increase in banking risks are more inclined to see the transition as a risk than as an opportunity in most sectors, with the likelihood reaching 20 per cent (panel (a) of Figure A3). Moreover, those who regard the neutrality climate goal as achievable are more likely to expect heightened banking risks (panel (b) of Figure A3).
However, respondents who believe the COVID-19 pandemic has contributed to achieving climate goals are more likely to expect a decline in banking risks, which supports the climate optimism hypothesis. This is consistent with the evaluation of the COVID-19 pandemic’s effect on portfolio reallocation, as discussed above. Another indication of perceived climate pessimism is the link to opinions on greenwashing. Namely, respondents who view greenwashing as a widespread issue (64 per cent of respondents) and difficult to detect (90 per cent of respondents) are also more likely to consider the transition to a low-carbon economy to be a risk than an opportunity (panel (c) of Figure A3). This suggests a more pessimistic evaluation of the transition and its economic and financial impacts. In contrast, participants who would penalize greenwashing more severely than other types of fraud (26 per cent of respondents) view the transition more likely as an opportunity.
In summary, we identified patterns in the respondents’ perspectives that extend beyond their individual characteristics and can be ascribed to either an optimistic stance on the transition’s impact (Hypothesis 3) or a more careful viewpoint with indications of financial stability risk concerns (Hypothesis 4). This differentiation does not create a definitive separation dividing all the respondents into two uniform groups. Instead, it highlights possible factors and connections in evaluating the various anticipated economic and financial consequences of the transition to a low-carbon economy, which may be shaped not only by differences in technical proficiency or exposure to climate-related research but also by higher-order beliefs – that is, beliefs about how others perceive climate risks – as suggested by Mildenberger and Tingley (Reference Mildenberger and Tingley2019) and Bauer et al. (Reference Bauer, Goedker, Smeets and Zimmermann2024).
5. Conclusions
The transition to a low-carbon economy is a pressing and complex issue that demands the attention and collaboration of finance professionals, policy economists, researchers, and public sector regulators. It is essential to understand the factors that shape expert opinions on this topic, as these perspectives can significantly influence policy decisions and implementation strategies.
This paper contributes to the existing literature by providing a comprehensive analysis of the opinions of 286 economics and finance professionals, researchers, and public sector regulators on the transition to a low-carbon economy. It highlights the impact of environmental consciousness, professional roles and institutional affiliations on shaping these opinions, offering valuable insights for policymakers and various stakeholders involved in the low-carbon transition.
Our results reveal notable consistency in the respondents’ opinions across various characteristics. The transition to a low-carbon economy is considered to be more of an opportunity than a risk for the financial sector, with the respondents expecting only a modest increase in banking risks. The majority of the respondents agree that governments should bear the most responsibility for climate mitigation policies, with carbon taxes being the preferred policy instrument. As for recent shocks, the COVID-19 pandemic is expected to have had a neutral or somewhat positive effect on the transition, while the war in Ukraine is believed to have had a strong negative impact, potentially causing climate goals to be missed.
However, we also identify significant and systematic differences in opinions based on the respondents’ environmental consciousness and professional roles. More environmentally conscious respondents tend to be more optimistic about various climate issues, and central bankers generally exhibit a more pessimistic outlook than those working in academia and other institutions. Additionally, our analysis uncovers patterns in the respondents’ views that extend beyond their characteristics and environmental consciousness, connecting their opinions on the achievability of climate goals and changes in banking risks, and their evaluation of the transition as a risk or opportunity across sectors. These patterns can be attributed to the climate optimism of our respondents or their heightened financial stability risk concerns.
Our findings can help policymakers and stakeholders better understand the nuances of expert opinions and anticipate potential challenges and opportunities associated with the low-carbon transition. By understanding the factors that shape expert opinions, they can develop more targeted, effective and inclusive policies that address the concerns and priorities of various stakeholders. The policy implications derived from our analysis emphasize the importance of promoting environmental consciousness, including a diverse range of stakeholders in policy discussions, and addressing key concerns regarding financial stability risks. While our study provides valuable insights, we also recognize certain limitations. These include the relatively modest sample size and potential concerns about sample selection bias that are inherent in voluntary expert surveys. Nonetheless, we believe that the breadth of perspectives captured and the robustness checks performed support the relevance of our conclusions.
Supplementary material
The supplementary material for this article can be found at https://doi.org/10.1017/S1355770X26100515.
Acknowledgements
The views expressed are those of the authors and not necessarily those of the Czech National Bank. We gratefully acknowledge comments and suggestions from the editor and an anonymous referee, and from Galina Hale, Jakub Matějů, Ngoc Anh Ngo and Martin Hodula, as well as seminar and conference participants at the Czech National Bank, the 12th International Conference of the Financial Engineering and Banking Society, and the 29th Annual Conference of the European Association of Environmental and Resource Economists. All errors and omissions remain the fault of the authors. Simona Malovaná acknowledges support from Charles University Research Centre Program No. 24/SSH/020.
Competing interests
The authors declare none.