


Epidemiological studies have found that habitual coffee drinkers had a lower risk of type 2 diabetes (T2D)(Reference Ding, Bhupathiraju and Chen1,Reference Van Dam and Feskens2) when compared with non-habitual drinkers. Nonetheless, several acute feeding studies found that caffeine or coffee consumption immediately worsened glucose tolerance(Reference Johnston, Clifford and Morgan3,Reference Robertson, Clifford and Penson4) . This contradiction between the results of epidemiological and acute feeding studies remained to be elucidated.
One possible factor contributing to this contradiction is the potential variations in the effects on blood glucose metabolism brought about by drinking different types of coffee. It is important to recognise that the brewing method used directly affects the content of the bioactive compounds in coffee(Reference Ludwig, Clifford and Lean5), such as caffeine and chlorogenic acid. It is well recognised that caffeine acutely impairs glucose intolerance by decreasing the glucose uptake of skeletal muscles(Reference Keijzers, De Galan and Tack6). On the other hand, chlorogenic acid, a polyphenol and an antioxidant, was found to improve insulin sensitivity(Reference Johnston, Clifford and Morgan3) and reduce tissue oxidative stress(Reference Liang and Kitts7). As a result, the health effects of consuming coffees that are brewed or manufactured differently (e.g. espresso, instant coffee and decaffeinated) could vary. Nonetheless, direct comparisons in the effects on blood glucose levels after consuming different types of coffee were currently limited.
Adding milk and sugar into coffee may alter the effect of its consumption on glucose metabolism. Preloading milk (i.e. consuming milk before a meal) was found to lower the postprandial glucose excursion after a subsequent meal when compared with preloading water(Reference Sun, Tan and Han8). Similarly, while sugar consumption directly increases blood glucose level, one previous study found that when compared with preloading either water or black coffee, consuming sugar-sweetened instant coffee before a high-glycaemic index (GI) meal led to a smaller postprandial blood glucose excursion(Reference Louie, Atkinson and Petocz9). These findings are important as reducing postprandial glucose excursion was found to lower oxidative stress(Reference Blaak, Antoine and Benton10), thereby lowering the risk of insulin resistance and T2D(Reference Blaak, Antoine and Benton10,11) . In addition, while the beneficial effect of consuming coffee before meals was shown in preloading instant coffee(Reference Louie, Atkinson and Petocz9), other types of coffee have not been tested before. Hence, the present study aimed at assessing the effect of preloading different types of coffee on postprandial glycaemic metabolism, as well as the effect of adding milk and sugar into coffee.
Experimental methods
Study design
This randomised, single-blind, crossover acute feeding study was conducted between August 2016 and September 2017 at the University of Hong Kong. Ethics approval was obtained from the Human Research Ethics Committee of the University of Hong Kong (approval no. EA1604004). The study was conducted according to the guidelines laid down in the Declaration of Helsinki. This trial was registered at anzctr.org.au (ID: ACTRN12617000201370). All participants provided written consent before the commencement of the study.
Participant recruitment
Participants were recruited from the staff and students of University of Hong Kong through emails and face-to-face recruitment. The inclusion criteria were aged between 18 and 40 years, having a BMI between 18·0 and 23·0 kg/m2, consumed at least three cups of coffee per week in the past 3 months, have never smoked before, able to tolerate cow’s milk and coffee with an empty stomach and not on regular medication (except oral contraceptives). All participants were enrolled by the first author and provided written consent before committing to any experimental procedure.
Study protocol
In each experiment session, participants tested the effect of one single test drink. After a washout period of at least 3 d, they came back for another session with another test drink. This process was repeated until they conducted experiments for all test drinks (Fig. 1). The sequence of the test drink administration was randomly generated for each participant using the Rand function in Microsoft Excel (2016) by the first author. This was done by first generating a row of random numbers. The random numbers were then ranked, and the resulted rank numbers became the sequence of treatment administration, with water always being tested in the first session. Participants remained blinded during the experiment, that is, they did not know the drinks that they would receive in each session, except for plain water which is distinctly different from other test drinks.
Illustration of study design. One drink was tested in each session. After a session was completed, participants had to wait for a minimum of 3 d until the next experiment could be carried out, in which another drink would be tested. This process was repeated in each participant until all six test drinks were tested twice in phase 1, thus resulting in a total of twelve sessions. The same design was used in phase 2, in which all participants tested the effect of each of the four test drinks once, thus resulting in a total of four sessions.

The procedure of an experiment session is illustrated in online Supplementary Fig. S1. Overnight-fasted participants (n 21) came to the laboratory in the morning, and a fasting blood sample was first taken. Then, each participant consumed one of the following test drinks: espresso (35 ml); instant (140 ml), boiled (140 ml) or decaffeinated coffee (140 ml; all drinks were served with 50 ml low-fat cow’s milk drink and 7·5 g white sugar added); plain water or water with milk and sugar added. The composition of the test drinks is shown in Table 1. After 60 min, another blood sample was collected, which was the baseline measurement. They were then given the high-GI standard breakfast, which was made by adding 30 g puffed rice cereal and 10 g glucose powder into 150 ml rice milk. One serve of the standard breakfast provides 40 g of total carbohydrate and has a GI of 88. Participants were asked to finish it in 10 min. After that, blood samples were taken at 15, 30, 45, 60, 90 and 120 min after breakfast.
Composition of test drinks used in the present study*
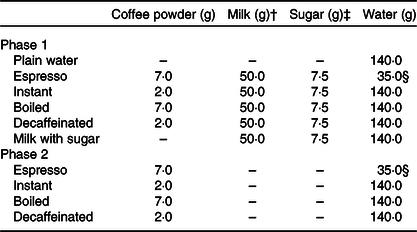
* The following types of coffee powder were used for each test drink: ground coffee powder for espresso and boiled coffee, instant coffee granules for instant coffee and decaffeinated instant coffee granules for decaffeinated coffee.
† Low-fat cow’s milk drink was used throughout the experiment.
‡ White table sugar was used throughout the experiment.
§ Value depicts the amount of resultant coffee liquid.
One drink was tested in each session, and each drink was tested twice. With a total of six test drinks, each participant went through a total of twelve sessions in this phase. The time of completion ranged from 14 to 24 weeks. To test the effect of adding milk and sugar into coffee on postprandial glycaemic excursions, further experiment sessions were carried out 3 months later in a subgroup of the participants from the first phase (n 10). The same protocol was used, and the following four drinks were tested: espresso, instant, boiled and decaffeinated coffee, all without milk and sugar added. One drink was tested in each session, and each drink was tested once; thus, each participant went through a total of four sessions in this phase. The time of completion of this phase ranged from 4 to 10 weeks.
All participants reported their usual coffee consumption data (in cups per week) when they were enrolled in the study. They were also instructed to refrain from consuming these food items, as well as not to take part in any vigorous physical activity, for 48 h before each experiment session. On the day before the experiment, participants were provided with one standard dinner package (spaghetti with bacon and mushroom in cream sauce). They were instructed to finish the dinner pack and refrain from consuming any other food and drink before the experiment, fast for at least 10 h and sleep for at least 7 h before the experiment. Female participants were advised not to do the experiment within a week before the commencement of the menstrual period and during that to avoid variation in results due to hormonal fluctuation. Adherence to these requirements was checked by a short screening and a dietary recall immediately before the start of each experiment session.
Test drinks preparation
Espresso coffee was made using an espresso machine (Dedica EC680M. Delonghi Ltd). Ground coffee powder (7 g) (Lavazza caffè espresso, pure Coffea arabica v.) was used to produce 35 ml of coffee liquid. Boiled coffee was made by adding 9 g of ground coffee (Lavazza caffè espresso, pure Coffea arabica v.) into 180 ml boiling water in a saucepan and simmer for 10 min, and then 140 ml of the liquid was poured into a cup. Instant coffee and decaffeinated coffee were made by adding 2 g of the corresponding coffee granules into 140 ml of 90°C water from an electric kettle. In the first phase, all coffee beverages were served with 50 ml of low-fat cow’s milk drink and 7·5 g of white sugar. Sugar-sweetened milk was produced by adding 50 ml of low-fat cow’s milk drink and 7·5 g white sugar to 140 ml of 90°C water from an electric kettle. In the second phase, the four types of coffee were made by the same methods as those in the first phase, but all drinks were served without the milk drink and sugar added.
Bioactive compound measurement of test drinks
The following compounds were quantified in each serve of test drinks using HPLC: caffeine, 3-, 4- and 5-caffeoylquinic acid, as well as cafestol. The full protocol is detailed in the online Supplementary material.
Plasma sample collection
Blood samples were collected by finger pricking using disposable, single-use lancing devices (Accu-Chek; Roche) and were collected into Eppendorfs coated with heparin. A total of 1 ml of whole blood was collected at each time-point. All samples were stored on ice and centrifuged (3000 g , 2 min) within 1 h after collection. Plasma was collected and stored in aliquot at −80°C until analysis. To gain further insight into the possible factor affecting insulin excursion, active GLP-1 measurement was carried out in a subset of the participants in phase 1 (n 12) and phase 2 (n 8). For these participants, 5 µl dipeptidyl peptidase-4 inhibitor was added into the heparinised tube with 500 µl whole blood immediately after the sample collection at each time-point, while the remaining blood sample was collected into a separate, heparin-coated Eppendorf. The samples were stored on ice and centrifuged (3000 g , 2 min) within 1 hour after collection. Plasma was collected and stored in aliquot at −80°C until analysis.
Anthropometry measurement
Height and weight were measured to the nearest 0·1 cm and 0·1 kg, respectively, both using the Seca 769 electronic column scale (Seca). BMI was calculated by body weight (kg)/height2 (m). Body fat was measured using the BIA 101 bioimpedance measuring device (Akern Bioresearch Srl) and was presented as a percentage relative to the total body mass.
Biochemical measurement
Concentrations of plasma glucose were measured by the glucose oxidase method (Stanbio Glucose LiquiColor; Stanbio Laboratory). Concentrations of plasma insulin, active GLP-1 and nitrotyrosine were measured by ELISA (insulin: ImmunoDiagnostics Ltd; active GLP-1: Invitrogen; nitrotyrosine: Cell Biolabs Inc.). The homeostatic model assessment of insulin resistance(Reference Levy, Matthews and Hermans12) was also calculated for each participant to serve as an indirect measurement of insulin resistance, using the fasting glucose and insulin obtained in their first experiment sessions.
Primary and secondary outcomes
The primary outcomes of the present study included the peak postprandial levels of glucose and insulin. The secondary outcomes included differences in glucose, insulin, active GLP-1 and nitrotyrosine in individual time-points after meals, as well as the incremental AUC (iAUC) of glucose, insulin and active GLP-1.
Sample size calculation
Based on the data of a previous trial(Reference Louie, Atkinson and Petocz9), power calculation (G* Power version 3.1.9.2; Heinrich-Heine-Universität Düsseldorf) indicated that with a randomised crossover design, a sample size of 19 could provide >80 % statistical power (α = 0·05, two-tailed) to detect differences of approximately 0·65 mmol/l (control group: mean 9·06 (sd 0·42) mmol/l; coffee group: mean 9·41 (sd 1·04) mmol/l, correlation: 0·5) in peak glucose level and 4·2 µU/ml (control group: mean 52·1(sd 6·2) µU/ml; coffee group: mean 56·3(sd 6·0) µU/ml, correlation: 0·5) in peak insulin level. To account for possible dropouts, twenty-five participants were recruited.
Statistical analysis
Statistical analyses were performed using SPSS (version 23·0; SPSS Inc.). Results from the data of the participants who completed all sessions (complete case) were presented in the main result, while results including those who were randomised but did not complete the whole protocol (available case) were presented as a sensitivity analysis. This was done as recommended in the proposed extension of the CONsolidated Standards Of Reporting Trials (CONSORT) statement to randomised crossover trials(Reference Dwan, Li and Altman13).
Glucose and insulin data were analysed in absolute values, while active GLP-1 and nitrotyrosine data were analysed in differences from baseline, which were calculated by subtracting the time-point measurements from those made immediately before meal (i.e. T = 0 min). The iAUC, which equal total AUC subtracting the area under the baseline level (i.e. at T = 0), of glucose, insulin and active GLP-1 were calculated using the trapezoidal rule. The baseline was set at T = 0 because the outcome of interest is the excursion of the biomarkers beyond baseline associated with the test meal; thus, the measurements taken immediately before meal consumption was used as baseline. While blood glucose levels would increase after consuming the test drinks, it is likely to have gone back to baseline after 60 min. A previous study showed that the increase in blood glucose levels in human subjects after consuming a test drink with 15 g maltodextrin disappeared after 60 min(Reference Peters, Ravestein and van der Hijden14).
The time-point measurements of all biomarkers in all test drink sessions were estimated by two-factor mixed-effect linear models using the MIXED procedure. Time and test drinks were specified as the main effects, while fasting measurements and usual coffee consumption frequency were included as covariates. Participants were specified as a random factor, and time-points were specified to have a first-order auto-regressive covariance structure. The fasting measurements were estimated using the same method, with the baseline coffee consumption frequency as the covariate. The postprandial iAUC of all biomarkers in all test drinks were also estimated by mixed-effect linear models using the MIXED procedure. Test drinks were specified as the main effect, while fasting measurements and usual coffee consumption frequency were specified as covariates. Participants were specified as a random factor, and the treatments were specified to have a covariance structure of compound symmetry.
Post hoc comparisons were carried out to determine differences in time-point measurements after T = 15 min and all iAUC measurements between the test drinks, as well as the differences in glucose and insulin measurements between T = −60 min and T = 0 min within each test drink. Results were reported as estimated marginal means and sem. As previously suggested(Reference Streiner15), both results with and without correction for multiple comparisons were presented. Post hoc comparisons without correction were done using the Fisher’s least significant difference method, and the correction for multiple comparisons was done using the Bonferroni procedure. For all statistical tests, P < 0·05 was considered statistically significant.
Results
Participants characteristics
The recruitment flow chart is shown in online Supplementary Fig. S2. A total of twenty-one participants completed the first phase, while a subgroup (n 10) further completed the second phase. The anthropometric and biochemical characteristics of study participants are shown in Table 2. The differences in age, BMI, fasting glucose, fasting insulin and homeostatic model assessment of insulin resistance measurement between participants in phase 1 and phase 2 were similar. All participants had normal glucose tolerance as indicated by homeostatic model assessment of insulin resistance lower than 1·0.
Characteristics of participants in both phases of the present study
(Mean values and standard deviations; numbers)

HOMA-IR, homeostatic model assessment of insulin resistance.
Content of caffeine, caffeoylquinic acid and cafestol in all test drinks
The amount of bioactive compounds in each serve of the test drinks is shown in Table 3. Boiled coffee had the highest amount of caffeine, caffeoylquinic acids and cafestol among all test drinks, while espresso coffee had more caffeoylquinic acid than instant and decaffeinated coffee. The amount of caffeine was similar between espresso and instant coffee, and decaffeinated coffee only had a trace amount of it.
Amount of bioactive compounds present in each cup of test drink*
(Mean values and standard deviations)

CQA, caffeoylquinic acid.
* All samples were analysed in triplicate. Serve size of the test drinks is as follows: espresso: 35 ml; instant, boiled and decaffeinated: 140 ml.
Postprandial glucose levels after preloading coffees with milk and sugar
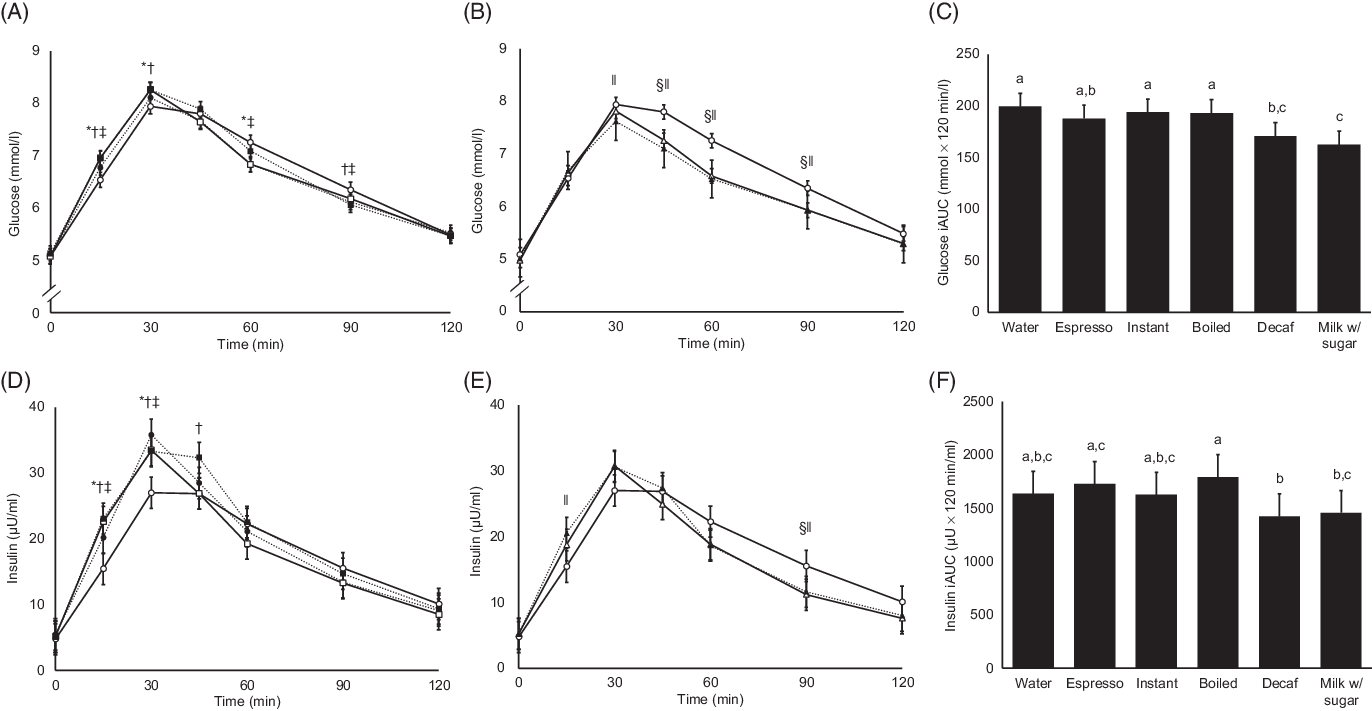
Fasting and pre-meal glucose levels are shown in Table 4. Glucose levels measured at T = 0 min were significantly lower than fasting levels for all test drinks except for boiled coffee, but the differences were minute (range of differences 0·03–0·18 mmol/l). Postprandial glycaemic excursions in the sessions of water and the caffeinated coffees with milk and sugar added (n 21) are shown in Fig. 2(A). Preloading instant and boiled coffees both led to significantly higher postprandial glucose peaks than water (water: mean 7·9 (sem 0·1) mmol/l; instant: mean 8·3 (sem 0·1) mmol/l, P = 0·006 v. water; boiled: mean 8·3 (sem 0·1) mmol/l, P = 0·005 v. water). At T = 60 and 90 min, preloading water showed 3–6 % significantly higher glucose levels than preloading all caffeinated coffees. Glucose levels of all test drinks went down to near baseline levels at T = 120 min. Results remained statistically significant for preloading espresso and instant coffee at T = 60 min after adjusting for multiple comparisons (online Supplementary Fig. S3(A)). Preloading decaffeinated coffee and water with milk and sugar (Fig. 2(B) led to similar glucose peaks with water at T = 30 min. However, the glucose levels of preloading water at T = 45, 60 and 90 min were 7–10 % higher than preloading either decaffeinated coffee or water with milk and sugar (P < 0·05 for both test drinks at all three time-points). Results remained statistically significant for both coffees at all three time-points after adjusting for multiple comparisons. Moreover, preloading the following test drinks led to significantly lower glucose iAUC (Fig. 2(C)) than preloading water: decaffeinated coffee (14 % lower, P = 0·001) and water with milk and sugar (23 % lower, P < 0·001). Similarly, preloading boiled and instant coffee also led to significantly higher glucose iAUC than both decaffeinated and water with milk and sugar added. The glucose iAUC of preloading decaffeinated coffee and water with milk and sugar remained significantly lower than preloading water after adjusting for multiple comparisons (online Supplementary Fig. S3(B)).
Comparison of glucose and insulin measured among all test drinks at fasting (T = −60 min) and immediately before meal (T = 0 min)
(Estimated marginal mean values with their standard errors)
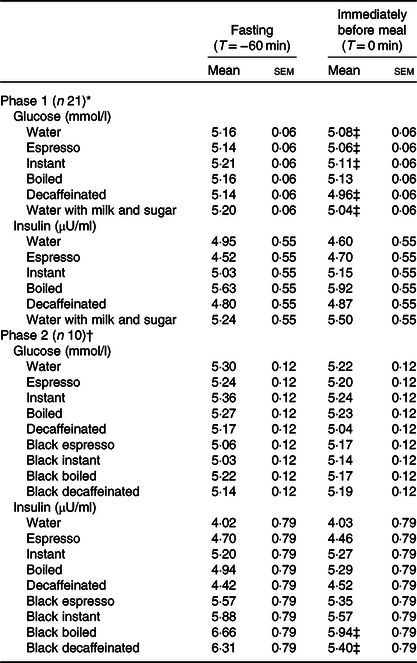
* All coffees were consumed with milk and sugar.
† Phase 2 was completed by a subset of participants who completed phase 1, and thus they provided data on preloading coffees both with and without milk and sugar.
‡ Measurements at T = −60 min and T = 0 min are significantly different (P < 0·05).
Postprandial glucose and insulin results of all test drinks with milk and sugar added. (A) Postprandial glucose levels of plain water, espresso, instant and boiled coffee. (B) Postprandial glucose levels of plain water, decaffeinated coffee (Decaf) and water with milk and sugar (Milk w/ sugar). (C) Glucose incremental AUC (iAUC) of all test drinks. (D) Postprandial insulin levels of plain water, espresso, instant and boiled coffee. (E) Postprandial insulin levels of plain water, decaffeinated coffee and water with milk and sugar. (F) Insulin iAUC of all test drinks. For all figures, values are estimated marginal means adjusted for fasting levels and usual coffee consumption frequency (n 21). Error bars depict standard errors. Statistical significance is set at P < 0·05, and results of all statistical tests are not adjusted for multiple comparisons. For (A), (B), (D) and (E), statistically significant differences in time-point measurements between test drinks are indicated by the following symbols: *, instant coffee and plain water; †, boiled coffee and plain water; ‡, espresso coffee and plain water; §, decaffeinated coffee and plain water; ‖, water with milk and sugar and plain water. For (C) and (F), bars with unlike letters are significantly different. (A) and (D) ![]() , water;
, water; ![]() , espresso;
, espresso; ![]() , instant;
, instant; ![]() , boiled. (B) and (E)
, boiled. (B) and (E) ![]() , water;
, water; ![]() , decaf;
, decaf; ![]() , milk w/ sugar.
, milk w/ sugar.
Postprandial insulin levels after preloading coffees with milk and sugar
Fasting and pre-meal insulin levels are shown in Table 4, and measurements taken at the two time-points were not significantly different. At T = 15 min, all caffeinated coffees had significantly higher postprandial insulin levels than water (n 21, Fig. 2(D)). Peak postprandial insulin levels appeared at T = 30 min for all test drinks, and all caffeinated test drinks had a higher peak than water (water: mean 27·0 (sem 2·4) µU/ml; espresso: mean 35·8 (sem 2·4) µU/ml, P < 0·001 v. water; instant: mean 33·5 (sem 2·4) µU/ml, P = 0·001 v. water; boiled: mean 33·3 (sem 2·4) µU/ml, P = 0·001 v. water). No significant difference between test drinks was observed after T = 60 min. On the other hand, postprandial insulin levels after preloading decaffeinated coffee and water with milk and sugar added were significantly different from those after preloading water only at T = 15 and 90 min (Fig. 2(E)). After adjusting for multiple comparisons (online Supplementary Fig. S3(D)), insulin levels after preloading instant and boiled coffee remained significantly higher than preloading water at T = 15 and 30 min, while no significant differences were observed for other test drinks. For postprandial insulin iAUC (Fig. 2(F)), preloading boiled coffee led to a significantly higher insulin iAUC than both decaffeinated coffee and water with milk and sugar added. These differences were no longer significant after adjusting for multiple comparisons (online Supplementary Fig. S3(F)).
Postprandial glucose and insulin levels after preloading black coffees
Fasting and pre-meal glucose and insulin levels are shown in Table 4. Glucose levels at the two time-points were not significantly different between any test drinks, while pre-meal insulin levels after preloading black boiled and black decaffeinated coffee were both significantly lower than the fasting levels, yet the differences were minute (0·64 µU/ml for black boiled coffee and 0·91 µU/ml for black decaffeinated coffee). The postprandial glucose excursions of preloading black coffees (i.e. coffees without milk and sugar) and water (n 10) are shown in Fig. 3(A). Peak postprandial glucose levels for water, black instant and black decaffeinated coffee appeared at T = 30 min, while those of black espresso and boiled coffee appeared at T = 45 min. Preloading black coffees led to 8–16 % higher glucose levels at either T = 30 or 45 min than water (all P < 0·05), and the differences remained significant for espresso, instant and boiled coffee after adjusting for multiple comparisons (online Supplementary Fig. S4(A)). Then, the glucose levels of all test drinks started decreasing, reaching similar levels at T = 120 min. Preloading black instant and boiled coffees both led to significantly higher postprandial glucose iAUC (Fig. 3(B)) than preloading water (26 and 35 % higher, respectively, both P < 0·001), yet the differences were no longer significant after adjusting for multiple comparisons (online Supplementary Fig. S4(B)). For postprandial insulin results (Fig. 3(C)), preloading black espresso and boiled coffee led to significantly higher insulin levels than water at T = 30, 45 and 60 min, while no significant differences were observed for other test drinks and at other time-points. After adjusting for multiple comparisons (online Supplementary Fig. S4(C)), only boiled coffee led to significantly higher postprandial insulin levels than water at T = 45 min. Postprandial insulin iAUC between preloading water and preloading black coffees (Fig. 3(D)) were not significantly different without adjusting for multiple comparisons.
Postprandial glucose and insulin results of test drinks without milk and sugar added (i.e. black coffees). (A) Postprandial glucose levels of all test drinks. (B) Glucose incremental AUC (iAUC) of all test drinks. (C) Postprandial insulin levels of all test drinks. (D) Insulin iAUC of all test drinks. For all figures, values are estimated marginal means adjusted for fasting levels and usual coffee consumption frequency (n 10). Error bars depict standard errors. Statistical significance is set at P < 0·05, and results of all statistical tests are not adjusted for multiple comparisons. For (A) and (C), statistically significant differences in time-point measurements between test drinks are indicated by the following symbols: *, instant coffee and plain water; †, boiled coffee and plain water; ‡, espresso coffee and plain water; §, decaffeinated coffee and plain water. For (B), bars with unlike letters are significantly different. No significant difference in insulin iAUC was found between different test drinks. esp, Espresso; inst, instant; decaf, decaffeinated coffee. (A) and (C) ![]() , water;
, water; ![]() , black esp;
, black esp; ![]() , black inst;
, black inst; ![]() , black boiled;
, black boiled; ![]() , black decaf.
, black decaf.

Comparison of postprandial glucose and insulin levels between preloading black coffees and coffees with milk and sugar
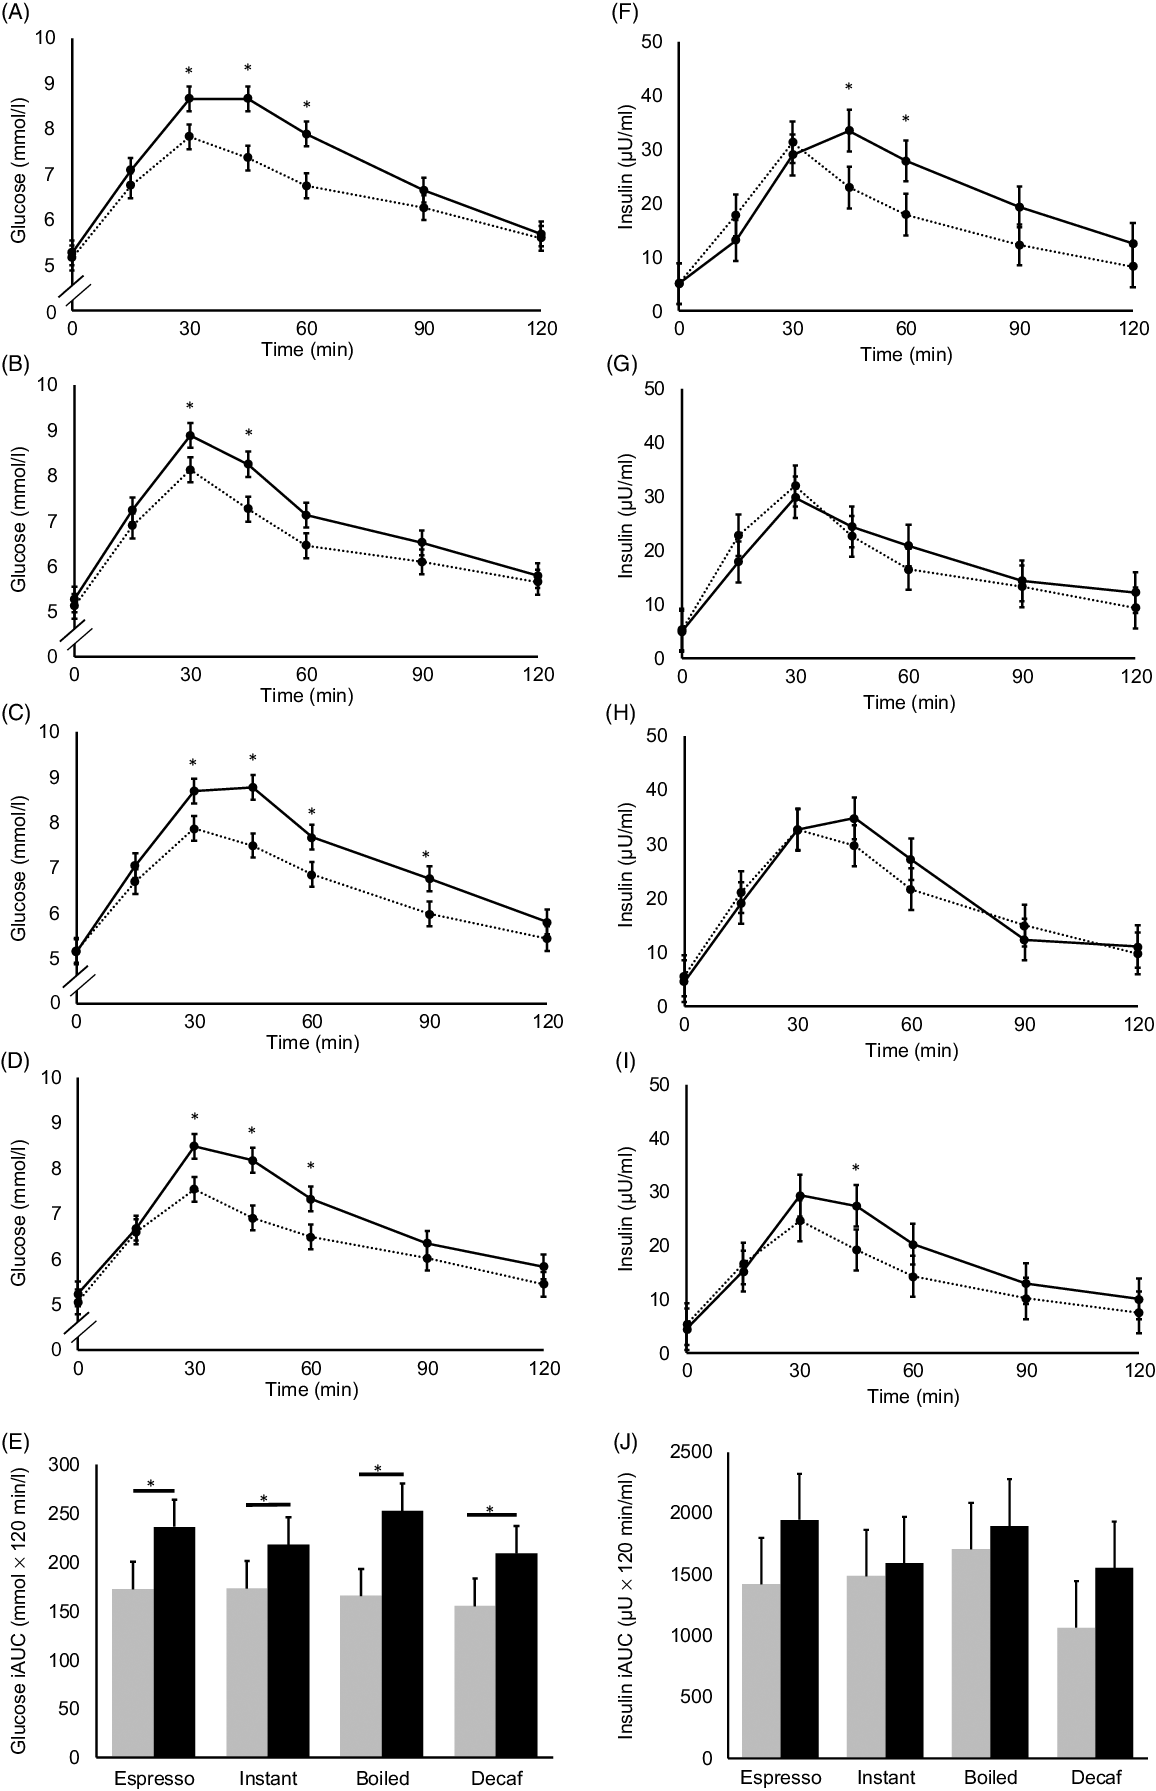
Postprandial glucose levels from T = 30 min onwards were higher in all black coffee sessions than the white coffee (i.e. coffees with milk and sugar) sessions (n 10, Fig. 4(A)–(D)) – the peak glucose levels of black coffees were 10–18 % higher and were all statistically significant (all P < 0·05). The glucose iAUC (Fig. 4(E)) of black coffees were also 26–53 % higher than those of white coffees (all P < 0·05). Differences in peak glucose levels between black and white coffees remained after adjusting for multiple comparisons, while differences in glucose iAUC remained only between black and white boiled coffees (online Supplementary Fig. S5(A)–(E)). Postprandial insulin levels between black and white coffees (Fig. 4(F)–(I)) were similar in instant and boiled coffee. For expresso and decaffeinated coffees, insulin levels of black coffee were significantly higher at T = 45 min than white coffees but not at other time-points. All insulin iAUC between black and white coffees were NS without adjusting for multiple comparisons (Fig. 4(J)). After adjusting for multiple comparisons (online Supplementary Fig. S5(F)–(I)), no significant differences were found in any time-point.
Postprandial glucose (A)–(D) and insulin (F)–(I) levels of black coffees and coffees with milk and sugar added, tested using espresso, instant, boiled and decaffeinated coffee (Decaf). Solid lines represent black coffee, while dashed lines represent coffee with milk and sugar added. For all figures, values are estimated marginal means adjusted for fasting measurements and usual coffee consumption frequency (n 10). Error bars depict standard errors. Asterisks depict statistically significant differences in time-point measurements between coffees with and without milk and sugar added, P < 0·05. (E) and (J) Glucose and insulin incremental AUC (iAUC), respectively, after preloading black coffees and coffees with milk and sugar added, tested using the espresso, instant, boiled and decaffeinated coffee. Grey bars represent values of coffee with milk and sugar, while black bars represent values of black coffee. Error bars depict standard errors. Asterisks depict statistically significant difference between black coffees and coffees with milk and sugar added, P < 0·05. Results of all statistical tests are not adjusted for multiple comparisons. No statistically significant differences in insulin iAUC were observed between any pair of coffees. (A) and (F) ![]() , espresso;
, espresso; ![]() , black espresso. (B) and (G)
, black espresso. (B) and (G) ![]() , instant;
, instant; ![]() , black instant. (C) and (H)
, black instant. (C) and (H) ![]() , boiled;
, boiled; ![]() , black boiled. (D) and (I)
, black boiled. (D) and (I) ![]() , decaf;
, decaf; ![]() , black decaf. (E) and (J)
, black decaf. (E) and (J) ![]() , with milk and sugar;
, with milk and sugar; ![]() , black coffee.
, black coffee.
Postprandial active glucagon-like peptide 1 after preloading coffees
Peak postprandial active GLP-1 (n 12) of preloading all caffeinated and decaffeinated coffees with milk and sugar appeared at T = 30 min, while that of preloading plain water and water with milk and sugar appeared at T = 45 min (Fig. 5(A) and (B)). Preloading boiled coffee led to a significantly lower measurement at T = 30 min than water, while preloading water with milk and sugar led to a significantly higher active GLP-1 level at T = 15 min. Preloading water with milk and sugar also led to significantly higher active GLP-1 levels than instant, boiled and decaffeinated coffee (all with milk and sugar added) at T = 45 min (not shown in figure). Active GLP-1 iAUC of preloading water with milk and sugar was the highest among all test drinks, yet only the difference with boiled coffee with milk and sugar added achieved statistical significance (Fig. 5(C)). After adjusting for multiple comparisons, all differences were no longer statistically significant (online Supplementary Fig. S6). Comparison in active GLP-1 levels between preloading black and white coffees did not yield any statistically significant results (online Supplementary Fig. S7).
Postprandial active glucagon-like peptide 1 (GLP-1) results of test drinks with milk and sugar added. (A) Postprandial active GLP-1 levels of plain water, espresso, instant and boiled coffee. (B) Postprandial active GLP-1 levels of plain water, decaffeinated coffee (Decaf) and water with milk and sugar added (Milk w/ sugar). (C) Incremental AUC (iAUC) of active GLP-1 of all test drinks. For all figures, values are estimated marginal means adjusted for fasting levels and usual coffee consumption frequency (n 12). Error bars depict standard errors. Statistical significance is set at P < 0·05, and results of all statistical tests are not adjusted for multiple comparisons. For (A) and (B), statistically significant differences in time-point measurements between test drinks are indicated by the following symbols: †, boiled coffee and plain water; ‖, water with milk and sugar and plain water. For (C), bars with unlike letters are significantly different. (A) ![]() , water;
, water; ![]() , instant;
, instant; ![]() , espresso;
, espresso; ![]() , boiled. (B)
, boiled. (B) ![]() , water;
, water; ![]() , decaf;
, decaf; ![]() , milk w/ sugar.
, milk w/ sugar.

Comparison in postprandial nitrotyrosine levels after preloading all test drinks
Differences in nitrotyrosine measurements between all test drinks (online Supplementary Fig. S8) were not statistically significant at any time-point.
Sensitivity analysis
Results of the sensitivity analysis were not substantially different from the main analysis (online Supplementary Figs. S9–S10).
Discussions
Our results showed that when compared with preloading water before a high-GI meal, preloading coffees with milk and sugar added led to greater rises in postprandial glucose and insulin levels, yet the overall glucose and insulin excursions, as reflected by iAUC, were not different from those of preloading water. Among all test drinks, preloading decaffeinated coffee with milk and sugar showed the greatest reduction in glucose and insulin excursions after the test meal when compared with preloading water. Furthermore, preloading black coffees led to significantly greater postprandial glucose and insulin excursions after the subsequent high-GI meal when compared with water. However, no remarkable differences in active GLP-1 and nitrotyrosine levels were observed between preloading different types of coffees and between coffees with and without milk and sugar added.
The observation that adding sugar into coffee led to a blunted postprandial glucose response was also made by Louie et al. (Reference Louie, Atkinson and Petocz9) previously. They found that adults who consumed a cup of instant coffee with 10 g white table sugar added 60 min before a subsequent meal led to a smaller glycaemic response after when compared with preloading black instant coffee. The authors speculated that the initial sugar load ‘primed’ the body for better glycaemic response, leading to the subsequent increase in baseline insulin level and more rapid insulin response after the subsequent meal, which was also observed in the present study. In another experiment analogous to the present study, Bonuccelli et al. (Reference Bonuccelli, Muscelli and Gastaldelli16) administered two consecutive oral glucose tolerance tests on healthy subjects with 3 h apart. They found that the overall insulin sensitivity and β-cell sensitivity measured during the second oral glucose tolerance test were both greater than the first one, while the insulin excursion was reduced by 12 %. They attributed the findings to the priming effect exerted on β-cells by the hyperglycaemia during the first oral glucose tolerance test. Our findings went further by showing that the priming effect existed when consuming coffee with much less sugar (75 g glucose in oral glucose tolerance test v. 7·5 g sucrose in white sugar + 10 g lactose in milk in the present study) before a meal.
At the same time, milk added into coffee may also contribute to the diminished glucose excursion. In the trial conducted by Sun et al. (Reference Sun, Tan and Han8) on healthy adults, participants preloaded a cup of low-fat milk 30 min before consuming a piece of white bread providing 50 g carbohydrate. The glucose iAUC of the bread meal was reduced by 50 %, and insulin iAUC was reduced by 27 % when compared with not eating anything beforehand. Similarly, Meng et al. (Reference Meng, Matthan and Ausman17) found that consuming a high-protein breakfast 4 h before the next meal led to diminished postprandial glucose and insulin responses after the subsequent meal. The possible mechanism behind this was proposed to be the extended gastric delay due to protein ingestion(Reference Sun, Tan and Han8), and thus glucose from the subsequent meal entered the small intestine, as well as the circulation, slower than not consuming anything beforehand.
The results of our study supported the utilisation of the priming effect (also known as the Staub–Traugott effect(Reference Staub18,19) ) in managing postprandial glycaemia in adults without diabetes. In line with this idea, several researchers(Reference Palmer, Capra and Baines20,Reference Jenkins, Rao and Jenkins21) previously raised the possibility of improving glycaemic responses by increasing meal frequency, yet the evidence was mixed in this regard(Reference St-Onge, Ard and Baskin Monica22) due to the small sample size of past trials and inconsistent analysis methods. Furthermore, our results provided a possible explanation for the contradicting findings in previous studies, in which coffee was found to be protective against T2D(Reference Ding, Bhupathiraju and Chen1,Reference Van Dam and Feskens2) while capable of inducing acute glucose intolerance(Reference Johnston, Clifford and Morgan3,Reference Robertson, Clifford and Penson4,Reference Battram, Arthur and Weekes23) at the same time. This is especially the case when milk and sugar consumption with coffee is a common practice – it was estimated that more than 80 % of participants in a nationally representative Australian cohort added either milk or sugar, or both, into their coffee(Reference Wong, Sui and Rangan24), while this habit was also observed in more than 50 % of the participants in an American National Health Examination(Reference Bouchard, Ross and Janssen25). In order to validate the findings of the present study in large-scale population surveys, data on milk and sugar usage together with coffee consumption should also be collected in future studies.
Among all the coffee test drinks, preloading decaffeinated coffee led to the smallest postprandial glycaemic and insulinaemic responses among the four coffee test drinks, thereby supporting the acute detrimental effect of caffeine on glucose intolerance previously observed(Reference Johnston, Clifford and Morgan3). Interestingly, preloading the three caffeinated coffees (i.e. espresso, instant and boiled coffee) led to similar postprandial glycaemic and insulinaemic responses, despite the marked difference in caffeoylquinic acid content, which made up 80 % of the total chlorogenic acid content in coffee(Reference Fujioka and Shibamoto26). This did not support the findings in previous studies, which stated that the positive effect of coffee consumption on glycaemic metabolism was due to the presence of polyphenols in coffee(Reference Johnston, Clifford and Morgan3,Reference van Dijk, Olthof and Meeuse27) . Nonetheless, it is possible that the beneficial effect of polyphenol on glycaemic excursion is counteracted by caffeine. Adding milk into coffee may hinder the bioavailability of polyphenols(Reference Duarte and Farah28), yet the evidence on this is inconsistent(Reference Renouf, Marmet and Guy29,Reference Tagliazucchi, Helal and Verzelloni30) . The interaction of different chemical constituents in coffee and the effect of this on glucose metabolism still require further investigation in future human trials.
A postprandial surge of GLP-1 has been suggested to benefit the management of postprandial glycaemia(Reference Karamanlis, Chaikomin and Doran31,Reference Pfeiffer and Keyhani-Nejad32) . We observed that preloading water with milk and sugar led to higher postprandial active GLP-1 levels, as well as a higher iAUC, than preloading other test drinks, although only the difference with preloading boiled coffee achieved statistical significance. This finding is similar to a previous report that consuming 10 g whey protein 30 min prior to a pizza meal led to significantly higher postprandial GLP-1 levels(Reference Akhavan, Luhovyy and Panahi33), yet the results of the present study showed the surge in GLP-1 levels could occur in a much smaller protein preload – there was only 5 g protein in the test drinks used in the present study. Nonetheless, active GLP-1 levels between preloading plain water and preloading coffee with milk and sugar were not substantially different during the postprandial period. Moreover, no significant difference was observed between preloading coffee with and without milk and sugar. These findings are in contrast with those made by Reis et al. (Reference Reis, Paiva and Amato34), who observed that preloading coffee with 30 g sugars added led to significantly higher GLP-1 levels after consuming 75 g glucose. One reason behind this discrepancy could be that the present study was not powered to detect differences in active GLP-1 levels. In addition, the amount of sugar used in the present study is much smaller (7·5 g) and table sugar was used, which is mainly sucrose. Hence, our findings regarding the postprandial changes in active GLP-1 levels after coffee preloads would need to be validated in future studies with adequate power.
The lack of difference in postprandial nitrotyrosine levels between preloading different test drinks was unexpected. It could be due to the small amount of carbohydrates ingested in the present study and the relatively short monitoring period. In previous studies that measured nitrotyrosine with postprandial glycaemia, participants consumed 50–75 g of carbohydrates and the nitrotyrosine was monitored for at least 3 h(Reference Dickinson, Hancock and Petocz35,Reference Chu, Lee and Cheng36) . Future studies might need to monitor oxidative stress markers for a longer time to confirm whether there is a change in nitrotyrosine.
Health effects of tea and coffee consumption were often compared against each other as both were the main sources of caffeine and polyphenols in the human diet(Reference Ludwig, Clifford and Lean5,Reference Vuong37) . In contrast to the frequently observed inverse association between coffee consumption and T2D, both positive(Reference Huxley, Lee and Barzi38–Reference Yang, Wang and Fan40) and negative findings(Reference Lee and Nan41) were previously published regarding the association between tea and T2D. The antidiabetic effect of tea consumption was usually attributed to catechins, which is the main group of polyphenols in tea was found to reduce fasting glucose in a previous meta-analysis of randomised controlled trials(Reference Zheng, Xu and Li42). It is worth mentioning that same as coffee, tea was also frequently consumed with milk and sugar added – Bouchard et al. (Reference Bouchard, Ross and Janssen25) found that more than 60 % of American tea drinkers added milk or sugar into their tea. Nonetheless, studies looking at the effects of milk and sugar added into tea are scarce. In vitro studies suggested that adding milk into tea would reduce its antioxidant capacity(Reference Sharma, Vijay Kumar and Jagan Mohan Rao43,Reference Ryan and Petit44) , but in vivo evidence is inconsistent(Reference Leenen, Roodenburg and Tijburg45,Reference Serafini, Ghiselli and Ferro-Luzzi46) . Hence, the association between tea consumption and T2D will need to be validated in future observational studies.
Since the present work is a crossover study, considerations were given whether to include carryover effect, period effect and session effect in the statistical models used in the present study, as suggested by the CONSORT statement extension to randomised crossover studies(Reference Dwan, Li and Altman13). The carryover effect was not modelled in the present work as it was expected to be minimised by the 3-d washout period. The period effect was also not modelled as the time, venue and condition of each session were uniform for all participants. Furthermore, it is unlikely for postprandial responses in human subjects to change in different periods or seasons of the year, while the fasting levels of each treatment were included as a covariate in the model. The session effect was also not modelled because given the large number of sessions involved (twelve sessions for each subject in phase 1), all participants received treatments in a different sequence after randomisation.
The strengths of the present study include the different types of coffee tested in the same group of participants, thus enabling a comparison of several commonly available coffee types in the same analysis. Furthermore, the present study is the first one to assess the effect of adding milk and sugar into coffee in an acute feeding study setting. In addition, the postprandial measurements of the biomarkers were adjusted for baseline levels, thus minimising the bias in treatment estimates(Reference Bland and Altman47). Limitations of the present study include the small sample size for the active GLP-1 measurement and the testing of the black coffee beverages, thereby limiting the power of these results. Furthermore, since only habitual coffee drinkers were included in the present study, the effect of pre-meal coffee consumption on postprandial glycaemic excursions in non-habitual coffee drinkers will have to be further investigated.
Conclusions
Consuming coffee with milk and sugar added before a high-GI meal led to bigger initial rises in postprandial glucose and insulin, while preloading decaffeinated coffee with milk and sugar led to significant reductions in both postprandial glucose and insulin responses. These results could be due to a priming effect brought by the coffee preload, thus suggesting a possible explanation for the protective effect of coffee consumption towards T2D. Future studies should confirm the findings of the present study in a long-term consumption trial and investigate the role played by adding milk and sugar into coffee on a habitual consumption basis.
Acknowledgements
The authors would like to thank Mr Yunpeng Zhou from the Department of Statistics and Actuarial Science, the University of Hong Kong for providing statistical advice.
This research received no specific grant from any funding agency, commercial or not-for-profit sectors.
J. C. Y. L. designed the project; T. H. T. W., W. H. S. and I. M. Y. T. ran the experiments, collected samples and carried out measurements; J. C. Y. L. and T. W. H. T. analysed the data; T. W. H. T. drafted the manuscript; T. H. T. W., J. C. Y. L. and J. M. F. W. revised the manuscript; J. C. Y. L. and J. M. F. W. oversaw the whole project. All authors read and approved the final manuscript.
There are no conflicts of interest.
Supplementary material
For supplementary material referred to in this article, please visit https://doi.org/10.1017/S0007114520001750


