


Astrocytic tumors are the most common primary brain neoplasms and account for more than 70% of all gliomas.Reference Kleihues and Cavenee 1 The overall prognosis of malignant astrocytic tumors, especially glioblastoma multiforme (GBM), is still poor in spite of aggressive treatments.Reference Salcman 2 Glioblastoma multiforme, the most aggressive and lethal primary brain tumor, responds unpredictably to standard therapy, resulting in highly variable patient survival, despite the same histopathologic diagnosis and equivalent treatments.Reference Herbert, Williams, Sawyer, Greenslade, Cornes and Hopkins 3
A more exact pathologic evaluation of tumor malignancy that might closely correlate with the patient’s prognosis would be beneficial for treatment planning. A biomarker to predict treatment susceptibility could help guide patient care and avoid side effects from ineffective therapies. The MacDonald criteria, which is based on measurable changes in contrast-enhancing lesions,Reference Macdonald, Cascino, Schold and Cairncross 4 and the recently proposed response assessment in neurooncology (RANO) criteria that also takes into account non-enhancing tumor, have been the primary paradigms for assessing response in recent years.Reference Wen, Macdonald and Reardon 5 However, tumor burden may be difficult to accurately quantify using solely the post-contrast study.
Diffusion-weighted (DW) magnetic resonance imaging (MRI) gives additional information derived from microscopic motion of the water proton, which is not available using conventional MRI. Diffusion Weighted Imaging (DWI) has been applied for assignment of tumor grades or differentiation of tumors, as well as for diagnosis of ischemic strokeReference Bulakbasi, Guvenc, Onguru, Erdogan, Tayfun and Ucoz 6 - Reference Sugahara, Korogi and Kochi 13 .
Processes that degrade cellular integrity, such as necrosis caused by therapy or tumor growth, are thought to increase the apparent diffusion coefficient (ADC) of tissue.Reference Kleihues and Cavenee 1 , Reference Herbert, Williams, Sawyer, Greenslade, Cornes and Hopkins 3 , Reference Macdonald, Cascino, Schold and Cairncross 4 , Reference Gauvain, McKinstry and Mukherjee 8 - Reference Lam, Poon and Metreweli 11 , Reference Chenevert, Sundgren and Ross 14 - Reference Mardor, Roth and Ochershvilli 21 Conversely, since water molecules are more restricted in their movement within cells than in the extracellular space, high cell density is associated with a low ADC.Reference Kleihues and Cavenee 1 - Reference Macdonald, Cascino, Schold and Cairncross 4 , Reference Gauvain, McKinstry and Mukherjee 8 - Reference Sugahara, Korogi and Kochi 13 , Reference Chen, Xia and Zhou 15 - Reference Stupp, Mason and van den Bent 26 The ADC has been used to assess brain tumor response to chemotherapyReference Chen, Xia and Zhou 15 , Reference Pope, Kim, Huo, Alger, Brown and Gjertson 23 , Reference Tomura, Narita and Izumi 27 and to predict survival in patients with GBM on chemotherapy.Reference Pope, Kim, Huo, Alger, Brown and Gjertson 23 , Reference Pope, Qiao, Kim, Lai, Nghiemphu and Xue 24 , Reference Tomura, Narita and Izumi 27 , Reference Babsky, Hekmatyar, Zhang, Solomon and Bansal 28 The use of ADC to assess the response to surgery in these patients has not been studied.
We have observed that the patients with higher restricted diffusion, and thereby lower ADC, show poor prognosis and shorter survival. This decreased survival in patients with lower ADC has been observed irrespective of the type of treatment offered. We hypothesized that GBMs have different biological behaviour and, based on ADC values, can be potentially stratified into different biological types at the time of diagnosis. The biological types can be then assigned to different prognosis and treatment arms (potential responder vs not so well responder) based on their diffusion characteristics.
The purpose of our study was to assess whether pattern or degree of diffusion restriction can help predict the prognosis of patients with GBM at the time of diagnostic imaging.
MATERIAL AND METHODS
Patient selection
Consecutive patients with confirmed GBM on biopsy or resection from January 2007 to January 2010 were retrospectively analyzed. The study was approved by the institutional ethics committee. Older data were intentionally selected for a longer follow up. Patients with the following set of axial images on the diagnostic MRI, performed before any biopsy or surgery, were included in our study: 1) DWI; 2) ADC maps; 3) Axial Post-gadolinium T1W images; 4) Axial fluid-attenuating inversion recovery (FLAIR) images. Each patient’s demographic, clinical, surgical, follow up, and survival data were obtained from the institutional brain tumor database. The length of survival was calculated from the time of radiological diagnosis.
Image acquisition
All patients underwent MRI on a 1.5 T magnet (Singa, GE Healthcare). The brain tumor imaging protocol included DWI, pre- and post-gadolinium T1W images, T2, and FLAIR image of the brain. The DWI was acquired by using single-shot echo-planar imaging with 8000 ms repitition time (TR), 73.6 ms (echo time) (TE), 260-mm (field of view) FOV, 160x192 matrix size, 5-mm section thickness with 1.5 mm intersection gap, and 1000 and 0 b-values obtained in three orthogonal directions. Fluid-attenuating inversion recovery images were acquired as fast spin echo images by using 8000 ms TR, 120 ms TE, 2000 ms TI, 220-mm FOV, 256×254 matrix size, 5-mm section thickness with 1.5 mm intersection gap. Post-contrast T1W images were acquired as fast spin echo images by using single-shot echo-planar imaging with 500 ms TR, 22.8 ms TE, 220-mm FOV, 320×192 matrix size, 5-mm section thickness with 1.5 mm intersection gap.
Image analysis and interpretation
The image analysis was performed on a Picture Archiving and Communication System (PACS) workstation. Total volume of the tumor was calculated on both FLAIR (FLAIR volume) and post-gadolinium T1W images (Post-contrast volume) to represent the presumptive total tumor volume (including edema) and total enhancing component of the tumor, respectively. The volume was calculated by manually outlining the abnormality (using ‘Freeform mark up’ tool) on all the slices (Fig. 1) by one of the coauthors (AB) under the guidance of a fellowship-trained neuroradiologist (JS). The sum of the areas on each slice was multiplied by the slice thickness and the inter-slice gap to get the volume. Given the infiltrative nature of the GBM, we believe the actual tumor volume to be somewhat in between the two volumes. The volume of tumor that showed restricted diffusion (diffusion volume) was also calculated using a similar technique to represent volume of tumor with high cellularity. The restriction of diffusion was defined in comparison to the normal appearing white matter (NAWM). We identified areas of restricted diffusion when the portion of tumor was hyper-intense on DWI and hypo-intense on the ADC map when compared to the NAWM in the contra-lateral hemisphere. The degree of restriction was quantified by the lowest average ADC value within each area of restricted diffusion identified. Restricted diffusion was defined as areas of lowest signal on ADC maps as well as highest signal on DWI images. While obtaining the ADC values from this region, care was taken to rule out any evidence of hemorrhage within the region of interest on the B0 images. However, hemorrhage could not be further confirmed on gradient images, as gradient images were not part of the brain tumor protocol in our institution. The ADC values were also measured in the NAWM in the contra-lateral hemisphere to calculate the normalised ADC (nADC, i.e., the ratio of minimum ADC value in the tumor to ADC value in the contralateral NAWM). Both investigators, who were involved in the measurement of volumes of the tumor and ADC values, were blinded to the clinical and outcome data at the time of measurement.
The area marking for the legends using the freeform mark up tool on individual slices on axial (a) FLAIR, (b) T1 post-Gad and (c) DWI. (d) shows the marking for the least ADC value on ADC map of the same patient at the same level. ADC- Apparent Diffusion Coefficient; FLAIR-Fluid Attenuated Inversion Recovery; DWI- Diffusion Weighted Images.

For convenience, the ADC values (in mm2/s) were taken from the PACS workstation and not from the MRI console. The two values have been shown to be comparable and not statistically different in the literature.Reference El Kady, Choudhary and Tappouni 17
Information from the institutional brain tumor database regarding the type of treatment in these patients, including total or partial resection, chemotherapy, or radiotherapy was used to investigate whether imaging parameters affect survival with or without the treatment received. Surgical treatment was classified into ‘biopsy’ (type 1), ‘partial resection’ (type 2) and ‘total or near total resection’ (type 3) based on the immediate post-operative imaging. The extent of resection was based on the MRI done in these patients within 48 hours of surgery. The degree of resection was determined by the neurosurgeons involved, mainly based on the location of the tumor. After resection and pathological confirmation for the diagnosis, these patients undergo a combined chemotherapy (temozolamide) and radiotherapy for the tumor. The endpoint of our study was death of the patient. The length of patient survival was recorded.
Statistical analysis
Analyses were conducted using SPSS, version 17. Spearman’s correlations explored relationships among: total volume of tumor on FLAIR images, post-gadolinium T1W images, diffusion volume of tumor, nADC, age, and survival (in days). Cox regression analysis with hazard ratio tested for the model that best predicted survival. Kaplan-Meyer survival curve analysis was performed.Reference Harris and Taylor 20 Post hoc analyses, based on mean cut-off score for nADC, was done to assess differences between surgery types, including odds ratios and analysis of variance (ANOVA). Analysis of variance was used to assess mean differences on continuous outcome variables when there were more than two groups (e.g., surgery type 1, 2, 3). Cohen’s D standardized effect sizes for each surgery type were calculated, split by the nADC cut off. Cohen’s D reports the distance between two group means. Statistical conventions regarding interpretation are: small (d<0.3); medium (d~0.5); large (d>0.8); and extremely large (d>1) effects. Sample size was determined by the data available, as this was a limited sample from one institution. Post hoc power analyses are not meaningful and hence not performed. This study instead reports standardized effect sizes and 95% confidence intervals (CI) around reported estimates.
RESULTS
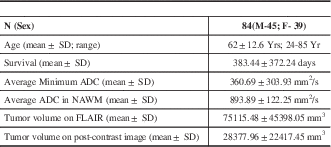
From January 2007 to January 2010, a total of 155 patients had a pathologically confirmed GBM in our institution. Of these, 102 patients fulfilled our imaging inclusion criteria. Other patients did not have DWI done at the time of diagnostic MRI. Only 84 of the 102 patients showed restricted diffusion. Selection and exclusion of patients were based on the qualitative assessment of DWI and ADC maps first without performing measurements. Measurements were acquired on only those tumors that had regions of restricted diffusion without hemorrhage. Further analysis was performed on these 84 patients only. All patients in our study reached the end point of the study, i.e., all of them died during the follow up. Table 1 shows the detailed demographic information of our patient population.
Demographic information, basic imaging, and survival information. ADC-Apparent Diffusion Coefficient; NAWM-Normal Appearing White Matter; FLAIR-Fluid Attenuated Inversion Recovery
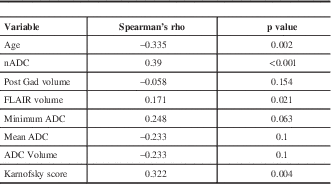
Bivariate correlations were calculated between the different variables and survival to assess whether or not to include them in the Cox regression to predict survival (Table 2). Variables with p<0.01 were further used for the Cox regression to predict survival. Cox regression analysis showed that age was negatively (r=−0.34) and nADC was positively (r=0.39) correlated to the overall survival of the patient (both p<0.01). The hazard ratio for age was 1.05 (95% CI 1.02-1.07, p<0.001) and that for nADC was 0.12 (0.03-0.45, p<0.01). The hazard ratio of Karnofsky score was 0.99 (95 % CI 0.976-1.004, p=0.172). A hazard ratio of 1 indicates no effect on time to death.Reference Harris and Taylor 20 The hazard ratio for age was slightly above 1, indicating that as patients get older, there is a small and consistent effect on increasing the odds of death. The hazard ratio for nADC was well below 1, indicating that as the nADC increases, there is a considerable decrease in the odds of deathReference Harris and Taylor 20 .
Variables examined and their relationship with the survival of the patient. ADC-Apparent Diffusion Coefficient; FLAIR-Fluid Attenuated Inversion Recovery; nADC-Normalized Apparent Diffusion Coefficient
On post-hoc analysis, a cut off nADC of 0.75 was significant to determine 90-day survival in these patients. The cut off score of 0.75 was determined by mean split of nADC. With nADC≥0.75, 90% of patients survived more than 90 days. With nADC<0.75, only 50% of patients survived more than 90 days. The odds ratio of less than 90 days survival was 2.7 (95% CI 1.733-4.21) with nADC<0.75 compared to 0.297 (95% CI 0.123-0.721) with nADC≥0.75. Kaplan Meier survival function, grouped by the nADC cut off of 0.75, was significant (Mantel-Cox Log Rank, Chi-square (2)=7.354, p=0.007) (Fig. 2).
Kaplan Meier survival function curves, grouped by nADC cut off of 0.75 was significant (Mantel-Cox Log Rank, Chi-square (2)=7.354, p=0.007). nADC- Normalized Apparent Diffusion Coefficient.

Effect of surgery type on patient survival
There were no significant survival differences between surgery types 1 and 2 (mean=182.4 days; 95% CI 467-102; p=0.28) and surgery types 2 and 3 (mean=175 days; 95% CI 460-111; p=0.31). However, there was a significant survival difference between surgery types 1 and 3 (mean=357 days; 95% CI 546, −168; p<0.001).
Kaplan Meier overall survival function, grouped by surgery type, was significant (Mantel-Cox Log Rank, Chi-square (2)=19.16, p<0.001) (Fig. 3).
Kaplan Meier overall survival function curves showed significant (Mantel-Cox Log Rank, Chi-square (2)=19.16, p<0.001) difference in survival of the patients grouped by surgery type. (Surgery types- 1-biopsy; 2-Partial resection; 3-Near complete or complete resection)

Effect of surgery type on survival stratified by nADC cut off
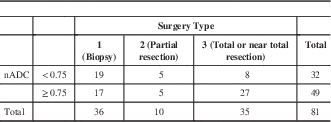
The cross-tabulation of the nADC cut off and surgery type is shown in Table 3. Cohen’s D standardized effect sizes for each surgery type were calculated, split by the nADC cut off (Table 4 and Fig. 4). Cohen’s D reports, in standard deviation units, the distance between two group means. The nADC of <0.75 had a statistically significant and an extremely large effect on the survival between type 1 and type 3 surgery groups and an extremely large, but not statistically significant, effect on survival between type 2 and type 3. The nADC of ≥0.75 had a statistically significant and a large effect on the survival between types 1 and 3 surgery groups.
Mean plot of survival in days, split by the cut off nADC- (a) For GBM with nADC of <0.75, the survival benefit was significant only when there was total or near total resection. (b) For GBM with nADC of ≥0.75, both partial resection and near total resection provided survival benefit. (Surgery types-1-biopsy; 2-Partial resection; 3-Near complete or complete resection. nADC-Normalized Apparent Diffusion Coefficient)

nADC and Surgery Type Cross-tabulation. nADC- Normalized Apparent Diffusion Coefficient
Mean Difference Effect Sizes for type of Surgery by nADC Cut Off. Mean differences and Cohen’s D standardized effect sizes for each surgery type.
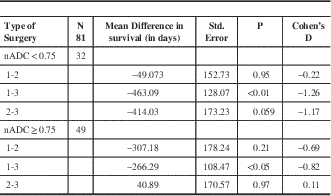
By convention, - small (d<0.3), medium (d~0.5), large (d>0.8), and extremely large (d>1) effect size. Surgery type- 1 (Biopsy); 2 (Partial resection) and 3 (Total or near total resection); nADC- Normalized Apparent Diffusion Coefficient
Kaplan Meier survival functions, grouped by surgery type and stratified by mean nADC cut off of 0.75, visually demonstrated the findings from the ANOVA and standardized effect sizes (Fig. 5). The overall comparisons of surgical grouping, adjusted for mean nADC cut off, was significant (Mantel-Cox Log Rank, Chi-square (2)=15.99, p<0.001).
Kaplan Meier overall survival functions of surgery grouping, adjusted for nADC ratio cut off, was significant (Mantel-Cox Log Rank, Chi-square (2)=15.99, p<0.001). (a) For nADC <0.75 and (b) nADC ≥0.75. (Surgery types-1-biopsy; 2-Partial resection; 3-Near complete or complete resection. nADC-Normalized Apparent Diffusion Coefficient)

DISCUSSION
Over the past 25 years, despite significant advances in our basic understanding of tumor pathogenesis, the median overall survival of patients with GBM has increased only 3.3 months (from 11.3 months to 14.6 months).Reference Stupp, Mason and van den Bent 26 , Reference Walker, Green and Byar 29 A variety of factors other than surgical management, such as the age of the patient, clinical status of the patient at presentation, size and location of the tumor and tumor biology, can influence the outcome of patients with GBM.Reference Eyüpoglu, Buchfelder and Savaskan 19
The variable response of GBM to currently used therapies coupled with short survival times underline the need for biomarkers that can accurately predict treatment outcome. A biomarker at the time of diagnosis will help in avoiding side effects from ineffective therapies. Magnetic resonance imaging sequences of diffusion imaging techniques is one method with such potential, as it is dependent on the microscopic structure of tissue and is sensitive to cell density, necrosis, as well as vasogenic and cytotoxic edema.
Diffusion weighted imaging is now commonly acquired in almost all practice settings. Diffusion weighted imaging has the advantages of being quick, does not require contrast injection, and is more reproducible than other advanced physiological imaging techniques (such as perfusion imaging).Reference Bedekar, Jensen and Schmainda 30 Unlike other studies,Reference Neal, Trister, Cloke, Sodt, Ahn and Baldock 22 diffusion does not require any complex models to predict the overall survival of the patients with GBM. In neoplasms, lower ADC values have been shown to correlate with higher cell density.Reference Ellingson, Malkin and Rand 18 Conversely, higher ADC values have been observed in regions of necrosis and edema.Reference Chenevert, Sundgren and Ross 14
Our study suggests diffusion can serve as an imaging marker at the time of initial diagnosis. Kaplan Meier analysis indicated that in GBM patients with nADC value below 0.75, total resection of the tumor might be the only way to improve their survival. When the nADC was above 0.75, then either partial or gross total resection significantly improved the patients’ survival. This finding suggests that nADC at the time of diagnostic imaging can guide the extent of surgery to improve the overall survival. However, this needs to be further tested in prospective studies with larger patient populations. To assess reliability, two independent investigators should measure nADC at two different times for each patient in subsequent studies.
We found that minimum ADC itself, instead of mean ADC, showed a trend towards significant association with the survival of patients with GBM. Possibly the area of minimum ADC represents the area of highest malignancy in the tumor. Because GBMs are highly heterogeneous tumors, the mean ADC gets diluted and thus may not reflect the actual degree of malignancy.
We used overall survival as an endpoint. Even though imaging analysis was entirely post hoc, our analysis confirmed that the nADC was a significant biomarker for overall survival and a gauge for surgical treatment response. It remains to be seen if nADC correlates with any molecular or genomic markers of GBM.
A recent study showed that a combination of perfusion and permeability parameters can more accurately predict the survival of patients with GBM then either of them individually.Reference Shankar, Woulfe, Silva and Nguyen 25 It will be important to study the combination of perfusion, permeability, and diffusion parameters together to determine whether these combined parameters give a more robust imaging marker to predict the outcome of patients with GBM.
Limitations
This study was a retrospective analysis and has its limitations. As a result of the retrospective nature of our study, we did not have information on progression free survival in our patients. We did not analyze the effect on survival by adjuvant chemo- and radio-therapy, as all patients were given similar, if not the same, treatment protocol. Additionally, we did not have detailed information regarding other advanced imaging techniques performed, such as perfusion imaging, which has also been shown to have a role in predicting survival in patients with GBM.Reference Shankar, Woulfe, Silva and Nguyen 25 The effect of the combination of these parameters on the survival of the patients with GBM could not be assessed. The study was also limited by the relatively small sample size. Between surgery types 2 and 3, we had an extremely large effect on survival that was non-significant at p<0.05 with the sample size for the groups being 5 and 8, respectively. These 13 patients were 14.81% of the total sample (N=81). To get a large enough sample for this specific post hoc comparison (Cohen’s D=1.17) to be significant at p<0.05, power=0.8, we would need 16 participants in each group (32 in total for this specific comparison). If further data collection has the same proportions of patients having the different types of surgery, then we would need ‘n’ of 32 to be 14.81% of our final sample. Based on trends we saw in ANOVA that we assume would be significant and meaningful if appropriately powered, we would need a sample size of 216 patients.
One recent report raises the question of ADC as a marker for cellularity or aggressiveness of the tumor.Reference Rose, Fay, Thomas, Bourgeat, Dowson, Salvado, Gal, Coulthard and Crozier 31 Our paper does not directly address the pathological correlation of the ADC. Our results definitely emphasize the role of ADC in patient management and outcome. Our paper does not address the inter-observer agreement for defining area of diffusion restriction, as it was a quantitative analysis and not a qualitative analysis. Molecular markers (MGMT, IDH) have been used for prognostication of patients with GBM. GBM patients with isocitrate dehydrogenase 1 and 2 (IDH1 and IDH2) mutations are known to have favourable prognosis with relatively longer survival.Reference Zou, Xu and Chen 32 Patients expressing less O 6-methylguanine DNA methyltransferase (MGMT) in the GBM show a significantly better therapeutic response to combined radiation and chemotherapy that results in increased survival and less recurrence.Reference Wiewrodt, Nagel, Dreimuller, Hundsberger, Perneczky and Kaina 33 We did not compare imaging features with any microscopic features and molecular markers of GBM, as the molecular makers were not available for this group of patients. This comparison should be addressed in any future studies.
Conclusion
In conclusion, our study showed the value of diffusion imaging in predicting survival in patients with GBM and its potential value in stratifying response to surgery. Further prospective evaluation in clinical trials with the implementation of standardized imaging methodology may optimize the benefit of this promising marker.
Disclosures
Jai Jai Shiva Shankar, Adil Bata and Krista Ritchie, Simon Walling, and Andrea Hebb do not have anything to disclose.



