Feeding is a complex behaviour consisting of food selection, acquisition and digestion to maintain survival, growth and reproduction. Feeding behaviour is affected by many factors, such as extrinsic factors (i.e. environmental conditions, stressors or nutrient availability and quality) and intrinsic factors (hormonal and physiological factors)(Reference Schwartz, Just and Chriqui1,Reference Nifli2) . Many factors, hormones and neuropeptides secreted from the brain and peripheral tissues, have demonstrated the function of the regulation of food intake(Reference Dodds3,Reference Rønnestad, Gomes and Murashita4) . According to the effects on food intake, these factors can be divided into orexigenic factors (such as neuropeptide Y (NPY)(Reference Tatemoto, Carlquist and Mutt5), agouti-related protein(Reference Shutter, Graham and Kinsey6) and Orexin(Reference Sakurai, Amemiya and Ishii7)), as well as anorexigenic factors (such as cocaine-amphetamine-regulated transcript (CART)(Reference Thim, Nielsen and Judge8), pro-opiomelanocortin(Reference Tung, Piper and Yeung9), cholecystokinin (CCK)(Reference Gibbs, Young and Smith10), peptide YY (PYY)(Reference Tatemoto11), NUCB2/nesfatin-1(Reference Oh, Shimizu and Satoh12), urocortin 3 (UCN3)(Reference Péterfi, Farkas and Nagyunyomi-Sényi13) and neuromedin U (NMU)(Reference Minamino, Sudoh and Kangawa14)).
NMU is one of neuropeptides first isolated from the spinal cord of porcine(Reference Minamino, Sudoh and Kangawa14). To date, NMU has been identified in mammals(Reference Austin, Lo and Nandha15–Reference Kage, O’Harte and Thim18), birds(Reference Kamisoyama, Honda and Saneyasu19), amphibians(Reference Lee, Liu and Shen20) and fish(Reference Maruyama, Konno and Ishiguro21–Reference Li, Xiao and Liu24). Previous studies showed that NMU has extensive biological functions, especially in the regulation of food intake and energy homoeostasis(Reference Kaisho, Nagai and Asakawa25,Reference Teranishi, Hayashi and Higa26) . In fish, NMU was isolated from goldfish for the first time(Reference Maruyama, Konno and Ishiguro21) and then cloned from common carp(Reference Kono, Hamasuna and Korenaga22), orange-spotted grouper(Reference Li, Xiao and Liu24) and Japanese pufferfish(Reference Kono, Ida and Kawahara23). However, the information about biological functions of NMU in fish species is still limited. There are more than 30 000 kinds of fish species in the world, which has great differences in feeding habits (omnivorous, herbivorous and carnivorous) and body structure (such as stomach and no stomach)(Reference Rønnestad, Gomes and Murashita4). Therefore, it is very necessary to study the role of NMU in appetite regulation of fish, since limited information is available, particularly in the peripheral tissues.
Previous studies have focused on the function of central NMU in feeding regulation. Intracerebroventricular (i.c.v.) injection of NMU inhibited food intake in rodents(Reference Helfer, Ross and Morgan27–Reference McCue, Kasper and Hommel29), chicken(Reference Kamisoyama, Honda and Saneyasu19) and goldfish(Reference Maruyama, Konno and Ishiguro21,Reference Maruyama, Kaiya and Miyazato30) . Besides, only a few studies have reported that subcutaneous administration of NMU inhibited food intake in rodents(Reference Peier, Desai and Hubert31,Reference Masuda, Kumano and Noguchi32) . However, the study of NMU on appetite regulation is still limited in fish species, especially in the peripheral tissues. In fish, studies about the role of NMU in feeding regulation have been reported in goldfish(Reference Maruyama, Konno and Ishiguro21,Reference Maruyama, Kaiya and Miyazato30) and orange-spotted grouper(Reference Li, Xiao and Liu24), which belong to teleost fish. Sturgeon is an ancient chondrostean species separated from teleost and the cartilaginous. The feeding of sturgeons is particularly important to ensure the production of caviar all over the world. According to the data of FAO, the world’s output of caviar was 537·30 tons, the output of sturgeons’ culture was 98 900 tons in 2017 and the scale of sturgeons’ culture has been increasing in recent years(33). Siberian sturgeon (Acipenser baerii) is one of the important sturgeon species widely cultured in the world, and feeding is closely related to its growth and survival. Therefore, it is necessary to study the feeding regulation mechanism of Siberian sturgeon.
Several appetite factors have been identified in Siberian sturgeon by our group, such as PYY(Reference Chen, Zhang and Hao34), UCN3(Reference Zhang, Wu and Hao35), Apelin(Reference Hao, Liu and Zhang36), CCK(Reference Zhang, Tang and Qi37), CART(Reference Zhang, Gao and Tang38) and NUCB2/Nesfatin-1(Reference Zhang, Wang and Chen39). However, no available data about nmu in Siberian sturgeon have been found. This study aims to investigate the effects of NMU in food intake and appetite regulation mechanism in Siberian sturgeon. First, we identified Siberian sturgeon nmu gene and analysed nmu mRNA expression patterns. Second, two feeding experiments (pre-feeding and post-feeding, fasting and re-feeding) were conducted to investigate nmu mRNA expression in the appetite-related tissues in response to the change of nutritional status. Third, i.c.v. injection and acute/chronic intraperitoneal (i.p.) injection experiments were carried out to detect food intake and appetite factors expressions in Siberian sturgeon. This study will provide a theoretical foundation for understanding the mechanisms regulating appetite in sturgeons and other fish species.
Materials and methods
Fish
Juvenile Siberian sturgeons (103·39 ± 13·92 g) were obtained from Runzhao Fisheries Co., Ltd. and for all subsequent experiments. Fish were housed at 19·0 ± 0·5°C with a 12 h light–12 h dark cycle in 60·0 × 50·0 × 40·0 cm indoor tanks in Sichuan Agricultural University Aquaculture Laboratory (Chengdu, China). All tanks were constantly aerated and statically filled with fresh water and changed for half of the fresh water twice a day at 8 a.m. and 8 p.m. Fish were fed to satiety with commercial sinking pellets (crude protein ≥ 44%, crude fat ≥ 6%, crude ash ≤ 16%, water ≤ 12 % and lysine ≥ 1·8 %; Tongyi) daily at 14:00 manually. Fish before all the experiments had two weeks acclimatation. All the experiments were approved by the Sichuan Agricultural University Animal Care and Use Committee (under permit no. DKY-S20181005) and followed the guidelines of animal experiments of Sichuan Agricultural University.
Molecular cloning and sequence analysis
Total RNA was extracted from Siberian sturgeon tissue samples using the RNAiso Plus Kit (Takara) following the manufacturer’s protocol. Final RNA concentrations were estimated by RNA electrophoresis and optical density absorption ratio (A260/280). Total weight 1 μg of RNA (1·8 ≤ A260/280 ≤ 2·0) was RT into cDNA using the PrimeScript™ RT Reagent Kit (Takara).
Cloning primers of nmu were designed using Primer 5 (Table 1). The PCR system included 5 μl Master Mix, 1 μl cDNA template, 0·5 μl primers and finally 3 μl for ddH2O to 10 μl. The PCR conditions included an initial 5 min denaturation at 94°C; followed by thirty-four cycles at 94°C for 30 s, a gene-specific annealing temperature for 30 s and 72°C for 1 min; a final extension for 5 min at 72°C and finally cooled to 12°C using a T100™ Thermal Cycler (BioRad, Hercules). Products were electrophoresed in 1·0 % agarose gel by Universal DNA Purification Kit (TIANGEN), ligated into the pMD-19T vector (Takara, Dalian, China) and transformed into the competent cells E. coli DH5α (Takara). Sequencing was performed at Sangon Biotech Co., Ltd. This study obtained the complete sequence of NMU CDS. Unfortunately, the completed sequence of NMU cDNA was not obtained, although we have tried many times to clone the full-length cDNA sequence by Rapid Amplification of cDNA Ends method.
Primers used for cDNA cloning and qPCR in this study.

The NMU ORF was predicted with the Open Reading Frame Finder (http://www.ncbi.nlm.nih.gov/gorf/gorf.html). The deduced NMU amino acid sequence was analysed using BLASTn and BLASTp (http://www.ncbi.nlm.nih.gov). The cleavage site of the signal peptide was predicted by using the SignalP 4·1 Server (http://www.cbs.dtu.dk/services/SignalP/). Moreover, multiple alignments of amino acid sequences and phylogenetic analysis were performed by MEGA 5 software. The phylogenetic tree was constructed using the maximum likelihood method.
Tissue distribution of nmu mRNA
Six fish were anaesthetised with 0·02 % tricaine methyl sulfonate (MS-222) after feeding at 14:00 and then sacrificed for tissue collection at 15:00. The oesophagus, stomach, pyloric caeca, duodenum, intestinum valvula, rectum, heart, liver, pancreas, spleen, trunk kidney, sexual gland, swim bladder, eye, gill, white muscle, skin and brain were quickly removed, and the whole brain was further separated into telencephalon, hypothalamus, mesencephalon, cerebellum and medulla oblongata(Reference Yáñez and Anadón40). All tissues were stored at –80°C for RNA extraction.
Effects of feeding status changes on nmu mRNA expression
Pre-prandial and post-prandial experiment
To investigate the pre-prandial and post-prandial expression of nmu, sixty-three fish were randomly assigned into twenty-one tanks (n 3 fish per tank, 60·0 × 50·0 × 40·0 cm) and fed once a day at an appointed time (14.00, be deemed to be 0 h) for 2 weeks of accommodation before the experiment. Sampling can be completed on the same day of this experiment. During the experiment, six fish were collected from every group at different points in time, namely, at 3 h before feeding (–3 h), 1 h before feeding (–1 h), upon commencement of feeding (0 h), 1 h after feeding (1 h) and 3 h after feeding (3 h). The other two unfed groups were also sampled at +1 h and +3 h as the control of the feeding fish, respectively. After anaesthetised with 0·02 % MS-222 and then sacrificed, based on the results of expression pattern of nmu, different brain regions (telencephalon, hypothalamus, mesencephalon, cerebellum and medulla oblongata) and peripheral tissues (oesophagus, duodenum, intestinum valvula and white muscle) of six fish were sampled at every time points and frozen into liquid nitrogen and stored at –80°C for further analysis.
Fasting and re-feeding experiment
To explore the effect of fasting and re-feeding on nmu mRNA expression, 135 fish were randomly assigned to fifteen groups with three tanks (three fish each tank, 60·0 × 50·0 × 40·0 cm) per group. During the experiment, six groups of fish were fed for 1, 3, 6, 10, 15 or 17 d as the control, six groups of fish were not fed for 1, 3, 6, 10, 15 or 17 d and the other three groups of fish were re-fed for 1, 5 or 7 d after 10 d fasted. Six fish were collected from every group and sampled at 1 h after feeding time. When fish were anaesthetised with 0·02 % MS-222 and killed, hypothalamus, intestinum valvula and liver were sampled and frozen into liquid nitrogen and stored at –80°C for further analysis.
Effects of neuromedin U-25 on food intake and appetite factors
Peptide synthesis
The sequence of Siberian sturgeon NMU-25 (FRDDDLQGPGGIQSRGYFLFR-PRN) was obtained from multiple sequence alignment among species. NMU-25 was synthesised with molecular weight of 2927·19 and purity of 98 % by Shanghai BioScience & Technology Co., Ltd. NMU-25 was dissolved with saline and stored at –20°C before experiment.
Effects of acute and chronic i.p. injection of neuromedin U-25 on food intake
To study the short-term effect of peripheral NMU on food intake, thirty-six fish were randomly and averagely assigned to four groups (three tanks per group, three fish per tank, 60·0 × 50·0 × 40·0 cm). The experimental fish were anaesthetised with 0·02 % MS-222 and then i.p. injected of Siberian sturgeon NMU-25 diluted in saline with the dose of 50, 100 and 200 ng/g body weight (BW) at 14:00 once. The dose of the NMU-25 is designed based upon previous report. The control group was injected of saline. After injection, fish were returned to corresponding tanks and fed with pre-weighted feed to 3 % of body weight at 0, 1 and 3 h post treatment, respectively. The remaining food was collected with net at 1 h, 3 h and 6 h after injection, dried and weighed to calculate the food intake.
To investigate the long-term effect of peripheral NMU on food intake, thirty-six fish were randomly assigned to four groups. Three groups of experimental fish were i.p. injected of NMU-25 everyday with 50, 100 and 200 ng/g BW, respectively. One group of fish was i.p. injected of saline as the control group. All fish were fed with feed to 3 % ration of body weight at 0 h post injection (all fish were injected at 13:45, 15 min before 0 h and the fish had recovered), and the rest of feed were collected at 1 h after injection for the measure of food intake. The chronic experiment was carried out for 7 d, and food intake was monitored every day.
Effects of i.c.v. injection of neuromedin U-25 on food intake
To investigate the effect of central NMU on food intake, thirty-six fish were randomly and averagely assigned to four groups (three tanks per group, three fish per tank, 60·0 × 50·0 × 40·0 cm). After two weeks of acclimated, the experimental fish were anaesthetised with 0·02 % MS-222 and then i.c.v. injected of Siberian sturgeon NMU-25 (1 μl) with the dose of 1, 10 and 100 pmol/g BW at 14:00, respectively. The selection of dose was based on pre-experiment, and the operation method was according to the previous description(Reference Yáñez and Anadón40,Reference Clements, Schreck and Larsen41) . The other group of fish was i.c.v. injected of saline as the control group. After injection, fish were returned to corresponding tanks and fed with pre-weighted feed to 3 % of body weight at 0, 1 and 3 h post-injected, respectively. The remaining food was collected with net at 1, 3 and 6 h after injection, dried and weighted to calculate the food intake.
Effects of neuromedin U-25 on appetite factors mRNA expression
To investigate the effect of NMU on appetite factors mRNA expression, eighteen fish were divided into two groups (three tanks per group, three fish per tank, 60·0 × 50·0 × 40·0 cm) for acute i.p. injection experiment and other eighteen fish were divided into two groups for i.c.v. injection experiment like acute i.p. injection experiment. The experimental fish were injected with NMU-25 10 pmol/g BW and 100 ng/g BW, respectively, which could effectively regulate food intake. The control group of fish was injected of saline. At 1 h after injection, six fish from per group were anaesthetised with MS-222, the tissues including hypothalamus, intestinum valvula and liver were collected after sacrificed based on the results of tissue distribution and the function of these tissues in fish, which was description in the section of discussion. Tissues were quickly frozen into liquid nitrogen and stored at −80°C for qPCR.
Real-time quantitative PCR
Total RNA was extracted from tissues with RNA Extraction Kit (Foregene) and then reversed into cDNA by PrimeScript RT Reagent Kit (TaKaRa). The cDNA products were diluted to 1:8 in nuclease-free water. Real-time quantitative PCR analysis was performed in quadruplicate on a CFX Real Time PCR Detection System (Bio-Rad). The methods and procedures refer to previous report (Zhang et al., 2016). The optimum temperature and standard curve of fluorescence quantitative reaction were obtained. R2 (0·95 < R2 < 1·00), and efficiencies (0·95–1·00) were determined for all primer pairs which were designed by Primer 5 (Table 1). Both β-actin and gapdh (Table 1) were used as housekeeping genes to control for error among samples to analysis of the target genes mRNA expressions according to the previous report in Siberian sturgeons(Reference Zhang, Wu and Hao35). The target genes were normalised to the housekeeping genes (geometric averaging of β-actin and gapdh Ct value), and expressions were compared using the relative Ct method(Reference Livak and Schmittgen42). Each template was repeated for four times.
Statistical analysis
All data are expressed as mean ± sem. Statistical analysis was performed using SPSS (version 22·0) software (SPSS Inc.). After confirming the normal distribution, student’s t test was used for the comparison between two groups. One-way ANOVA analysis was used and followed by Duncan’s multiple range tests to analyse the difference among multiple groups. Difference at P < 0·05 was considered to be statistically significant.
Results
Analysis of Siberian sturgeon nmu cDNA sequence
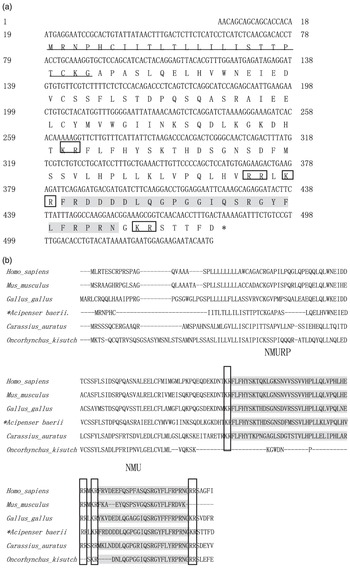
The length of the nmu cDNA of Siberia sturgeon (GenBank accession number: MH748029) was 540 bp, including an ORF of 465 bp encoding 154 amino acids. Prepro-NMU had a signal peptide of twenty-five amino acids and mature peptide NMU-25 in the C-terminus (Fig. 1(a)). The amino acids of prepro-NMU were highly conserved among vertebrates. According to the analysis of amino acid cleavage sites, two peptide segments, NMU-25 and NMURP, may be existed in the C-terminal of prepro-NMU (Fig. 1(b)).
(a) Nucleotide and deduced amino acid sequence for Siberian sturgeon nmu. The putative signal peptides are underlined. The mature peptides are shaded. The predicted cleavage sites required for processing are boxed and asterisk indicates the stop codon. (b) Comparison of amino acid sequences of NMU. The putative peptides are shaded in grey, and proteolytic cleavage sites are boxed.

Tissue distribution of Siberian sturgeon nmu mRNA
Siberian sturgeon nmu mRNA was widely expressed in twenty-two tissues examined. The result showed that nmu mRNA was strongly expressed in telencephalon and hypothalamus. Besides, it could have been mentioned that the expression of nmu mRNA in the spleen, swim bladder, white muscle, skin, sex gland, cerebellum and eyes were higher than the other tissues. (Fig. 2).
Tissue distribution of nmu mRNA in Siberian sturgeon. Te, telencephalon; Hy, hypothalamus; Me, mesencephalon; Ce, cerebellum; Mo, medulla oblongata; Es, oesophagus; St, stomach; Pc, plyoric caeca; Il, intestinum valvula; Du, duodenum; Re, rectum; He, heart; Li, liver; Pa, pancreas; Sp, spleen; Tk, trunk kidney; Sg, sexual gland; Sb, swim bladder; Ey, eye; Gi, gill; Wm, white muscle; Sk, skin. Data are means ± sem, n 6 per tissue.

Pre-prandial and post-prandial expression of nmu mRNA in the different brain regions and peripheral tissues of Siberian sturgeon
In this study, the expression of nmu was detected in the different brain regions including hypothalamus, telencephalon, mesencephalon, cerebellum and medulla oblongata (Fig. 3). The results showed that nmu mRNA expressions at −3 h and −1 h before feeding were lower than that at 0 h in the hypothalamus (Fig. 3(a)). When compared with unfed fish at +1 h and +3 h, nmu mRNA expression was significantly decreased at 1 h and 3 h after feeding (1 h, P < 0·05; 3 h, P < 0·001; Fig. 3(a)). Besides, in telencephalon (Fig. 3(b)) and mesencephalon (Fig. 3(c)), the level of nmu mRNA was reduced significantly at +1 h after feeding (P < 0·01), while it had not significantly difference at +3 h between fed and unfed groups (P > 0·05). Moreover, the expression of nmu was still significantly down-regulated in cerebellum (Fig. 3(d)) and medulla oblongata (Fig. 3(e)) after feeding at +1 and +3 h (P < 0·05).
Preprandial and postprandial expression of nmu mRNA in the different brain regions of Siberian sturgeon, including hypothalamus (a), telencephalon (b), mesencephalon (c), cerebellum (d) and medulla oblongata (e). Data are means ± sem; n 6 per group. The mRNA expression was normalised to gapdh and β-actin. Different letter represents significant difference between fasting groups (ANOVA, P < 0·05). Differences indicated with asterisks are significant differences between the fed and unfed groups at the same sampling time. (Student’s t test, *P < 0·05, ** P < 0·01, *** P < 0·001).

In addition, expression of nmu in peripheral tissues was also detected, such as oesophagus, intestinum valvula, duodenum and muscle (Fig. 4). The results showed that after feeding 1 and 3 h, the expression of nmu mRNA significantly decreased among these peripheral tissues, including oesophagus (+1, P < 0·05; +3 h, P < 0·01; Fig. 4(a)), intestinum valvula (+1, P < 0·001; +3 h, P < 0·01; Fig. 4b)), duodenum (+1, P < 0·01; +3 h, P < 0·01; Fig. 4(c)) and muscle (+1, P < 0·05; +3 h, P < 0·01; Fig. 4(d)). While expression increased in the oesophagus and duodenum between time +1 h and +3 h, in white muscle this behaviour was reversed (Fig. 4).
Preprandial and postprandial expression of nmu mRNA in Siberian sturgeon oesophagus (a), intestinum valvula (b), duodenum (c) and muscle (d). Data are means ± sem; n 6. The mRNA expression was normalised to gapdh and β-actin. Bars with dissimilar letters indicate fasting groups that differ significantly (ANOVA, P < 0·05). Asterisks represent significant differences between the fed and unfed groups at a set time (Student’s t test, *P < 0·05, **P < 0·01, ***P < 0·001).

Effects of fasting and re-feeding on nmu mRNA expression in the different brain regions and peripheral tissues of juvenile Siberian sturgeon
RT-qPCR was used to investigate nmu mRNA expression under fasting and re-feeding status during 17 d. When fish were fasted, nmu mRNA in the hypothalamus was significantly increased on the first day but decreased from 3 to 17 d (P < 0·05, Fig. 5(a)). When fasted fish were re-fed on the day 10, nmu mRNA expression was immediately increased but was still lower than that in feeding group (P < 0·05, Fig. 5(a)). After being re-fed, nmu mRNA expression was significantly increased compared with unfed fish on days 15 and 17 (P < 0·05, P < 0·01, Fig. 5(a)). There was no significant difference in nmu mRNA expression between feeding group and re-feeding group on the day 17 (Fig. 5(a)). Differently, the expressions of nmu mRNA in telencephalon (Fig. 5(b)) and mesencephalon (Fig. 5(c)) were significantly increased after being fasted during for 15 d and 10 d compared with fed group, respectively (P < 0·05). In the telencephalon, the level of nmu significantly reduced after re-feeding from day 10 to day 17 compared with unfed group (P < 0·05), and there was no significant different between fed group and re-fed group on day 17 (P > 0·05, Fig. 5(b)). Moreover, the change of num in cerebellum (Fig. 5(d)) and medulla oblongata (Fig. 5(e)) was variable. The expression of num was significantly decreased after being fasted for 6 and 15 d and significantly increased after fasting for 10 and 17 d in cerebellum, respectively (P < 0·05, Fig. 5(d)), while it was significantly increased after being fasted for 1 and 6 d and significantly decreased after being fasted for 15 d in medulla oblongata, respectively (P < 0·05, Fig. 5(e)).
Fasting and re-feeding changes in the expression of nmu mRNA in Siberian sturgeon, hypothalamus (a), telencephalon (b), mesencephalon (c), cerebellum (d) and medulla oblongata (e). Data are means ± sem; n 6 per treat. The mRNA expression was normalised to gapdh and β-actin. Asterisks represent significant differences between the fed and unfed groups at a set time (Student’s t-test, *P < 0·05,**P < 0·01, ***P < 0·001). Lowercase Latin letters indicate significant differences of fed groups at different time (P < 0·05). Capital Latin letters indicate significant differences of unfed groups at different time (P < 0·05). Roman letters indicate significant differences of re-fed groups at different time (P < 0·05).

In peripheral tissues (Fig. 6) of Siberian sturgeon, the results showed that after being fasted, the level of nmu mRNA significantly increased at 3 d (P < 0·05) and 15 d (P < 0·01) but significantly decreased compared with the control at 6 d (P < 0·05) and 10 d (P < 0·01) in oesophagus (Fig. 6(a)). When fish were re-fed 5 d after 10 d fasted, the expression of nmu had significant change between fed and re-fed groups while re-fed 7 d without significance (Fig. 6(a)). Besides, the level of num in intestinum valvula significantly up-regulated after being fasted for 1, 6 and 15 d (P < 0·01, P < 0·05 and P < 0·01), but it was significantly down-regulated after fasted 17 d (P < 0·01, Fig. 6(b)). In the liver, the expression of nmu significantly increased during fasted 17 d, and it was significantly decreased when fish were re-fed at days 10, 15 and 17 compared with unfed group (P < 0·05, Fig. 6(c)).
Fasting and re-feeding changes in the expression of nmu mRNA in oesophagus (a), intestinum valvula (b) and liver (c) of Siberian sturgeon. Data are means ± sem; n 6 per treat. The mRNA expression was normalised to gapdh and β-actin. Asterisks represent significant differences between the fed and unfed groups at a set time (Student’s t-test, *P < 0·05,**P < 0·01, ***P < 0·001). Lowercase Latin letters indicate significant differences of fed groups at different time (P < 0·05). Capital Latin letters indicate significant differences of unfed groups at different time (P < 0·05). Roman letters indicate significant differences of re-fed groups at different time (P < 0·05).

Effects of neuromedin U-25 injection on food intake of juvenile Siberian sturgeon
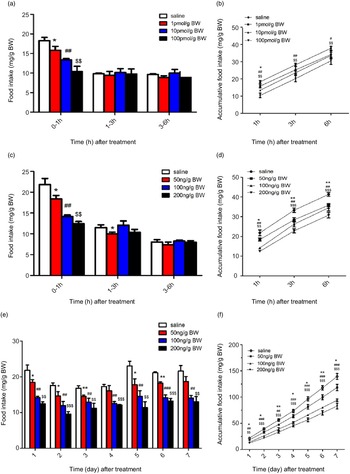
In this study, in order to investigate the effects of NMU on the food intake of Siberian sturgeon, NMU-25 was injected into fish by three ways: acute i.c.v. administration, acute i.p. injection and chronic i.p. injection. The results showed that i.c.v. administration 1, 10 and 100 pmol/g BW NMU-25 significantly reduced the food intake for 0–1 h (P < 0·05, P < 0·01, P < 0·01), but the food intake for 1–3 h and 3–6 h had no significant change (Fig. 7(a)). The results of accumulated food intake showed that 1 pmol/g BW NMU-25 only significantly decreased 1 h food intake (P < 0·05, Fig. 7(b)), and 10 and 100 pmol/g BW NMU-25 significantly decreased the accumulated food intake during 3 h (P < 0·01, P < 0·01, Fig. 7(b)) and 6 h (P < 0·05, P < 0·01, Fig. 7(b)).
Effects of acute i.c.v. (a), (b), acute i.p. (c), (d) and chronic i.p. (e), (f) injection of NMU-25 on food intake by period time (a), (c) and (e) and cumulative food intake (b), (d) and (f) in Siberian sturgeon. Data are means ± sem; n 3 fish x 3 tank per treatment. Marks with symbols indicate significant difference between NMU-25 injection group and the saline control. *P < 0·05, **P < 0·01, ***P < 0·001 as 50 ng/g BW v. the saline control; # P < 0·05, ## P < 0·01, ### P < 0·001 as 100 ng/g BW v. the saline control; $ P < 0·05, $$ P < 0·01, $$$ P < 0·001 as 200 ng/g BW v. the saline control.

Acute i.p. injection of NMU-25 at 50, 100 and 200 ng/g BW significantly decreased the food intake for 1 h (P < 0·05, P < 0·01 and P < 0·05, Fig. 7(c)). Food intake for 1–3 h was significantly decreased by 50 ng/g BW NMU-25 (P < 0·05), but it was not affected by 100 and 200 ng/g BW NMU-25 (P > 0·05, Fig. 7(c)). There was no significant difference in food intake for 3–6 h among four groups (Fig. 7(c)). Accumulated food intake for 1, 3 and 6 h after NMU-25 treatment was significantly decreased at the dose of 50, 100 and 200 ng/g BW compared with the control group (Fig. 7(d)).
Compared with injection of saline, chronic i.p. injection of NMU-25 at 50 ng/g BW significantly decreased the food intake in days 1, 2, 3, 5 and 6 (P < 0·05, P < 0·05, P < 0·01, P < 0·05 and P < 0·01, Fig. 7(e)). NMU-25 at both 100 and 200 ng/g BW significantly reduced the food intake from day 1 to day 7 compared with the saline control (P < 0·01, Fig. 7(e)). In addition, compared with saline group, all the three doses of NMU-25 significantly reduced cumulative food intake during 7 d (Fig. 7(f)).
Effects of neuromedin U-25 injection on mRNA expressions of appetite factors in the hypothalamus, intestinum valvula and liver of Siberian sturgeon
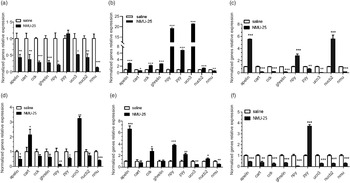
The mRNA expressions of several appetite factors were detected in hypothalamus, intestinum valvula and liver after 1 h treatment of NMU-25 (10 pmol/g BW for i.c.v. experiment and 100 ng/g BW for i.p. experiment, Fig. 8). The results showed that in the i.c.v. experiment, the expressions of npy, ucn3, apelin, cart, nucb2, cck, ghrelin and nmu reduced significantly while pyy had no significance in the hypothalamus (P < 0·05, Fig. 8(a)). The transcription levels of cart and nmu were significantly decreased (P < 0·05, Fig. 8(b)), while that of apelin, cck, ghrelin, npy, pyy, ucn3 and nucb2 were significantly increased in intestinum valvula after NMU-25 injected (P < 0·01, Fig. 8(b)). In the liver, the expressions of pyy, ucn3, cart, cck, ghrelin and nmu decreased significantly (P < 0·01, Fig. 8(c)), while the levels of apelin, npy and nucb2 increased significantly (P < 0·001, Fig. 8(c)).
Effects of NMU on the expressions of appetite factors in hypothalamus (a), (d), intestinum valvula (b), (e), and liver (c), (f) of Siberian sturgeon after acute i.c.v. (a), (b) and (c) and i.p. (d), (e) and (f) injection of NMU-25. Data are means ± sem; n 6 per tissues. The mRNA expression was normalised to gapdh and β-actin. Asterisks represent significant difference in comparison with the saline treatment control (Student’s t-test, *P < 0·05, **P < 0·01, ***P < 0·001).

In the acute i.p. experiment, the results showed that after 100 ng/g BW NMU-25 injection for 1 h, the expressions of apelin, pyy, npy and nmu decreased significantly in the hypothalamus (P < 0·05, Fig. 8(d)), while the levels of cart and ucn3 increased significantly (P < 0·05, Fig. 8(d)). Besides, the mRNA expressions of ucn3 and nmu significant reduced, while the levels of apelin, cck, npy, pyy and nucb2 significantly increased in the intestinum valvula (P < 0·05, Fig. 8e). Differently, in the liver, the levels of apelin, cart, cck, ghrelin, npy, ucn3, nucb2 and nmu down-regulated significantly, while only the mRNA expression of pyy significantly up-regulated (P < 0·001, Fig. 8f).
Discussion
Gene identification and mRNA expression distribution
To date, the information about the nmu in fish is limited. In teleost, nmu gene has been cloned from several fish species, including goldfish(Reference Maruyama, Konno and Ishiguro21), common carp(Reference Kono, Hamasuna and Korenaga22), orange-spotted grouper(Reference Li, Xiao and Liu24) and Japanese pufferfish(Reference Kono, Ida and Kawahara23). In this study, nmu cDNA sequence was first cloned in Siberian sturgeon. Siberian sturgeon prepro-NMU contained twenty-five amino acids at the C-terminus, namely NMU-25, which was conservative among species. Previously, NMU-25 has been identified in several species, such as human(Reference Austin, Lo and Nandha15), pig(Reference Minamino, Sudoh and Kangawa14), chicken(Reference Kamisoyama, Honda and Saneyasu19), frog(Reference Lee, Liu and Shen20), goldfish(Reference Maruyama, Konno and Ishiguro21,Reference Maruyama, Kaiya and Miyazato30) and common carp(Reference Kono, Hamasuna and Korenaga22). These data suggest that NMU-25 might be cleaved from Siberian sturgeon prepro-NMU to play various biological functions. qPCR analysis showed that nmu mRNA was abundantly expressed in the telencephalon and hypothalamus of Siberian sturgeon. These results suggest that nmu may play a role in the central nervous system as a neuromodulator in Siberian sturgeon. Interestingly, we found that nmu mRNA expression was highly expressed in the telencephalon of Siberian sturgeon. Similarly, NMU immunoreactive in perikarya was found in the telencephalon of Rana esculenta (Reference Maderdrut, Lázár and Kozicz43). From the perspective of phylogeny, the telencephalic neuroanatomy of fish is more similar to Amphibian than mammals(Reference Lust and Tanaka44). Different from mammals, the telencephalon of fish is composed of neural populations related to swimming ability, stress reactivity and relational memory(Reference Mes, Palstra and Henkel45,Reference Broglio, Gómez and Durán46) . The high expression of nmu gene in telencephalon of Siberian sturgeon suggests that NMU may be related to these biological functions which needed to be further studied. In addition, consistent with present study, nmu was highly expressed in the hypothalamus of humans, rodents and chicken(Reference Howard, Wang and Pong47–Reference Simon, Oláh and Komlósi49). However, the level of mRNA is low in the hypothalamus of pigs(Reference Li, Niu and Su50). In fish, the information about nmu mRNA expression is limited. Previous studies in teleost mainly focused on nmu mRNA expression in the whole brain. For example, nmu4 in the goldfish(Reference Maruyama, Konno and Ishiguro21) and common carp(Reference Kono, Hamasuna and Korenaga22), nmu in orange spotted grouper(Reference Li, Xiao and Liu24) and nmu2 in the Japanese pufferfish(Reference Kono, Ida and Kawahara23) were highly expressed in the whole brain. Furthermore, nmu-expressing cells were highly expressed in the NTL (lateral tuberal nucleu) of hypothalamus in orange spotted grouper through in situ hybridisation analysis(Reference Li, Xiao and Liu24), which was similar to the present study. Several isoforms of nmu in fish showed higher expression in brain regions, while the hypothalamus is the key region involved in the regulation of feeding behaviour and energy homoeostasis. These observations suggest that nmu may be related to feeding regulation in Siberian sturgeon.
In addition, nmu has an important role in the regulation of energy homoeostasis(Reference Teranishi, Hayashi and Higa26), and its higher expression in white muscle (main site of energy storage in fish), swim bladder and spleen of this study may be related to this(Reference Giudice and Taylor51–Reference Weinzirl, Scheffers and Garnitschnig53). nmu was also highly expressed in the skin which is the first immune barrier and sexual gland, whether it played a certain immune role(Reference Mizukawa, Doi and Yamazaki54) and reproductive regulation(Reference Shimizu, Matsuzaki and Iwasa55) needs to be further studied.
Effect of feeding status change on num expression in Siberian sturgeon
To explore whether nmu is involved in the regulation of feeding behaviour, short-term (pre-prandial and postprandial) and long-term (fasting and re-feeding) feeding experiments were performed. The expressions of nmu in different brain regions showed that the change in hypothalamus was the most significant. It is known that the hypothalamus is the key area in the central nervous system for regulating food intake in both mammals and fish. Previous study has reported that NMU regulated feeding through the paraventricular nucleus and raphe nucleus in rats(Reference McCue, Kasper and Hommel29). This study observed that nmu mRNA expression in hypothalamus was significantly decreased at 1 h and 3 h after feeding. This is contrary to previous reports in the orange-spotted grouper, which showed that the level of nmu mRNA in hypothalamus of grouper was not significantly changed at 1 h after feeding and increased significantly at 3 h after feeding(Reference Li, Xiao and Liu24). Besides, in peripheral tissue, the levels of nmu were detected in oesophagus, intestinum valvula and liver. There are plenty of intestinal glands in the intestinum valvula, and intestine is the main digestive site of nutrients digested by digestive enzymes of Siberian sturgeon(Reference Chediack, Funes and Cid56). In this study, similarly to hypothalamus, nmu decreased significantly after feeding 1 and 3 h in the intestinum valvula. Interestingly, nmu increased in the oesophagus and duodenum at time +1 h and +3 h of unfed groups, while in white muscle it was reversed. This may be related to organ function, as the gastrointestinal tract continuously responded to nutritional status, especially fasting(Reference Shoji57), while glucose uptake in muscle increased significantly during fasting(Reference Wan, Zhang and Fang58), but nmu treatment significantly reduced glucose(Reference Peier, Desai and Hubert31) thus the possible cause of nmu decreased in unfed groups. Therefore, the present study suggests that NMU may act as an orexigenic factor in the short-term feeding regulation of Siberian sturgeon.
In addition, in line with pre- and post-feeding experiment, nmu mRNA was significantly increased after short-term fasting (day 1) in the hypothalamus. Similarly, nmu mRNA in the hypothalamus was significantly increased after 24 h fasting in chicken(Reference Bechtold, Ivanov and Luckman59). These data suggest that nmu may indeed play an orexigenic role in the short term in Siberian sturgeon, which was different from mice(Reference Tang, Hao and Zhang60). Besides, nmu mRNA in the hypothalamus increased on the first day then decrease to day 3rd, after that increased to 10th day and decrease to 17th day, which may imply that nmu presents periodic changes during the long fasting process of Siberian sturgeon. Sturgeons can tolerate long-term fasting, and the above expression changes suggested that nmu may begin undergoing energy homoeostasis regulation on day 10. However, when Siberian sturgeon was fasted from 3 to 17 d, the mRNA expression of nmu in the hypothalamus was significantly decreased, which was consist with that nmu mRNA was decreased after 7-d fasting in the hypothalamus of the orange-spotted grouper(Reference Li, Xiao and Liu24). Moreover, nmu expression was reduced in the ventromedial hypothalamus in rat fasted for 2 d(Reference Howard, Wang and Pong47). A similar manner was reported on the brain of goldfish when fasted for 7 d(Reference Maruyama, Konno and Ishiguro21). Besides, in peripheral tissues, the levels of nmu showed that the change in liver was the most significant. The liver, the primarily tissue regulating energy homoeostasis, plays an important role in regulating the response of energy metabolism to nutritional status. Most of the nutrient utilisation and metabolism regulation first occur in the liver. In this study, the nmu of the liver increased significantly after fasting and decreased significantly after re-feeding. The difference between short-term and long-term may cause by tissue specificity in the central nervous system and peripheral tissue. All in all, the present study suggests that nmu might play an anorexigenic role in the long-term feeding regulation in Siberian sturgeon, which is conservative among species. In a word, these data indicate that nmu may play bidirectional roles in the regulation of food intake in Siberian sturgeon. Based on studies by our group that apela (Apelin Receptor Early Endogenous Ligand)(Reference Kazuhisa, Takaoki and Mika61), cart (cocaine- and amphetamine-regulated transcript)(Reference Zhang, Gao and Tang38) and other genes played bidirectional regulation in fish as well which can be compared with present results.
Neuromedin U-25 decrease the food intake of Siberian sturgeon
i.c.v. and i.p. injection of synthesised NMU-25 peptide which could be cleaved from Siberian sturgeon NMU showed that acute i.c.v. or i.p. injection of NMU-25 inhibited the food intake of Siberian sturgeon in a dose-dependent manner. Similarly, i.c.v. administration of 10 μg NMU significantly suppressed food intake of chicks within 2 h(Reference Kage, O’Harte and Thim18). Honda et al. also reported that central administration of 10 μg NMU significantly reduced the food intake in broiler and layer chicks(Reference Volkoff62). Besides, in mice, subcutaneous administration of NMU-25 significantly decreased the 2 h and 18 h food intake(Reference Peier, Desai and Hubert31), which was consistent with the present study. These results suggest that NMU-25 is one kind of anorexic peptide in Siberian sturgeon, which is opposite to previous hypothesis that nmu may play an orexigenic role in the short term. The different results may be due to the exogenous injection increasing the NMU levels in vivo, so that the NMU did not demonstrate the potential orexigenic effect of short-term fasting experiment showed. Meanwhile, chronic i.p. injection of NMU-25 for 7 d significantly inhibited the daily food intake and cumulative food intake of Siberian sturgeon. This result is in agreement with the assumption that nmu may have anorexigenic role in the long-term feeding regulation. Similarly, previous study in mice demonstrated that chronic subcutaneous injection of NMU-23 significantly decreased food intake(Reference Peier, Desai and Hubert31). To detect the possibility of stress on Siberian sturgeon caused by 7-d injection, we also measured effects of untreated and treated with saline for 7 d on the food intake, blood glucose and cortisol content, with no significant difference (unpublished). Thus, these results indicate that NMU-25 can reduce the food intake of Siberian sturgeon both in the short term and long term.
Effects of neuromedin U on appetite factors expressions
Although several studies have reported that NMU has the function of regulating animal feeding in recent years, the research on its appetite regulation mechanism is still very scarce. To further investigate the mechanism of NMU-25 in appetite regulation, this study detected appetite factors mRNA expressions in the hypothalamus, intestinum valvula and liver after acute injection effective dose of NMU-25. As we all know, hypothalamus is the key area for feeding, intestinum valvula is the critical location for digestive site of nutrients and liver is the primarily region of energy metabolism.
Feeding regulation is closely related to appetite, hunger and satiety, among which appetite is a physiological and/or psychological factor that governs food intake and food selection. The regulation mechanism of animal appetite is mainly controlled by the ‘appetite regulation network’ composed of central nervous endocrine system and peripheral organs(Reference Yuan, Gao and Zhang63). When the animal is hungry, the expression of orexigenic factor increases, promoting animal feeding. With the progress of feeding, the expression of orexigenic factors gradually decreased, while the expression of anorexigenic factors began to increase, and eventually slowed down and stopped feeding of animals. They are always in a dynamic balance through the increase and decrease of expression to complete the feeding regulation of animal. Recently, several genes involved in promoting (npy (Reference Ye, Lu and Liu64)) or inhibiting feeding (cart (Reference Zhang, Gao and Tang38), nucb2 (Reference Zhang, Wang and Chen39), ucn3 (Reference Zhang, Wu and Hao35), cck (Reference Zhang, Tang and Qi37) and pyy (Reference Chen, Zhang and Hao34)) have been identified in Siberian sturgeon by our group. These neuropeptides and peptides secreted from other tissues play important role in regulating appetite.
Previous reports showed that central injection of NMU significantly increased the expression of corticotropin-releasing factor (an appetite suppressor) in brain of chicks(Reference Kamisoyama, Honda and Saneyasu19). In the contrary, this study showed that the expressions of both appetite promoting factors and appetite inhibiting factors decreased significantly after i.c.v. injection of NMU, especially the expression of appetite promoting factors ghrelin and npy. Moreover, in peripheral tissues, including the intestinum valvula and liver, the levels of appetite-inhibiting factors apelin, cck, pyy and nucb2 significant increased after NMU i.c.v. injection. The changes of these appetite factors correspond to the decrease of food intake of Siberian sturgeon after NMU i.c.v. injection. In addition, present study showed that peripheral acute NMU-25 increased ucn3 and cart mRNA expression, decreased npy mRNA expression, but did not affected nucb2 mRNA expression in the hypothalamus. Similarly, peripheral NMU-25 decreased npy mRNA expression in the hypothalamus of DIO mice(Reference Peier, Desai and Hubert31). In the orange-spotted grouper, the expression of npy in hypothalamus was slightly inhibited after peripheral injection of NMU-21(Reference Li, Xiao and Liu24). In addition, peripheral injection of NMU induced a significant increase in pyy and cck mRNA expression in the intestinum valvula and significantly upregulated the expression of pyy in the liver of Siberian sturgeon. Both PYY and CCK are known to reduce food intake of animals including Siberian sturgeon(Reference Chen, Zhang and Hao34,Reference Zhang, Tang and Qi37) . A study in mice reported that acute treatment with NMU increased PYY expression in plasma(Reference Peier, Desai and Hubert31). Interestingly, the level of an orexigenic hormone ghrelin increased as well, and we hypothesised that nmu may mediate other biological processes in which ghrelin was involved in, such as gastrointestinal emptying, leading to the anorexigenic effect of NMU. Therefore, these finding suggest that NMU-25 inhibit food intake of Siberian sturgeon by affect appetite factors, but it maybe through different appetite pathways in the central nervous system and peripheral tissue of Siberian sturgeon.
Conclusions
In summary, nmu mRNA was highly expressed in the telencephalon and hypothalamus of juvenile Siberian sturgeon. A bidirectional effect of hypothalamic nmu in response to short-term and long-term feeding status change was observed in Siberian sturgeon for the first time. Additionally, both central and peripheral inhibitory effect of NMU-25 on food intake of Siberian sturgeon in the short term and long term was found. Furthermore, several appetite factors in the hypothalamus (npy, cart and ucn3), intestinum valvula (cck and pyy) and liver (pyy) might be primarily involved in the regulation of NMU on feeding behaviour in Siberian sturgeon. This study reveals that NMU reduced food intake of Siberian sturgeon by affecting appetite factors, which provides a foundation for further exploring the appetite regulation networks in fish. Further studies need to investigate the correlation between NMU and the above-mentioned appetite factors and to explore the intracellular signalling transduction pathways which regulates the feeding of Siberian sturgeon.
Acknowledgements
The authors thank Runzhao Fisheries (Sichuan, China) for providing experimental fish.
This study was supported by Sichuan Science and Technology Program grants (2019YJ0438).
Conceived and designed the experiments: Z. L. and X. Z. Performed the experiments: D. C., S. C., N. T., S. W., Yo. L., Ya. L., Yan. L., S. Z. and Yi. L. Analysed the data: S. W., X. Z. and S. C.
Contributed reagents/materials/analysis tools: Z. L., X. Z. and D. C. Wrote the paper: X. Z. and N. T.
The authors declare no competing or financial interests.