


Limited systematic data on food insecurity levels in Europe exist, whereas the USA and Canada are the few high-income countries that have regularly monitored national food insecurity levels within the population since the 1990s(Reference Borch and Kjærnes1). Yet, there are reports of rising numbers of people looking for emergency food support in Europe(Reference Loopstra, Reeves and Stuckler2). The sporadic studies measuring food insecurity in Europe have found it exists(Reference Neter, Dijkstra and Visser3–Reference Nelson, Erens and Bates6), even in countries often characterised as having social-democratic welfare regimes such as the Nordic countries(Reference Lund, Holm and Tetens7,Reference Henjum, Morseth and Arnold8) .
There is some research on the entrenchment of food aid and charity in Finland(Reference Silvasti, Tikka, Lambie-Mumford and Silvasti9,Reference Salonen, Ohisalo and Laihiala10) , yet there are little data on national levels of food insecurity. In a 2017 FAO report(11,12) , the prevalence of moderate and severe food insecurity in Finland (8·3 %) was higher than that of any other Nordic country (Sweden, Norway, Denmark, Iceland: moderate and severe food insecurity 5·1–6·7 %) and that of the United Kingdom (5·6 %). According to a 2001 Finnish study examining food insecurity, 11 % of a nationally representative sample reported experiences of running out of money to buy food, 9 % reported fears of running out of food due to economic problems and 3 % had had too little food due to lack of money(Reference Sarlio-Lähteenkorva and Lahelma13).
In Finland, low household income, recent unemployment and economic problems in childhood were all associated with food insecurity(Reference Sarlio-Lähteenkorva and Lahelma13). There are similar findings worldwide, as food insecurity has been found to be a consequence of multiple economic and resource issues such as lower household income(Reference Álvares and Amaral5,Reference Lund, Holm and Tetens7,Reference Henjum, Morseth and Arnold8,Reference Tarasuk, Fafard St-Germain and Mitchell14–Reference Loopstra and Tarasuk16) , lack of assets and savings(Reference Guo17) and income instability(Reference Leete and Bania18,Reference Tarasuk19) . Other vulnerabilities such as receiving disability pensions/benefits(Reference Lund, Holm and Tetens7,Reference Power, Uphoff and Stewart-Knox20) , being a single-parent household(Reference Nelson, Erens and Bates6,Reference Lund, Holm and Tetens7) , having lower education(Reference Neter, Dijkstra and Visser3,Reference Álvares and Amaral5) , being an immigrant or asylum seeker(Reference Henjum, Morseth and Arnold8,Reference Maynard, Dean and Rodriguez21,Reference Tarraf, Sanou, Giroux and Muenstermann22) and renting housing(Reference Tarasuk, Fafard St-Germain and Mitchell14) have also been associated with food insecurity. Food insecurity has also been linked with unhealthy diets(Reference Bocquier, Vieux and Lioret4,Reference Nelson, Erens and Bates6,Reference Lund, Holm and Tetens7,Reference Leung, Epel and Ritchie23) and lower nutrients intake(Reference Kirkpatrick and Tarasuk24). A range of health outcomes have also been linked to food insecurity, including higher mortality(Reference Men, Gundersen and Urquia25,Reference Banerjee, Radak and Khubchandani26) , higher prevalence of chronic conditions such as hypertension(Reference Seligman, Laraia and Kushel27), diabetes(Reference Seligman, Bindman and Vittinghoff28), arthritis and back problems(Reference Tarasuk, Mitchell and McLaren29), mental health problems including depression and stress(Reference Pourmotabbed, Moradi and Babaei30) and mood and anxiety disorders(Reference Tarasuk, Mitchell and McLaren29). Thus unsurprisingly, household food insecurity has also been found to predict increased universal health care utilisation and costs of working-age adults(Reference Tarasuk, Cheng and de Oliveira31).
A vulnerable group in Finland are the workers in the private service sector where many of the characteristics associated with higher risk of in-work poverty accumulate such as part-time employment, immigrant background, low education and being female(Reference Tanner32,Reference Ahrendt, Sándor and Revello33) . Due to the high prevalence of trade union membership in Finland, recruiting participants via trade unions can offer a new way of reaching a hard-to-survey population group. Finland had the fourth highest trade union density of OECD member countries in 2018(34) and according to the Ministry of Economic Affairs and Employment of Finland, the trade union membership rate among private service sector workers was 48 % in Finland in 2017(Reference Ahtiainen35).
Thus, the aim of this study was to inspect the prevalence of food insecurity among private service sector union members in Finland during 2019 and identify the main socio-demographic, economic, health and work-related factors associated with food insecurity. To our knowledge, no food insecurity measure has been validated in Finland before and thus we will also inspect the validity of the food insecurity measurement tool among the private service sector union members in Finland.
Subjects and methods
Study design
The data were collected in collaboration with the Finnish Service Union United (PAM). PAM has almost 210 000 members, 76 % of them women, working in retail trade, property services, security services as well as tourism, restaurant and leisure services(36).
Data were collected during April and May 2019 via an online Study Survey form. The invitation to the study was sent to 111 850 PAM members, that is, to all Finnish-speaking employed, unemployed and retired members who had provided their email address in the PAM member register (student members were excluded) (online supplementary material, Supplement 1). The Study Survey included questions on food insecurity and background characteristics. After this, PAM’s own annual Member Survey, including work-related questions, was similarly sent (May–June 2019) to PAM members (110 833) via email.
Participants were asked for permission to link their survey answers with national register data provided by Statistics Finland for the years 2018–2019. Data obtained from Statistics Finland from 2019 included sex, year of birth, municipality type, region of residence, as well as income and income transfers from 2018.
Participants
The Study Survey was initially answered by 6573 participants (6·5 % of those invited) while the Member Survey was answered by 6528 (6·5 %) participants. Once those who had denied use of their data for study purposes were deleted, erroneous ID were fixed and participants that did not have a national identification number in the background data were deleted, data were available for 6435 for the Study Survey and 6375 for the Member Survey of which 3998 participants had answered both surveys. National register data from the years 2018 and 2019 were available for 6431 and 6421 participants, respectively, of the 6435 who had answered the Study Survey.
Food insecurity
Food insecurity has previously been measured in Finland using the Food Insecurity Experience Scale(11), a collection of questions based on the Edmonton Food Policy Council’s survey(Reference Sarlio-Lähteenkorva and Lahelma13), and a modified version of the Household Food Insecurity Access Scale (HFIAS) among food aid recipients(Reference Erkkola, Uusitalo and Puputti37), all of which measured food insecurity on an individual level. Due to availability of the translated version used and to enable comparison between studies, we selected the modified HFIAS questionnaire for our study.
The HFIAS tool has been developed by the USAID’s Food and Nutrition Technical Assistance project(Reference Coates, Swindale and Bilinsky38) based on a thorough review of the commonalities found across different cultures in qualitative food insecurity studies, thus allowing it to distinguish food insecure from food secure households across different cultural contexts. The HFIAS questionnaire (online supplementary material, Supplement 2) was first translated to Finnish and adapted in cooperation with the Finnish Blue-Ribbon association for a recent study of 129 participants receiving food aid(Reference Erkkola, Uusitalo and Puputti37). As discussed by Coates et al.(Reference Coates, Swindale and Bilinsky38), the concept of ‘household’ is highly context specific and should be defined uniformly for participants. Due to the nature of the participants, many of whom were homeless, the questionnaire was modified to focus on the individual experience of food insecurity due to the fact that ‘household’ may not have been a relevant unit for the participants. The modified questionnaire was then piloted among nine residents of a supported housing service unit for homeless adults. All nine were able to answer the questionnaire well and no modifications were made.
We felt that individual-level measurements were relevant for this study not only to enable comparison with previous research in Finland(11,Reference Sarlio-Lähteenkorva and Lahelma13,Reference Erkkola, Uusitalo and Puputti37) , but also because the HFIAS was administered as an online survey, meaning we could not ensure that the respondent was the person in the household who was most involved with food preparation and meals, as advised by Coates et al. (Reference Coates, Swindale and Bilinsky38). Furthermore, the focus on household-level food insecurity has been questioned as it assumes a standard model where there is one decision-maker who always acts for the benefit of the household, where resources are pooled and where worry about food is a collective experience(Reference Coates, Webb and Houser39). Research has shown that, in reality, power imbalances and differences in domains of responsibility exist within households across the world and resources are not always distributed equitably, nor are experiences of food insecurity the same(Reference Coates, Webb and Houser39,Reference Brunelli and Viviani40) . The experience may differ especially between men and women due to the gendered roles in food acquisition, preparation and providing income to buy food. For example, Coates et al. (Reference Coates, Webb and Houser39) found that nearly one-third of Bangladeshi households were classified into different food security categories using female v. male responses to the questions. Furthermore, O’Connell and Brannen(Reference O’Connell and Brannen41) stated that it is often mothers who go without food to prioritise the needs of children and male partners. Thus, Coates et al. (Reference Coates, Webb and Houser39) and FAO(11) suggest using individual-level food insecurity analyses which will allow inspection of intra-household differences too.
PAM members answered the nine HFIAS questions as part of the online Study Survey, based on which, participants were then categorised as food secure or mildly, moderately or severely food insecure, as instructed by Coates et al. (Reference Coates, Swindale and Bilinsky38). The HFIAS questions ask if participants have experienced issues related to worry about having enough food, limited food quality and limited food quantity and how often (rarely, sometimes, often) they have experienced these issues in the last 30 d. Thus, classification into the different food insecurity categories depends on affirmative answers to certain questions as well as frequency of the experience, as explained by Coates et al. (Reference Coates, Swindale and Bilinsky38).
Background and work-related characteristics
Variables obtained from the Study Survey included self-reported height and weight (used to calculate BMI), highest obtained education level, marital status, household size, number of children under 18 in the household, type of housing, employment status, self-assessed adequacy of income compared with expenses and self-perceived health status. The industry of employment was obtained from the Member Survey. All data were self-reported in the Study and Member Surveys. Variables obtained from national register data provided by Statistics Finland included sex (2019), year of birth from which age was calculated (2019), type of municipality (2019), region of residence (2019), individual earned income in state taxation(42) during the year 2018 and received income transfers(43) during the year 2018.
Analysis
The accuracy of the modified HFIAS tool was evaluated by examining content, construct and criterion validity. Content validity refers to the extent to which the items on a test are representative of the entire domain the test seeks to measure. Thus, we evaluated whether the nine questions of HFIAS covered all aspects of food security in a Finnish context, based on previous literature. Construct validity is the degree to which a tool measures what it is supposed to measure. Thus, we evaluated whether HFIAS has a multidimensional construct and what dimensions of food insecurity it measures in the Finnish context. This was evaluated by factor analysis (rotated principal component analysis) as done in previous studies(Reference Mohammadi, Omidvar and Houshiar-Rad44–Reference Knueppel, Demment and Kaiser46). The factors were computed from the correlation matrix and oblique rotation (Oblimin with Kaiser normalisation) was selected because the different domains of food insecurity may be correlated. The number of factors was determined by the scree plot and those with an eigenvalue > 1. The internal consistency of the scale and domains revealed in the factor analysis of the tool were measured by Cronbach’s α.
Criterion validity measures how well one measure predicts an outcome of another measure. The criterion validity of the HFIAS tool was investigated by looking at whether it distinguished between different socio-demographic groups with established differences in food insecurity such as sex, age, family structure, housing, income, education, living area, marital status and occupation(Reference Lund, Holm and Tetens7,Reference Tarasuk, Fafard St-Germain and Mitchell14,Reference Mohammadi, Omidvar and Houshiar-Rad44) . The associations between the food insecurity levels and socio-demographic variables were assessed with chi-squared tests.
Univariate binary logistic regression was used to explore which individual variables increased the risk of severe food insecurity. Food insecurity was made into a dichotomous variable where the food secure, mildly and moderately food insecure categories were combined and the severely food insecure category was compared with this group. Self-perceived health status and BMI were not investigated due to the uncertainty in causal direction. We also conducted univariate multinomial logistic regressions to see how determinants were associated with the different levels of food insecurity.
Multiple explanatory variables were included into a multivariate binary logistic regression model explaining severe food insecurity to control for confounding and to obtain an adjusted estimate of the magnitude of the associations. The variables included in the model were based on which socio-demographic, economic and work-related variables were found to be associated with an increased risk of severe food insecurity in univariate logistic regression analyses. Income in state taxation was removed due to its collinearity with self-assessed adequacy of household income to cover expenses and the latter was deemed to be a better representation of the participants’ situation in 2019 and a stronger determinant. Received income transfers were removed from the model due to the challenges in interpreting its meaning as it includes a whole range of transfers including earnings-related and national pensions, other social security benefits (e.g. parental allowance) and social allowances (e.g. study grant)(43). Household size correlated with marital status and was thus removed. Employment status was not significant in the model and was removed. The level of statistical significance used was 0·05. The participants with missing data on sex, age and education were excluded from the model. However, the participants with missing data on employment industry were included, due to there being so many (56 %). All statistical analyses were performed using the Statistical Package for the Social Sciences statistical software package version 27 (SPSS Inc.).
Results
Validity of the Household Food Insecurity Access Scale measure
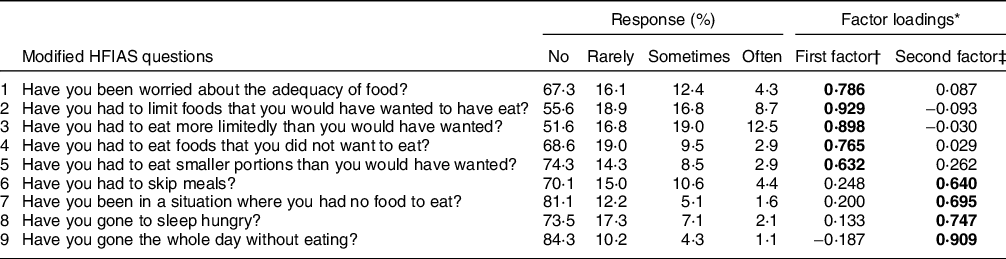
The questions (1–3) related to milder forms of food insecurity received the most affirmative answers and the questions (7–9) relating to more severe levels of food insecurity received the most negative answers though the trend was not entirely consistent (e.g. questions one and six) (Table 1). The factor analysis of the nine HFIAS questions revealed two factors which explained 56·3 and 12·4 % of the total variance, respectively (Table 1). The first factor had high loadings on questions one to five reflecting a less severe form of food insecurity, while questions six to nine loaded onto the second factor, reflecting a more severe form of food insecurity (lacking food in quantity).
Finnish Service Union United members’ response rates to each HFIAS question and each question’s factor loadings, 2019
HFIAS, Household Food Insecurity Access Scale.
* Factor analysis (rotated principal component analysis), Kaiser–Meyer–Olkin measure of sampling adequacy = 0·912, factor loadings greater than 0·6 are indicated in bold font.
† Eigenvalue = 5·071.
‡ Eigenvalue = 1·119.
Cronbach’s α of the scale was 0·899 which indicated good internal consistency. The subscales had satisfactory internal consistency too as Cronbach’s α for the first factor was 0·888 and 0·816 for the second factor.
Participants’ characteristics
The food security levels were calculated for 6435 participants, but socio-demographic and work-related details were not available for all participants. The majority of the participants were women (80 %), and the mean age of all participants was 44 years (sd 12·7 years) ranging from 17 to 83 years (Table 2). Most participants had completed upper secondary school, vocational education, obligatory education or less as their highest level of education (83 %). Being married or cohabiting were the most common situations and correspondingly most people lived with at least one other person. The majority of participants did not have any children under 18 years in their households (68 %). Over half of the participants lived in housing they owned (57 %) and the majority lived in urban areas (74 %). The region of residence was obtained for 6421 participants and they were spread out across all nineteen Finnish regions, the majority residing in Uusimaa (capital city region) (23 %), Pirkanmaa (Tampere region) (11 %), Southwest Finland (10 %) and Northern Ostrobothnia (8 %).
The associations of socio-demographic and health-related variables with food insecurity among Finnish Service Union United members, 2019
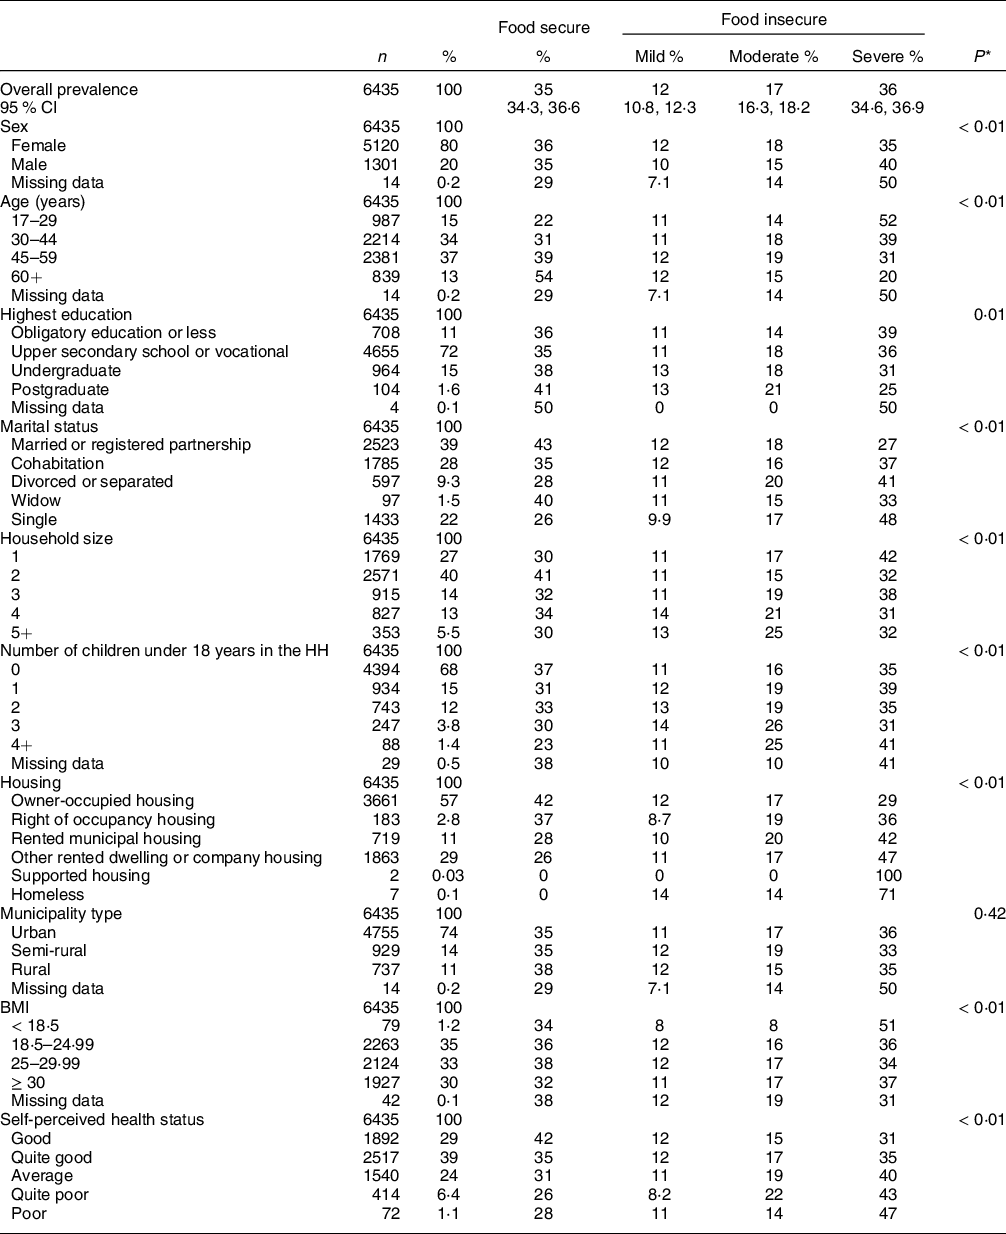
HH, household.
* Chi-squared test
The majority of the participants were employed (70 %) and the mean earned income in state taxation was 2043 €/month (sd 746 €/month) ranging from 0 to 7450 €/month (Table 3). Employment industry was obtained for 44 % of the participants. Of those who replied, the majority worked in the retail industry (50 %), followed by those in hospitality (20 %) and then those in property maintenance (12 %). One-third of the participants received minimal (0–9 €/month) income transfers from the government, while the rest received 10–5701 €/month, the overall median being 200 €/month.
The associations of economic and work-related variables with food insecurity among Finnish Service Union United members, 2018–2019
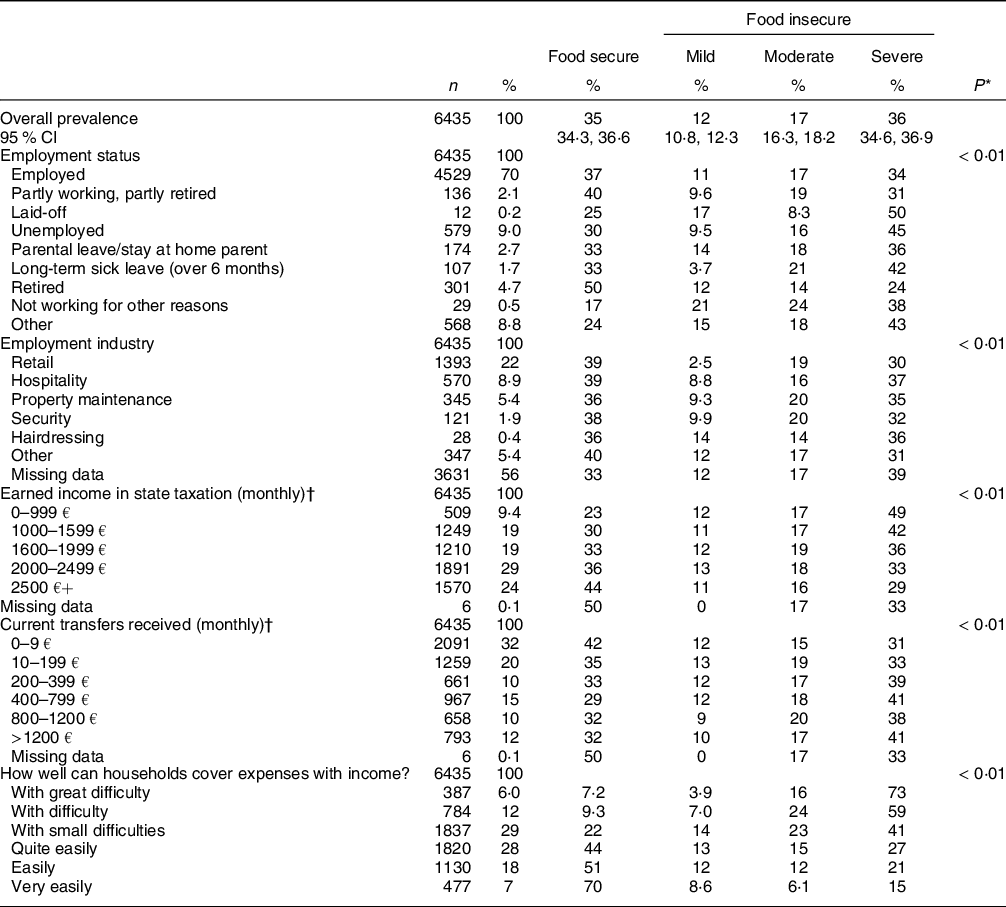
* Chi-squared test.
† Data from 2018, all other data from 2019.
Prevalence and determinants of food insecurity
Of the 6435 respondents, over a third (36 %) were severely food insecure, 29 % were mildly or moderately food insecure and a third (35 %) were food secure (Table 2). Tables 2 and 3 present the distribution of food insecurity status by socio-demographic, health, economic and work-related variables. All variables apart from municipality type were associated with food insecurity levels.
Explanatory variables of severe food insecurity in binary logistic analysis
In the univariate binary logistic regression analyses, being able to cover household expenses ‘with great difficulty’ and being young increased the probability of severe food insecurity markedly (online supplementary material, Supplements 3–4). Of the socio-demographic variables being single, divorced/separated or cohabiting, renting housing (or supported housing or being homeless), low educational level, a household size of one and three and being male increased the risk of being severely food insecure (online supplementary material, Supplement 3). Neither the number of children under 18 years in the household nor municipality type was associated with an increased risk of severe food insecurity. Of the economic and work-related variables, low income, high levels of income transfers from the government, being unemployed or laid off and working in hospitality and property maintenance also increased the probability of being severely food insecure (online supplementary material, Supplement 4).
Explanatory variables of food insecurity levels in multinomial logistic analysis
In the univariate multinomial logistic regression analyses, the same determinants increased the risk of mild and moderate food insecurity as for severe food insecurity, apart from the following instances. Being male, having low education, being unemployed or laid off and working in hospitality did not increase risk of mild or moderate food insecurity (data not shown). In the binary analysis, having children under the age of 18 years was not associated with severe food insecurity. However, in the multinomial analysis, having children was associated with increased risks of mild, moderate and severe food insecurity: having any number of children, especially having three or more (compared with having none), increased the risk of mild and moderate food insecurity, whereas only having one child (compared with having none) increased the risk of severe food insecurity. Similarly, almost all family sizes (compared with a family size of two) increased the risk of mild and moderate food insecurity with large family sizes appearing to increase the risk the most in the multinomial model. A family size of five or more increased the risk of severe food insecurity in the multinomial model, as well as the family sizes of one and three also identified in the original binary logistic regression analysis. All levels of income transfers (compared with receiving 0–9 €/month) were associated with an increased risk of moderate and severe food insecurity, but only lower levels (10–199 and 400–700 €/month) were associated with an increased risk of mild food insecurity.
Explanatory variables of severe food insecurity in multivariate binary logistic model
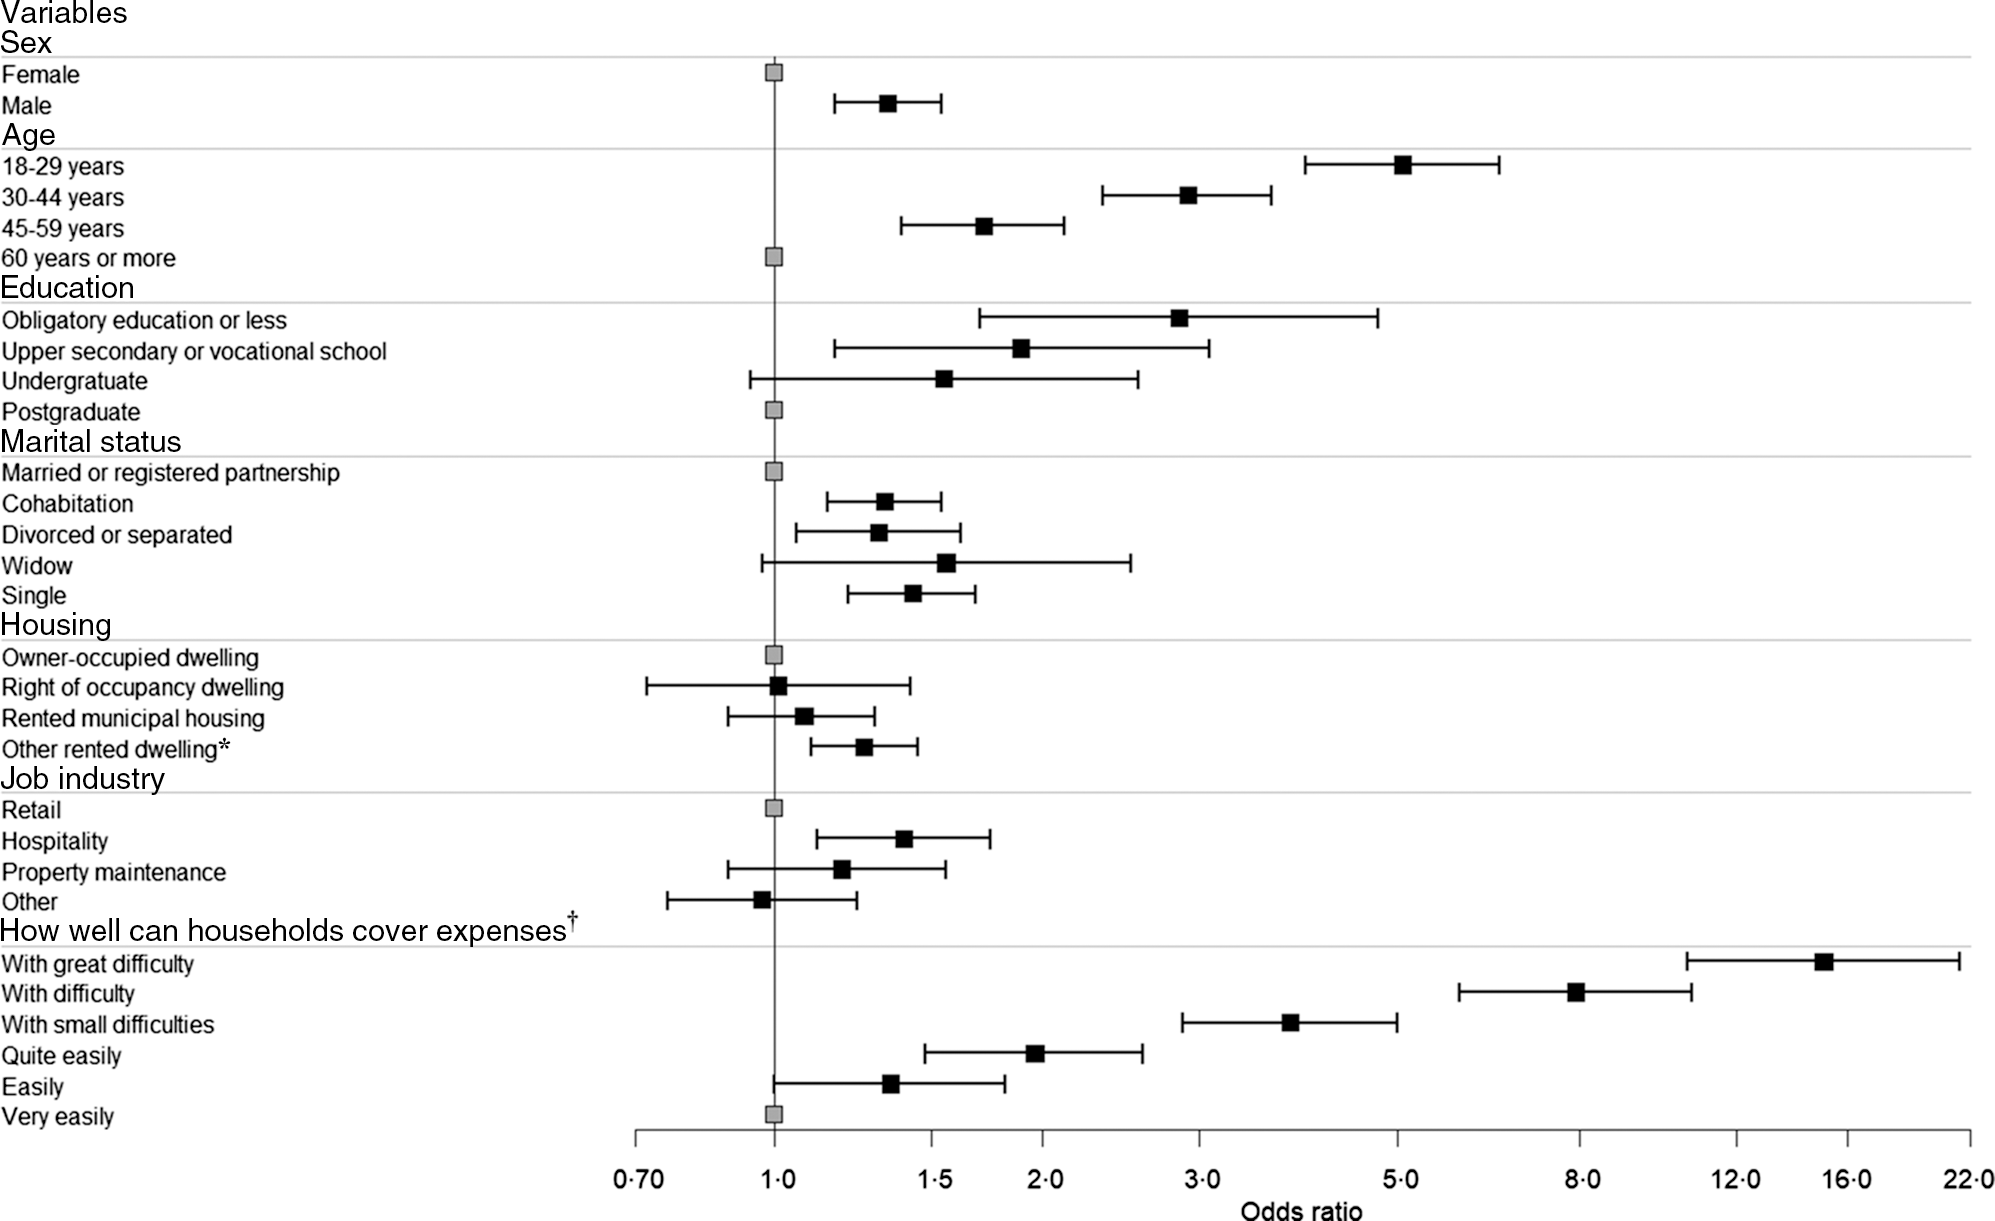
In the multivariate binary logistic regression model, being able to cover household expenses ‘with great difficulty’ and young age (18–29 years) retained their effect, markedly increasing the probability of severe food insecurity by 15- and 5-fold, respectively (Fig. 1). This is evident from the fact that 73 % of those ‘with great difficulty’ in covering expenses were severely food insecure, whereas 15 % of those who could ‘very easily’ cover expenses were severely food insecure (OR 15·05; 95 % CI 10·60, 21·85) (online supplementary material, Supplement 5). Half (52 %) of those in the youngest age bracket (18–29 years) were severely food insecure, while only a fifth (20 %) of those in the oldest age bracket (60+ years) were severely food insecure (OR 5·07; 95 % CI 3·94, 6·52). Having low education (OR 2·85; 95 % CI 1·70, 4·76), being single (OR 1·43; 95 % CI 1·21, 1·75), working in hospitality (OR 1·40; 95 % CI 1·12, 1·75), being male (OR 1·34; 95 % CI 1·17, 1·54) and living in rented housing (including company or supported housing or being homeless) (OR 1·24; 95 % CI 1·07, 1·43) also increased the risk of severe food insecurity.
OR and CI for variables included in adjusted model explaining severe food insecurity among Finnish Service Union United members, 2019. P < 0·015 for all variables in the model, n 6417, Nagelkerke R 2 = 22 %. *Includes: other rented dwelling, company housing, supported housing and homeless. †Full question: How well can household cover expenses in comparison with income
Discussion
The findings indicated that almost two-thirds of the private service sector workers were food insecure to some extent with over a third being severely food insecure. There are limited studies on the associations between individuals’ food insecurity levels and socio-demographic determinants, as most studies have looked at household-level food insecurity. However, the FAO worldwide study(Reference Grimaccia and Naccarato47) of 147 countries measured individual-level food insecurity using the Food Insecurity Experience Scale and compared country clusters. Similar to our results, they found that for the second cluster of ‘Rich and developed countries’ (including Finland), living without a partner (being single, widowed or divorced) and having a lower education level were associated with food insecurity. However, they found that sex was not significant in the second cluster, but in the first cluster of ‘Very rich and developed countries mainly outside Europe’, men were at more risk of food insecurity. Based on these comparisons, our results reflect decent criterion validity.
The HFIAS is designed to measure the three main domains found to constitute the household food insecurity experience: anxiety and uncertainty about the household food supply (question 1), insufficient quality (questions 2–4) and insufficient food intake and its physical consequences (questions 5–9). Arguably these domains are specific for household food insecurity(Reference Coates, Frongillo and Rogers48); however, Radimer et al.(Reference Radimer, Olson and Campbell49) reported individual hunger to comprise four major components including intake insufficiency (a problem of intake quantity), diet inadequacy (a problem of intake quality) and disrupted eating patterns (not eating the three meals per day typical in high-income countries). The fourth, psychological, component was whether the person felt deprived and/or without eating choices. HFIAS covers the first two components mentioned. Furthermore, questions about having to skip meals or go a day without eating reflect the third component. The first question in HFIAS about worry reflects the fourth component to some extent. In addition, the Food Insecurity Experience Scale measure used on an individual level has been built on the research that informed HFIAS and contains very similar questions on worry and inadequate quality and quantity of food(50,51) .
To our knowledge, no factor analysis has been conducted on individual-level food insecurity measurement tools; hence, we can only make comparisons with studies that use the original household-level HFIAS. The factor analysis revealed two factors of milder and severer food insecurity somewhat reflecting two of the food insecurity domains (insufficient food quality and insufficient food quantity). The two factors explained 68·8 % of the variance similarly to previous studies(Reference Mohammadi, Omidvar and Houshiar-Rad44–Reference Knueppel, Demment and Kaiser46). As in previous studies(Reference Mohammadi, Omidvar and Houshiar-Rad44,Reference Naja, Hwalla and Fossian45) , we found that the anxiety and uncertainty domain did not appear as a separate construct of food insecurity, but rather as part of the ‘milder food insecurity’ factor. We found the fifth question (‘have you had to eat smaller portions than you would have wanted?’) also loaded onto the first factor (milder food insecurity), though it is part of the ‘insufficient food quantity’ domain. Our results were similar to those of the studies using household-level food insecurity measures(Reference Mohammadi, Omidvar and Houshiar-Rad44–Reference Knueppel, Demment and Kaiser46); however, more research is needed to understand the differences between the content and constructs of individual and household food insecurity.
The prevalence of food insecurity was higher in this study compared with the previous nationally representative studies conducted in Finland(11,Reference Sarlio-Lähteenkorva and Lahelma13) , but lower than that found among Finnish food aid recipients(Reference Erkkola, Uusitalo and Puputti37). This is in line with what can be expected, as many of the food aid recipients were unemployed and homeless, whereas, compared with the general population, our study sample had lower education and income levels(52,53) . Furthermore, Lund et al.(Reference Lund, Holm and Tetens7) found that interviews conducted via the internet more than doubled the prevalence of low/very low food security compared with computer-assisted telephone interviews. This may be due to people downplaying the severity of food insecurity to maintain social desirability. Face-to-face interviews and computer-assisted telephone interviews were used in the previous studies in Finland(12,Reference Sarlio-Lähteenkorva and Lahelma13) , whereas in this study, the participants answered the survey online.
A weakness of this study is the low response rate, which raises questions about how representative the sample is. Based on statistics provided via email by PAM (A Veirto, Research Manager, personal communication, 29 November 2021), at the end of 2019, PAM had a slightly higher percentage of male members compared with the percentage in our study (online supplementary material, Supplement 6). Furthermore, the youngest age groups (under 31 years) and oldest (over 60 years) were under-represented in our study, which is partly not unexpected as student members were not surveyed. Of the 2804 (44 %) participants for whom the employment industry category was available, the percentages of participants working in retail, hospitality and security were very similar. Property maintenance was slightly under-represented, and the ‘Others’ group was over-represented. During 2019, 7 % of PAM members had listed their first language as other than Finnish and thus the survey was not sent to them. Hence, our study sample may not be completely representative of all PAM members, but it seems that Finnish-speaking non-student members were reasonably well captured. Because severe food insecurity was more common among men and young age groups in our study, and among immigrants in other studies(Reference Maynard, Dean and Rodriguez21,Reference Tarraf, Sanou, Giroux and Muenstermann22) , it would seem more likely that the levels of food insecurity in this study were underestimates rather than overestimations of food insecurity levels in all PAM members. Furthermore, the fact that response rates are often lower among people of lower socio-economic status(Reference Tolonen, Helakorpi and Talala54) and food insecurity is higher among groups of lower socio-economic status further supports this interpretation. Moreover, trade union membership is lower among young people, men, the unemployed and those in part-time or fixed term contracts(Reference Ahtiainen35) indicating that food insecurity may be even more prevalent among non-PAM members working in the private service sector.
Nevertheless, the multivariate model provides an adjusted estimate of the magnitude of the associations and can be used to indicate which groups within PAM members are at highest risk of being severely food insecure. Interestingly employment status was not significant in the model, possibly highlighting that work needs to be adequately compensated(Reference Silvasti, Tikka, Lambie-Mumford and Silvasti9,Reference Tanner32,Reference Kangas and Kalliomaa-Puha55) . Alternatively, it could mean that the unemployed, laid-off and those on sick leave have adequate incomes to protect them from severe food insecurity considering most PAM union members would be on earning-related daily allowances rather than on basic social security. The latter has been found to be inadequate in covering reasonable minimum costs in Finland(56). It must also be considered that the large majority of the participants were employed and that the unemployed, laid off and other groups may have been too small in size to be able to detect any statistically significant differences.
Respondents working in hospitality had a higher risk of severe food insecurity compared with retail workers. The number of young employees and employees with low educational level are especially emphasised in the restaurant and cleaning industries, respectively(Reference Tanner32). Jobs in the private service sector are characterised by part-time work, zero-hour and temporary contracts, and subcontracted work, especially in the hospitality industry(Reference Tanner32). Low work-intensity groups (those in part-time or temporary work) are experiencing increasingly higher poverty rates(Reference Kangas and Kalliomaa-Puha55) which are only expected to increase further due to the breakdown of collective agreements(Reference Savolainen57,Reference Teivainen58) and the increasingly insufficient basic social security(56,Reference Tuulia, Aho and Mustonen59) that the United Nations Committee on Economic, Social and Cultural Rights and the European Committee of Social Rights has warned Finland of(60,61) . Historically, in-work poverty has been comparatively low in Finland compared with other European countries due to the once relatively generous income transfer system resulting in the government essentially subsidising the inadequate incomes paid by the private sector(Reference Tanner32,Reference Kangas and Kalliomaa-Puha55) . Thus, one policy measure should be to ensure employers provide employees with adequate salaries and better contracts, especially paying attention to industries employing young and low education status groups, considering their increased risk of severe food insecurity. Furthermore, the adequacy of social security must be improved(Reference Tuulia, Aho and Mustonen59). Considering the proportion of household expenditure spent on housing in all EU countries was highest in Finland(62), providing more affordable housing, especially for those living alone, could also ensure improved livelihood as emphasised by the fact that rented housing was a risk factor for severe food insecurity. However, causality cannot be assumed from this study and renting may simply be associated with low wages and a lower socio-economic status.
Another alternative policy option to social security is universal basic income. A Finnish trial found that the basic income recipients’ perceptions of economic and health-related well-being and income were significantly better than that of the control group(Reference Kangas, Jauhiainen and Simanainen63,Reference Kangas, Jauhiainen and Simanainen64) . The recipients experienced significantly fewer problems related to health, stress and ability to concentrate(Reference Kangas, Jauhiainen and Simanainen63). They also had less issues with maintaining livelihood and reported themselves more happy(Reference Kangas, Jauhiainen and Simanainen64). This is relevant, as our results indicated that worse self-perceived health was associated with food insecurity.
Self-rated health has previously been found to be a strong predictor of mortality as well as associated with the number of physician contacts per year in Finnish populations(Reference Heistaro, Jousilahti and Lahelma65,Reference Miilunpalo, Vuori and Oja66) . Considering this and that food insecurity has been associated with multiple negative health outcomes in previous studies such as hypertension(Reference Seligman, Laraia and Kushel27), diabetes(Reference Seligman, Bindman and Vittinghoff28), arthritis and back problems(Reference Tarasuk, Mitchell and McLaren29), it is extremely worrying that over a third of the participants were severely food insecure and only a third were food secure. The association of BMI with food insecurity also highlights the seriousness of the situation people are facing. This could have major consequences for public health, for example, a Canadian study found that annual health care costs were 76 % higher in households with severe food insecurity compared with food-secure households(Reference Tarasuk, Cheng and de Oliveira31). Additionally, mental health problems have been found to be associated with food insecurity(Reference Tarasuk, Mitchell and McLaren29,Reference Pourmotabbed, Moradi and Babaei30) and they are also the main cause of premature retirement on a disability pension in Finland(67).
There is a lack of reliable data and understanding of the extent of food insecurity and related public health implications in Finland to tackle the problem(Reference Placzek68). Our study focused on severe food insecurity, but it is important to understand the risk factors for mild and moderate food insecurity too, especially considering families with many children were at increased risk. Nevertheless, our findings show that food insecurity is a widespread issue among private sector service workers. The precariousness of employment, which can be seen in temporary contracts and jobs without a living wage, has increased in-work poverty(Reference Silvasti, Tikka, Lambie-Mumford and Silvasti9,Reference Tanner32) . This has resulted in the need for food charity, highlighting that food insecurity is a problem faced by many working people(Reference Silvasti, Tikka, Lambie-Mumford and Silvasti9,Reference Salonen, Ohisalo and Laihiala10) . The Finnish Ministry of Social Affairs and Health is supporting charitable food aid financially, which is distributed by an unorganised and unregulated sector with unclear conditions(Reference Silvasti, Tikka, Lambie-Mumford and Silvasti9,Reference Skön69,Reference Skön70) , to help citizens fulfil their basic needs. This is in direct contradiction to Finland identifying as a Nordic welfare state(Reference Silvasti, Tikka, Lambie-Mumford and Silvasti9,Reference Salonen, Ohisalo and Laihiala10) . Finland along with other high-income countries should start monitoring food insecurity nationally on a regular basis, especially among vulnerable sections of the population.
Acknowledgements
Acknowledgements: We thank the Finnish Service Union United (PAM) for the collaboration and Service Union United members who completed the questionnaires used in the study. Financial support: This work was funded by The Finnish Work Environment Fund (ME grant number 210173) and Finnish Service Union United (PAM). Open access funded by Helsinki University Library. The funders had no role in study design, analysis or writing of this article. Conflict of interest: There are no conflicts of interest. Authorship: J.N., T.S., L.U., O.R. and M.E. were responsible for the conception and funding acquisition for the work; J.N. and M.E. designed and lead the work; H.M.W., J.N., T.N. and M.E. were responsible for acquisiton of data; H.M.W., J.N. and M.E. designed the statistical analysis; H.M.W. carried out analyses and drafted the manuscript; all authors reviewed and approved the final manuscript. Ethics of human subject participation: This study was conducted according to the guidelines laid down in the Declaration of Helsinki, and all procedures involving research study participants were approved by the The University of Helsinki Ethical Review Board in the Humanities and Social and Behavioral Sciences. Written informed consent was obtained from all participants.
Supplementary material
For supplementary material accompanying this paper visit https://doi.org/10.1017/S1368980022000209


 Open access