


Recent scholarship on American political behavior has focused on strongly partisan Democrats and Republicans who express opposing views and disdain for one another (e.g., Abramowitz and Webster Reference Abramowitz and Webster2016; Hetherington and Rudolph Reference Hetherington and Rudolph2015; Iyengar et al. Reference Iyengar, Lelkes, Levendusky, Malhotra and Westwood2019; Mason Reference Mason2018; Martherus et al. Reference Martherus, Martinez, Piff and Theodoridis2019). In this research, moderates, independents, and centrists have received less attention. Although Fiorina, Abrams, and Pope (Reference Fiorina, Abrams and Pope2005) note that most Americans hold a mix of liberal and conservative positions on issues and Hill and Tausanovitch (Reference Hill and Tausanovitch2015) find no increase in the share of Americans with extreme policy ideologies from the 1950s to the 2010s, many have focused on understanding citizens at the ends of the ideological spectrum to the exclusion of those in the middle.
To the extent moderates have been discussed by political scientists, they are often described as politically unsophisticated, uninformed, or ideologically innocent (Freeder, Lenz, and Turney Reference Freeder, Lenz and Turney2019; Kinder and Kalmoe Reference Kinder and Kalmoe2017); secretly partisan (Dennis Reference Dennis1992); ideologically cross-pressured (Treier and Hillygus Reference Treier and Hillygus2009); or extreme, with patterns of attitudes poorly described by a single ideological dimension (Broockman Reference Broockman2016).
Measuring the nature and prevalence of centrist positions is difficult because different patterns of opinion can produce the appearance of ideological moderation. For example, if an opinion survey asks only one binary policy question, we can only classify respondents into three types, support, oppose, or missing. If we ask two binary policy questions, it is difficult to know whether the respondents who give one liberal response and one conservative response actually hold centrist views, lack meaningful political opinions, aren’t paying attention to the survey questions, or hold legitimate political attitudes that are not well summarized by a liberal–conservative dimension.
In this paper, we develop and estimate a statistical model to study the middle of the ideological distribution. Our model sorts survey respondents who are traditionally classified as moderate into three separate groups: those who have genuinely centrist views that are well summarized by a single underlying ideological dimension, those who are inattentive to politics or our survey, and those who hold genuine views that are not well summarized by a single ideological dimension. Our mixture model uses response patterns to multiple policy questions to classify each survey respondent as one of the three types.
Our results clarify the importance of nonideologues in American elections. First, we find that a large proportion of the American public is neither consistently liberal nor consistently conservative but that this inconsistency is not because their views are simply random or incoherent. Instead, we estimate that many of those who give a mix of liberal and conservative responses hold genuine views in the middle of the same dimension of policy ideology that explains the views of consistent liberals and consistent conservatives. However, a smaller number of survey respondents—but an important and compelling group—give a mix of liberal and conservative views that are not well described by the liberal–conservative dimension. Fewer still appear to be answering policy questions as though they were guessing or not paying attention.
Second, moderates appear to be central to electoral change and political accountability. The respondents we classify as moderate are more responsive to features of the candidates contesting elections than lever-pulling liberals and conservatives. We estimate that their vote choices in U.S. House elections are four to five times more responsive to the candidates’ ideologies than are the choices of liberals and conservatives, two to three times more responsive to incumbency, and two to three times more responsive to candidate experience.
These findings help resolve a puzzle. Research on aggregate electoral behavior (e.g., Ansolabehere, Synder, and Stewart Reference Ansolabehere, Snyder and Stewart2001; Canes-Wrone, Brady, and Cogan Reference Canes-Wrone, Brady and Cogan2002; Hall Reference Hall2015; Tausanovitch and Warshaw Reference Tausanovitch and Warshaw2018) shows that candidates benefit electorally from ideological moderation, yet many studies conclude that vote choices are highly partisan. We find that the moderate subset of the electorate responds to moderation and to candidate experience. As the old saying goes, ideologues may vote for a “blue dog” as long as that dog shares their views. But, the moderates in our analyses seem to care that the candidate is, in fact, a dog.
Because our results depend upon the mixture model we have developed, we present three analyses to demonstrate the face validity of our estimates. First, we show that responses to a pair of minimum wage policy questions are consistent with what one should expect were our model differentiating respondents as intended. In Appendix C, we generalize this minimum wage analysis using all question pairs in a dataset with 133 policy questions. Second, we use questions not included in our estimation to show that our classifications predict the likelihood of giving extreme liberal or extreme conservative responses. Third, we show that rates of support across different policy questions vary across our classifications as one would expect were the model differentiating respondents with views that are well described by a single dimension from those with idiosyncratic preferences and those inattentive to the survey.
We present the validity analyses and several descriptive results first before turning to questions about electoral selection and accountability. Taken together, our analyses contribute to the understanding of elections and public opinion and highlight the electoral importance of nonideologues. We also hope that the continued application and adaptation of our measurement model will further improve our understanding of public opinion and voting behavior.
Background
Recent literature in political behavior and psychology gives the impression that many Americans identify strongly with political parties and political ideologies. Yet when asked in opinion surveys, roughly one in three typically self-identify as moderate and one in three as politically independent.Footnote 1 Some scholars argue that these self-identified moderates and independents are actually closet partisans, noting that they lean toward one party or another when nudged (Dennis Reference Dennis1992; Keith et al. Reference Keith, Magleby, Nelson, Orr, Westlye and Wolfinger1992). Others argue that because self-identified moderates are, on average, less educated, less informed, and less politically active, we should think of them as having no ideology (Kinder and Kalmoe Reference Kinder and Kalmoe2017).
Instead of asking people to report their own ideology, other scholars assess ideology by aggregating responses to many questions on policy views (e.g., Ansolabehere, Rodden, and Snyder Reference Ansolabehere, Rodden and Snyder2006; Reference Ansolabehere, Rodden and Snyder2008; Tausanovitch and Warshaw Reference Tausanovitch and Warshaw2013). These studies find that many people give a mix of liberal and conservative policy responses and conclude that the policy views of most Americans fall somewhere between the platforms of the major parties (e.g., Bafumi and Herron Reference Bafumi and Herron2010).
One limitation to methods that aggregate across multiple policy items is that there are different ways for an individual set of responses to appear moderate. People who are genuinely middle of the road on most issues will be classified as moderates because they will give a mix of liberal and conservative responses on varying issues. For these genuine moderates, the pattern of responses will be predictable depending on how questions are asked and with what response options. For example, if genuine moderates were asked whether they would like to raise the federal minimum wage to $20/hour, they might give a “conservative” response opposing such a policy, whereas if they were asked whether they would like to lower the federal minimum wage to $5/hour, they might give the “liberal” response opposing such a policy.
But there are other kinds of individuals whose pattern of responses might also appear moderate after aggregation. For example, one might hold genuinely liberal and extreme positions on some issues and genuinely conservative and extreme positions on others. Such an individual, whom we would not classify as moderate, would give a mix of liberal and conservative responses and might be scored as a moderate just as a genuine centrist.
Still further problems arise if some survey respondents are simply inattentive, giving meaningless responses, perhaps because they’re not paying attention to the survey or because they lack meaningful opinions (e.g., Zaller and Feldman Reference Zaller and Feldman1992). These people may likewise be inaccurately classified as moderates because they express a mix of liberal and conservative positions.
How serious a problem is this inability to disentangle different types of people who may get classified as moderates? Recent evidence suggests that there are many conflicted individuals with extreme views across issues poorly described by a single dimension of ideology (Ahler and Broockman Reference Ahler and Broockman2018; Broockman Reference Broockman2016). Other research suggests a need to account for considerable heterogeneity among respondents in their patterns of survey responses (Baldassarri and Goldberg Reference Baldassarri and Goldberg2014; Lauderdale, Hanretty, and Vivyan Reference Lauderdale, Hanretty and Vivyan2018). What can be done, if anything, to better understand the composition of this significant group of Americans?
In this paper, we attempt to decompose apparent moderates into these three theoretical types by leveraging differences in patterns of survey responses. With enough policy items, the response patterns of genuine centrists will be more predictable than will the response patterns of those who are inattentive or those who have idiosyncratic views. To estimate the distribution of these three types using sets of response patterns to policy questions on different political surveys, we develop and implement a new mixture model that builds on methods developed in the field of educational testing (e.g., Birnbaum Reference Birnbaum, Lord and Novick1968).
Data and Measurement Model
Our method builds on the conventional item-response theory (IRT) framework, which estimates a model of policy positions that arise from an underlying dimension of ideology (e.g., Clinton, Jackman, and Rivers Reference Clinton, Jackman and Rivers2004). Instead of estimating an ideological location for each respondent as in the standard model, we estimate a mixture model where each respondent’s pattern of responses is classified as coming from one of our three types. Among those whom we classify as best described by the spatial model, we can calculate a most-likely ideal point given their pattern of responses. However, the model does not use an individual ideal point when classifying each response pattern.
By embedding a conventional IRT model within a mixture model of survey responses, we estimate, for each respondent, a probability of being in each of three categories given their pattern of responses to the survey questions. Because no one has probability zero of having preferences consistent with the spatial model, we also calculate an a posteriori liberal–conservative ideology score for every respondent. Thus, our procedure gives us two substantively important quantities for each respondent: first, a trio of probabilities that responses come from (1) a spatial type, (2) an unsophisticated type, or (3) someone whose preferences are neither unsophisticated nor well summarized by the spatial model and, second, an ideology score on the liberal–conservative dimension were the respondent to be a spatial type (#1 above). Both quantities are important in helping us decompose and understand public opinion.
Data
To estimate the IRT mixture model and classify individuals into these three types, we need data on policy positions across a range of issues for which people hold both liberal and conservative positions.
Our Monte Carlo simulations and out-of-sample tests reveal that we need at least 20 policy questions per respondent in order to obtain reliable estimates of type probability and ideal point (see Appendix B for details). Unfortunately, this means that we cannot apply our method to many political surveys of scholarly interest, such as those analyzed by Broockman (Reference Broockman2016).
Over the last decade or so, the Cooperative Congressional Election Study (CCES) has asked respondents an unusually large battery of policy questions. Therefore, we use data from all CCES common content surveys between 2012 and 2018, which include more than 280,000 respondents. We also analyze data from a 2010 CCES module (Stanford Team 3), which asked 133 different policy questions to 1,300 different respondents. Although the sample size of this module is small, the sheer number of policy questions allows us to more confidently characterize the positions of these respondents.
We focus on binary policy questions that are most easily accommodated in a statistical model. For example, many CCES questions ask respondents whether they support or oppose a particular policy or reform. If a policy question has multiple responses that are logically ordered, we turn it into a binary question by coding an indicator for whether a respondent’s preferred position is above or below a particular cutoff.Footnote 2 Therefore, each observation of our dataset is a respondent-question, where each respondent took one of two possible positions on each question.
Three Types of Respondents
Inspired by the literature on political preferences, we seek to classify respondents into three possible types. We note that these are stylized categories. No individual’s policy positions will be perfectly described by an abstract model. However, to the extent that responses can be best explained and predicted by these different models of behavior, we hope to assess the substantive relevance of competing accounts in the literature. These classifications help us understand for whom and to what extent issue positions are meaningful and/or well-described by an underlying ideological dimension. Our model makes no a priori assumptions about the proportions of each type in the population.
Spatial or “Downsian” Respondents
We refer to the first type of individuals as Downsians because of their relationship to the voters described in Downs (Reference Downs1957). These individuals have preferences across policy questions that are well approximated by an ideal point on an underlying liberal–conservative ideological dimension (e.g., Bafumi and Herron Reference Bafumi and Herron2010; Hare Reference Hare2021; Jessee Reference Jessee2012; Tausanovitch and Warshaw Reference Tausanovitch and Warshaw2013). We anticipate that there will be many liberal and conservative Downsians. Of greater interest here are moderate or centrist Downsians. Moderates will sometimes give liberal answers to policy questions and sometimes conservative answers, but the pattern of responses for Downsian moderates will be well described by the same left–right dimension that explains responses of liberal and conservative Downsians.Footnote 3 In Appendix D, we present estimates from a two-dimensional model allowing Downsians to have two ideal points, one for each dimension.
We emphasize that a respondent need not literally conform to the Downsian model for our method to conclude that their positions are best described by this model. Indeed, we suspect that nobody answers policy questions by first recalling their ideological score and then mapping it onto the question, nor do we suspect that many people can articulate the ways in which their underlying values affect their positions across a range of issues. Nevertheless, it might be the case that the best way to predict and understand the policy positions of many individuals is by thinking of those individuals as having an underlying ideology that influences their positions across many political issues.
Furthermore, we should emphasize that our Downsian model allows for idiosyncratic variation in the way each individual answers each question. Previous research finds, for example, that we can better predict a respondent’s policy position by using their response to the same question in the past than we can if we use their average ideology based on other responses (Lauderdale, Hanretty, and Vivyan Reference Lauderdale, Hanretty and Vivyan2018). Similarly, experimental manipulation of a respondent’s position on one question does not systematically appear to influence their position on other ideologically related questions (Coppock and Green Reference Coppock and Green2022). These studies demonstrate the existence of idiosyncratic variation in policy positions on single issues. Even so, the spatial model may better summarize one’s full portfolio of issue positions relative to an alternative model.
Unsophisticated or “Inattentive” Respondents
A second set of respondents might choose responses to issue questions in an unsophisticated or meaningless way. Knowing how they answered one policy question will not help us predict how they answered other policy questions. We call these people inattentive respondents because it appears as though they might not have policy preferences and therefore answer policy questions as if at random. Other respondents might be inattentive to the survey and select responses that do not necessarily coincide with their actual policy positions. For these respondents, the mix of liberal and conservative responses they give to survey questions does not reflect any stable feature of their preferences.
Idiosyncratic, Unconstrained, or “Conversian” Respondents
Unlike inattentives, the third set of respondents has expressed genuine positions. But, unlike Downsians, their positions are poorly explained by an underlying left–right ideology. That is, their responses appear to be neither as-if generated at random nor following a pattern that is well summarized by an underlying liberal–conservative orientation. We call these individuals Conversians because they lack views that are well explained by a single-dimensional model, as in the argument made by Philip Converse that as “we move from the most sophisticated few … the organization of more specific attitudes into wide-ranging belief systems is absent” (Converse Reference Converse and Apter1964, 30). These individuals might care about only a few issues (Hill Reference HillForthcoming) or might hold genuine preferences on multiple issues that are an idiosyncratic mix of liberal and conservative preferences (Broockman Reference Broockman2016). Perhaps they support higher taxes to fund Social Security but believe the Medicare program should be repealed and are opposed to government regulation of business. These respondents are compelling in that they may not fit neatly within the confines of one of the two major parties. Their size and cross-pressure on issues makes them potentially important to election outcomes.
Our model of Conversian respondents is flexible and requires no assumptions about the logical or ideological connections between issues. In a sense, we can think of the Conversians as a category for the set of respondents who are giving neither a pattern of answers that is well explained by the spatial model nor a pattern that appears devoid of meaning.
A Simplified Example
To provide intuition for our subsequent statistical procedure and estimates, we present example patterns of survey responses for each of our three types. In Table 1, we consider a setting where individuals have reported their preference on each of three independent binary policy issues. Individuals support either the liberal (L) or conservative (C) position on each issue.
Downsian versus Non-Downsian Response Patterns with Deterministic Voting
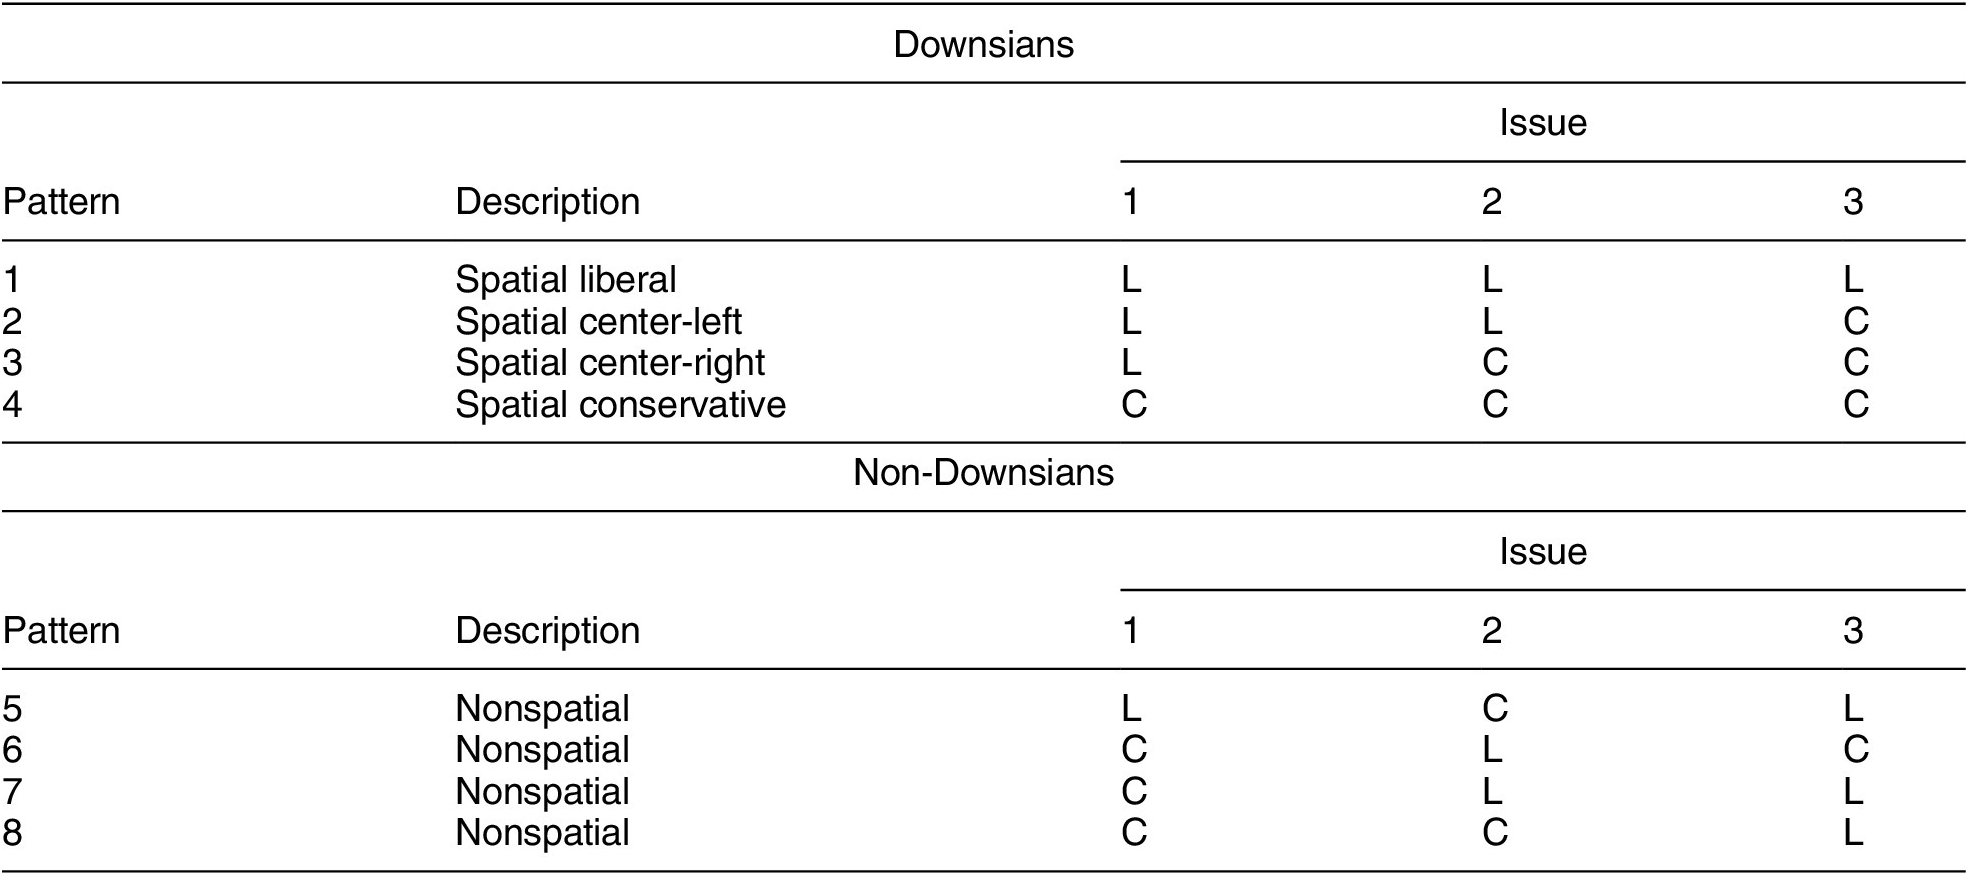
Note: Issues numbered from least to most conservative support among Downsians.
For exposition, we assume responses are perfect representations of preferences—that is, no survey or measurement error. The issues have been ordered such that if a Downsian gives a conservative answer on issue one, he or she will necessarily give a conservative answer on issues two and three, and so on such that the three questions divide Downsians at three points along the ideological spectrum. We have ordered the questions according to the popularity of the conservative response among Downsians—a quantity that will become important as we move through examples of each type. For the exposition, we have assumed we know the popularity of each issue. In our applications below, the model estimates popularity and relation to the liberal–conservative dimension for each issue.
With nonrandom responses and an ordering of policy positions from least to most conservative, we can use observed response patterns to identify individuals who are Downsians (well represented by the spatial orientation of the issues) from individuals who are non-Downsians (not well represented by the spatial orientation). In the upper frame of Table 1, we enumerate the four possible Downsian response patterns for the three issues when ordered from least to most conservative. With perfect responding, the items make a Guttman scale (Guttman Reference Guttman1944).
The patterns in the lower frame are inconsistent with spatial preferences. The pattern in the fifth row has the respondent giving the liberal response on issues one and three and the conservative response on issue two. Likewise, the patterns in rows six, seven, and eight are inconsistent with individuals who hold spatial preferences on these issues.
Table 1 provides the basic intuition for how we distinguish Downsians from non-Downsians. We don’t know, ex ante, how to order the questions ideologically (or which responses are liberal or conservative), but we can infer both from patterns of responses. If a respondent answers questions in a consistently liberal or conservative manner, they are likely a Downsian. If they give a mix of liberal or conservative responses, they could be either a Downsian or have non-Downsian preferences as described in the panels above. If there is a class of respondents who are neither consistently liberal nor consistently conservative but whose responses are well-classified by a Guttmann scale, they are more likely a Downsian moderate. The more a response profile conflicts with this Guttmann scale, the less likely they are to be Downsian.
Among these non-Downsians, we distinguish between two types: Conversian and inattentive types. An inattentive type should have a roughly equal probability of giving each response to each question. In contrast, Conversians discriminate between positions. Following this logic, we can calculate the relative likelihood that each non-Downsian response pattern was generated from a rate-0.5 binomial distribution or from a set of preferences with rates not equal to 0.5. Conversian types are the residual category who do not appear to be responding randomly with probability 0.5 or showing a pattern of responses that maps well into the spatial dimension.
Measurement Model
Our statistical model uses patterns like those in Table 1 to estimate the item parameters for each policy question relative to an underlying ideological dimension. The model simultaneously estimates the probabilities that each respondent is Downsian, Conversian, or inattentive based upon how well explained their issue responses are by the liberal–conservative dimension and how idiosyncratic their responses appear.Footnote 4 Our method then uses item parameters and individual response patterns to calculate the most likely ideal point on the ideological dimension that would have generated such a pattern of responses were the respondent a Downsian type.
Mixture Model of Issue Opinion
Formally, we start with a set of respondents indexed i = 1,…, N. Each of these respondents answers a (sub)set of binary issues questions indexed j = 1,…, J. The likelihood of the $ i $
th respondent’s answer to the jth question
$ i $
th respondent’s answer to the jth question $ {y}_{ij}\hskip0.35em \in \hskip0.35em \left\{0,1\right\} $
depends on type t = 1, 2, 3.
$ {y}_{ij}\hskip0.35em \in \hskip0.35em \left\{0,1\right\} $
depends on type t = 1, 2, 3.
For Downsian respondents, $ t\hskip0.35em =\hskip0.35em 1, $
we model their responses with the two-parameter IRT model described in Clinton, Jackman, and Rivers (Reference Clinton, Jackman and Rivers2004). If respondent
$ t\hskip0.35em =\hskip0.35em 1, $
we model their responses with the two-parameter IRT model described in Clinton, Jackman, and Rivers (Reference Clinton, Jackman and Rivers2004). If respondent $ i $
is of type 1,
$ i $
is of type 1,
 $$ \Pr ({y}_{ij}\hskip0.35em =\hskip0.35em 1|t\hskip0.35em =\hskip0.35em 1)\hskip0.35em =\hskip0.35em \Lambda ({\beta}_j({x}_i\hskip0.35em -\hskip0.35em {\alpha}_j)), $$
where $ \Lambda $
is the logistic cumulative distribution function,
$ \Lambda $
is the logistic cumulative distribution function, $ {\beta}_j $
and
$ {\beta}_j $
and $ {\alpha}_j $
are the so-called discrimination and cutpoint parameters associated with the jth issue question, and
$ {\alpha}_j $
are the so-called discrimination and cutpoint parameters associated with the jth issue question, and $ {x}_i $
is the ideological position of the respondent. Assuming conditional independence across issue questions given the choice model, the Downsian likelihood of respondent
$ {x}_i $
is the ideological position of the respondent. Assuming conditional independence across issue questions given the choice model, the Downsian likelihood of respondent $ i $
’s vector of answers to the issue questions,
$ i $
’s vector of answers to the issue questions, $ {\boldsymbol{y}}_{i\cdot } $
is
$ {\boldsymbol{y}}_{i\cdot } $
is
 $$ {L}_1\left({\boldsymbol{y}}_{\boldsymbol{i}\cdot};\boldsymbol{\alpha}, \boldsymbol{\beta} \right)\hskip0.35em =\hskip0.35em \int \prod_{j\hskip0.15em \in \hskip0.15em {J}_i}\varLambda ({\beta_j(x\hskip0.35em -\hskip0.35em {\alpha}_j))}^{y_{ij}}(1\hskip0.35em -\hskip0.35em \varLambda ({\beta_j(x\hskip0.35em -\hskip0.35em {\alpha}_j)))}^{1-{y}_{ij}}f(x) dx, $$
where Ji is the set of question indices corresponding to the issue questions answered by the $ i $
th respondent and
$ i $
th respondent and $ f $
is the distribution of ideal points.Footnote 5 This approach of marginalizing over the ideal points was pioneered by Bock and Aitkin (Reference Bock and Aitkin1981) in the context of educational testing.Footnote 6 Marginalizing over the ideal points (
$ f $
is the distribution of ideal points.Footnote 5 This approach of marginalizing over the ideal points was pioneered by Bock and Aitkin (Reference Bock and Aitkin1981) in the context of educational testing.Footnote 6 Marginalizing over the ideal points ( $ x $
) allows us to estimate the probability of observing each vector of question responses conditional on the respondent
$ x $
) allows us to estimate the probability of observing each vector of question responses conditional on the respondent $ i $
being of type 1 and, in turn, to apply Bayes rule to recover the probability that a respondent giving a particular set of responses is of type 1. We calculate an a posteriori ideal point for each respondent based on their issue question responses and estimates of
$ i $
being of type 1 and, in turn, to apply Bayes rule to recover the probability that a respondent giving a particular set of responses is of type 1. We calculate an a posteriori ideal point for each respondent based on their issue question responses and estimates of $ \alpha $
and
$ \alpha $
and $ \beta $
as described in Appendix A.
$ \beta $
as described in Appendix A.
For inattentive respondents, $ t\hskip0.35em =\hskip0.35em 2 $
,
$ t\hskip0.35em =\hskip0.35em 2 $
,
 $$ \mathit{\Pr}\left({y}_{ij}\hskip0.35em =\hskip0.35em 1|t\hskip0.35em =\hskip0.35em 2\right)\hskip0.35em =\hskip0.35em 1/2, $$
and the likelihood of the $ i $
th respondent’s response pattern given that they are of the inattentive type is
$ i $
th respondent’s response pattern given that they are of the inattentive type is
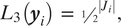
where $ \left|{J}_i\right| $
is the number of questions answered by the
$ \left|{J}_i\right| $
is the number of questions answered by the $ i $
th respondent.
$ i $
th respondent.
For Conversian respondents, $ t\hskip0.35em =\hskip0.35em 3 $
, responses are assumed to be independent across questions. Accordingly,
$ t\hskip0.35em =\hskip0.35em 3 $
, responses are assumed to be independent across questions. Accordingly,
 $$ \Pr \left({y}_{ij}\hskip0.35em =\hskip0.35em 1|t\hskip0.35em =\hskip0.35em 3\right)\hskip0.35em =\hskip0.35em {\lambda}_j, $$
where $ {\lambda}_j $
is the probability that yj equals 1, equivalently the rate of support for response option one among Conversians. With independence across responses, the likelihood of individual
$ {\lambda}_j $
is the probability that yj equals 1, equivalently the rate of support for response option one among Conversians. With independence across responses, the likelihood of individual $ i $
’s vector of issue question answers given that they are Conversian is
$ i $
’s vector of issue question answers given that they are Conversian is
 $$ {L}_2\left({\boldsymbol{y}}_{\boldsymbol{i}\cdot};\boldsymbol{\lambda} \right)\hskip0.35em =\hskip0.35em {\prod}_{j\hskip0.15em \in \hskip0.15em {\mathcal{J}}_i}{\lambda_j}^{y_{ij}}{\left(1\hskip0.35em -\hskip0.35em {\lambda}_j\right)}^{\left(1-{y}_{ij}\right)}. $$
The marginal distribution of respondent $ i $
’s vector of issue question responses across the three possible types is a mixture of the likelihoods of the three types and to estimating each respondent ideal point. In particular,
$ i $
’s vector of issue question responses across the three possible types is a mixture of the likelihoods of the three types and to estimating each respondent ideal point. In particular,
 $$ L\left({\boldsymbol{y}}_{i\cdot };\boldsymbol{\alpha}, \boldsymbol{\beta}, \boldsymbol{\lambda}, {\overline{w}}_1,{\overline{w}}_2,{\overline{w}}_3\right)={\displaystyle \begin{array}{l}{\overline{w}}_1{L}_1\left({\boldsymbol{y}}_{i\cdot };\boldsymbol{\alpha}, \boldsymbol{\beta} \right)\\ {}+\hskip2px {\overline{w}}_2{L}_2\left({\boldsymbol{y}}_{i\cdot };\boldsymbol{\lambda} \right)+{\overline{w}}_3{L}_3\left({\boldsymbol{y}}_{i\cdot}\right),\end{array}} $$
where $ {\overline{w}}_t $
is the fraction of the sample of type
$ {\overline{w}}_t $
is the fraction of the sample of type $ t $
and
$ t $
and $ {\sum}_t{\overline{w}}_t\hskip0.35em =\hskip0.35em 1. $
Assuming independence across respondents, the overall likelihood is
$ {\sum}_t{\overline{w}}_t\hskip0.35em =\hskip0.35em 1. $
Assuming independence across respondents, the overall likelihood is
 $$ L\hskip0.35em =\hskip0.35em \prod \limits_iL\left({\boldsymbol{y}}_{i\cdot };\boldsymbol{\alpha}, \boldsymbol{\beta}, \boldsymbol{\lambda}, {\overline{w}}_1,{\overline{w}}_2,{\overline{w}}_3\right). $$
We maximize over all of the parameters using the usual expectation-maximization approach to the estimation of finite mixture models as described in the Appendix.
Having estimated model parameters, we take an empirical Bayes approach to the estimation of the probability that each respondent is of each of the three types. In particular, using Bayes rule, the $ i $
th respondent’s estimated probability of being of type
$ i $
th respondent’s estimated probability of being of type $ t $
is
$ t $
is
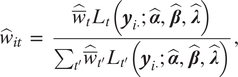 $$ {\hat{w}}_{it}\hskip0.35em =\hskip0.35em \frac{{\hat{\overline{w}}}_t{L}_t\left({\boldsymbol{y}}_{i\cdot };\hat{\boldsymbol{\alpha}},\hat{\boldsymbol{\beta}},\hat{\boldsymbol{\lambda}}\right)}{\sum_{t^{\prime }}{\hat{\overline{w}}}_{t^{\prime }}{L}_{t^{\prime }}\left({\boldsymbol{y}}_{i\cdot };\hat{\boldsymbol{\alpha}},\hat{\boldsymbol{\beta}},\hat{\boldsymbol{\lambda}}\right)}, $$
where the hatted quantities represent estimates.
It is worth pointing out here that the algorithm does not proceed in stages by first identifying Downsians and then distinguishing Conversian and inattentive respondents. Our procedure estimates all parameters in an expectation-maximization algorithm, finding (1) estimated Conversian response rates $ \lambda $
for each question conditional on estimates of Conversian-type probability for each respondent and (2) estimated population fraction of each type, given item response estimates
$ \lambda $
for each question conditional on estimates of Conversian-type probability for each respondent and (2) estimated population fraction of each type, given item response estimates $ \alpha $
and
$ \alpha $
and $ \beta $
, Conversian rates
$ \beta $
, Conversian rates $ \lambda $
, and observed data (pattern of responses for each respondent).
$ \lambda $
, and observed data (pattern of responses for each respondent).
One potential concern is that respondents could be overfit into the Conversian or Downsian categories because each respondent’s responses contribute to the estimated Conversian weights and the estimated Downsian cutpoints and discrimination parameters. However, because we have tens of thousands of respondents per survey, the contribution of any one individual to these estimates is negligible. Furthermore, because we have at least 20 questions per survey and because our Downsian model imposes relatively strong assumptions about how item parameters and ideal points map into response probabilities, an idiosyncratic response pattern is unlikely to be wrongly classified as Downsian. Our Monte Carlo simulations in the Appendix demonstrate that with a sufficient number of respondents and policy questions, our procedure does not meaningfully under- or overestimate the shares of each group.
Estimated type probabilities
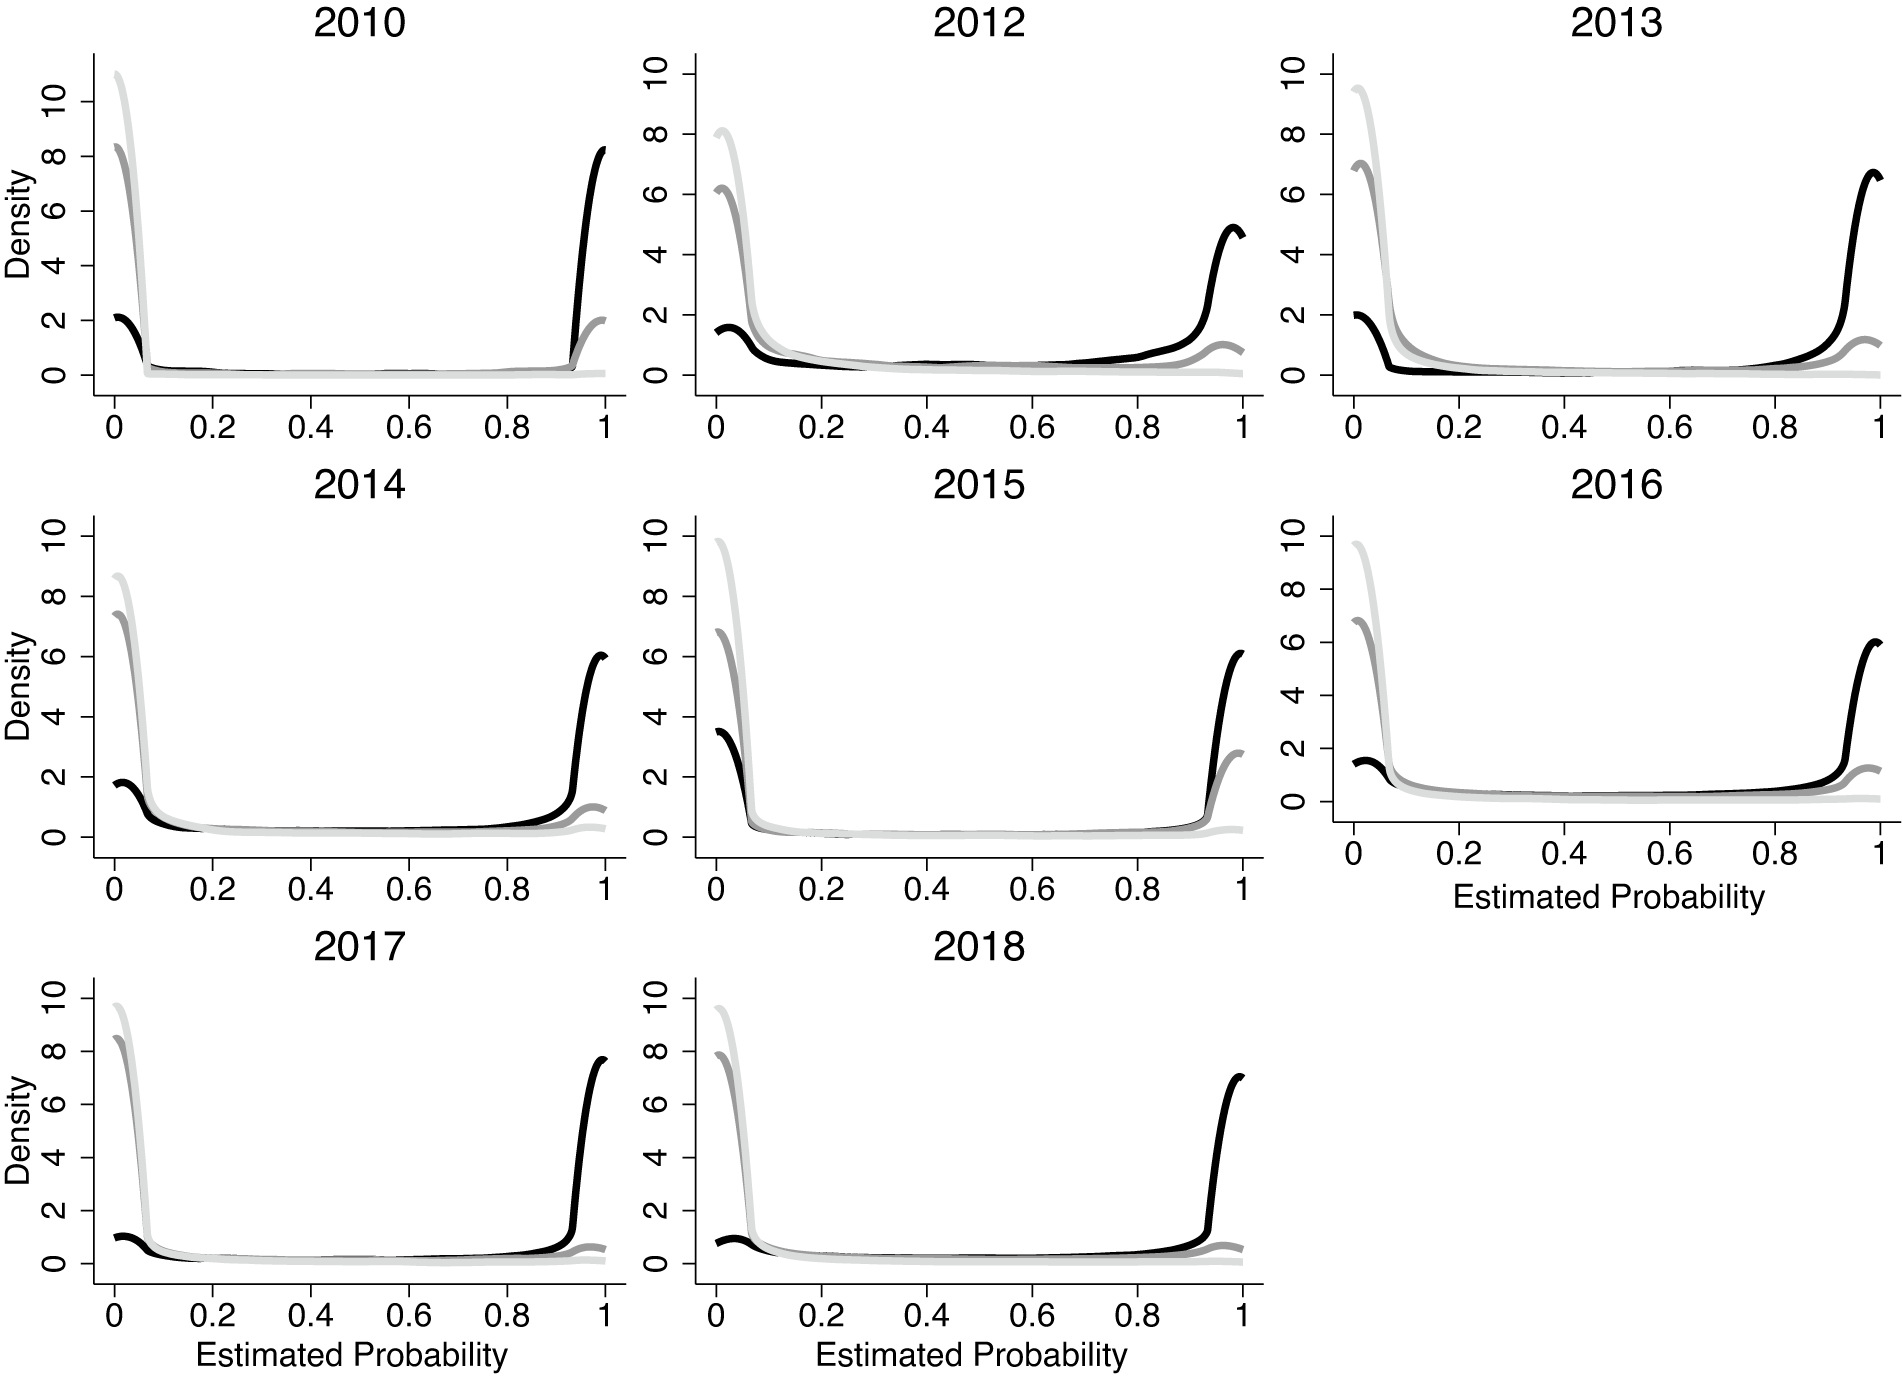
Figure 1 shows the Empirical Bayes estimated probabilities that each respondent is a Downsian (black), Conversian (dark gray), or inattentive (light gray) type after implementing our method for different datasets. We see that most respondents are classified into one of the three groups with high probability. Forty-eight percent of respondents have an estimated probability greater than 0.99, 66% exceed 0.95, and 74% exceed 0.9.
Distributions of Estimated Probabilities
Note: The figure shows kernel density plots (bandwidth = .03) of estimated probabilities that each respondent is a Downsian (black), Conversian (dark gray), and inattentive (light gray) type.
Descriptive Results: Who are the Genuine Moderates?
This section provides our descriptive results. First, we present several assessments of the validity of our estimates. Next, we discuss the response profiles of people in our three categories on several issue questions in the CCES survey data. Then, we provide descriptive results on the prevalence and characteristics of moderates. Finally, we discuss differences in electoral behavior across types.
Validating Our Estimates
The 2010 CCES module asked two questions about the minimum wage that elicit substantively meaningful variation in a policy view. Although these two questions were included in our mixture model estimation, they were but two of 133 questions for that module and so of only minor influence on results.
One question asked respondents whether they would support eliminating the minimum wage. A second question asked about support for raising the minimum wage to 15 dollars per hour. With two binary questions, each respondent could take one of four different positions: the most conservative position supporting eliminating the minimum wage and not raising it to 15 dollars, the most liberal position supporting the increase to 15 dollars and not eliminating it, a moderate position supporting neither change, or the incoherent position of supporting both the elimination of the minimum wage and its increase to 15 dollars.
Figure 2 shows the probability that each type of respondent, as classified by the mixture model, took each possible set of positions. For each panel, we use kernel regression to estimate the probability of taking that minimum wage position (1 = yes, 0 = no) across estimated ideological scores for each type. Each respondent is classified according to their highest probability, Downsians in black, Conversians dark gray, and Inattentives light gray.
Minimum Wage Positions across Respondent Types
Note: Kernel regressions (bandwidth = 0.3) of different positions on two minimum wage questions in the 2010 CCES module by a posteriori ideology. Separate plots are shown for Downsian (black), Conversian (dark gray), and inattentive (light gray) respondents. The top-left panel shows support for eliminating the minimum wage and not raising it to 15 dollars. The top-right panel shows support for an increase to 15 dollars and not eliminating. The bottom-left panel shows support for neither reform, and the bottom-right panel shows support for both reforms.
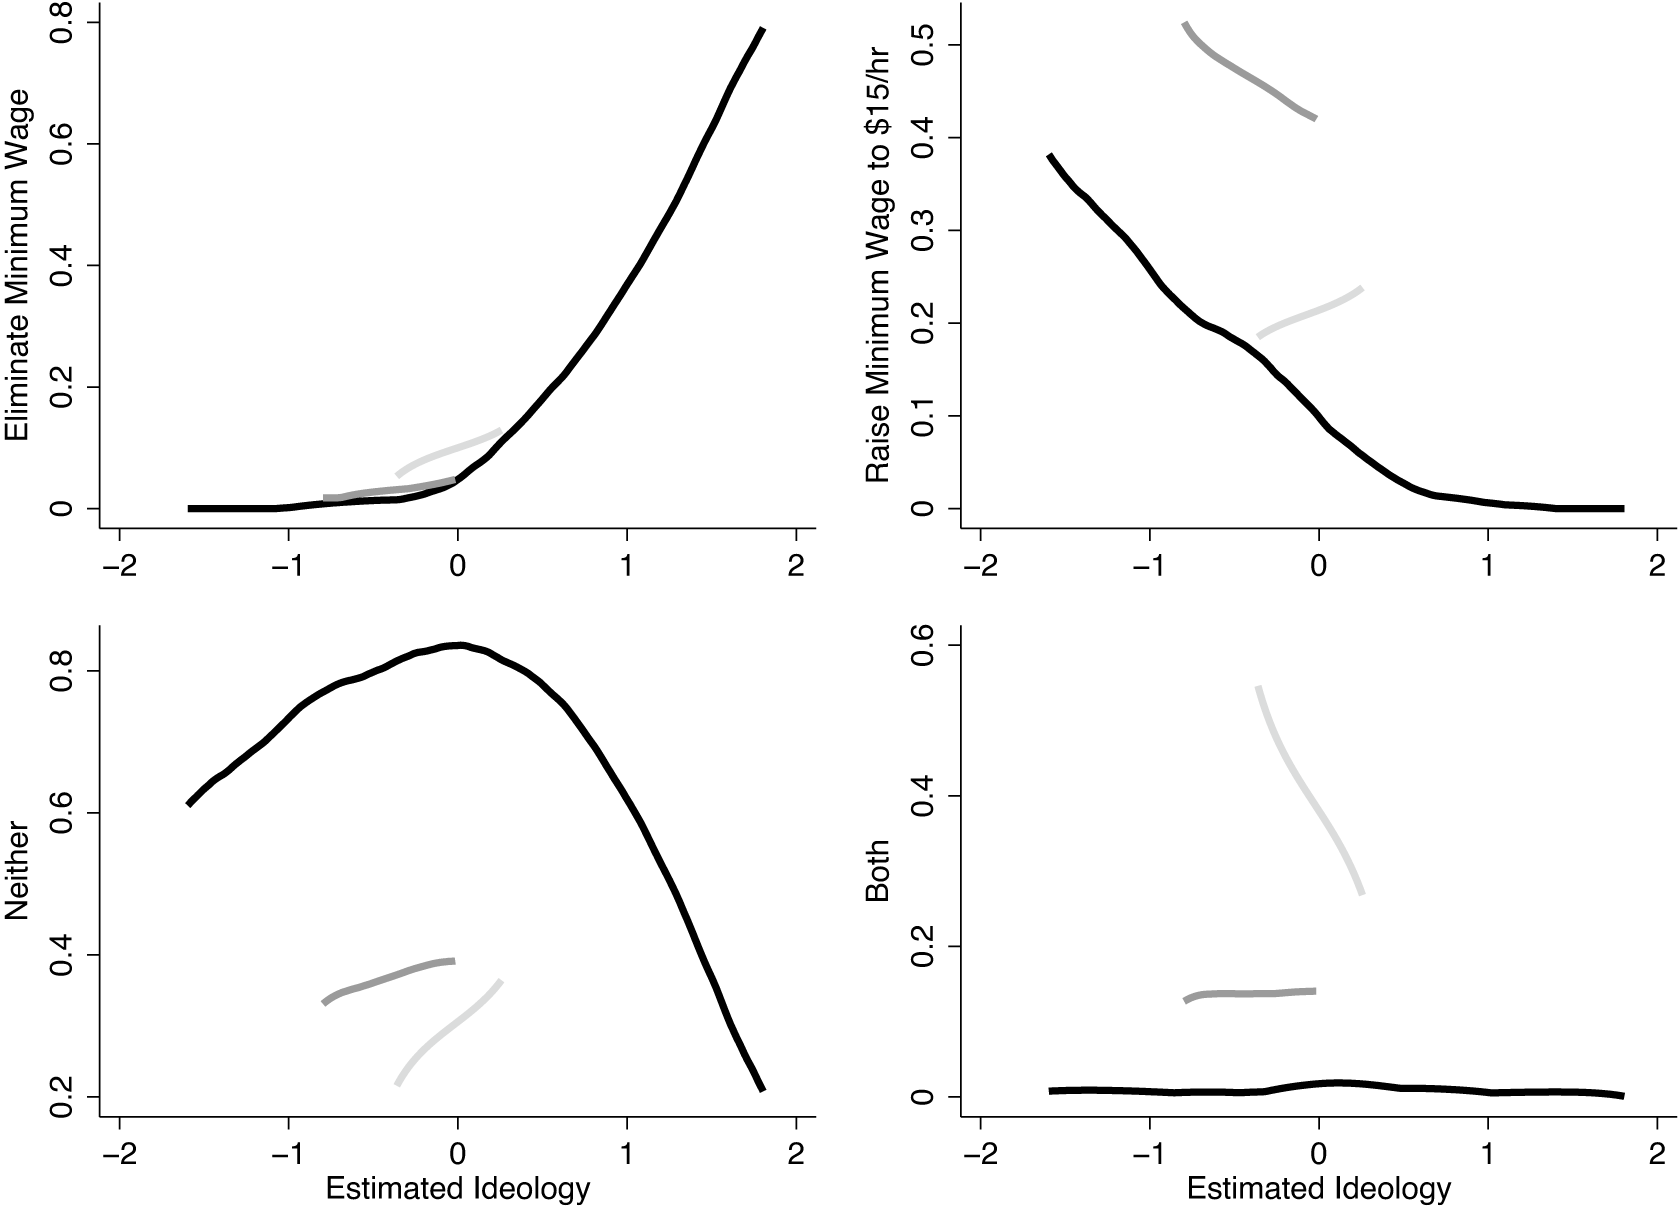
As we would expect, the top-left panel of Figure 2 shows that Downsian conservatives are much more likely than other Downsians to support eliminating the minimum wage, and the top-right panel shows that Downsian liberals are much more likely to support raising the minimum wage to 15 dollars. If our method correctly identifies moderates, we should see that Downsians with moderate ideological scores are much more likely than are other groups to support neither reform, which is exactly what we find in the bottom-left panel.
Conversians look like extreme liberals on this particular question. In fact, they are more likely to support a 15 dollar minimum wage than are Downsian liberals. Of course, they are not liberal in all policy domains; otherwise, they would be classified as Downsian liberals. This illustrates that our mixture model does not require that Conversians be centrist on every policy.
Last, we would hope that the model would classify as inattentive those most likely to take the seemingly incoherent position that they would like to eliminate the minimum wage and raise it to 15 dollars. This is exactly what we find in the bottom-right panel of Figure 2. There are few inattentive respondents in this sample—770 respondents answered both minimum wage questions and only 10 are classified as inattentive. Nevertheless, inattentive respondents are about equally likely to take any of the four positions. This is consistent with having either no meaningful position on minimum wage or answering survey questions without care.
We picked the minimum wage example for it’s intuitive simplicity. In order to show that we have not cherry-picked this example, we conduct a similar analysis in Appendix C across the 133 questions and 13,225 question pairs. This analysis demonstrates a similar pattern to the minimum wage result.
As a second validation for our estimates, and to assess the extent to which different respondent types hold extreme views, we examine responses to binary policy questions from the UCLA, UCSD, and MIT modules of the 2014 CCES. These modules contained a large number of binary policy questions but were asked to 2,584 out of 56,200 2014 CCES respondents. We did not use these items in the mixture model due to the small number of respondents, so these responses provide an opportunity to evaluate out-of-sample validity of our estimates.
Our goal is to assess the frequency with which different types of individuals hold extreme policy positions. We classify a policy position as extreme if, in a binary question, that position was taken by less than 35% of all respondents. This classification is admittedly arbitrary. More stringent classifications would significantly reduce the sample of policy questions for which an extreme response is possible. Following Broockman (Reference Broockman2016), we consider how the frequency of extreme positions varies across estimated ideologies. As before, we do this separately for Downsian, Conversian, and inattentive respondents, classifying each individual according to their highest posterior probability.
The left panel of Figure 3 presents kernel regressions of the proportion of extreme liberal positions taken by each respondent on questions for which an extreme liberal position was possible (meaning that the more liberal option was selected by less than 35% of respondents). The center panel shows the analogous plots for extreme conservative responses and the right panel the average of the two proportions from the other panels. This right panel measures the total frequency with which different respondents take extreme positions.Footnote 7
Extreme Responses across Respondent Types
Note: Kernel regressions (bandwidth = 0.1) of extreme policy positions by estimated ideology using out-of-sample questions. Separate plots are shown for Downsian (black), Conversian (dark gray), and inattentive (light gray) types. Extreme positions are defined as responses to binary policy questions that are supported by less than 35% of respondents. The left panel examines the proportion of extreme liberal responses when such a response is possible. The center panel shows the analogous proportion of extreme conservative responses. The right panel shows the average of these two proportions.

As we would expect if our model correctly classifies respondents, liberal Downsians are more likely to hold extreme liberal positions and conservative Downsians are more likely to hold extreme conservative positions. These results lend support to the model with out-of-sample policy questions.
Looking at the right panel, we find that moderate Downsians are, overall, much less likely to hold extreme positions than are liberals or conservatives. This result contrasts with that of Broockman (Reference Broockman2016) who finds that estimated ideology is uncorrelated with extreme positions. Our decomposition of moderates into the three types might explain these different results. By examining the inattentive respondents (light gray), we see they are are indeed more likely to provide extreme responses than even extreme liberal or conservative respondents. If we had not separately modeled these individuals as inattentive and instead classified them as moderate Downsians, we could overstate the extent to which people in the middle hold extreme positions.
Figure 3 also finds that Conversians are not especially likely to hold extreme positions for this particular set of questions. Therefore, although Conversians can hold outlying views, as we found with the minimum wage questions, they appear not to be conflicted extremists as a general matter (given the questions in this sample).
Issue Profiles of Respondents in Various Categories
To provide more validation and intuition for our estimates, we present differences across our categories on 14 policy questions from the 2016, 2017, and 2018 CCES surveys. For simplicity, we put every respondent into one of five categories. First, we assign each respondent to their highest-probability type (Downsian, Conversian, or inattentive). Second, we break Downsians into thirds: most liberal, centrist, and most conservative.
We sort the 14 policy items in Table 2 by the percentage of the public that supports the conservative option. The table shows that supermajorities of conservative and liberal Downsians select the conservative and liberal option on most questions. Downsian moderates are always somewhere between the liberal and conservative poles. On some questions, most moderates support the liberal response, whereas on others a majority of moderates support the conservative option.
Issue Profiles across Categories in 2016, 2017, and 2018 CCES

Note: The table shows the share of respondents in each category giving the conservative response to each question.
In contrast, we find little consistent relationship between Conversian response patterns and either overall support for a position or the response patterns of liberal and conservative Downsians. For instance, Conversians give conservative answers on abortion and liberal answers on minimum wage.
Inattentive respondents are roughly equally likely to pick the liberal or conservative policy option regardless of overall population support. For instance, 48% support withdrawing from the Paris Climate Agreement, 48% support eliminating income taxes, and 54% oppose using Medicaid for abortion.
The descriptive statistics suggest that many of the Conversians we identify might be better summarized by two ideological dimensions. Perhaps many are liberal on economic policy and conservative on social policy. Indeed, when we implement a two-dimensional version of our mixture model (Appendix D), allowing Downsians to be described by ideal points in each of two dimensions, the estimated share of Conversians decreases. Rather than having completely idiosyncratic preferences, many of the respondents we classify as Conversian in a one-dimensional model have views that can be summarized by a spatial model with two ideological dimensions. This suggests public opinion might be more structured than the Conversian count implies.
The Prevalence of Moderates
Here we provide descriptive results on the prevalence and characteristics of our different respondent types. In total, we have estimates for 285,485 survey respondents (Table 3).Footnote 8 Pooling across all datasets, we estimate that 72.8% of respondents have positions that are well described by the spatial dimension—Downsians. Perhaps reassuringly, the one-dimensional ideological model that is standard in many empirical and theoretical literatures provides the best model of the views of more than 7 in 10 Americans across our samples.
Average Estimates across Data Sources

However, almost 3 in 10 Americans are better described as Conversian or inattentive. We estimate that approximately 1 in 5 Americans expresses policy views that are neither well described by a single left–right ideological dimension nor best classified as random—Conversians. Other studies that assume that everyone is a Downsian miss this important and politically interesting group. Our method allows scholars to identify them using patterns of policy responses found in traditional political surveys.
Last, we find that 6.5% of CCES respondents are inattentive. Reassuringly for survey researchers, this number is small, but it would be inappropriate to assume that these respondents are moderate Downsians.
That said, we classify less than 1% of respondents as inattentive in the 2010 module where we have 133 policy questions. One possible interpretation is that the inattentive model does not accurately describe the behavior of many respondents and, as the number of questions increases, the share of individuals wrongly classified as inattentive shrinks. Another possibility is that the 2010 module, with its unusually large number of policy questions, changed the behavior of respondents.Footnote 9
Next, we ask whether conventional inferences about the distribution of ideologies in the population are meaningfully biased because nearly 3 in 10 respondents are not well described by the spatial model. Ansolabehere, Rodden, and Snyder (Reference Ansolabehere, Rodden and Snyder2006) argue that America is purple, with a unimodal distribution of ideologies and with most of the public well between the positions of Democratic and Republican party leaders. But as Broockman (Reference Broockman2016) points out, many survey respondents who appear to be moderate in the sense that they give a mix of liberal and conservative responses may be misclassified. Our decomposition method allows us to remove these individuals. Is America still “purple” if we focus on only the Downsians?
In Figure 4, we replicate the analyses of Ansolabehere, Rodden, and Snyder (Reference Ansolabehere, Rodden and Snyder2006). Figure 4 shows the distributions of estimated ideology in each of our datasets using kernel density plots (bandwidths set to 0.1). For each dataset, we scale the estimated ideologies such that the mean is 0 and the standard deviation is 1. The gray curves show the distribution of estimated ideology across all respondents—as in Ansolabehere, Rodden, and Snyder (Reference Ansolabehere, Rodden and Snyder2006). The black curves estimate the distribution weighted by the probability of being a Downsian.
Distributions of Ideology for All Respondents and for Downsians
Note: Kernel density plots (bandwidth = 0.1) of estimated ideology for all respondents (gray) and for respondents weighted by their probability of being Downsian (black).
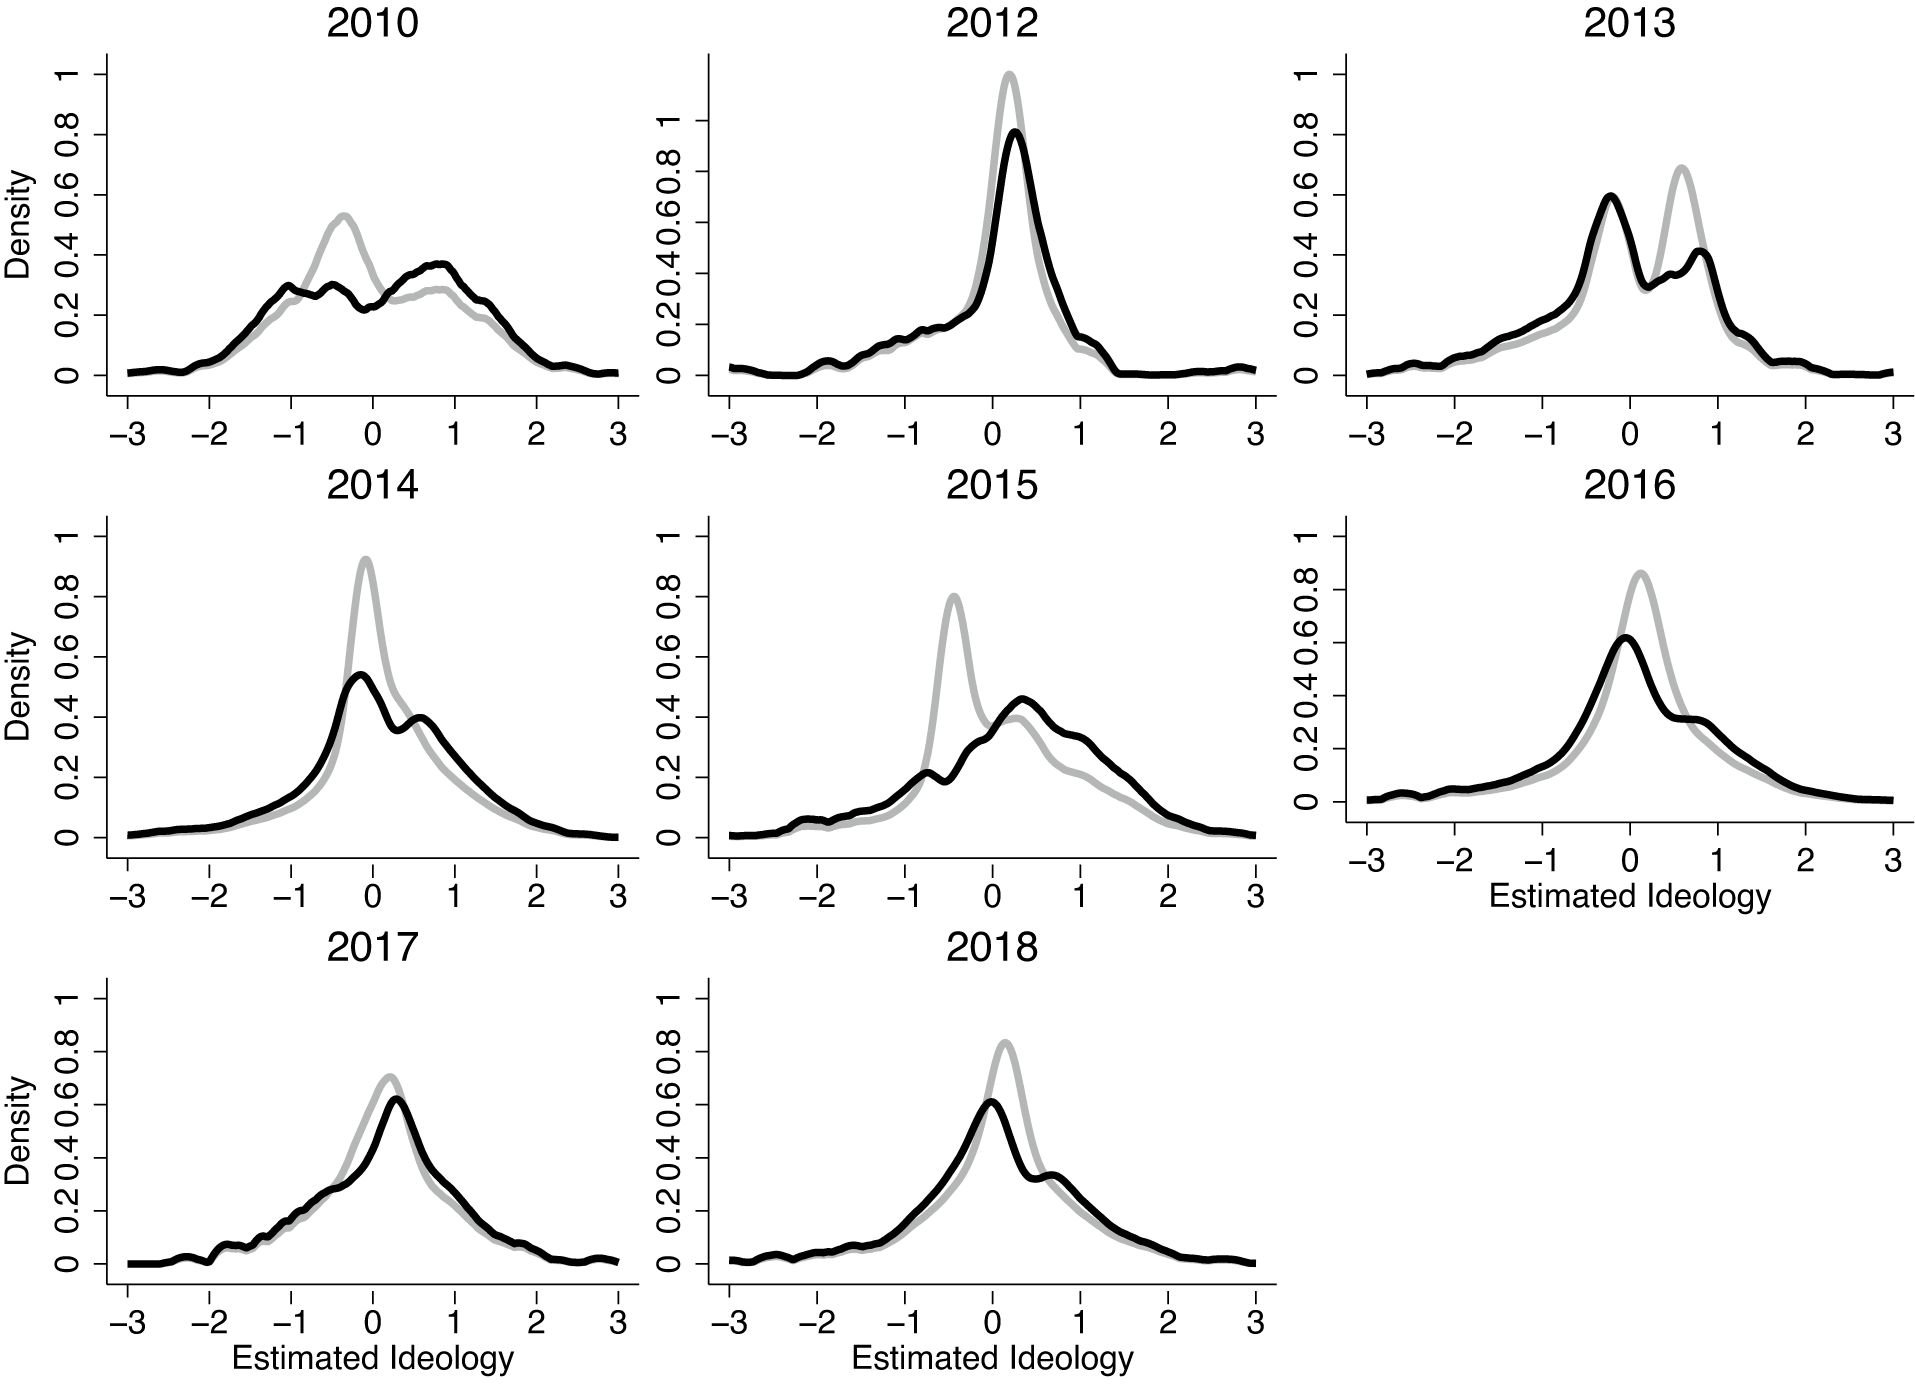
Although America still looks purple when we discard the respondents who might be inaccurately characterized as moderates, there are important differences in the overall characterization of the population. Most notably, the naive analysis overstates moderation and understates extremism. When we focus on Downsians, we see relatively fewer respondents in the middle and relatively more in the tails. That said, the differences are not so dramatic as to make the population distribution look anything like the distribution of ideology in the United States Congress.
For those respondents who appear moderate based on their mix of liberal and conservative policy responses, how many are genuine Downsian moderates as we define them? Figure 5 presents kernel regressions of the proportion of respondents who are Downsian (black), Conversian (dark gray), and inattentive (light gray) across estimated left–right scores for each of the datasets. Figure 5 shows that the probability of being a Downsian is very close to 1 for almost all respondents with estimated scores more than one standard deviation from the mean. This is not so much an empirical result as it is a mechanical implication of our assumptions.
Respondent Type Probabilities by Estimated Ideology
Note: Kernel regressions (bandwidth = 0.1) of Downsian (black), Conversian (dark gray), and inattentive (light gray) respondents across a posteriori Downsian ideologies.

If, however, we focus on estimated ideologies close to the mean, the average probability of being a Downsian remains above one-half for most ideal points in every dataset. The probability of being a Conversian is just under one-half, and the probability of being inattentive is small. A large share—but by no means all—of those who appear moderate based on a left–right one-dimensional score are moderates with genuinely spatial preferences.
Differences in Electoral Attitudes and Behavior across Types
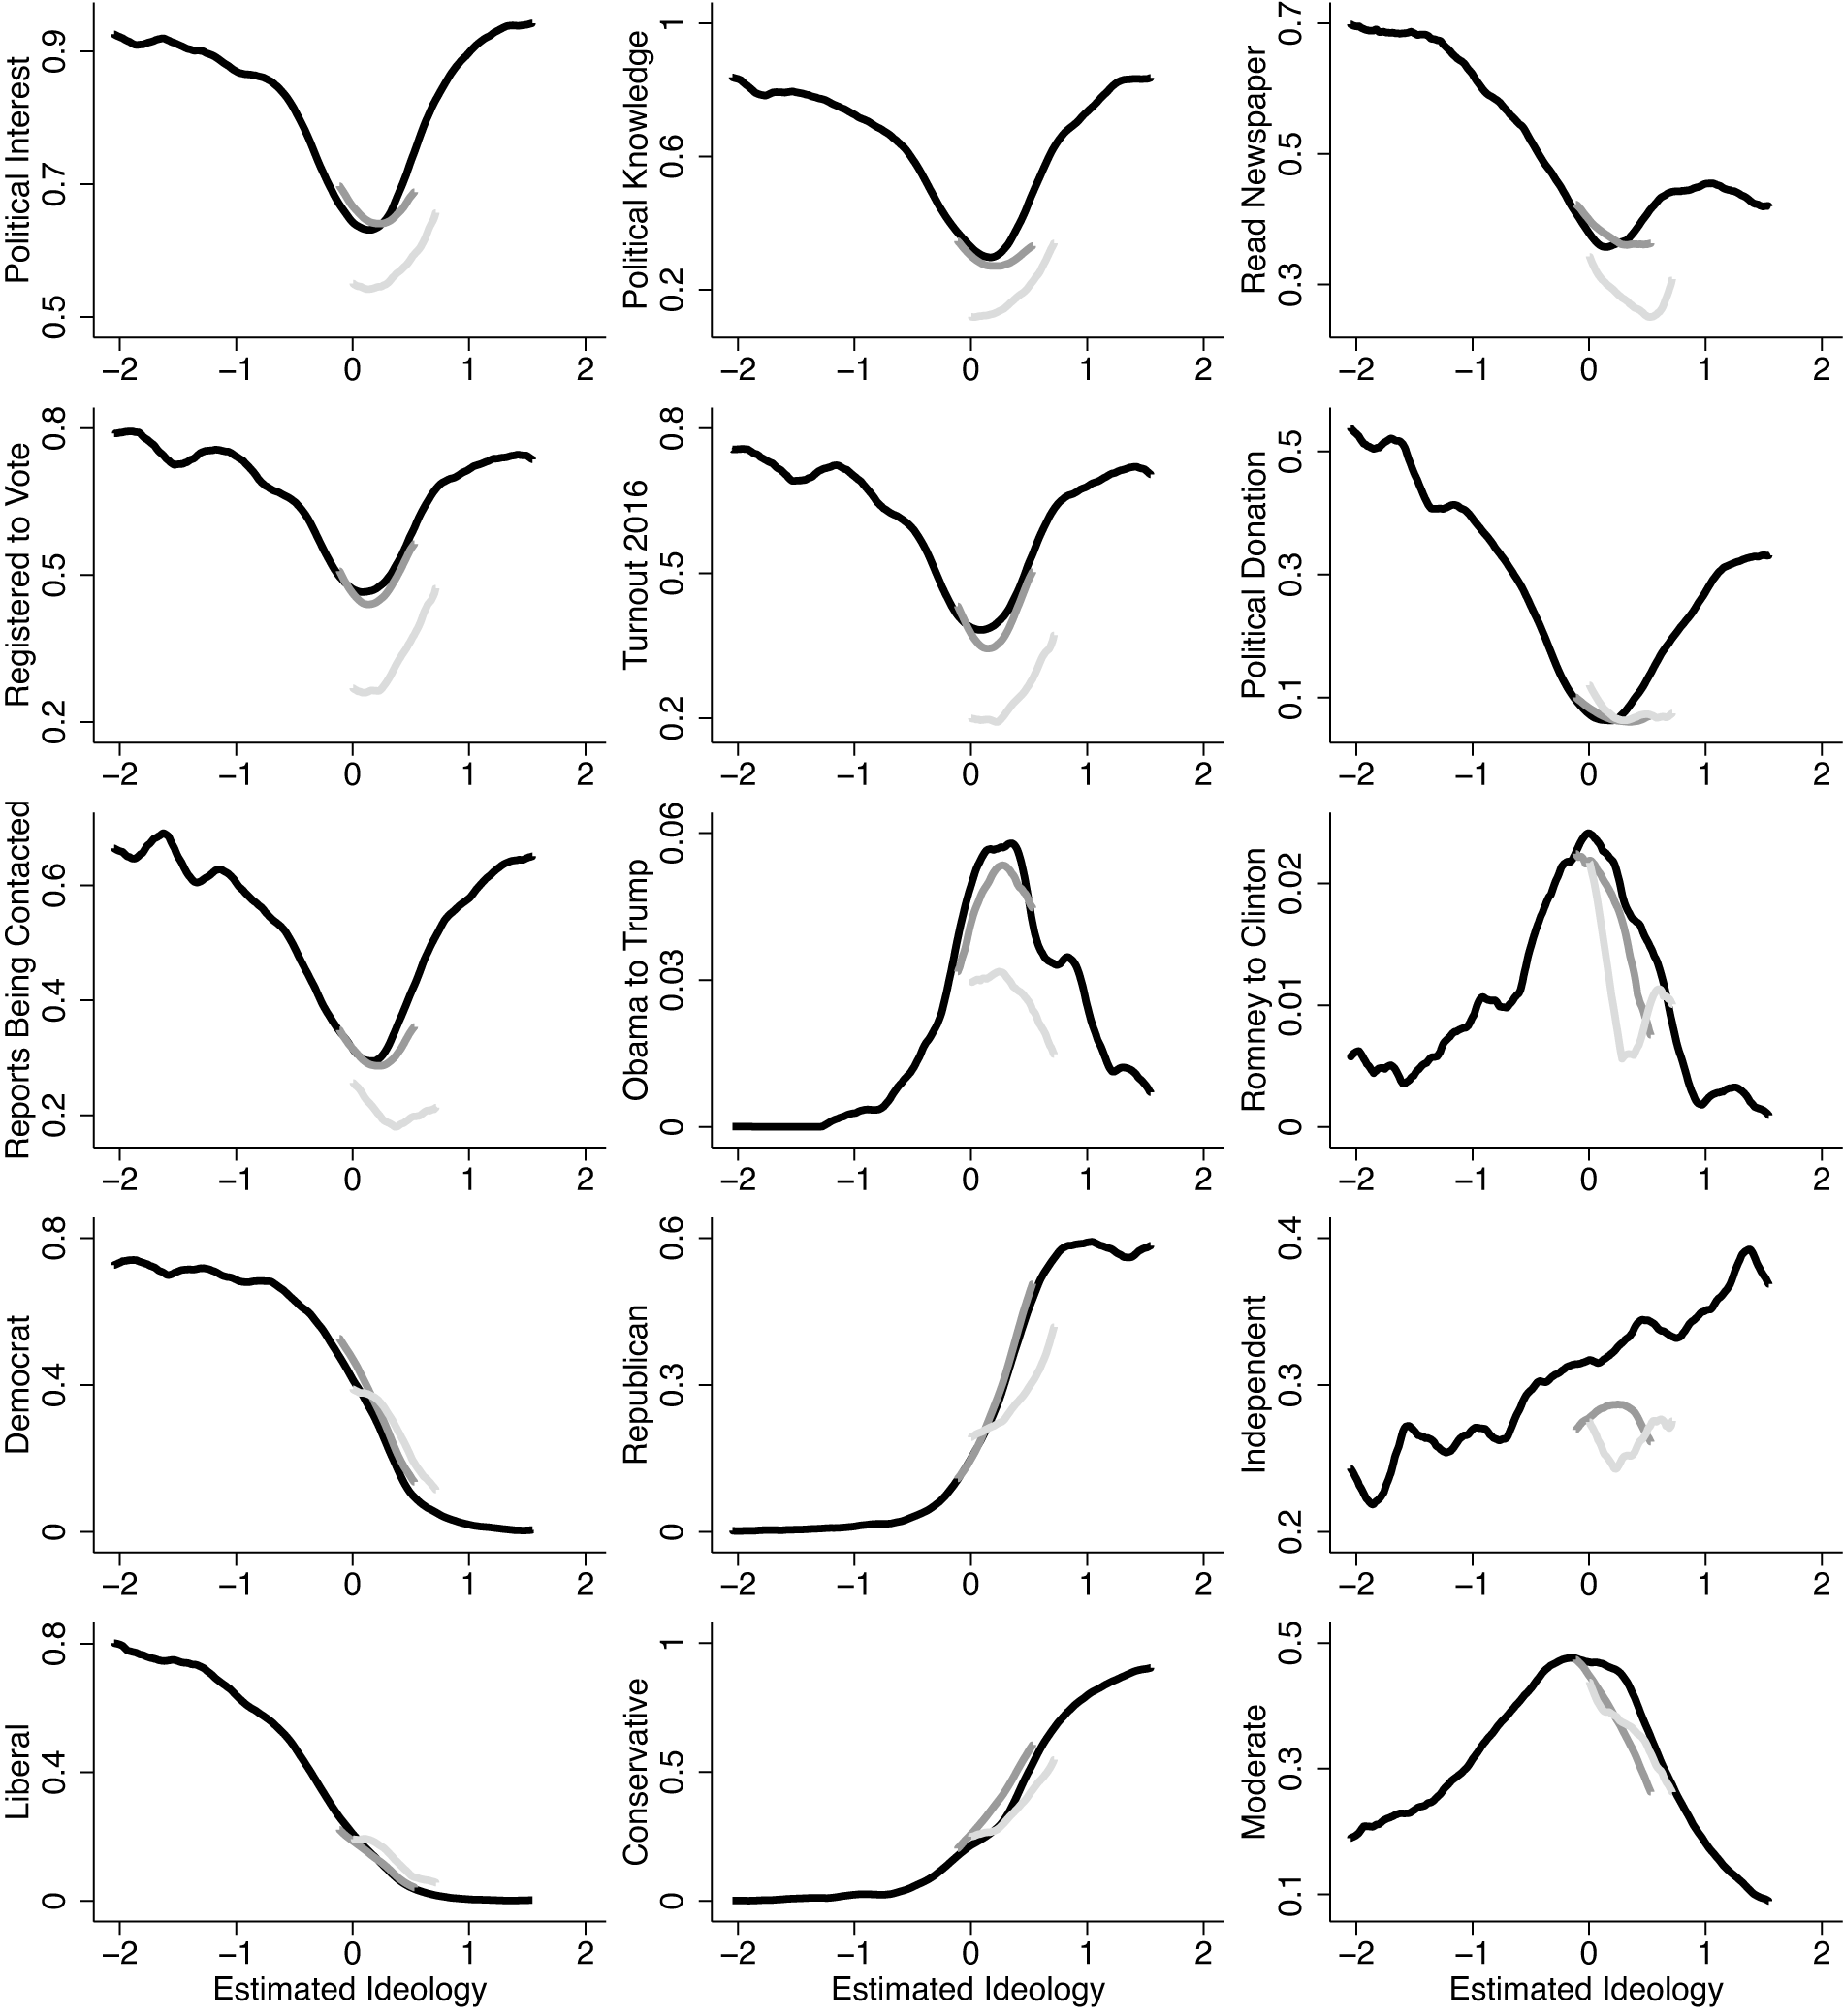
To examine distinguishing features of different types of individuals, we focus on the 2016 CCES. This dataset has a large sample size, a large number of policy questions, and several questions on electoral attitudes and behaviors of interest. In Figure 6, we plot kernel regressions of each attitude and behavior by estimated ideology separately for each type. We examine self-reported political interest, whether a respondent correctly identified the party controlling the House and Senate; whether they report reading a newspaper, voter registration, voter turnout in 2016; whether they report making a political donation; whether they report being contacted by a campaign or political group; whether they switched from supporting Obama in 2012 to Trump in 2016; whether they switched from supporting Romney in 2012 to Clinton in 2016 self-reported party identification; and self-reported ideology.
Electoral Attitudes and Behavior across Types
Note: Kernel regressions (bandwidth = 0.1) of electoral attitudes and behaviors across estimated ideologies for Downsian (black), Conversian (dark gray), and inattentive (light gray) respondents in the 2016 CCES.
One caveat to these analyses is that if the inattentive respondents provide approximately meaningless responses to policy questions, perhaps they also provide meaningless responses to questions about their political behavior, knowledge, or identification. Survey researchers have found that factual recall questions are much easier for survey respondents than are opinion or attitude questions (see, e.g., Tourangeau, Rips, and Rasinski Reference Tourangeau, Rips and Rasinski2000), so careless answers to policy questions do not necessarily imply inaccurate answers to questions about, for example, vote choices or news consumption. That said, we advise caution in analyzing and interpreting the reported behaviors of inattentive respondents.
Ideologues—that is, those who are Downsians with ideologies far from the mean—have higher levels of political interest and participation than do all other types, and they are less likely to report having switched their party vote between 2012 and 2016. Downsian moderates have somewhat higher levels of political knowledge and participation and are more likely to have switched the party they voted for between 2012 and 2016 relative to Conversian or inattentive types. The inattentive respondents show the lowest levels of political participation and interest.
The results on vote switching are particularly important. Although few people change the party they support between presidential elections, those few who do may determine who wins elections. Downsian moderates make up a large share of this group. Among those who switched between the 2012 and 2016 presidential elections, 65% are Downsians with mostly moderate ideological scores, 32% Conversians, and 3% inattentive.
Finally, the last two rows of Figure 6 show that our estimates correspond with self-reported partisan leanings and ideologies. Estimated ideologies correspond strongly with the probability that a respondent self-identifies as a Democrat, Republican, liberal, or conservative. Those with moderate estimated ideologies are more likely to identify as independent or moderate. And providing some external validation of our estimates, among those who appear moderate, the Downsians are more likely to identify as independent or moderate than are the Conversian or inattentive respondents.
In Appendix F, we show how our classifications and estimates relate to respondent demographics such as race, gender, age, income, education, and church attendance.
Who Drives Electoral Selection and Accountability?
Perhaps more important than the prevalence of moderates is the extent to which they are politically consequential. We saw in Figure 6 that those in the middle of the ideological spectrum were most likely to report changing their party support between the 2012 and 2016 presidential elections. Are moderates more responsive to the abilities, positions, and effort of candidates? If so, what are the implications for electoral selection and accountability?
Research Design
To address these questions, we merge our estimates for CCES respondents from 2012, 2014, 2016, and 2018 with information about the various U.S. House races in each respondent’s district. We use data obtained from Gary Jacobson on incumbency status and the previous political experience of the major candidates (see, e.g., Jacobson Reference Jacobson2015). We also use estimates from Bonica (Reference Bonica2014) that use campaign finance data to approximate the ideologies of the candidates running in each race (CF Scores).
As before, we group survey respondents into the five categories liberal, moderate, conservative, Conversian, and inattentive. Using the contextual variables about each House race, we estimate how each group responds to candidate experience and candidate ideology.
Our outcome is a variable that captures the self-reported vote choice of each respondent in their Congressional race. This variable takes a value of 1 if the respondent voted for the Democratic candidate, 0 if they voted for the Republican, and 0.5 if they abstained or supported a third-party candidate.
Because our independent variables could potentially influence turnout, we do not drop abstainers because this could induce bias. Instead, we code abstention and supporting a third-party candidate as being half way between voting for the Democratic and Republican candidates. We do this out of substantive interest because this trichotomous variable captures the extent to which each voter contributes to the vote margin or the two-party vote share. Therefore, our subsequent results tell us about the extent to which our independent variables ultimately influence election results through both turnout and vote choice. In Appendix E, we present results from additional analyses that use turnout and vote choice conditional on turnout as separate dependent variables.
To measure the ideological character of each contest, we compute the midpoint of the CF scores (Bonica Reference Bonica2014) of the two major candidates. Because higher CF scores correspond to more conservative policy positions, a higher midpoint means that the Democrat is more centrist than normal, the Republican is more conservative than normal, or some combination of the two. If moderation is electorally beneficial for a party or candidate, we should see Democratic support increase as the midpoint increases. We rescale midpoints so that the 5th percentile is 0 and the 95th percentile is 1 so that coefficients can be interpreted as the effect of shifting from a situation in which the candidate ideologies favor the Republican to a situation in which the ideologies favor the Democrat.
To capture the electoral advantage of a more experienced candidate and incumbency, we code an experience variable 1 if the Democratic candidate has previously held elective office but the Republican candidate has not, 0 if the Republican has held office but the Democrat has not, and 0.5 if neither or both have held office. We code an incumbency variable 1 if the Democratic candidate is an incumbent, 0 if the Republican candidate is an incumbent, and 0.5 for an open-seat race.
To estimate heterogeneity in response to ideology, candidate experience, or incumbency by type, we regress the vote choice variable on indicators for each type, the contextual variable, and the interaction between contextual variable and the type indicators. Coefficients on the interaction terms tell us the extent to which that type responds differently relative to an omitted category.
Our simplest specification includes election-year fixed effects to account for the fact that some years are better for Democrats or Republicans. In a second specification, we add district fixed effects to account for the fact that some districts are generally more Democratic or Republican than others. In our most demanding specification, we include district-year fixed effects, which account for idiosyncratic differences across different Congressional contests that affect all types equally. District-year fixed effects subsume the main effect associated with ideology or experience, but we can still identify the interactive coefficients from cases where multiple respondents of different types answered a survey in the same district and year.
Results on Selection and Accountability
Table 4 presents the results of these analyses. To keep the table compact, we separate each contextual variable into trios of columns and indicate that contextual variable with an “X” in the rows. So, for column one, the X coefficient of 0.2 is the average effect of the ideological midpoint on vote choice for Liberals because Liberals are the omitted category. The interaction coefficients tell us how much more or less each group responds to the ideological midpoint relative to Liberals.
How Do Different Types Respond to Candidate Characteristics?
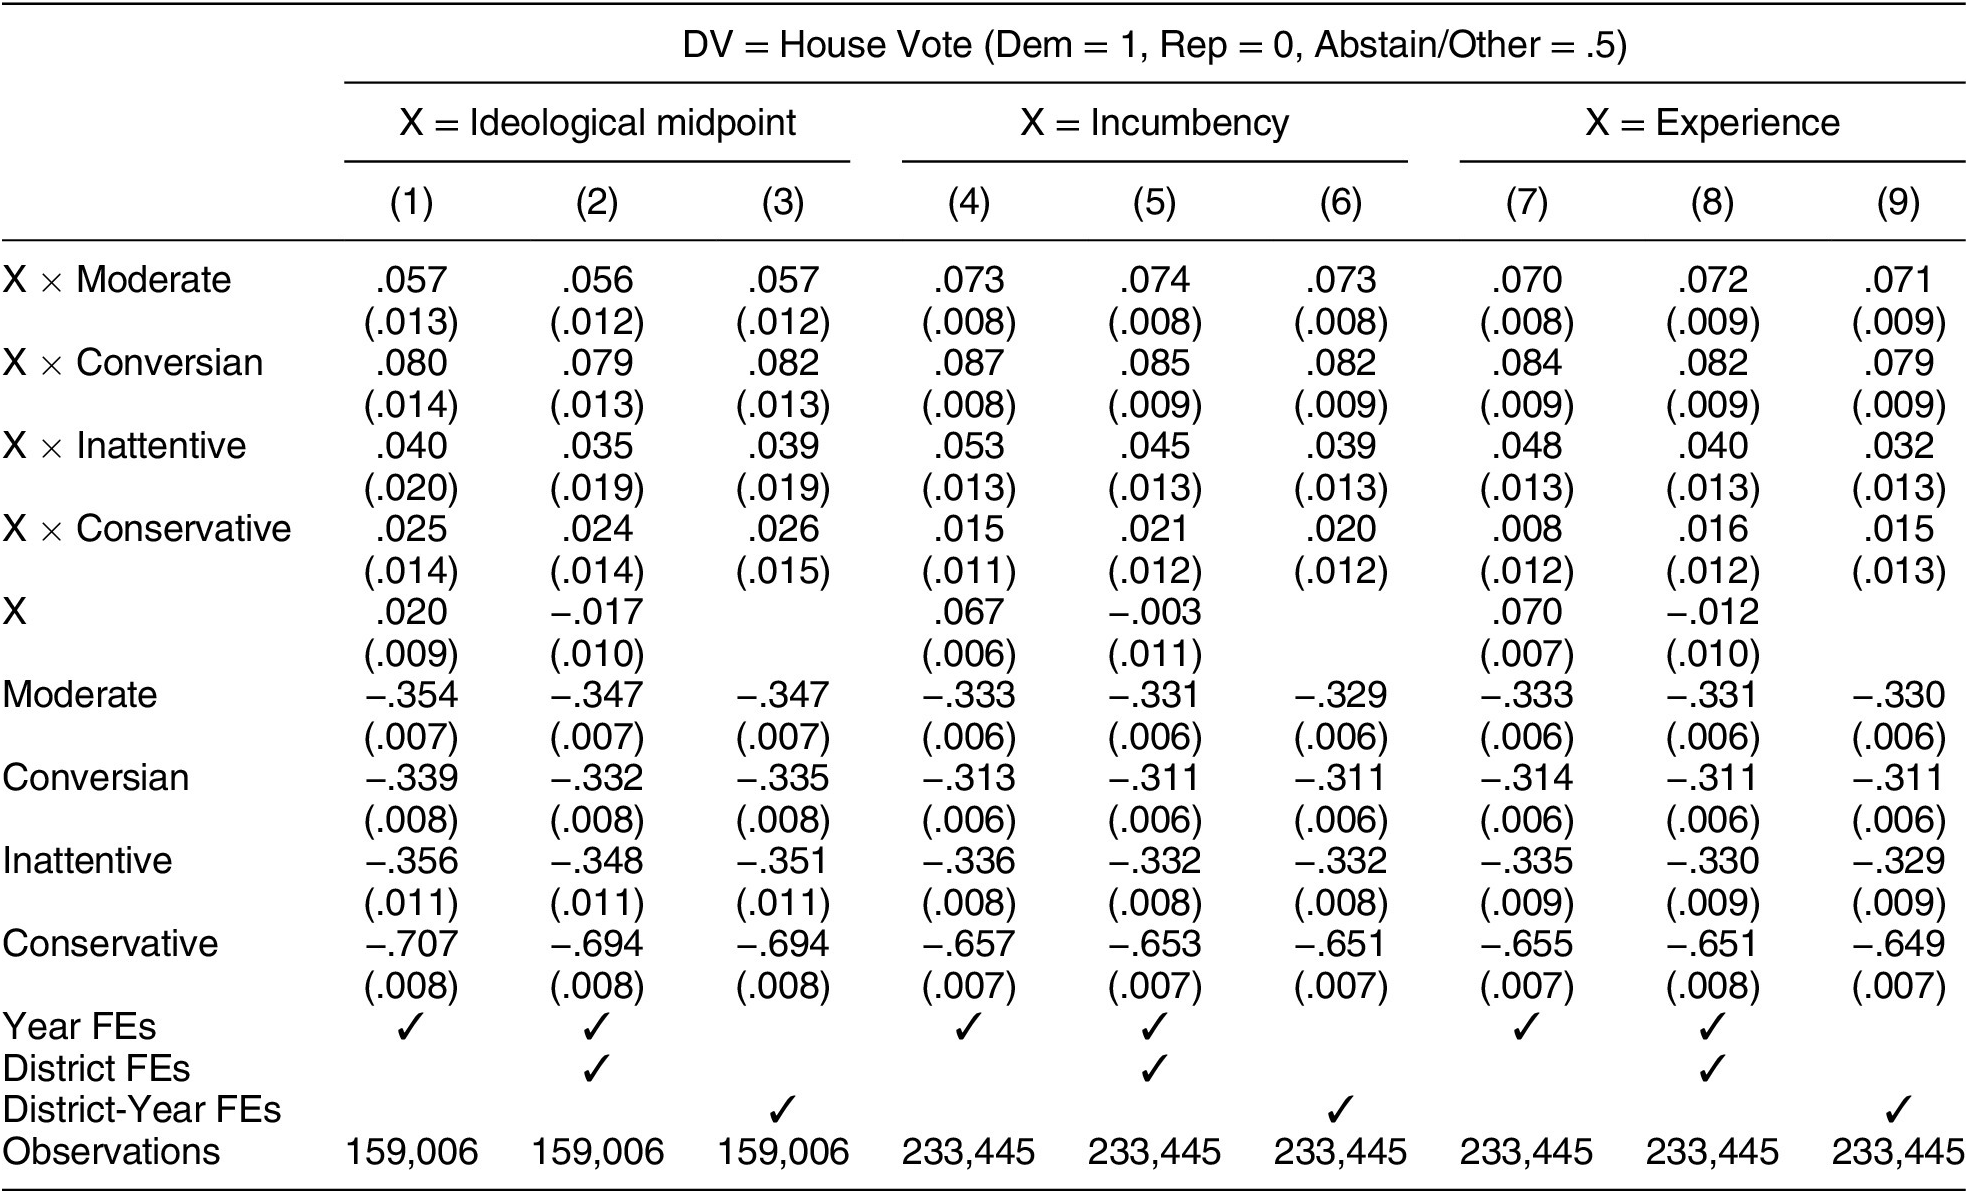
Note: District-clustered standard errors in parentheses. Liberals are the omitted category.
We find that Downsian moderates and Conversians are notably more responsive to the ideological positions, candidate experience, and incumbency of candidates than those of the other three types. The point estimates indicate that Conversians are most responsive, followed closely by Downsian moderates.
Although inattentive respondents are less responsive than moderates and Conversians, we find that they are still more responsive than are liberals and conservatives. This may be surprising for several reasons. First, if inattentive respondents are giving meaningless answers to policy questions, perhaps we should not trust them to honestly report their voting behavior. Second, if these respondents are inattentive to political surveys, perhaps we would expect them to also be inattentive to the characteristics of political candidates. On the other hand, it may be easier for respondents to report how they voted than it is to answer policy questions. That someone is inattentive to policy questions in a survey does not necessarily mean they are inattentive to politics in general or unable to use cues. Indeed, many political behavior scholars have argued that relatively unsophisticated voters observe candidate characteristics and performance and vote accordingly (see, e.g., Campbell et al. Reference Campbell, Converse, Miller and Stokes1960; Wattenberg Reference Wattenberg1991). These results suggest that, although some survey respondents give unpredictable answers to policy questions, many participate in elections and contribute to electoral selection and accountability.
Because nearly half of our respondents are classified as Conversians or moderates and because their vote choice is most responsive to candidate context, this suggests that in our current political landscape Conversians and moderates drive electoral selection and accountability. Previous work has found that candidates benefit from ideological moderation (e.g., Ansolabehere, Snyder, and Stewart Reference Ansolabehere, Snyder and Stewart2001; Canes-Wrone, Brady, and Cogan Reference Canes-Wrone, Brady and Cogan2002; Hall Reference Hall2015; Tausanovitch and Warshaw Reference Tausanovitch and Warshaw2018). Our results suggest it is centrist voters who drive the relative success of centrists, incumbents, and experienced candidates.
Our analysis accounts for the possibility that response to candidate characteristics operates through turnout because abstention is included in the coding of our outcome variable. That is, if potential voters stay home when presented with moderate or extreme candidates, or are more likely to come out and vote for candidates with experience, our results would reflect that responsiveness.
The differences we detect across groups are statistically significant and substantively large. For example, as we move from a contest with an experienced Republican facing an inexperienced Democrat to a contest with an inexperienced Republican facing an experienced Democrat, moderates and Conversians increase support for the Democratic candidate by 7–8 percentage points more than do liberals. Similarly, as we move from an election with a particularly moderate Republican and a particularly extreme Democrat to an election with an extreme Republican and moderate Democrat, moderates and Conversians increase their support for the Democratic candidate by 6–8 percentage points more than do liberals.
Conclusion
Conventional wisdom holds that American voters are polarized and hyperpartisan. Yet when scholars look at survey data, we find response patterns that look neither polarized nor hyperpartisan. Early in the 2000s, scholars noted that most Americans give a mix of liberal and conservative responses on surveys and few are consistently and firmly on one side of the aisle (e.g., Fiorina, Abrams, and Pope Reference Fiorina, Abrams and Pope2005). Ten years later, Hill and Tausanovitch (Reference Hill and Tausanovitch2015) found no increase in the share of Americans with extreme policy ideology over time when scaling individuals using the approaches that have been used to scale candidates and elected officials.
One response to the evidence demonstrating a healthy group of centrist voters has been that surveys are notoriously error prone and people look moderate because they are not paying close attention to the questions or don’t know very much about politics (Kinder and Kalmoe Reference Kinder and Kalmoe2017). A second response is that public opinion is poorly described by a single dimension (e.g., Treier and Hillygus Reference Treier and Hillygus2009). If some respondents are extreme liberals on half the issues and extreme conservatives on the other half, scaling techniques could wrongly conclude that these individuals are centrists (Broockman Reference Broockman2016). These are surely possibilities, yet little work has quantitatively decomposed moderates using existing surveys to understand the meaning of a centrist classifications.
In this paper, we provide such a method. We take head-on the serious challenges to classifying moderates with survey data by separating respondents who are well described by a single-dimensional spatial model from those who might have no opinions and those who might hold idiosyncratic but real policy views. Our technique is applicable to any existing survey dataset with a relatively balanced collection of at least 20 issue questions. It allows us to paint a more vivid picture of respondents to political surveys that report moderate-looking policy views and to better understand how those who are not ideologues make sense of and influence our politics.
We find there are many genuine moderates in the American electorate. Nearly three in four survey respondents’ issue positions are well described by a single left–right dimension, and most of those individuals have centrist views. Furthermore, these genuine moderates are a politically important group. Their votes are most responsive to the ideologies and qualities of political candidates.
We also find evidence that around one in five Americans has genuine policy preferences that are not well summarized by a single dimension. These individuals, too, contribute to electoral selection and accountability by responding to candidates in a manner similar to that of spatial moderates. Whether someone appears moderate because they are genuinely in the middle on most issues or because they hold an idiosyncratic mix of liberal and conservative positions, the implications for political outcomes are similar: nonliberals and nonconservatives are more responsive to candidate ideology and professional experience than are their ideological counterparts.
These Conversians, who have genuine policy preferences that are not well summarized by the single dimension, merit further investigation. Future work might look to see how candidates and campaigns contact or attempt to persuade such voters. It may also be fruitful to try to estimate underlying patterns to Conversian policy views across issues. These voters might be particularly relevant for election-to-election shifts in outcomes because political context or party rhetoric pushes the balance of their conflicted policy considerations from supporting one party to the other. It will also be interesting to uncover how these voters interact with party politics such as participation in primary elections.
We estimate that a small number of survey respondents are providing answers that appear to come from no underlying pattern whatsoever. Future research may be able to use our approach to study these individuals in more detail. Perhaps survey methodology could be improved in order to minimize the share of inattentive respondents or understand whether these kinds of respondents lack meaningful positions or simply aren’t paying attention to survey questions.
Our findings contribute to a growing literature suggesting that to the extent that elected officials are polarized, it is likely not attributable to mass voting behavior (e.g., Hall Reference Hall2019; Hill and Tausanovitch Reference Hill and Tausanovitch2015). We provide microfoundations for the finding that moderate and experienced candidates tend to perform better in Congressional elections, on average. We find that the electoral returns to moderation and experience are especially driven by Downsian moderates and Conversians.
Our analysis points to a need for renewed interest in and study of the middle in American politics and provides a method and framework for doing so. Many Americans are not partisan or ideologically extreme, and these individuals are especially important for political accountability and candidate selection. To best understand representation through elections in American politics, we must look to the moderates.
SUPPLEMENTARY MATERIALS
To view supplementary material for this article, please visit http://doi.org/10.1017/S0003055422000818.
DATA AVAILABILITY STATEMENT
Research documentation and data that support the findings in this study are openly available at the American Political Science Review Dataverse: https://doi.org/10.7910/DVN/THU75A.
ACKNOWLEDGMENTS
We are grateful to the editors and anonymous reviewers for feedback. For helpful comments we also thank Scott Ashworth, Chris Berry, David Broockman, Ethan Bueno de Mesquita, Lucas de Abreu Maia, Wiola Dziuda, Andy Hall, Eitan Hersh, Greg Huber, Stephen Jessee, Yanna Krupnikov, Ben Lauderdale, and Neil Malhotra. We are also grateful to the seminar/conference participants at the 2020 Meeting of the American Political Science Association, the University of Chicago, and at Harvard University. This collaboration and idea was the result of a 2019 retreat funded by the Marvin Hoffenberg Chair in American Politics and Public Policy at UCLA. We thank the Hoffenberg family for their support.
CONFLICT OF INTEREST
The authors declare no ethical issues or conflicts of interest in this research.
ETHICAL STANDARDS
The authors affirm that this research did not involve human subjects. This research was completed through secondary analyses of publicly available data.


 Open access


Comments
No Comments have been published for this article.