

Implications
The Meat Standards Australia (MSA) Index was developed for producer feedback systems to rank the potential eating quality of beef carcasses. The MSA Index was calculated as the sum of the predicted eating quality scores for the 39 MSA cuts weighted by their relative proportion of total cut weight, from achilles hung carcasses aged for 5 days postmortem. The MSA Index provides a simple tool for producers to monitor the impact of management and genetic changes on the eating quality of each carcass. The beef industry can also use the index to benchmark eating quality across producers, regions and years.
Introduction
The MSA beef grading model provides a tool to predict the eating quality of individual cuts in the beef carcass from commercial inputs available at grading. The development of the MSA model entailed conducting a large number of consumer taste panels using beef cuts from across the carcass prepared using a number of different cooking methods (Polkinghorne et al., Reference Polkinghorne, Thompson, Watson, Gee and Porter2008b; Watson et al., Reference Watson, Polkinghorne and Thompson2008a). The consumer taste panels scored samples of beef for tenderness, juiciness, liking of flavour and overall acceptability and graded the sample. The sensory scores were weighted and combined into a composite eating quality score (MQ4 score) which was originally calculated by weighting the four sensory scores for tenderness, flavour, juiciness and overall liking obtained using a linear discriminant analysis (Watson et al., Reference Watson, Polkinghorne and Thompson2008a and Reference Watson, Gee, Polkinghorne and Porter2008b). Multiple regression functions using commercial carcass inputs were then developed to predict the MQ4 score for specific cuts over a wide range of production, processing and value adding systems. At present, the MSA beef grading model provides predicted MQ4 scores for 39 individual cuts after a defined ageing period, prepared using one of eight different cooking methods per cut.
A set of national boning groups were set up as an attempt to simplify the output from the MSA model for the processor (Thompson et al., Reference Thompson, Polkinghorne and Griffith2012). Boning groups were designed to allocate carcasses to groups which achieved a minimum quality standard for all cooking options for a particular cut. In effect this meant that carcasses were allocated to a boning group where all cut/cook options met the lowest quality requirements. Meat Standards Australia set up a total of 18 national boning groups for achilles hung and tenderstretch carcasses. Given the wide variety of carcasses produced in Australia (i.e. high and low Bos indicus content along with hormone growth promotant (HGP) treated and non-implanted carcasses), the national boning groups resulted in a very inefficient cut harvesting system. This was because boning groups described the eating quality of each cut relative to the worst cut in that boning group, which when applied to all cooking methods resulted in boning groups being an insensitive measure to describe carcass quality (McGilchrist et al., Reference McGilchrist, Pethick and Ball2012). The output from the national boning groups was also difficult to interpret as there was not a standard incremental shift in eating quality between boning groups further compounded by differences in cut MQ4 relativity across cattle genotypes and with HGP use. Inadvertently, some processors started to include the boning groups into payment schedules, which resulted in mixed signals to producers. More recently MSA have initiated plant specific boning groups which relate to the cuts and cooking methods being harvested to increase the efficiency of harvesting cuts of similar eating quality. The net result was that boning groups at a national or plant specific level provide questionable benefit for producers as a feedback tool.
The Australian beef industry required a simple measure or index of potential carcass eating quality to allow producers to monitor the impact of genetic and environmental changes on eating quality. Until recently, carcass feedback to producers was largely in the form of individual carcass inputs used in the MSA model. Unfortunately, the impacts of these traits on eating quality are often non-linear and the relationships between traits and eating quality are complex, thus feedback of individual carcass traits did not present any clear pathway for producers to improve eating quality. Similarly given the interactions between cuts and carcass traits, there was no single indicator muscle that can be used to accurately predict eating quality (Polkinghorne, Reference Polkinghorne2005).
A simple eating quality index was required to accurately reflect small variations in overall eating quality of cuts within the carcass. To be useful for producers, the MSA Index should also not be affected by post farm gate factors, such as carcass suspension method, ageing time and cooking method. Rather it needed to provide an eating quality score that was simply a function of the on-farm production and management factors. Input traits such as ultimate pH are complex and can be impacted by production, transport, lairage and processing factors (Ferguson et al., Reference Ferguson, Bruce, Thompson, Egan, Perry and Shorthose2001). For simplicity a producer quality index should also assume a constant hang method, days of postmortem ageing, pH and muscle temperature.
The objective of this study was to produce a simple quality index score that accurately summarised the predicted MSA eating quality scores which were generated for 39 muscles across the carcass. Such an index could be used to monitor changes in eating quality from either management practises (such as HGP implants or changing Bos indicus content), or genetic and environmental changes in traits such as carcass weight, marbling, fatness and growth. As a prerequisite for calculating the MSA Index, there was a need to describe the distribution of MSA cuts across the carcasses.
Material and methods
Animals
A total of 40 Angus steers from the New South Wales Department of Primary Industries high and low muscling lines and also a line which were heterozygote for the myostatin gene were slaughtered and the left side of each carcass broken into the 39 trimmed MSA cuts. The muscling line herds had been selected for high and low muscling scores since 1997, whereas the myostatin line originated from a commercial herd which had been formed in 2005 using a combination of within line selection and industry animals which were heterozygote for the mutated mysostatin gene (Cafe et al., Reference Cafe, McKiernan and Robinson2015). These cattle were selected for this study to ensure inclusion of a muscling range that represented the majority of commercial Australian cattle.
Details on both the formation of the high and low muscling lines and the mysotatin line were provided by Cafe et al. (Reference Cafe, McKiernan and Robinson2015). Briefly, within the high muscling line, replacement bulls and females were selected for high subjective live muscle score at weaning based on the thickness and convexity of the body relative to the skeletal size of the animal, adjusted for subcutaneous fat (Elliot et al., Reference Elliot, Gahan and Sundstrom1987; McKiernan, Reference McKiernan1990). Conversely within the low muscling line, replacement bulls and females were selected for low muscling score at weaning. Within the myostatin line, replacements bulls and heifers were sourced from both within the line and from industry to be heterozygote for the myostatin gene. Live animal muscling was scored at weaning on a 15 point scale, with a score of 15 representing heavily muscled European type breeds and a score of 1 representing poorly muscled or dairy type animals.
The 40 steers were slaughtered off pasture. During dressing, no external fat was trimmed from the left side of each carcass. Carcass sides were placed in a chiller overnight and pH temperature declines were conducted to ensure that carcasses reached pH 6 between 15°C and 35°C. At grading, the left side was quartered at the 12/13th rib with a square cut across the eye muscle. The left side was MSA graded (Polkinghorne et al., Reference Polkinghorne, Philpott, Gee, Doljanin and Innes2008a and Reference Polkinghorne, Thompson, Watson, Gee and Porter2008b) and later boned into 15 boneless primals. The boneless primals were described by the AUSMEAT Handbook of Australian Meat (HAM) codes (AUS-MEAT, 2005). These primals were not trimmed of any subcutaneous or intermuscular fat. The untrimmed primals were placed in vacuum bags, tagged, chilled and transported to the University of New England for computed tomography (CT) scanning and for further processing.
Primals
All untrimmed primals were CT scanned using a Picker CT scanner (Picker, Bavaria, Germany) to enable estimation of percent fat and lean using previously defined scanning protocols (Anderson et al., Reference Anderson, Williams, Pannier, Pethick and Gardner2015).
The eight hindquarter cuts comprised a one rib striploin (HAM 2140), full tenderloin (HAM2150), thin flank (HAM 2200), rump (HAM 2090, bone removed), topside (HAM 2000), silverside (HAM 2020) and hindquarter shin (HAM 2360).
The seven forequarter primals were collected without sawing the ribs. The inside skirt (m. transversus abdominis) was removed along with the diaphragm. The forequarter primals comprised brisket (HAM 2320, defined caudally by a cut 100 mm dorsal from the junction of the 12th rib and the costal cartilage to the cranial junction of the first rib with the sterum), the ribset (HAM 2220) and chuck (HAM 2260) were separated by a cut between the 5th and 6th rib hard up against the 5th rib. The foreshank (HAM 2360), blade (HAM 2300 with m. subscapularis included) and chuck tender (HAM 2310) were also removed. Intercostals (HAM 2430) were trimmed from between the rib vertebrae.
Meat Standards Australia cuts
The primals were weighed and broken into the 39 MSA cuts. The 39 cuts which are used in the MSA model comprise the majority of individual muscles that can be dissected and sold as entities at retail. The 39 cuts comprised approximately 74% of the total lean in the side calculated using CT of the primals.
The MSA cuts were trimmed of all subcutaneous and intermuscular, fat and weighed with the initial weight of the primal checked against the sum of the components. The nomenclature for the trimmed MSA cuts used a three alphabetic/three numeric code based on the common primal name followed by the three numeric characters based on the numbers assigned to individual muscles by AUS-MEAT (2005). For example, the m. biceps femoris portion from the rump primal was written as RMP005. Exception were the extensor/flexor muscles of the hind- and fore-shin, which were written as HQShin and FQShin, respectively.
The striploin (HAM 2140) was trimmed to the m. longissimus thoracis et lumborum and equally divided into anterior (STA045) and posterior (STP045) portions. The full tenderloin (HAM 2150) was separated into the mm. iliacus (TDR034) and psoas major (TDR062). The rump (HAM 2090) was broken into five muscles comprising the head and body of the m. gluteus medius (RMP131 and RMP231, respectively), the head of the m. biceps femoris (RMP005), the mm. gluteus profundus (RMP032) and tensor fascia latae (RMP087). The thin flank (HAM 2090) was separated into three muscles comprising the mm. obliquus externus abdominis (TFL051), obliquus internus abdominis (TFL052) and rectus abdominis (TFL064). The topside (HAM 2000) was separated into three muscles comprising mm. adductor femoris (TOP001), graciluis (TOP033) and semimembranosus (TOP073). The knuckle was separated into four muscles comprising mm. rectus femoris (KNU066), vastus intermedius (KNU098), vastus lateralis (KNU099) and vastus medialis (KNU100). The silverside (HAM 2020) was separated into three muscles comprising mm. biceps femoris (OUT005), gastrocnemius (OUT029) and semitendinosus (EYE075). Finally the extensor/flexor muscles of the hindshin were removed as a composite muscle (HQShin).
The brisket (HAM 1320) was separated into the two muscles comprising the mm. pectoralis profundus (BRI056) and the pectoralis superficialis (BRI057). The ribset (HAM 2220) was separated into two muscles comprising the mm. spinalis dorsi (SPN081), longissimus thoracis (CUB045) and a portion of the m. latissimus dorsi (RIB041). The blade (HAM 2300) was separated into three muscles comprising the mm. infraspinatus (OYS036), triceps brachii caput longum (BLD096), subscapularis (BLD084) and a portion of the m. latissimus dorsi (RIB041). The chuck (HAM 2260) was separated into five muscles which comprised the mm. rhomboideus (CHK068), semispinalis capitis (CHK074), serratus ventralis cervices (CHK078), spinalis dorsi (CHK081) and the splenius (CHK082). The chuck tender (HAM 2310) comprised the (CTR085). The intercostals (HAM 2430) comprised the mm. intercostales externus and internus from between the ribs. The forshin (HAM 2360) comprised the flexor muscles (FQShin) of the forelimb.
Statistical analysis
The 39 MSA cut weights were expressed as percentages of the total weight of the MSA cuts. Live animal, carcass traits and MSA cut percentages were analysed in a series of univariate generalised linear models (SAS, 2001) for each MSA cut which contained a fixed effect for the three muscling treatment lines (low, high and myostatin).
Results and discussion
Mean live animal and carcass traits for the three muscling lines are shown in Table 1. The three muscling lines had similar mean live and carcass weights (P>0.05). The live muscle scores recorded at weaning showed a large divergence between the lines (P<0.05) with the low line having a mean live muscling score of 4.6, and the high line a mean live muscling score of 8.8 on a 15 point scale. The range between the high and low muscling score lines was greater than four muscling categories which was equivalent to C+ to D on the scale used by the Australian National Livestock Language (Anon, 1994). The mean muscling score of the myostatin steers was higher than the high muscling group with a live muscling score of 10.7 (P<0.05, Table 1), close to a B muscle score.
Live weight and carcass traits means for the three beef cattle muscling lines

NS=no significant difference.
***P<0.001; *P<0.05.
Data on live muscling scores of Australian cattle population are difficult to find. In an early study, Anon (nd) reported a mean muscling score of 8.6 for 2000 steers processed through saleyards in northern NSW. Using the mean and variance from this sample, the low line were 1.8 SD lower than the population mean, whilst the high line were 0.4 SD higher than the population mean.
In effect, the three muscling lines used in this study provided a wide range in live muscle scores which would be as great or greater than exists in the commercial mix of breeds produced in Australia. However, whilst there were large differences in live muscling scores between the lines, there was little difference in mean ossification scores and ultimate pH values (P>0.05). Mean marbling scores were similar for the high and low muscling groups, although the myostatin group had lower marbling scores (P<0.05, Table 1), which was consistent with the review by Fiems (Reference Fiems2012). There was a similar trend for rib fat depth to be lower in the myostatin line.
Meat Standards Australia cut distribution
Previous studies on muscle distribution in beef carcasses have either dissected whole muscles, muscle groups (Berg and Butterfield, Reference Berg and Butterfield1976) or muscle within primal cuts (Cundiff et al., Reference Cundiff, Gregory, Koch and Dickerson1969). Therefore, data from previous studies were not suitable to develop the MSA Index because the 39 MSA cuts often have portions of the same muscle in different cuts. For example, the m. longissimus thoracis et lumborum forms part of the cube roll (CUB045) and the anterior and posterior portions of the striploin (STA045 and STP045). For some MSA cuts, not all of a muscle is necessarily dissected during preparation. In those studies where commercial cuts were used, generally the primals were simply separated into muscle, fat and bone which was not suitable for quantifying the weight of individual MSA cuts across the carcass.
The distribution of trimmed MSA cuts between the three lines is shown in Table 2. Nine of the 39 MSA cuts showed a significant difference (P<0.05) between lines for the proportion of muscle in the cut. In every instance, the significance of the line effect was due to the myostatin line differing from either the high or low muscling line, or in some cases both lines. The three hindquarter cuts which comprised a significantly (P<0.05, Table 2) higher proportion in the myostatin line compared to the high/low lines were the RMP087, TFL051 and TOP001 (P<0.05, Table 2). The TFL052 and KNU098 had lower proportions in the myostatin line compared to the high/low lines (P<0.05, Table 2). The four forequarter cuts which showed lower proportions of muscle in the myostatin line compared with the high/low muscling lines comprised the OYS036, CHK08, FQshin and CTR085 (P<0.05, Table 2).
Percentage distribution of Meat Standards Australia (MSA) cuts from beef carcasses in the low and high muscling selection lines, and also the myostatin line

NS=no significant difference.
a,bDifferent superscripts within a row indicate that means were significantly different.
*P<0.05; **P<0.01.
These differences in muscle proportions were difficult to align with other studies which generally grouped individual muscles into anatomical muscle groups for ease of interpretation (Berg and Butterfield, Reference Berg and Butterfield1976). Whilst there were only nine cuts that were significantly different in this study, there was a general trend whereby some of the larger hindquarter cuts identified as hypertrophic in double muscled carcasses (Arthur, Reference Arthur1995; Pabiou et al., Reference Pabiou, Fikse, Nasholm, Cromie, Drennan, Keane and Berry2009) showed a trend for greater proportions of muscle in this study. When cumulated across the forequarter and hindquarter the myostatin group had 54.8% of the musculature in the hindquarter compared to 54.1% in the low or high muscling lines.
Data from this study showed that there are no differences in MSA cut distribution in carcasses which varied widely in muscling score, except if the carcasses carried a copy of the mutated myostatin gene. The potential impact of breed or sex on muscle distribution has been the focus of a great deal of research over the past 50 years. The conclusion from these studies was that whilst cattle breeds differ widely in size and shape, there was little difference between breeds in muscle distribution (Berg and Butterfield, Reference Berg and Butterfield1976). The major changes in muscle distribution occur soon after birth when the functional demands of adjusting to the postnatal environment are substantial. These largely occur in the pre-weaning period so that post-weaning changes in muscle distribution are relatively stable with only small changes occurring with further increases in carcass weight (Berg and Butterfield, Reference Berg and Butterfield1976). Shahin et al. (Reference Shahin, Berg and Price1993) examined muscle distribution in different breeds and sexes and whilst some breed differences were reported, they were generally small and when present were generally aligned with differences in stage of maturity. Sex differences in muscle distribution tend to become greater in entire males after attaining maturity (Berg and Butterfield, Reference Berg and Butterfield1976) with only small differences between steers and females. Berg and Butterfield (Reference Berg and Butterfield1976) concluded that muscle distribution in a carcass was largely a result of the functional stresses placed on the musculature of the live animal. As all cattle undertake similar activities like walking, standing and lying down, it was therefore not surprising that between breed differences in muscle distribution were relatively small. Thus it was decided that mean muscle proportions for MSA cuts for the high and low muscling lines combined (Table 3) would be used as a basis for calculation of the MSA Index.
The average percentage distribution for the high and low beef cattle muscling lines for the 39 Meat Standards Australia (MSA) cuts with the commonly used cook methods (GRL=grill, SFR=stir fry, SC=slow cook and RST=roast) for each cut

Construction of the Meat Standards Australia Index
The MSA Index was calculated as the sum of the predicted MQ4 scores for the most commonly used cooking methods for the 39 MSA cuts, each weighted for the average distribution of that cut from the high and low muscling lines. A number of MSA model inputs relate to treatments applied post the farm-gate. To enable standardised index reporting to producers over time and across supply chains and abattoirs these inputs were standardised. As achilles or tenderstretch carcase suspension was controlled by the processor the MSA Index was calculated assuming all carcasses were achilles hung (the most common method in Australia>85%). Muscle/cut ageing is under the control of the processor, wholesaler or retailer, and therefore it was decided that the MSA Index be calculated using MQ4 scores for the 39 muscles aged for 5 days as this was the earliest that MSA product can be sold at retail (Watson et al., Reference Watson, Polkinghorne and Thompson2008a). Furthermore as ultimate muscle pH is a function of both production and processing factors variation in ultimate pH cannot be solely attributed to production factors. pH was therefore held constant pH of 5.6 and a temperature at grading of 7oC. The MSA model predicts eating quality for individual MSA cuts for a range of cooking methods (up to eight per muscle). Inherent in any calculation of an MSA Index, cooking method for every MSA cut had to be defined. The most common cooking methods were defined for each cut (Table 3).
The MSA Index was designed as a feedback tool to allow producers to monitor changes in carcass eating quality, and to evaluate the eating quality impact of management decisions. As such it can be used by producers to monitor genetic or environmental changes in carcass quality. The MSA Index could also be used by industry to monitor progress made in eating quality within production systems, regions or nationally over time.
From Table 3 the mean percentage distribution of the 39 MSA cuts was 2.56% with a SD of 1.64. The CV for percentage cut distribution was very high at 63%. In effect there was a 22-fold difference in cut percentage from the OUT005 (which was the largest MSA cut at 7.4% of the total cut weight) to the RMP034 (which was the smallest MSA cut at 0.3% of total cut weight). This large variation in percentage distribution meant that it was important that the MSA Index be weighted for muscle percentages rather than simply just the mean of all MQ4 scores from the 39 MSA cuts. The sample of carcasses from the high and low muscling lines were all Bos taurus steers with no HGP implants and a relatively small range in carcass weight, fatness (both marbling scores and ribfat) and ossification scores (see Table 1). As such there was relatively small range in the MQ4 scores predicted using the MSA model. Therefore, there was little difference in the relative ranking of a quality index calculated using either weighted or unweighted MQ4 scores. However, in a wider population which incorporated a greater variation in Bos indicus content, HGP treatment, carcass weight range, marbling and ossification scores, weighting the individual MQ4s for cut percentage would become important.
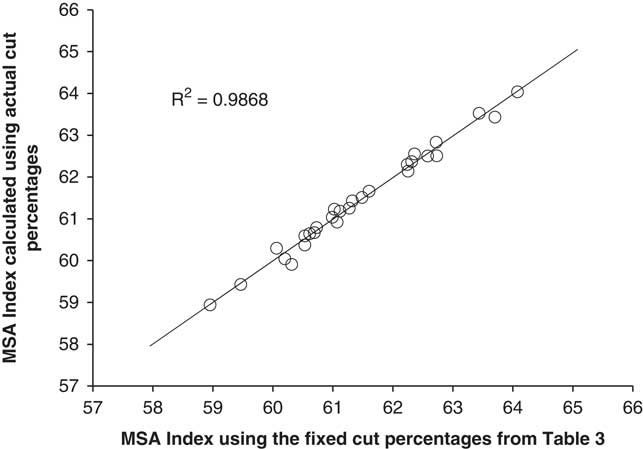
There were several questions that had to be asked in the development of the MSA Index. First, was there any loss in accuracy in calculating the MSA Index using fixed muscle percentages for the 39 cuts compared to the actual cut percentages for each MSA cut. Figure 1 showed this relationship between the MSA Index calculated using the actual individual animal muscle percentages v. the fixed cut percentages listed in Table 3. The resultant relationship was very strong (R 2=0.99) indicating that there was little loss in precision in calculating the MSA Index using fixed cut percentages, even though there was a large difference in live muscling scores between the lines.
The Meat Standards Australia (MSA) Index for beef carcasses calculated using 39 fixed cut percentages as a function of the MSA Index calculated using 39 actual mean cut percentages listed in Table 3.
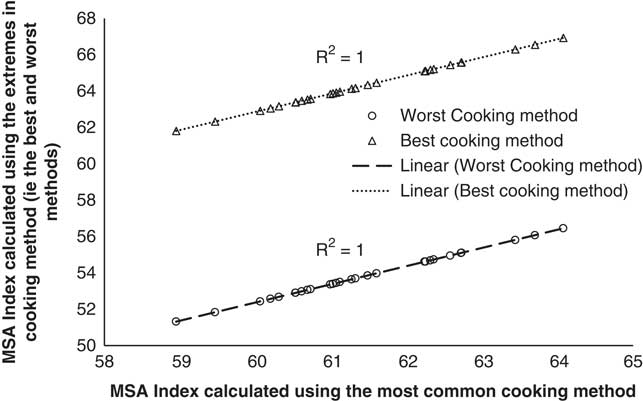
The second question to be resolved was how much the MSA Index varied because of the specific cooking methods selected in Table 3. To quantify this, the MSA Index was calculated using the fixed cut proportions for the most common cooking method along with the MSA Index calculated using either the best or worst cooking methods for each cut (Figure 2). The effect of cooking method was clear in that using the best, or the worst, cooking method had a large effect on the intercept but zero effect on the slope of the regression. In both regressions shown in Figure 2, the relationship between the MSA Index calculated using the most common cooking method as a function of the MSA Index calculated using the either the best or worst cooking method was extremely high with coefficients of determination rounding to 1.0. In other words, in calculating the MQ4 score for different cooking methods, the MSA model used different intercepts for the different cooking methods. The difference between the best and worst cooking methods when used in a weighted MSA Index was 10.5 MQ4 points. Given this was a constant offset, an MSA Index could be adjusted to describe any combination of cooking methods. Hence it does not matter which cooking methods were used to calculate the MQ4 values as the changes in the MSA Index will be similar for any combination of cooking methods, and effective providing a constant combination is adopted.
The Meat Standards Australia (MSA) Index for beef carcasses calculated using the 39 fixed cut percentages for the best and worst cooking methods as a function of the MSA Index calculated using the 39 fixed cut percentages for the most common cooking methods.
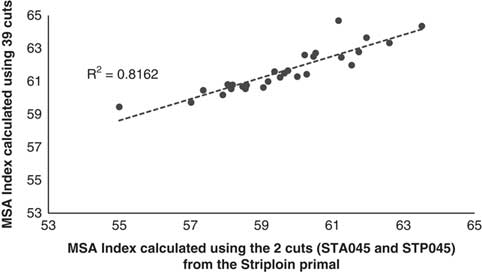
A third question that arises in the usefulness of the MSA Index to describe carcass quality if only one or a selected number of cuts were being harvested from the carcass. This was addressed by graphing the MSA Index calculated using the 39 MSA cuts against an MSA Index calculated using only the striploin cuts (Figure 3, STA045 and STP045) and the higher value sweet cuts (Figure 4, which comprised the tenderloin TDR062, TDR032, cube roll SPN081, CUB045, striploin STA045, STP045 and rump RMP131, RMP231, RMP005, RMP087, RMP032). Even though there was little variation in the input parameters, there was a substantial decrease in the relationship between the full MSA Index calculated using only the striploin cut (Figure 3, R 2=0.81). If the number of cuts was increased to include the tenderloin, striploin, cube roll and rump cuts the accuracy was improved (Figure 4, R 2=0.98). However it should be noted that the carcasses in the current data set were all weaned Bos taurus steers consigned directly to the abattoir without a HGP implant so even though the relationship between the MSA Index calculated using the 39 cuts and one calculated using only the sweet cuts was high this may not be the case with more variable industry data sets.
The Meat Standards Australia (MSA) Index for beef carcasses calculated using only the anterior striploin (STA045) and posterior striploin (STP045) cuts as a function of the MSA Index calculated using the 39 fixed cut percentages.

The Meat Standards Australia (MSA) Index for beef carcasses calculated using only the loin and rump cuts (which comprised the tenderloin TDR062, TDR034, striploin STA045, STP045, cube roll CUB045, SPN081 and rump RMP131, RMP231, RMP005, RMP087, RMP032 primals) as a function of the MSA Index calculated using the 39 fixed cuts percentages.

Conclusion
The MSA beef grading model predicts eating quality for 39 muscles in the carcass prepared using up to eight different cooking methods. Previously, beef producers were only provided feedback for the individual carcass traits collected at grading or boning groups. Given the complex relationships between individual carcass traits and eating quality, it was extremely difficult for producers to make use of this data. Similarly, given the interactions between the eating quality of cut and carcass traits, there was no single indicator muscle that could be used to accurately reflect change in eating quality across the musculature of the carcass. This study showed that carcasses derived from animals with widely differing live muscling scores had a similar distribution of MSA cuts across the carcass musculature. An exception were carcasses that were heterozygote for the mutated myostatin gene which showed a slightly different distribution in nine muscles. This laid the foundation for using the mean percentage distribution of MSA cuts from the high and low live muscling score lines to weight the eating quality scores for the 39 MSA cuts. The sum of the eating quality scores weighted for their cut proportions provided a useful index to assess potential eating quality of the carcass. When the MSA Index was calculated using the actual cut weights, it was highly related to the estimate obtained if a fixed distribution was assumed for all carcasses. Cooking method only impacted the intercept for the calculation of eating quality scores, hence for each MSA cut, the most common cooking method was used for the calculation of the MSA Index.The MSA Index provides a useful feedback tool for producers on carcass quality. The weighted eating quality score for the 39 muscles in the carcass provides a single number for each carcass which allows producers to assess the impact of management, environmental and genetic changes on eating quality of the carcass calculated by the MSA beef grading model. By standardising the carcass suspension, ageing and ultimate pH of the carcass, the MSA Index is independent of variables that can be modified by processors and remain comparable across time periods, supply chains and processors. The MSA Index can also be utilised for benchmarking of eating quality and to monitor trends at farm, supply chain, state or national level.
Acknowledgements
This work was funded by Meat and Livestock Australia (PROJECT NO.B.SBP.0115). The NSW Department of Agriculture and Drs Linda Cafe, Malcolm McPhee and Brad Warmsley are thanked for access to steers from the high, low and myostatin muscling selection lines plus the primal CT data. Meat Standards Australia and their staff, Janine Lau, Greg Butler and Jessira Perovic are thanked for assistance in the boning procedure. Georgia Pugh from Murdoch University, Xuemei Han and Glen Bullock from University of New England, Haydn McKay and Elizabeth McClymount from Charles Stuart University, Joachim Breton from AgroParisTech, plus Judy Philpott from Polkinghornes Pty Ltd are thanked for their assistance with the bone-out and fabrication to MSA cuts and consumer samples.
Declaration of interest
There is no perceived conflicts of interest in this publication.
Ethics committee
Use of animals and the procedures performed in this study were approved by NSW DPI Orange Animal Ethics Committee (Approval number: ORA 11/14/009).
Software and data repository resources
None of the data were deposited in an official repository.





 Open access

